

SUMMARY
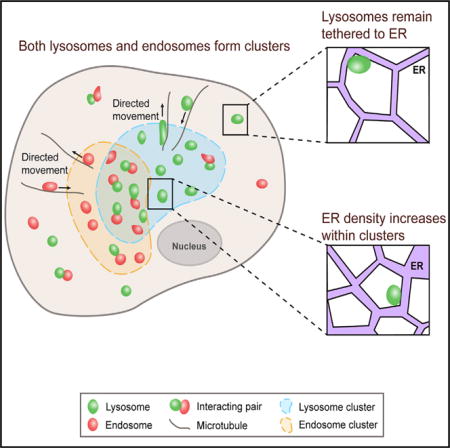
In eukaryotic cells, lysosomes are distributed in the cytoplasm as individual membrane-bound compartments to degrade macromolecules and to control cellular metabolism. A fundamental yet unanswered question is whether and, if so, how individual lysosomes are organized spatially to coordinate and integrate their functions. To address this question, we analyzed their collective behavior in cultured cells using spatial statistical techniques. We found that in single cells, lysosomes maintain non-random, stable, yet distinct spatial distributions mediated by the cytoskeleton, the endoplasmic reticulum (ER), and lysosomal biogenesis. Throughout the intracellular space, lysosomes form dynamic clusters that significantly increase their interactions with endosomes. Cluster formation is associated with local increases in ER spatial density but does not depend on fusion with endosomes or spatial exclusion by mitochondria. Taken together, our findings reveal whole-cell scale spatial organization of lysosomes and provide insights into how organelle interactions are mediated and regulated across the entire intracellular space.
Graphical abstract
In Brief Ba et al. use spatial statistical analysis to map the whole-cell scale dynamic organization of lysosomes. Lysosomes form dynamic clusters that significantly increase their interactions with endosomes. The formation of lysosomal clusters is associated with local increases in ER spatial density but does not depend on fusion with endosomes.
INTRODUCTION
A basic strategy used by eukaryotic cells to organize their internal environment is to form specialized membrane-bound organelles such as lysosomes and endosomes. Although this strategy provides important structural and functional benefits, specialized functions of the organelles must be coordinated and integrated for cell physiology (Gottschling and Nyström, 2017). Studies have shown that different organelles interact directly and extensively through mechanisms such as membrane contact (Prinz, 2014) and membrane fusion (Martens and McMahon, 2008). Such interactions depend critically on the colocalization and, therefore, the spatial distributions of the organelles. However, we cannot explain how the interactions are mediated and regulated at the systems level within the dynamic and heterogeneous intracellular space.
To address this deficiency, we focused specifically on the lysosome, an organelle that plays essential roles in important cellular functions, such as degrading macromolecules (Luzio et al., 2007) and controlling cellular metabolism (Lim and Zoncu, 2016; Settembre et al., 2013). Within the intracellular space, lysosomes are distributed as individual compartments, and individual lysosomes are limited in their own capacity. The size of a lysosome typically is limited to several hundred nanometers (Bandyopadhyay et al., 2014; Yu et al., 2010). The number of lysosomes in a mammalian cell typically is limited to several hundred (Valm et al., 2017). Furthermore, lysosomes are specialized compartments that depend on interactions with partner organelles to fulfill their functions (Bonifacino and Neefjes, 2017; Luzio et al., 2007). For example, they depend on fusion with endosomes and autophagosomes to receive and degrade materials from the endocytic and autophagic pathways, respectively (Eskelinen and Saftig, 2009; Luzio et al., 2007). Given the functional limitations of individual lysosomes, a fundamental yet unanswered question is whether and, if so, how individual lysosomes are organized in the intracellular space so that their functions can be coordinated and integrated to meet the changing needs of cells. Answering this question is key to elucidating how lysosomes function at the systems level in single cells.
Recent studies on the positioning of lysosomes (Bonifacino and Neefjes, 2017; Pu et al., 2016) have begun to reveal their spatial organization within the intracellular space. Positioning of individual lysosomes is mediated by mechanisms that include their active transport along microtubules and their interactions with the actin cytoskeleton and partner organelles, especially the ER (Bonifacino and Neefjes, 2017; Pu et al., 2016; Valm et al., 2017). Under normal conditions, lysosomes in non-polarized mammalian cells often cluster in a perinuclear region surrounding the microtubule-organizing center (MTOC), forming what is called the perinuclear cloud (Jongsma et al., 2016; Korolchuk et al., 2011; Pu et al., 2016), but they also spread into peripheral regions of cells, with some approaching the plasma membrane. This spatial pattern provides direct evidence for the spatial organization of individual lysosomes, and a wide variety of perturbations can change this pattern (Pu et al., 2016). For example, nutrient deprivation substantially increases the fraction of lysosomes clustering in the perinuclear region and decreases the fraction of lysosomes spreading into peripheral regions. Nutrient recovery reverses these changes and restores the usual pattern of lysosomal distribution (Korolchuk et al., 2011; Li et al., 2016). The relocation of lysosomes under these conditions is mediated by motor-mediated active transport along microtubules, and the underlying molecular machineries and mechanisms have begun to be elucidated (Korolchuk et al., 2011; Li et al., 2016; Pu et al., 2015). Functions of lysosomal positioning in mediating cellular nutrient response (Korolchuk et al., 2011) and regulating lysosomal degradative capacity (Johnson et al., 2016) also have begun to be elucidated. Despite these advances, related studies have a basic limitation in elucidating the spatial organization of lysosomes in that they lack quantitative and comprehensive characterization and analysis of the collective behavior of lysosomes, especially at the whole-cell scale.
That subcellular structures such as organelles and proteins exhibit defined spatial patterns has been noted in many studies (e.g., Boland and Murphy, 2001; Glory and Murphy, 2007; Valm et al., 2017). These patterns reflect the spatial organization of the subcellular structures and have been characterized and analyzed using pattern recognition and machine learning techniques (Boland and Murphy, 2001; Johnson et al., 2015). However, the specific modes, molecular mechanisms, and cellular functions of these patterns remain poorly understood.
In this study, we probed the spatial organization of lysosomes in cultured COS-7, U2OS, or BS-C-1 cells. Our overall strategy was to study the collective behavior of lysosomes, especially their spatial distributions at the whole-cell scale, using spatial statistical analysis techniques. Specifically, we treated the spatial distribution of lysosomes in a single cell mathematically as a spatial point process and analyzed it using related statistical techniques (Baddeley et al., 2016; Diggle, 2014; Illian et al., 2008). Our findings identified specific modes, molecular mechanisms, and cellular functions of the spatial organization of lysosomes at the whole-cell scale and provided insights into how cells organize their organelles and mediate their interactions.
RESULTS
Lysosomes Maintain Non-random, Stable, and yet Distinct Spatial Distributions in Single Cells
To investigate whether and, if so, how lysosomes are spatially organized, we analyzed their spatial distributions at the whole-cell scale in live BS-C-1 cells, chosen for their flat profiles to facilitate imaging. We labeled lysosomes using dextran Alexa Fluor 488 and a collected time-lapse videos at 4 frames per second for 1 min (Experimental Procedures; Figure 1A; Video S1). Because most of the lysosomes in single BS-C-1 cells resided in a single focal plane, we treated their spatial distributions as two dimensional for simplification. Within each cell we analyzed, we observed extensive movement of lysosomes throughout the intracellular space, with many traversing long distances for the duration of imaging (Figure 1B; Video S1). For each cell we analyzed, we detected individual lysosomes as single particles (Supplemental Experimental Procedures). We then considered their spatial distribution mathematically as a two-dimensional spatial point process and analyzed it using related spatial statistical techniques (Baddeley et al., 2016; Diggle, 2014; Illian et al., 2008). Specifically, we checked whether the lysosomes were randomly distributed by complete spatial randomness (CSR) tests (Supplemental Experimental Procedures) at different time points. We found that the spatial distribution of lysosomes differed substantially from a random distribution at all of the time points we analyzed (Figures 1C–1E), indicating that lysosomes are spatially organized at the whole-cell scale.
Figure 1. Lysosomes Maintain Non-random and Stable Spatial Distributions in a Single Cell.
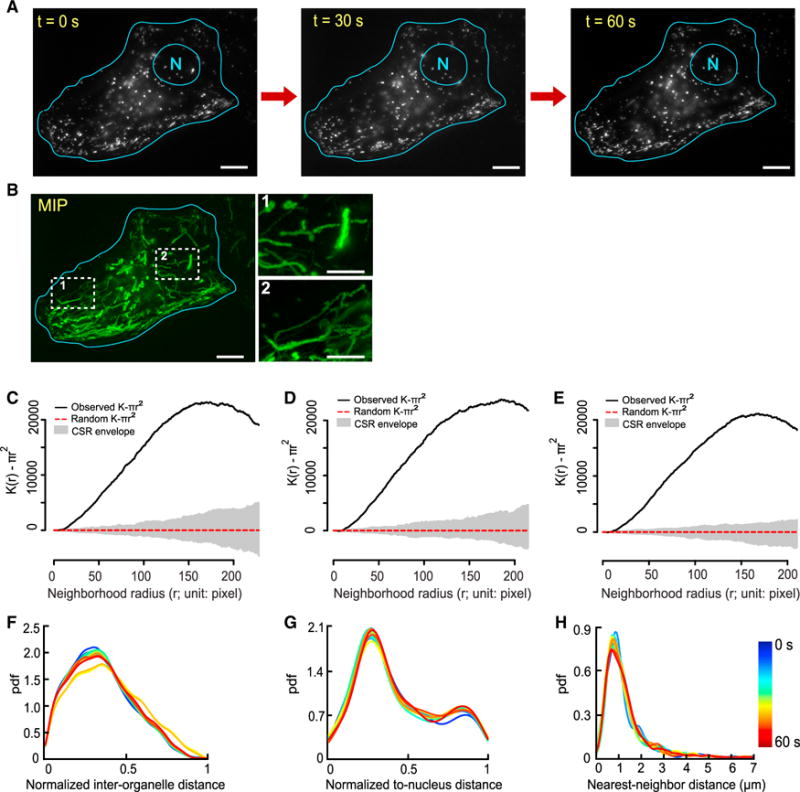
(A) Lysosomes in a BS-C-1 cell at three selected time points. N, nucleus. Scale bars, 10 μm.
(B) Maximum intensity projection (MIP; green) of lysosomal movement for 1 min, imaged at 4 frames per second. Each trace corresponds to the trajectory of a lysosome. Scale bar, 10 μm. Scale bars in insets, 5 μm.
(C–E) Complete spatial randomness (CSR) test of whole-cell scale lysosomal distribution at the three time points in (A). (C) 0 s; (D) 30 s; (E) 60 s. Adjusted Ripley’s K-function of lysosomes within the cell (solid black line). Adjusted Ripley’s K-function of a random distribution within the same cell boundary (dotted red line). Uncertainty envelope for the random distribution (gray area). The extent of separation between the solid black line and the CSR envelope indicates how close the spatial distribution of lysosomes is to a random distribution.
(F–H) Three distance distributions of lysosomes, color coded based on time and plotted every 5 s for 60 s. Their temporal variations were quantified using Sørensen dissimilarity scores. Because the distributions at 0, 5, 10, … 60 s were selected, 13 distributions were compared pairwise, hence pairs. pdf, probability density function. Temporal variations (means ± SDs; n = 78): (F) 3.29% ± 2.98%; (G) 2.65% ± 0.92%; (H) 5.80% ± 1.48%.
To quantitatively characterize the spatial distribution of lysosomes at the whole-cell scale, we used three statistical distance distributions (Figures S1A–S1C; Supplemental Experimental Procedures). We calculated these distributions every 5 s in each cell to examine their variations over time (Figures 1F–1H). First, we quantified the positioning of all of the lysosomes relative to one another in each cell using the distribution of their normalized pairwise distances (Figure S1A), referred to as the normalized inter-organelle distance distribution (Diggle, 2014). For the cell shown in Figures 1A and 1B, this distribution remained generally stable for the duration of imaging; the profile spread broadly but showed a characteristic peak spacing at ~0.35 (Figure 1F). The distributions in other cells that we analyzed showed similar stability and comparable but different profiles (Figures S1D, S1E, and S2A, blue lines). Second, we quantified the positioning of all of the lysosomes relative to the nucleus using the distribution of their normalized shortest distances to the nucleus (Figure S1B), referred to as the normalized to-nucleus distance distribution. For the cell shown in Figures 1A and 1B, this distribution also remained generally stable, but its profile showed two characteristic peak distances, at ~0.3 and ~0.9, respectively (Figure 1G). The distributions in other cells showed similarly stable but remarkably diverse profiles (Figures S1D, S1E, and S2B, blue lines). Third, we quantified the level of crowding of the lysosomes in each cell (i.e., how closely they are spaced) using the distribution of their nearest-neighbor distances (Figure S1C), referred to as the nearest-neighbor distance distribution (Baddeley et al., 2016; Diggle, 2014; Illian et al., 2008). For the cell shown in Figures 1A and 1B, this distribution also remained stable and showed a characteristic peak distance at ~1 μm (Figure 1H). The distributions in other cells showed similar stability and profiles (Figures S1D, S1E, and S2C, blue lines). Together, the three distance distributions provide a comprehensive characterization of the spatial distribution of lysosomes at the whole-cell scale.
We have noted that the three distance distributions remained generally stable for the duration of imaging in each cell that we analyzed. To characterize the stability of each distribution, we quantified its variations over time using the Sørensen dissimilarity score between its profiles at any two different time points (Supplemental Experimental Procedures). For the cell shown in Figures 1A and 1B, the average dissimilarity score was 3.29% for the normalized inter-organelle distance distribution, 2.65% for the normalized to-nucleus distance distribution, and 5.80% for the nearest-neighbor distance distribution (Figures 1F–1H). Examination of these distributions in different cells (Figures S1D and S1E) and for different durations of imaging (Figures S1F and S1G) found similarly low levels of variations. Lastly, we compared the three distance distributions of lysosomes in different cells (Figures S2A–S2C, blue lines) in a pairwise fashion (Supplemental Experimental Procedures). We found that the distributions differed significantly in all or most of the comparisons (Figure S2D, “unpatterned” columns). We checked and confirmed that the distinct spatial distributions of lysosomes in single cells were not merely a secondary effect of distinct cell shapes (Supplemental Experimental Procedures; Figure S2; Video S2). Taken together, our data show that although lysosomes undergo extensive long-distance movement across the entire intracellular space, they maintain non-random, stable, yet distinct spatial distribution in single cells. This reveals not only homeostasis in the positioning of lysosomes relative to one another and to the nucleus in the same cell but also heterogeneity in the positioning among different cells. This further indicates that lysosomes are spatially organized at the whole-cell scale.
Lysosomes in a Single Cell Form Different Subpopulations
Thus far we have focused on the spatial distribution of the entire population of lysosomes in single cells. However, it is clear even from a simple visual inspection that the population is heterogeneous in its dynamic behavior; while some lysosomes traverse long distances, others seem constrained in their movement (Figure 2A; Video S1). This raises the important question of how lysosomes with different behaviors together maintain the stable spatial distribution of their whole population. To answer this question, we first examined the composition of the lysosomal population in COS-7 cells by tracking individual lysosomes as single particles and characterizing their behavior through mean square displacement (MSD) analysis (Figures 2B and 2C) (Qian et al., 1991; Saxton, 1997). We found that on average, ~49% of lysosomes in a single cell underwent constrained diffusion, ~31% underwent directed movement, and ~20% underwent free diffusion (Figure 2C). This shows that most lysosomes undergo either constrained diffusion or directed movement, while only a small fraction undergoes free diffusion, which is consistent with the finding in previous studies that free diffusion is limited inside cells (Bandyopadhyay et al., 2014; Luby-Phelps et al., 1988).
Figure 2. Composition of the Lysosomal Population and Roles of Microtubule-Based Active Transport in Maintaining Its Stable Spatial Distribution.
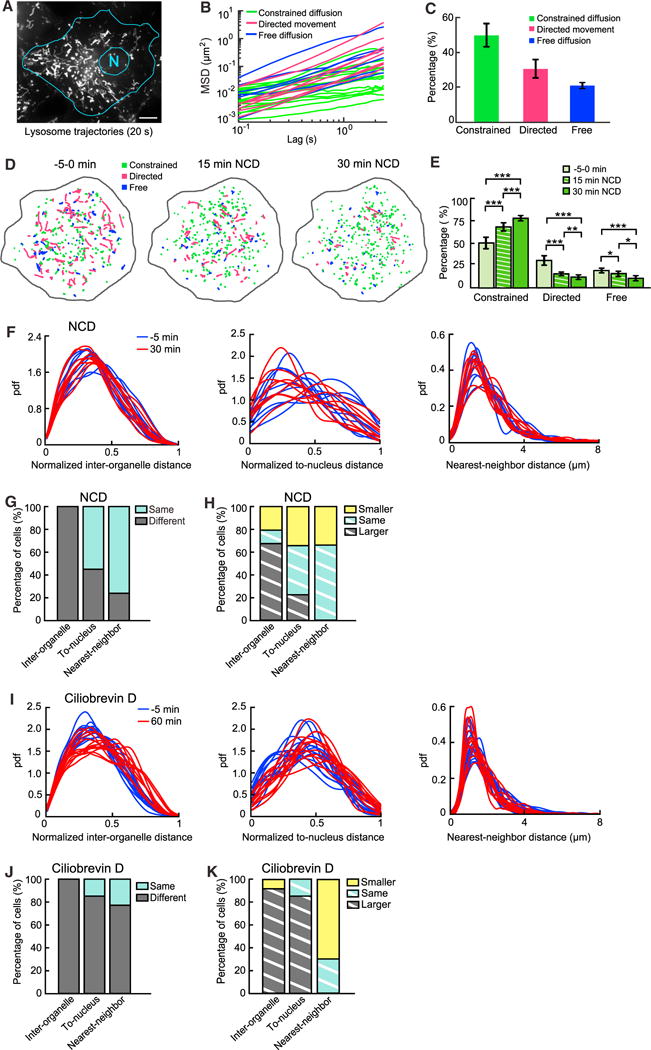
(A) Maximum intensity projection of movement of lysosomes in a COS-7 cell imaged at 10 frames per second for 20 s. Scale bar, 15 μm.
(B) MSD of randomly selected 10% of all lysosomal trajectories.
(C) Percentage of each subpopulation (means ± SDs; n = 9 cells): constrained: 49.41% ± 6.24%; directed: 30.94% ± 5.40%; free: 19.64% ± 2.19%. Error bars indicate SD.
(D) Color-coded trajectories of lysosomes at three time points in a cell treated with 2.5 μM nocodazole (NCD).
(E) Changes in lysosomal subpopulations under NCD treatment over time (means ± SDs; n = 9 cells). Constrained (0, 15, and 30 min): 49.41% ± 6.24%, 67.74% ± 4.17%, and 77.20% ± 3.32%, respectively. Directed (0, 15, and 30 min): 30.94% ± 5.40%, 16.77% ± 2.05%, and 11.71% ± 2.48%, respectively. Free (0, 15, and 30 min): 19.65% ± 2.19%, 15.49% ± 3.32%, and 11.05% ± 3.80%, respectively. Comparison of pooled data from the same cells before and after NCD treatment. p values (0 min versus 15 min, 0 min versus 30 min, and 15 min versus 30 min): constrained: 1.8 × 10⁻⁴, 9.6 × 10⁻⁶, and 8.1 × 10⁻⁴, respectively; directed: 2.7 × 10⁻⁵, 3.2 × 10⁻⁵, and 2.0 × 10⁻³, respectively; free: 2.6 × 10⁻², 7.3 × 10⁻⁵, and 1.3 × 10⁻², respectively. *p < 0.05; **p < 0.01; ***p < 0.001. Error bars indicate SD.
(F) The three distance distributions before and after 30 min of NCD treatment in 9 different cells.
(G) Comparison of different distance distributions of lysosomes before versus after NCD treatment. Cutoff p value for statistical significance: 0.05. Inter-organelle (same, different): 0%, 100%, respectively; to-nucleus: 55.5%, 44.4%, respectively; and nearest-neighbor: 77.8%, 22.2%, respectively.
(H) Comparison of median distances before versus after NCD treatment. Inter-organelle (smaller, same, and larger): 22.2%, 11.1%, and 66.7%, respectively; To-nucleus: 33.3%, 44.4%, and 22.2%, respectively; and nearest-neighbor: 33.3%, 66.7%, and 0%, respectively.
(I) The three distance distributions before and after 1 hr of ciliobrevin D (80 μM) treatment in 13 different cells.
(J) Comparison of three distance distributions before versus after ciliobrevin D treatment of the same cells: Inter-organelle (same, different): 0%, 100%, respectively; to-nucleus: 15.4%, 84.6%, respectively; and nearest-neighbor: 23.1%, 76.9%, respectively.
(K) Comparison of median distances before versus after ciliobrevin D treatment. Inter-organelle (smaller, same, larger) 7.7%, 0%, 92.3%, respectively; To-nucleus: 0%, 15.4%, 84.6%, respectively; Nearest-neighbor: 69.2%, 30.8%, 0%, respectively.
Sustained and Balanced Transport along Microtubules Is Required to Maintain Population Composition and Spatial Distributions of Lysosomes
After determining the composition of the lysosomal population, we investigated its relation to microtubule-based active transport. To this end, we depolymerized the microtubule cytoskeleton by treating COS-7 cells with 2.5 μM of nocodazole. After 30 min of treatment, the fraction of lysosomes undergoing directed movement was reduced significantly, from 31% to 12%. The fraction of lysosomes undergoing constrained diffusion was increased significantly, from 49% to 77%. The fraction of lysosomes undergoing free diffusion was reduced significantly, from 20% to 11% (Figures 2D and 2E). This shows that sustained microtubule-based transport is required to maintain the population composition of lysosomes.
Because microtubule-based active transport is crucial to the positioning and relocation of lysosomes (Bonifacino and Neefjes, 2017; Pu et al., 2016), we reason that it should play an important role in maintaining the stable spatial distributions of lysosomes. To test this hypothesis, we compared the three distance distributions of the lysosomes right before and 30 min after the nocodazole treatment (Figure 2F). We found that although inhibition of the transport caused significant changes in the normalized inter-organelle distance distribution in all of the cells we analyzed (Figure 2G), it did not consistently decrease or increase the median distance (Figure 2H). The normalized to-nucleus distance distribution remained unchanged in ~56% of the cells (Figure 2G), and inhibition of the transport did not consistently decrease or increase its median distance (Figure 2H). Furthermore, the nearest-neighbor distance distribution and its median remained unchanged in the majority of the cells (Figures 2G and 2H), indicating that microtubule-based transport does not play a major role in maintaining the crowding of lysosomes.
We hypothesize that the lack of consistent changes in the median normalized inter-organelle distance and the median normalized to-nucleus distance after nocodazole treatment is because the centrifugal transport and centripetal transport of the lysosomal population are balanced. Abolishing the entire transport process by nocodazole treatment would not shift the balance consistently in either direction. To test this hypothesis, we treated the cells (plural form) with dynein inhibitor ciliobrevin D (Firestone et al., 2012), which disrupts primarily the centripetal movement and shifts the balance toward the centrifugal movement. We found that inhibiting dynein-mediated transport caused significant changes in the three distance distributions in all or most of the cells analyzed (Figures 2I–2K). It also consistently increased the median normalized to-nucleus distance and the median normalized inter-organelle distance in most of the cells and decreased the median nearest-neighbor distance in the majority of cells (Figures 2I–2K). Taken together, our findings indicate that the balance between centrifugal and centripetal transport is required to maintain stable spatial distributions of lysosomes. Because of this balance, lysosomes can undergo long-distance transport without affecting their overall stable spatial distributions at the whole-cell scale.
Interaction with the Actin Cytoskeleton Is Required to Constrain Diffusion of Lysosomes and to Maintain Their Positioning Relative to One Another
We have shown that microtubule-based transport is required to maintain the lysosomal subpopulation undergoing directed movement. This raises the question of what maintains the sub-population undergoing constrained diffusion. Interaction of lysosomes with the actin cytoskeleton plays an important role in mediating their positioning (Bonifacino and Neefjes, 2017; Pu et al., 2016). In particular, interaction with the cortical actin network has been shown to transiently constrain lysosomes near the cell periphery (Caviston et al., 2011; Encarnação et al., 2016). We hypothesize that interaction with the actin cytoskeleton is required for maintaining the subpopulation of lysosomes undergoing constrained diffusion.
To test this hypothesis, we depolymerized the actin cytoskeleton by treating cells with 0.8 μM latrunculin A (latA). We confirmed the effectiveness of the treatment based on the changes in cell shapes (Figure S3A) and the reduction of polymerized actin levels (Figures S3B and S3C). To avoid complications in result interpretation, we chose to analyze cells without substantial changes in their shapes. To determine how depolymerization of the actin cytoskeleton affected the three lysosomal subpopulations, we compared their mean displacement in 5 s immediately before the treatment and 15–16 min after the treatment (Figures 3A and 3B). We observed significant increases in mean displacements of all three subpopulations (Figures 3B and S3D). Despite these significant changes, the fractions of lysosomes undergoing constrained diffusion and directed movement were changed only slightly, from 42.1% to 38.9% and from 37.5% to 39.3%, respectively (Figure 3C). The fraction of lysosomes undergoing free diffusion remained unchanged (Figure 3C). Taken together, our data show that although the actin cytoskeleton constrains diffusion and directed movement of lysosomes, it plays only a minor role in maintaining the population composition of lysosomes.
Figure 3. Roles of Interaction with the Actin Cytoskeleton and Lysosomal Biogenesis in Maintaining Subpopulations and Spatial Distributions of Lysosomes.
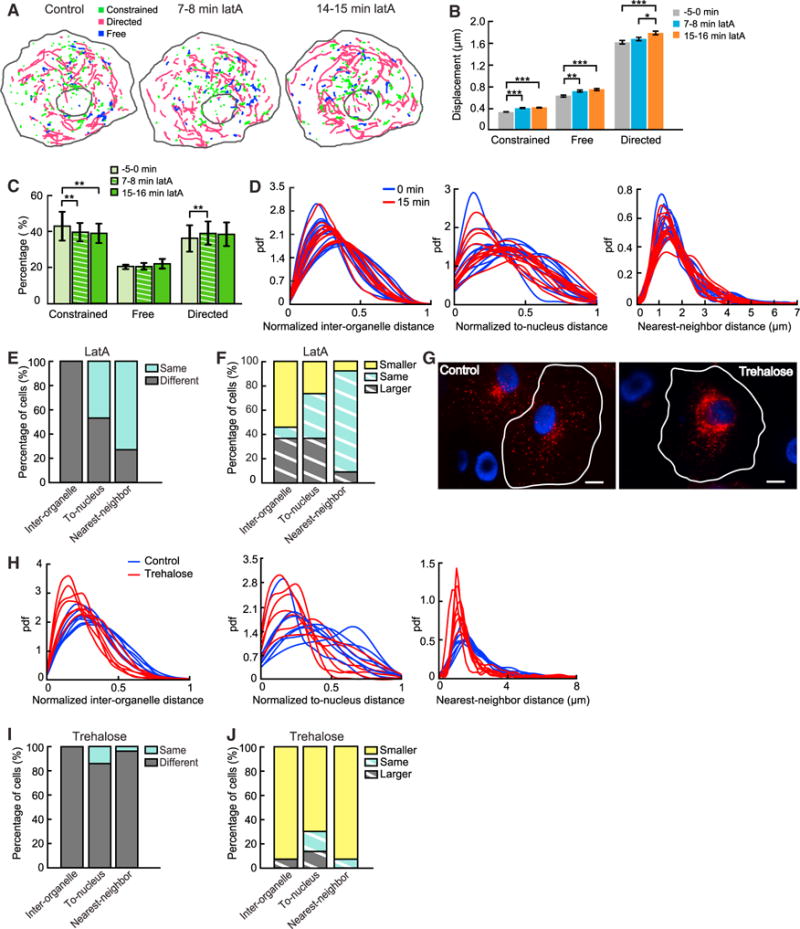
(A) Color-coded trajectories of lysosomes in COS-7 cells treated with 0.8 μM latA. Videos were collected at 10 frames per second for 20 s.
(B) Changes in the displacement for 5 s of the three subpopulations under latA treatment. Comparison of pooled data from the same 11 cells before and after treatment. Constrained diffusion: 0.32 ± 0.0058 μm (mean ± SEM; 0 min, n = 2,052 trajectories), 0.39 ± 0.0076 μm (7.5 min, n = 1,821), and 0.41 ± 0.0075 μm (15 min, n = 1,747). Free diffusion: 0.57 ± 0.019 μm (0 min, n = 688 trajectories), 0.66 ± 0.020 μm (7.5 min, n = 633), and 0.68 ± 0.019 μm (15 min, n = 675). Directed movement: 1.61 ± 0.031 μm (0 min, n = 1,757 trajectories), 1.67 ± 0.031 μm (7.5 min, n = 1,833), and 1.78 ± 0.032 μm (15 min, n = 1,713). p values (0 min versus 7.5 min, 0 min versus 15 min, and 7.5 min versus 15 min): constrained diffusion: 1.2 × 10⁻¹⁴, 1.9 × 10⁻²², and 0.083, respectively; free diffusion: 2.1 × 10⁻³, 3.6 × 10⁻⁵, and 0.32, respectively; directed movement: 0.17, 1.6 × 10⁻⁴, and 0.014, respectively. Error bars indicate SEM.
(C) Changes in the three subpopulations under latA treatment over time (means ± SDs; n = 11 cells). Constrained (0, 7.5, and 15 min): 42.14% ± 6.90%, 39.34% ± 5.09%, and 38.96% ± 5.60%, respectively. Free: 20.34% ± 1.31%, 20.41% ± 1.68%, and 21.74% ± 2.51%, respectively. Directed: 37.52% ± 7.02%, 40.25% ± 6.00%, and 39.30% ± 6.20%, respectively. p values (0 min versus 7.5 min, 0 min versus 15 min, and 7.5 min versus 15 min): constrained: 0.0058, 0.0053, and 0.49, respectively; free: 0.98, 0.15, and 0.22, respectively; directed: 0.0043, 0.10, and 0.61, respectively. Error bars indicate SD.
(D) The three distance distributions before and 15 min after latA treatment in 11 cells.
(E) Comparison of distributions before and after latA treatment (n = 55 pairs). Inter-organelle (same, different): 0%, 100%, respectively; to-nucleus: 45.5%, 54.5%, respectively; nearest-neighbor: 72.7%, 27.3%, respectively.
(F) Comparison of median distances before and after latA treatment (n = 55 pairs). Inter-organelle (smaller, same, and larger): 54.5%, 9.1%, and 36.4%, respectively; to-nucleus: 27.3%, 36.4%, and 36.4%, respectively; nearest-neighbor: 9.1%, 81.8%, and 9.1%, respectively.
(G) Comparison of lysosomal spatial distributions in a control cell (left) versus a cell treated with trehalose (right; 50 mM, 12 hr). Lysosomes (red); nuclei (blue). Scale bars, 15 μm.
(H) The three distance distributions in control cells (n = 7) versus trehalose-treated cells (12 hr, 7 cells).
(I) Comparison of distributions in control cells versus cells treated with trehalose (n = 49 pairs). Inter-organelle (same, different): 0%, 100%, respectively; to-nucleus: 14.3%, 85.7%, respectively; nearest-neighbor: 2.1%, 97.9%, respectively.
(J) Comparison of median distances in control cells versus cells treated with trehalose (n = 49 pairs). Inter-organelle (smaller, same, and larger): 91.8%, 0%, and 8.2%, respectively; to-nucleus: 69.4%, 16.3%, and 14.3%, respectively; nearest-neighbor: 91.8%, 8.2%, and 0%, respectively.
Next, we investigated the role of the actin cytoskeleton in maintaining the spatial distribution of lysosomes. To this end, we compared the three distance distributions of lysosomes right before and 15–16 min after the latA treatment (Figure 3D). We found that depolymerization of the actin cytoskeleton caused significant changes in the normalized interorganelle distance distribution, the normalized to-nucleus distance distribution, and the nearest-neighbor distance distribution in 100%, ~55%, and ~25% of the cells, respectively (Figure 3E). In addition, we found that depolymerization of the actin cytoskeleton did not result in a consistent increase or decrease in the median distances of lysosomes relative to one another and to the cell nucleus (Figure 3F). The median nearest-neighbor distance was unchanged in most of the cells (Figure 3F). We reason that this is because interaction with the actin cytoskeleton does not alter the balance between the centrifugal and the centripetal transport of lysosomes. Taken together, our results indicate that interaction with the actin cytoskeleton is required to maintain the positioning of lysosomes relative to one another but plays a minor role in maintaining their positioning relative to the nucleus and their crowding.
A Stable Level of Lysosomal Biogenesis Is Required to Maintain a Stable Spatial Distribution of Lysosomes
We have thus far investigated the roles of the cytoskeleton in mediating the population composition and spatial distributions of lysosomes. Upregulation or downregulation of lysosomal biogenesis also can cause substantial changes in the spatial distribution of lysosomes (Jongsma et al., 2016; Korolchuk et al., 2011; Pu et al., 2016; Sardiello et al., 2009), but such changes have not been quantitatively characterized at the whole-cell scale. To investigate how an altered level of lysosomal biogenesis may influence the stable spatial distributions of lysosomes, we treated COS-7 cells with 50 mM trehalose (Sarkar et al., 2007), which activates TFEB, the master regulator of lysosomal biogenesis (Sardiello et al., 2009; Settembre et al., 2011). We found that trehalose treatment substantially increased the fraction of lysosomes clustering in the perinuclear region (Figure 3G) and significantly decreased the distances between lysosomes and between lysosomes and the cell nucleus (Figures 3H–3J), in agreement with the observations of previous studies (Sardiello et al., 2009; Settembre et al., 2011). In addition, the treatment significantly increased crowding of lysosomes as the median nearest-neighbor distance was reduced by ~29%, substantially stronger in effect than the perturbations to the cytoskeleton analyzed previously (Figures 2F, 2I, and 3D). Treatment of COS-7 cells with 2 μM torin 1, a potent and selective ATP-competitive inhibitor of mechanistic target of rapamycin (mTOR) (Thoreen et al., 2009), also substantially increased the fraction of lysosomes clustering in the perinuclear region (Figures S4A–S4C) and the localization of TFEB to the nucleus (Figures S4D and S4E). The distances between lysosomes and between lysosomes and the cell nucleus were significantly decreased in ~50% of the comparisons (Figures S4F, S4G, S4I, and S4J), similar to those under trehalose treatment. However, the median nearest-neighbor distance was increased by 36% (Figures S4H–S4J). Together, these results show that a stable level of lysosomal biogenesis is required to maintain a stable spatial distribution of lysosomes and that different perturbations of lysosomal biogenesis by trehalose and torin 1 treatment lead to differential changes in spatial distributions of lysosomes.
Lysosomes Form Dynamic Clusters throughout the Intracellular Space
We have shown that lysosomes are spatially organized at the whole-cell scale because their spatial distributions are nonrandom, stable, yet distinct in single cells. Here, we further investigate how they are organized spatially. A common pattern in the spatial distributions of lysosomes is their clustering in the perinuclear region (Jongsma et al., 2016; Korolchuk et al., 2011; Pu et al., 2016), defined by their substantially higher spatial density than in neighboring areas. This raises the question of whether lysosomes cluster in other intracellular regions. To answer this question, we plotted their spatial density across the entire intracellular space (Figures 4A and 4B; Supplemental Experimental Procedures). The plots revealed that lysosomes formed clusters throughout the intracellular space, which could be identified visually by their elevated spatial densities (Figures 4A and 4B; Video S3). To identify these clusters computationally, we used the Density-Based Spatial Clustering of Applications with Noise (DBSCAN) algorithm (Ester et al., 1996) (Supplemental Experimental Procedures). We found that lysosomal clusters were dynamic and underwent turnover activities such as merging, splitting, appearance, and disappearance (Figures 4C and S5A).
Figure 4. Lysosomes Form Dynamic Clusters throughout the Intracellular Space.
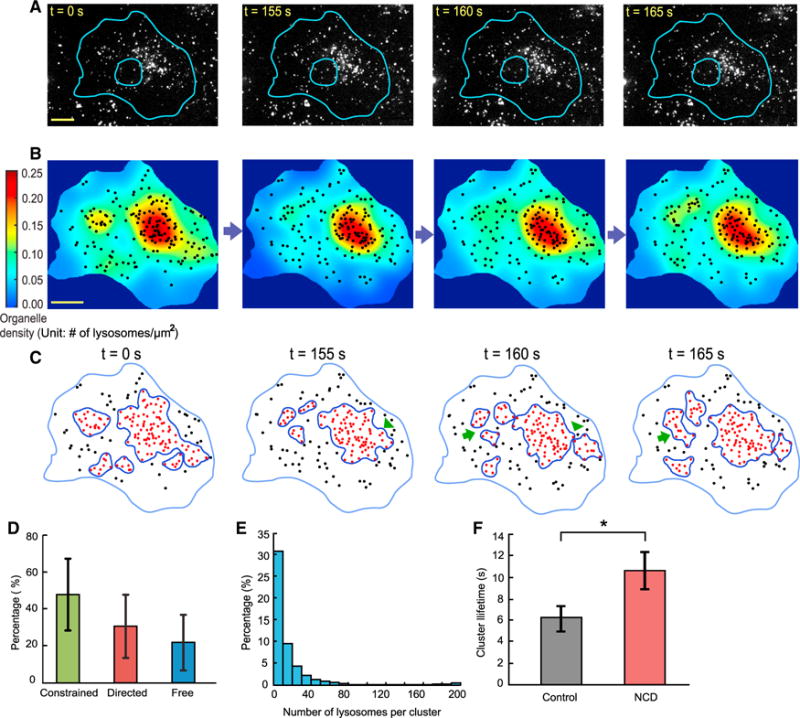
(A) Selected frames from a time-lapse video of lysosomes in a COS-7 cell. Scale bar, 20 μm.
(B) Color-coded spatial density plots of lysosomes calculated for the frames shown in (A). Scale bar, 20 μm.
(C) Clusters of lysosomes identified computationally by DBSCAN. Arrowheads point to cluster-splitting sites. Arrows point to cluster-merging sites.
(D) Composition of clusters, calculated for each cluster and then pooled for analysis. Constrained diffusion 47.9% ± 19.7%; directed movement, 30.6% ± 17.7%; free diffusion, 21.5% ± 14.9% (means ± SDs; n = 376 clusters from 9 cells, within 5 frames randomly selected from each cell). Error bars indicate SD.
(E) Size distribution of clusters, measured by their numbers of lysosomes. Same clusters from the same cells as those in (D). The average number of lysosomes was 15.4 ± 1.3 per cluster (means ± SEMs; n = 376 clusters from 9 cells). The median number of lysosomes was 8.
(F) Lifetime of large clusters with >10 lysosomes in the same cells before and after NCD treatment, as shown in Figure 2D. Before NCD treatment, 6.14 ± 1.22 s (mean ± SEM; n = 34 clusters from 8 cells); after NCD treatment, 10.69 ± 1.76 s (mean ± SEM; n = 24 clusters from 8 cells); p = 0.013. Error bars indicate SEM.
To quantitatively characterize the lysosomal clusters, we first examined their composition and found that on average, 47.9% of their members underwent constrained diffusion, 30.6% underwent directed movement, and 21.5% underwent free diffusion (Figure 4D), consistent with the composition of the entire lysosome population (Figure 2C) but more heterogeneous given its larger variations (Figure 4D). We then quantified the sizes of the clusters by their numbers of lysosomes and areas. We found that the median number of lysosomes of the clusters was 8, with the maximum reaching ~200 (Figure 4E). The median area of the clusters was 13.3 μm2, with the maximum reaching ~1,084 μm2 (Figure S5B). Lastly, we examined the lifetime of the clusters by following randomly selected clusters over time. We found that the average lifetime of the clusters was 10.9 ± 1.3 s (mean ± SEM; n = 30 clusters from 9 cells), with the maximum reaching ~20 s.
To determine the mechanisms underlying the formation and dynamic turnover of lysosomal clusters, we combined single-particle tracking analysis (Figures 2B and 2C) with clustering analysis (Figure S5C; Video S4). We found that the de novo formation of a new cluster at a certain location was mediated jointly by incoming lysosomes undergoing either directed movement or free diffusion with lysosomes undergoing constrained diffusions at the location (Figure S5C; Video S4). This finding is consistent with the measured properties of the clusters. The mean lifetime of a cluster is ~11 s. Within this time interval, the mean displacement of a lysosome undergoing constrained diffusion is <0.5 μm. Because the median diameter of a cluster is 4.23 μm (Figure S5B), formation of a new cluster requires long-range inward transport of lysosomes undergoing either directed movement or free diffusion (Figure S5C). Because only a small fraction of lysosomes undergoes free diffusion (Figure 2C), we conclude that cluster formation is mediated primarily by incoming lysosomes undergoing directed movement together with local lysosomes undergoing constrained diffusion. Our single-particle tracking provided no evidence that newly synthesized lysosomes appeared in the clustering region. Consistent with our finding on cluster formation, we found that dynamic turnovers of lysosomal clusters were mediated primarily by long-range movements of lysosomes, especially those undergoing directed movement. To further test this finding, we compared the lifetime of clusters in control cells versus cells treated with nocodazole. We found a significant increase in their mean lifetime by ~73% (Figure 4F), which supports our finding.
Formation of Lysosomal Clusters Is Associated with Local and Significant Increases in ER Spatial Density
A substantial fraction of lysosomes remained constrained in their diffusion after depolymerization of the actin network (Figure 3C). This indicates that other mechanisms contribute to the constraining of lysosomal diffusion. Because the ER network extends throughout the intracellular space and interacts with lysosomes (Bonifacino and Neefjes, 2017; Pu et al., 2016; Valm et al., 2017), we hypothesize that it constrains lysosomal diffusion. To test this hypothesis, we imaged ER and lysosomes simultaneously (Figure 5A; Supplemental Experimental Procedures). Consistent with previous reports (Friedman et al., 2013; Raiborg et al., 2015; Valm et al., 2017), we found that lysosomes remained constantly tethered to ER (Figure 5A; Video S5). Lysosomes confined to the ER network exhibited a variety of behaviors, including directed movement along ER tubules (Figures 5A and 5B), constrained diffusion (Figures 5A and 5C), or association with the tips of growing ER tubules (Figure 5A). Consistent with findings by Valm et al. (2017), some lysosomes exhibited free diffusion while confined by ER (Figure 5D).
Figure 5. Formation of Lysosomal Clusters Is Associated with Local Increases in ER Spatial Density but Does Not Depend on Spatial Exclusion by Mitochondria.
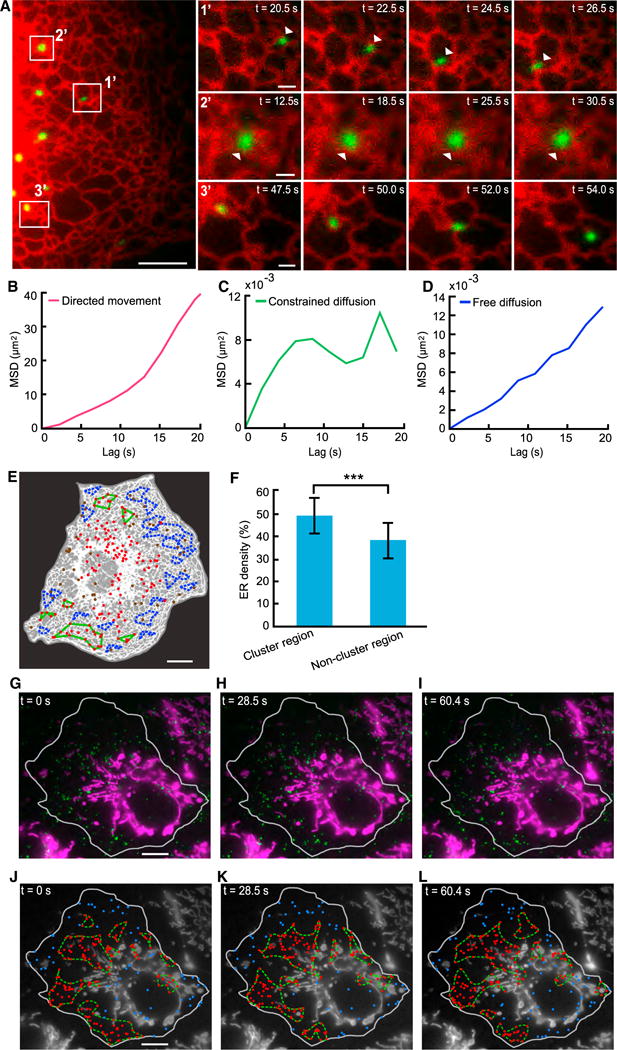
(A) Lysosomes remain tethered to the ER network. Left: a selected frame from a time-lapse video of a COS-7 cell in which ER and lysosomes were labeled. Right: zoomed-in views of selected frames of lysosomes in the rectangles. 1′: a lysosome undergoing directed movement. 2′: a lysosome undergoing constrained diffusion. 3′: a lysosome undergoing directed movement at the tip of a growing ER tubule. Scale bars, 5 μm (left), 1 μm (right).
(B) MSD analysis of the lysosome in panel 1′ of (A).
(C) MSD analysis of the lysosome in panel 2′ of (A).
(D) MSD analysis of a lysosome undergoing free diffusion (image not shown).
(E) Comparing ER spatial densities in clustered regions versus non-clustered regions. Segmented ER shown in white and background in gray. Lysosomes in clusters (red dots).Lysosomes not in any cluster (brown dots). Selected clusters for analysis (green contours). Randomly selected non-cluster regions with the same shape as a cluster (blue dash contours). Scale bar, 10 μm.
(F) Comparison of ER densities in cluster regions versus non-cluster regions. Cluster regions: 47.5% ± 7.6% (mean ± SD; n = 31 regions from 3 cells); non-cluster regions: 36.9% ± 9.0% (mean ± SD; n = 116 regions from 3 cells); p = 1.2 × 10⁻⁸. Error bars indicate SD.
(G–I) Selected frames at 0s (G), 28.5s (H), and 60.4s (I), from a time-lapse video of a COS-7 cell in which mitochondria and lysosomes were labeled. Scale bar, 10 μm.
(J–L) Lysosomal clusters and their spatial relations with mitochondria (shown in grayscale) 0s (J), 28.5s (K), and 60.4s (L). Lysosomes in clusters (red dots). Lysosomes not in any cluster (blue dots). Lysosome cluster boundaries (green dashed contours). Scale bar, 10 μm.
Given that lysosomes remain constantly tethered to the ER network, we probed its role in lysosomal cluster formation by comparing its spatial density within the clusters versus within non-cluster regions (Figure 5E; Supplemental Experimental Procedures). We found that the formation of the clusters is associated with local and significant increases in ER density within the clusters (Figure 5F), indicating that the ER may play a direct role in mediating cluster formation.
Formation of Lysosomal Clusters Does Not Depend on Spatial Exclusion or Restriction by Mitochondria
Mitochondria occupy a substantial fraction of the intracellular space in many cell types. For example, ~22% of the volume of a liver cell is occupied by mitochondria (Alberts et al., 2014). Within the intracellular space, mitochondria often form aggregates, which can exclude and restrict lysosomes spatially. This raises the question of whether clustering of lysosomes is merely a secondary outcome of the cellular crowding of mitochondria and their spatial exclusion and restriction of lysosomes. To address this question, we imaged mitochondria and lysosomes simultaneously in COS-7 cells and examined their spatial relations (Figures 5G–5I). In regions not occupied by mitochondria, we frequently observed formation, turnover, and dispersion of lysosomal clusters (Figures 5J–5L; Video S6). This indicates that spatial exclusion or restriction of lysosomes by mitochondria is not a necessary condition for lysosomal clustering. In regions that are densely occupied by mitochondria, such as the perinuclear region, some lysosomes appeared to be excluded or constrained in their movement by surrounding mitochondria, but many others did not appear to be affected because their movement showed no apparent correlation with the movement of mitochondria in close proximity (Video S6). This is not surprising, given that the movement of lysosomes is confined by the ER network. In those regions that are densely occupied by mitochondria, clusters of lysosomes were frequently observed, many undergoing dynamic changes without apparent correlation with the movement of neighboring mitochondria (Video S6). Taken together, these results indicate that the clustering of lysosomes does not depend on their spatial exclusion or restriction by mitochondria and therefore is not merely a secondary outcome, even though the spatial exclusion or restriction may contribute to the clustering.
Clustering of Lysosomes Significantly Increases Their Interaction with Late Endosomes
That lysosomes form dynamic clusters throughout the intracellular space raises the important question of what cellular functions these clusters may serve. Previous studies have assumed that the clustering of lysosomes in the perinuclear region when cells are under stress promotes their interactions with partner organelles such as autophagosomes (Jongsma et al., 2016; Korolchuk et al., 2011; Pu et al., 2016), but this assumption has not been directly tested. Here, we make a similar hypothesis, namely under normal conditions, that clusters of lysosomes throughout the intracellular space increase interactions of lysosomes with partner organelles because of their increased lysosomal spatial density. To directly test this hypothesis, we imaged lysosomes and late endosomes concurrently at approximately 5 s per frame for 5 min (Figure 6A; Video S7) and then analyzed their interactions. First, we confirmed that our experimental assay could reliably differentiate between lysosomes and late endosomes (Figure S6A; Supplemental Experimental Procedures). Then, we developed a computational method that identifies pairs of lysosomes and endosomes with a high likelihood of interacting with one another. Specifically, we identified a lysosome and an endosome as an interacting pair if they maintained a center distance below a threshold ranging from 400–800 nm for at least 25 s (Figure 6B; Supplemental Experimental Procedures). Under the selected distance threshold and time threshold, we estimated that >80% of the detected interacting lysosome-endosome pairs had a spatial overlap of their fluorescence signals during most (>80%) of the time that they stayed within the threshold distance (Figures S6B–S6F). Using our computational method, we counted interacting lysosome-endosome pairs in each cell and identified 26–117 pairs on average per cell in 5 min (Figure 6E). To examine the persistence of these candidate pairs, we calculated the time in which the pairs stayed within the distance threshold. We found that ~33% of the pairs stayed for >1 min (Figure 6F).
Figure 6. Clustering of Lysosomes Increases Their Interaction with Late Endosomes.
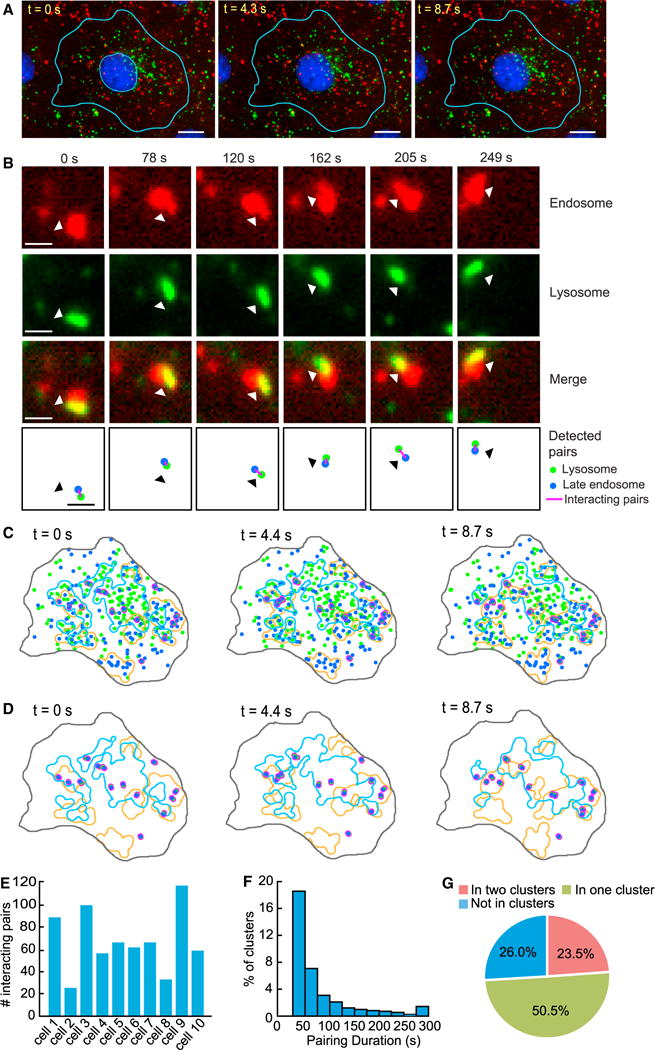
(A) Selected frames from a time-lapse video of a COS-7 cell in which lysosomes (green) and late endosomes (red) were labeled. Scale bars, 15 μm.
(B) An example of a computationally detected interacting lysosome-endosome pair that remained together for >4 min. Top three rows: the actual fluorescence signals. Bottom row: computational detection result. Scale bars, 1 μm.
(C) Clusters of late endosomes and lysosomes detected from the video in (A). Interacting lysosome-endosome pairs (magenta). Lysosome (green). Late endosome (blue). Lysosome cluster boundaries (light blue lines). Endosome cluster boundaries (orange lines).
(D) Same as (E) but showing only the clusters and detected lysosome-endosome pairs.
(E) Number of detected interacting lysosome-endosome pairs in 10 cells within 5 min: 89, 26, 101, 54, 64, 61, 63, 32, 117, and 58.
(F) Histogram of the duration of the detected interacting pairs staying together.
(G) Relation between the location of interacting pairs and the clusters of endosomes and lysosomes.
We then investigated the relations between the clusters of lysosomes and endosomes and the detected lysosome-endosome pairs. First, we identified clusters of lysosomes and clusters of endosomes, respectively (Figure 6C). Then, we checked the distribution of the interacting lysosome-endosome pairs within and outside the clusters (Figure 6D). We found that 23.5% of the interacting pairs resided within areas in which lysosome clusters overlapped with endosome clusters (Figure 6G); 50.5% of the interacting pairs resided in either a lysosomal cluster or an endosomal cluster. In total, 74% of the interacting pairs were associated with at least one cluster. In comparison, 26.0% of the interacting pairs were not within any clusters. Furthermore, we found that within 5 min, 12.7% ± 1.34% (mean ± SEM; n = 10 cells) of lysosomes inside clusters formed pairs with endosomes, while only 6.5% ± 0.97% (mean ± SEM; n = 10 cells) of lysosomes outside clusters formed pairs with endosomes, indicating that pairs were preferentially formed by lysosomes inside clusters (one-tailed t test; p = 0.0009). To further understand the behavior of the computationally detected interacting lysosome-endosome pairs, we studied their activities visually. As an example, we found that a pair stayed together for 566 s to complete their fusion (Figures 7A and 7B), which is consistent with the duration of fusion events reported in a previous study (Bright et al., 2005). Their fusion was confirmed based on their content exchange, as indicated by the fluorescence signals (Figures 7A and 7B).
Figure 7. Tracking of Fusion between Lysosomes and Endosomes and a Model of Lysosomal Clustering.
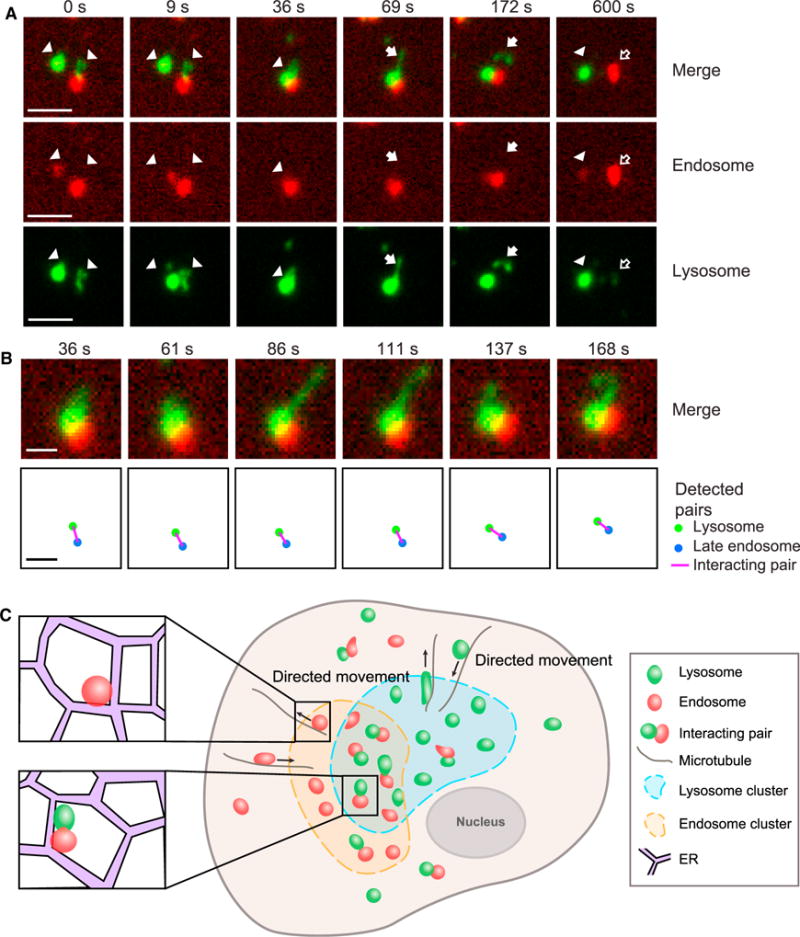
(A) An example of lysosome-endosome fusion in a COS-7 cell. At 0–9 s, two lysosomes (arrowheads) moved close to an endosome. At 36 s, the three organelles overlapped with one another in their fluorescence signals, presumably undergoing fusion or partial content exchange. This was followed by the formation of a new lysosome at 69–157 s, indicated by arrows. At 600 s, separation and content exchange were evident, given that the lysosome content (green fluorescence) was present in the endosome (hollow arrows) and vice versa. Lysosome (arrowheads). A newly formed lysosome (solid arrows). An endosome that gained lysosomal content (hollow arrows). Scale bar, 2.5 μm.
(B) Computational detection of lysosome-endosome interaction in the example shown in (A). (Upper row) The actual lysosome-endosome pair. (Bottom row) Computational detection results. Frame rate during imaging: 4.2 s per frame. Scale bars, 1 μm.
(C) Our active transport-mediated clustering model.
Thus far, we have shown that clustering of lysosomes and endosomes are correlated with their significantly increased interactions. Given that lysosomes fuse with late endosomes, the clustering may be a secondary effect of the fusion, or, alternatively, the clustering promotes interactions such as fusion between lysosomes and endosomes. To differentiate between these two possibilities, we blocked the fusion of lysosomes with late endosomes using two strategies. First, we blocked the fusion by knocking down the hVps39 subunit of the HOPS complex (Supplemental Experimental Procedures), which has been shown to mediate the interactions between lysosomes and late endosomes (Pols et al., 2013; Wartosch et al., 2015). Second, we treated the cells with 1,2-bis(2-aminophenoxy) ethane-N,N,N′,N′-tetraacetic acid tetrakis(acetoxymethyl ester) (BAPTA-AM) (Figure S7A), a calcium chelator that has been shown to inhibit the delivery of endocytosed lipid cargo into lysosomes via the fusion of late endosome and lysosomes (Miedel et al., 2008). In both cases, we found no change in either the average number of lysosomes or area per cluster in U2OS cells (Figures S7B–S7E). Taken together, these results indicate that the clustering of lysosomes is not merely a secondary effect of their fusion with late endosomes. We therefore conclude that the clustering of lysosomes significantly increases their interactions with endosomes.
DISCUSSION
The clustering of lysosomes in the perinuclear region has been noted from early studies of lysosomal motility and positioning (e.g., Matteoni and Kreis, 1987). However, the predominant view remains that individual lysosomes act independently and interact with partner organelles in an entirely random fashion. In the present study, we challenge this view. By combining high-resolution image analysis with spatial statistical analysis, we have found patterns in the collective behavior of lysosomes. Specifically, we find that despite their extensive long-distance movement, lysosomes maintain non-random, stable, yet distinct spatial distributions at the whole-cell scale (Figures 1C–1H and S2A–S2C). Furthermore, we find that by forming dynamic clusters throughout the intracellular space, individual lysosomes work together to increase their spatial density locally and to promote their interactions with endosomes (Figures 4A–4C, 6C, and 6D). Lysosomes likely bear similarities to other intracellular organelles such as endosomes and peroxisomes in their spatial organization because of their commonalities as compartments of the endomembrane system (Dacks et al., 2009; Diekmann and Pereira-Leal, 2013) and their extensive interactions (Bonifacino and Neefjes, 2017). Our findings that lysosomes maintain stable spatial distributions and form dynamic clusters create potentially fundamental concepts in lysosomal biology specifically and in organelle biology in general, and they provide insights into how organelle interactions are mediated and regulated at the whole-cell scale.
Functional Implications and Underlying Mechanisms of Stable yet Distinct Spatial Distributions of Lysosomes
Because of the crucial role lysosomes play in many important cellular processes, homeostasis of their functions is essential to cell homeostasis. We now know that at least some functions of lysosomes depend on their positioning (Johnson et al., 2016; Korolchuk et al., 2011). Because lysosomes maintain a dynamically stable spatial distribution at the whole-cell scale, homeostasis of their functions does not depend on fixed positions of individual lysosomes.
Our single-particle tracking reveals that lysosomes in a single cell form different subpopulations (Figures 3B and 3C). The subpopulation undergoing directed movement is maintained primarily by microtubule-based active transport. However, the sub-population undergoing constrained diffusion is maintained only partially by the actin cytoskeleton (Figure 3C). The ER network also plays important roles in confining the movement of lysosomes (Figures 5A–5D). Overall, our analysis identifies at least three mechanisms that jointly mediate the stable spatial distribution of lysosomes at the whole-cell scale. The first mechanism is the balance between the subpopulation undergoing directed movement and the subpopulation undergoing constrained diffusion, which is essential to maintain a stable composition of the lysosomal population. The second mechanism is the balance between microtubule-based transport in the centrifugal direction and the centripetal direction, which is essential to maintain the overall positioning of lysosomes relative to one another and to the nucleus. The third mechanism is homeostasis in the biogenesis of lysosomes, which is essential to maintain the level of crowding between lysosomes (Figures 3H–3J). Additional mechanisms, especially upstream regulatory mechanisms, almost certainly are involved in maintaining the stable spatial distribution of lysosomes.
Roles of Organelle Interactions in Mediating Lysosomal Clustering
Recent studies such as that of Valm et al. (2017) revealed extensive interactions between lysosomes and other intracellular organelles. In particular, the ER network and mitochondria together account for the majority of the intracellular space excluding cytoplasm. In liver cells, for example, they account for ~80% of the intracellular space excluding cytoplasm (Alberts et al., 2014). In the present study, we find that the ER network not only confines lysosomal movement (Figures 5A–5D) but also may play a direct role in mediating lysosomal clustering (Figures 5E and 5F). Alternatively, spatial exclusion or restriction by mitochondria is not required for lysosomal clustering, even though it may contribute to the clustering (Figures 5G–5I and 5H–5J).
Functional Implications of Lysosomal Clustering
Using spatial statistical analysis techniques, we find that lysosomes form dynamic clusters not just in the perinuclear region but throughout the intracellular space (Figure 4C). We directly show that the clustering of lysosomes promotes their interactions with late endosomes (Figures 6C and 6D). A key benefit of the dynamic clustering of lysosomes is that it allows tuning of the interaction of lysosomes with partner organelles locally throughout the intracellular space. By increasing the spatial density of lysosomes locally, the formation of clusters increases the likelihood of their collisions and interaction with partner organelles such as endosomes. More importantly, dynamic turnover of the clusters makes it possible to switch on or off such an effect. We speculate that dynamic clustering is a general mechanism for promoting and regulating organelle interactions.
Another key benefit of the dynamic clustering of lysosomes is that it facilitates the maintenance of lysosomal homeostasis. Lysosomes contain high levels of digestive enzymes (Luzio et al., 2007). Rupture of the lysosomal membrane under oxidative stress releases the enzymes into the cytoplasm and is known to trigger apoptosis under many conditions (Colletti et al., 2012; Sun et al., 2010). Therefore, to promote interactions of lysosomes with partner organelles through global crowding via a non-specific increase in their total number is not preferable, not only because this strategy lacks spatial specificity but also because it is detrimental to cell physiology. Dynamic clustering of lysosomes promotes their interactions with partner organelles without the need to increase their total numbers and thus facilitates the maintenance of lysosomal homeostasis.
A Model of Lysosomal Clustering
We propose an active transport-mediated clustering model (Figure 7C). Specifically, we propose that the formation and dispersion of lysosomal clusters are controlled by controlling the active transport of lysosomes, which are confined by the ER network. By increasing its spatial density locally, the ER network also directly contributes to the clustering of lysosomes.
EXPERIMENTAL PROCEDURES
Cell Lines
COS-7 cells were maintained in DMEM supplemented with 10% fetal bovine serum. BS-C-1 cells were maintained in Eagle’s Minimum Essential Medium (EMEM) supplemented with 10% fetal bovine serum. U2OS cells were maintained in McCoy’s 5A Medium (Thermo Fisher Scientific) supplemented with 10% fetal bovine serum. Cells, culture media, and serum were purchased from the American Type Culture Collection.
Fluorescence Microscopy
Imaging was performed on a Nikon Eclipse Ti-E inverted microscope with a CoolSNAP HQ2 camera (Photometric) and a 100×/1.40 numerical aperture (NA) or 60×/1.40 NA oil objective lens. The effective pixel sizes were 0.0645 μm at 100× and 0.107 μm at 60×, respectively. For experiments on ciliobrevin treatment, torin 1 treatment, mitochondria-lysosome interaction, and ER-lysosomes interaction, imaging was performed with an Andor Zyla complementary metal oxide semiconductor (CMOS) camera with a 60×/1.40 NA oil objective lens. The effective pixel size was 0.11 μm at 60×. During live imaging, cells were maintained in a Tokai HIT stage incubator at 37°C with 5% CO2. LAMP1-mCherry for labeling late endosomes and lysosomes and dextran Alexa Fluor 594 for labeling endosomes were imaged using a tetramethylrhodamine (TRITC) filter set. Dextran Alexa Fluor 488 for labeling lysosomes was imaged using a fluorescein isothiocyanate (FITC) filter set. For each condition, at least six cells from two to three independent experiments were imaged.
Lysosomes in non-patterned cells were imaged at 4 frames per second. Lysosomes in patterned cells were imaged at 2.5 frames per second. One-hour videos of lysosomes in COS-7 cells were imaged at 25 s per frame. In latrunculin A, nocodazole, and ciliobrevin D treatment experiments, cells were imaged at 10 frames per second. In ER-lysosome colabeling experiments, cells were imaged at 2.0–2.5 s per frame. In mitochondria-lysosome colabeling experiments, cells were images at 1.5–1.7 s per frame. In endosome-lysosome interaction experiments, cells were imaged at 4.2–5 s/per frame.
Statistical Methods
Unless specified otherwise, comparison of statistical distributions was performed using two-sample Kolmogorov-Smirnov tests, comparison of means was performed using two-sample t tests, and comparison of medians was performed using Wilcoxon rank sum tests.
Supplementary Material
Highlights.
Lysosomes maintain non-random, stable, yet distinct spatial distributions
Cytoskeleton, ER, and biogenesis jointly mediate lysosomal spatial distributions
Lysosomes form dynamic clusters that increase their interactions with endosomes
Lysosomal clustering is associated with local increases in ER spatial density
Acknowledgments
Q.B. acknowledges a Bertucci Graduate Research Fellowship. K.K. acknowledges NIH grants NS096755 and NS094860. G.Y. acknowledges National Science Foundation CAREER grant DBI-1149494. The authors thank Sheiva Fakhraie and Liwia Andrzejcuk for their technical assistance.
Footnotes
DATA AND SOFTWARE AVAILABILITY
The custom software developed for this study is available in source code at https://github.com/ccdlcmu/LysosomeSpatialOrganization_code.
SUPPLEMENTAL INFORMATION
Supplemental Information includes Supplemental Experimental Procedures, seven figures, and seven videos and can be found with this article online at https://doi.org/10.1016/j.celrep.2018.05.079.
AUTHOR CONTRIBUTIONS
G.Y., K.K., and Q.B. conceived and designed the project. Q.B. performed the experiments. G.Y., Q.B., and G.R. performed the data analysis. K.K. contributed to the experimental design and data analysis and provided some reagents. G.Y. and Q.B. wrote the manuscript with contributions from the other authors.
DECLARATION OF INTERESTS
The authors declare no competing interests.
References
- Alberts B, Johnson A, Lewis J, Morgan D, Raff M, Roberts K, Walter P. Molecular Biology of the Cell. Sixth. Garland Science; 2014. [Google Scholar]
- Baddeley A, Rubak E, Turner R. Spatial Point Patterns: Methodology and Applications with R. Chapman & Hall/CRC; 2016. [Google Scholar]
- Bandyopadhyay D, Cyphersmith A, Zapata JA, Kim YJ, Payne CK. Lysosome transport as a function of lysosome diameter. PLoS One. 2014;9:e86847. doi: 10.1371/journal.pone.0086847. [DOI] [PMC free article] [PubMed] [Google Scholar]
- Boland MV, Murphy RF. A neural network classifier capable of recognizing the patterns of all major subcellular structures in fluorescence microscope images of HeLa cells. Bioinformatics. 2001;17:1213–1223. doi: 10.1093/bioinformatics/17.12.1213. [DOI] [PubMed] [Google Scholar]
- Bonifacino JS, Neefjes J. Moving and positioning the endolysosomal system. Curr Opin Cell Biol. 2017;47:1–8. doi: 10.1016/j.ceb.2017.01.008. [DOI] [PMC free article] [PubMed] [Google Scholar]
- Bright NA, Gratian MJ, Luzio JP. Endocytic delivery to lysosomes mediated by concurrent fusion and kissing events in living cells. Curr Biol. 2005;15:360–365. doi: 10.1016/j.cub.2005.01.049. [DOI] [PubMed] [Google Scholar]
- Caviston JP, Zajac AL, Tokito M, Holzbaur ELF. Huntingtin coordinates the dynein-mediated dynamic positioning of endosomes and lysosomes. Mol Biol Cell. 2011;22:478–492. doi: 10.1091/mbc.E10-03-0233. [DOI] [PMC free article] [PubMed] [Google Scholar]
- Colletti GA, Miedel MT, Quinn J, Andharia N, Weisz OA, Kiselyov K. Loss of lysosomal ion channel transient receptor potential channel mucolipin-1 (TRPML1) leads to cathepsin B-dependent apoptosis. J Biol Chem. 2012;287:8082–8091. doi: 10.1074/jbc.M111.285536. [DOI] [PMC free article] [PubMed] [Google Scholar]
- Dacks JB, Peden AA, Field MC. Evolution of specificity in the eukaryotic endomembrane system. Int J Biochem Cell Biol. 2009;41:330–340. doi: 10.1016/j.biocel.2008.08.041. [DOI] [PubMed] [Google Scholar]
- Diekmann Y, Pereira-Leal JB. Evolution of intracellular compartmentalization. Biochem J. 2013;449:319–331. doi: 10.1042/BJ20120957. [DOI] [PubMed] [Google Scholar]
- Diggle PJ. Statistical Analysis of Spatial and Spatiotemporal Point Patterns. Third. CRC Press; 2014. [Google Scholar]
- Encarnação M, Espada L, Escrevente C, Mateus D, Ramalho J, Michelet X, Santarino I, Hsu VW, Brenner MB, Barral DC, Vieira OV. A Rab3a-dependent complex essential for lysosome positioning and plasma membrane repair. J Cell Biol. 2016;213:631–640. doi: 10.1083/jcb.201511093. [DOI] [PMC free article] [PubMed] [Google Scholar]
- Eskelinen EL, Saftig P. Autophagy: a lysosomal degradation pathway with a central role in health and disease. Biochim Biophys Acta. 2009;1793:664–673. doi: 10.1016/j.bbamcr.2008.07.014. [DOI] [PubMed] [Google Scholar]
- Ester M, Kriegel HP, Sander J, Xu X. A density-based algorithm for discovering clusters in large spatial databases with noise. In: Simoudis E, Han J, Fayyad U, editors. Proceedings of the 2nd International Conference on Knowledge Discovery and Data Mining. AAAI Press; 1996. pp. 226–231. [Google Scholar]
- Firestone AJ, Weinger JS, Maldonado M, Barlan K, Langston LD, O’Donnell M, Gelfand VI, Kapoor TM, Chen JK. Small-molecule inhibitors of the AAA+ ATPase motor cytoplasmic dynein. Nature. 2012;484:125–129. doi: 10.1038/nature10936. [DOI] [PMC free article] [PubMed] [Google Scholar]
- Friedman JR, Dibenedetto JR, West M, Rowland AA, Voeltz GK. Endoplasmic reticulum-endosome contact increases as endosomes traffic and mature. Mol BiolCell. 2013;24:1030–1040. doi: 10.1091/mbc.E12-10-0733. [DOI] [PMC free article] [PubMed] [Google Scholar]
- Glory E, Murphy RF. Automated subcellular location determination and high-throughput microscopy. DevCell. 2007;12:7–16. doi: 10.1016/j.devcel.2006.12.007. [DOI] [PubMed] [Google Scholar]
- Gottschling DE, Nyström T. The upsides and downsides of organelle interconnectivity. Cell. 2017;169:24–34. doi: 10.1016/j.cell.2017.02.030. [DOI] [PMC free article] [PubMed] [Google Scholar]
- Illian J, Penttinen A, Stoyan H, Stoyan D. Statistical Analysis and Modeling of Spatial Point Patterns. Wiley; 2008. [Google Scholar]
- Johnson GR, Li J, Shariff A, Rohde GK, Murphy RF. Automated learning of subcellular variation among punctate protein patterns and a generative model of their relation to microtubules. PLoS Comput Biol. 2015;11:e1004614. doi: 10.1371/journal.pcbi.1004614. [DOI] [PMC free article] [PubMed] [Google Scholar]
- Johnson DE, Ostrowski P, Jaumouillé V, Grinstein S. The position of lysosomes within the cell determines their luminal pH. J Cell Biol. 2016;212:677–692. doi: 10.1083/jcb.201507112. [DOI] [PMC free article] [PubMed] [Google Scholar]
- Jongsma ML, Berlin I, Wijdeven RH, Janssen L, Janssen GM, Garstka MA, Janssen H, Mensink M, van Veelen PA, Spaapen RM, Neefjes J. An ER-associated pathway defines endosomal architecture for controlled cargo transport. Cell. 2016;166:152–166. doi: 10.1016/j.cell.2016.05.078. [DOI] [PMC free article] [PubMed] [Google Scholar]
- Korolchuk VI, Saiki S, Lichtenberg M, Siddiqi FH, Roberts EA, Imarisio S, Jahreiss L, Sarkar S, Futter M, Menzies FM, et al. Lysosomal positioning coordinates cellular nutrient responses. Nat Cell Biol. 2011;13:453–460. doi: 10.1038/ncb2204. [DOI] [PMC free article] [PubMed] [Google Scholar]
- Li X, Rydzewski N, Hider A, Zhang X, Yang J, Wang W, Gao Q, Cheng X, Xu H. A molecular mechanism to regulate lysosome motility for lysosome positioning and tubulation. Nat Cell Biol. 2016;18:404–417. doi: 10.1038/ncb3324. [DOI] [PMC free article] [PubMed] [Google Scholar]
- Lim CY, Zoncu R. The lysosome as a command-and-control center for cellular metabolism. J Cell Biol. 2016;214:653–664. doi: 10.1083/jcb.201607005. [DOI] [PMC free article] [PubMed] [Google Scholar]
- Luby-Phelps K, Lanni F, Taylor DL. The submicroscopic properties of cytoplasm as a determinant of cellular function. Annu Rev Biophys Biophys Chem. 1988;17:369–396. doi: 10.1146/annurev.bb.17.060188.002101. [DOI] [PubMed] [Google Scholar]
- Luzio JP, Pryor PR, Bright NA. Lysosomes: fusion and function. Nat Rev Mol Cell Biol. 2007;8:622–632. doi: 10.1038/nrm2217. [DOI] [PubMed] [Google Scholar]
- Martens S, McMahon HT. Mechanisms of membrane fusion: disparate players and common principles. Nat Rev Mol Cell Biol. 2008;9:543–556. doi: 10.1038/nrm2417. [DOI] [PubMed] [Google Scholar]
- Matteoni R, Kreis TE. Translocation and clustering of endosomes and lysosomes depends on microtubules. J Cell Biol. 1987;105:1253–1265. doi: 10.1083/jcb.105.3.1253. [DOI] [PMC free article] [PubMed] [Google Scholar]
- Miedel MT, Rbaibi Y, Guerriero CJ, Colletti G, Weixel KM, Weisz OA, Kiselyov K. Membrane traffic and turnover in TRP-ML1-deficient cells: a revised model for mucolipidosis type IV pathogenesis. J Exp Med. 2008;205:1477–1490. doi: 10.1084/jem.20072194. [DOI] [PMC free article] [PubMed] [Google Scholar]
- Pols MS, ten Brink C, Gosavi P, Oorschot V, Klumperman J. The HOPS proteins hVps41 and hVps39 are required for homotypic and heterotypic late endosome fusion. Traffic. 2013;14:219–232. doi: 10.1111/tra.12027. [DOI] [PubMed] [Google Scholar]
- Prinz WA. Bridging the gap: membrane contact sites in signaling, metabolism, and organelle dynamics. J Cell Biol. 2014;205:759–769. doi: 10.1083/jcb.201401126. [DOI] [PMC free article] [PubMed] [Google Scholar]
- Pu J, Schindler C, Jia R, Jarnik M, Backlund P, Bonifacino JS. BORC, a multisubunit complex that regulates lysosome positioning. DevCell. 2015;33:176–188. doi: 10.1016/j.devcel.2015.02.011. [DOI] [PMC free article] [PubMed] [Google Scholar]
- Pu J, Guardia CM, Keren-Kaplan T, Bonifacino JS. Mechanisms and functions of lysosome positioning. J Cell Sci. 2016;129:4329–4339. doi: 10.1242/jcs.196287. [DOI] [PMC free article] [PubMed] [Google Scholar]
- Qian H, Sheetz MP, Elson EL. Single particle tracking. Analysis of diffusion and flow in two-dimensional systems. Biophys J. 1991;60:910–921. doi: 10.1016/S0006-3495(91)82125-7. [DOI] [PMC free article] [PubMed] [Google Scholar]
- Raiborg C, Wenzel EM, Pedersen NM, Olsvik H, Schink KO, Schultz SW, Vietri M, Nisi V, Bucci C, Brech A, et al. Repeated ER-endosome contacts promote endosome translocation and neurite outgrowth. Nature. 2015;520:234–238. doi: 10.1038/nature14359. [DOI] [PubMed] [Google Scholar]
- Sardiello M, Palmieri M, di Ronza A, Medina DL, Valenza M, Gennarino VA, Di Malta C, Donaudy F, Embrione V, Polishchuk RS, et al. A gene network regulating lysosomal biogenesis and function. Science. 2009;325:473–477. doi: 10.1126/science.1174447. [DOI] [PubMed] [Google Scholar]
- Sarkar S, Davies JE, Huang Z, Tunnacliffe A, Rubinsztein DC. Trehalose, a novel mTOR-independent autophagy enhancer, accelerates the clearance of mutant huntingtin and α-synuclein. J Biol Chem. 2007;282:5641–5652. doi: 10.1074/jbc.M609532200. [DOI] [PubMed] [Google Scholar]
- Saxton MJ. Single-particle tracking: the distribution of diffusion coefficients. Biophys J. 1997;72:1744–1753. doi: 10.1016/S0006-3495(97)78820-9. [DOI] [PMC free article] [PubMed] [Google Scholar]
- Settembre C, Di Malta C, Polito VA, Garcia Arencibia M, Vetrini F, Erdin S, Erdin SU, Huynh T, Medina D, Colella P, et al. TFEB links autophagy to lysosomal biogenesis. Science. 2011;332:1429–1433. doi: 10.1126/science.1204592. [DOI] [PMC free article] [PubMed] [Google Scholar]
- Settembre C, Fraldi A, Medina DL, Ballabio A. Signals from the lysosome: a control centre for cellular clearance and energy metabolism. Nat Rev Mol Cell Biol. 2013;14:283–296. doi: 10.1038/nrm3565. [DOI] [PMC free article] [PubMed] [Google Scholar]
- Sun L, Zhao Y, Li X, Yuan H, Cheng A, Lou H. A lysosomalmitochondrial death pathway is induced by solamargine in human K562 leukemia cells. ToxicolIn Vitro. 2010;24:1504–1511. doi: 10.1016/j.tiv.2010.07.013. [DOI] [PubMed] [Google Scholar]
- Thoreen CC, Kang SA, Chang JW, Liu Q, Zhang J, Gao Y, Reichling LJ, Sim T, Sabatini DM, Gray NS. An ATP-competitive mammalian target of rapamycin inhibitor reveals rapamycin-resistant functions of mTORC1. J Biol Chem. 2009;284:8023–8032. doi: 10.1074/jbc.M900301200. [DOI] [PMC free article] [PubMed] [Google Scholar]
- Valm AM, Cohen S, Legant WR, Melunis J, Hershberg U, Wait E, Cohen AR, Davidson MW, Betzig E, Lippincott-Schwartz J. Applying systems-level spectral imaging and analysis to reveal the organelle interactome. Nature. 2017;546:162–167. doi: 10.1038/nature22369. [DOI] [PMC free article] [PubMed] [Google Scholar]
- Wartosch L, Günesdogan U, Graham SC, Luzio JP. Recruitment of VPS33A to HOPS by VPS16 is required for lysosome fusion with endosomes and autophagosomes. Traffic. 2015;16:727–742. doi: 10.1111/tra.12283. [DOI] [PMC free article] [PubMed] [Google Scholar]
- Yu L, McPhee CK, Zheng L, Mardones GA, Rong Y, Peng J, Mi N, Zhao Y, Liu Z, Wan F, et al. Termination of autophagy and reformation of lysosomes regulated by mTOR. Nature. 2010;465:942–946. doi: 10.1038/nature09076. [DOI] [PMC free article] [PubMed] [Google Scholar]
Associated Data
This section collects any data citations, data availability statements, or supplementary materials included in this article.