

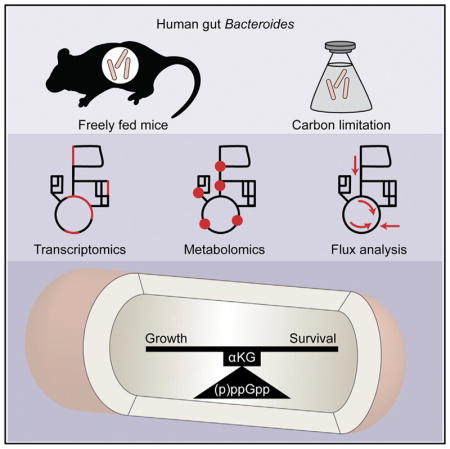
SUMMARY
In the mammalian gut, bacteria compete for resources to maintain their populations, but the factors determining their success are poorly understood. We report that the human gut bacterium Bacteroides thetaiotaomicron relies on the stringent response, an intracellular signaling pathway that allocates resources away from growth, to survive carbon starvation and persist in the gut. Genome-scale transcriptomics, 13C-labeling, and metabolomics analyses reveal that B. thetaiotaomicron uses the alarmone (p)ppGpp to repress multiple biosynthetic pathways and upregulate tricarboxylic acid (TCA) cycle genes in these conditions. During carbon starvation, (p)ppGpp triggers accumulation of the metabolite alpha-ketoglutarate, which itself acts as a metabolic regulator; alpha-ketoglutarate supplementation restores viability to a (p)ppGpp-deficient strain. These studies uncover how commensal bacteria adapt to the gut by modulating central metabolism and reveal that halting rather than accelerating growth can be a determining factor for membership in the gut microbiome.
In Brief
Schofield and Zimmermann-Kogadeeva et al. establish that B. thetaiotaomicron relies on (p)ppGpp signaling to halt growth, allowing this commensal to survive carbon starvation and persist in the gut. (p)ppGpp increases α-ketoglutarate, which alters metabolic processes that promote survival. Thus, halting growth is a requirement for membership in the gut microbiome.
INTRODUCTION
Variation in gut microbiome composition has wide-ranging implications for health, and understanding the factors that shape community composition in this environment would enable efforts to restore or reshape these bacterial communities. In the healthy distal gut, resident bacteria (largely Bacteroidetes and Firmicutes) maintain populations exceeding 1011 cells per milliliter despite constant peristalsis, high bacteriophage levels, immune surveillance, and other challenges. Half of the microbial cells in fecal samples are dead or damaged (Bojanova and Bordenstein, 2016; Maurice et al., 2013), further increasing the burden on active cells to replicate at rates sufficient to maintain these populations. Prominent gut commensals, such as the Bacteroidetes, dedicate 20% of their genomes to machineries that extract carbon and other biomass precursors from available polysaccharides (Fischbach and Sonnenburg, 2011; Koropatkin et al., 2012). Transcriptome profiling and fluorescence dilution studies are also consistent with rapid bacterial growth in the gut (Myhrvold et al., 2015; Sonnenburg et al., 2005). Notably, many bacteria have also evolved mechanisms to arrest growth, but whether such pathways play a role in the microbial ecology of the gut is unknown.
Bacteria adapt their physiology from growth to survival by producing two intracellular alarmones, guanosine-5′-3′-bispyrophosphate (ppGpp) and guanosine pentaphosphate (pppGpp) (Cashel et al., 1996). In Escherichia coli, these signaling molecules interact with RNA polymerase to alter the expression of hundreds of genes in response to amino acid starvation (Ross et al., 2013) and other stresses, including limitation for carbon, nitrogen, fatty acids, iron, and phosphate (Boutte and Crosson, 2013; Potrykus and Cashel, 2008). Other bacteria use (p)ppGpp signaling in response to stresses specific to their environment (for example, non-optimal CO2 or O2 levels) in order to shift from growth to stasis or to induce sporulation (Braeken et al., 2006). Multiple pathogens couple (p)ppGpp signaling to virulence factor production (Dalebroux et al., 2010; Hauryliuk et al., 2015). In addition to interactions with RNA polymerase (Lemke et al., 2009; Ross et al., 2013), the regulatory repertoire employed by (p)ppGpp spans a broad range of direct and indirect mechanisms (Dalebroux and Swanson, 2012; Gaca et al., 2015; Liu et al., 2015), including interaction with a variety of other proteins (Kanjee et al., 2012), σ-factor competition (Jishage et al., 2002), or modulation of the levels of initiating nucleoside triphosphates, such as guanosine triphosphate (GTP) (Krásný and Gourse, 2004).
The cellular pool of (p)ppGpp is controlled by Rel-Spo Homolog (RSH) proteins. Most bacteria encode a single RSH protein that contains both (p)ppGpp synthetase and hydrolase domains, while Beta- and Gammaproteobacteria, including E. coli, have duplicated RSH genes (Potrykus and Cashel, 2008). In these species, one RSH homolog (RelA in E. coli) carries inactivating mutations in the hydrolase domain, while the other (SpoT in E. coli) retains both (p)ppGpp synthetase and hydrolase activity (Figure 1A). Because unrestrained (p)ppGpp production inhibits growth, SpoT is essential if RelA is present (Xiao et al., 1991).
Figure 1. Bacteroides thetaiotaomicron Encodes Two Enzymes that Contribute to (p)ppGpp Production upon Carbon Starvation.

(A) Reactions catalyzed by RelA/SpoT Homologue (RSH) proteins.
(B) Phylogenetic analysis of RSH proteins reveals independent duplication events within the Bacteroides and Gammaproteobacteria lineages. Amino acid substitutions at residues required for hydrolase or synthetase activity in homologous proteins (Hogg et al., 2004) are indicated in red (non-similar) and gray (similar). Red circles indicate predicted gene duplication events. SD, synthetase domain; HD, hydrolase domain.
(C) Thin-layer chromatography of 32P-labeled nucleotide extracts from B. thetaiotaomicron cells before (+) and 2 hr after (−) a shift from glucose replete to glucose deplete medium.
(D) Survival of wild-type (WT), bt0700, and ppGpp0 strains during prolonged carbon starvation.
(E) Growth of WT, bt0700, and ppGpp0 strains in defined minimal medium without amino acids.
(F) Growth rates of WT, bt0700, and ppGpp0 strains in defined minimal medium with and without amino acids.
Error bars represent SD of three biological replicates. Significant differences between WT and mutant strains are indicated with asterisks, between ppGpp0 and bt0700 strains with dots (*p < 0.05; **p < 0.01; ***p < 0.001, Tukey’s HSD test and FDR adjustment with Benjamini-Hochberg procedure). See also Figure S1, Table S3.
In the course of identifying candidate essential genes by genomewide transposon mutagenesis of the human gut commensal Bacteroides thetaiotaomicron (Goodman et al., 2009), we noticed that one of two predicted RSH genes (bt3998) was completely recalcitrant to transposon insertion. Because (p)ppGpp production is not essential for viability in other organisms, and B. thetaiotaomicron encodes a second RSH enzyme, we reasoned that bt3998-dependent (p)ppGpp hydrolase activity could be required for viability in this organism. In this work, we set out to investigate the contribution of the (p)ppGpp alarmones in a representative human gut commensal.
Here we report that (p)ppGpp signaling plays a critical role in determining the ability of B. thetaiotaomicron to colonize and persist in the gut of freely fed mice. Moreover, (p)ppGpp regulation ensures B. thetaiotaomicron survival during carbon starvation in vitro. RNA sequencing (RNA-seq) analysis defines a common (p)ppGpp-dependent central metabolism gene expression program that B. thetaiotaomicron activates in these two conditions. Metabolomics and 13C-tracing experiments reveal that (p)ppGpp production triggers significant increases in the levels of succinate and alpha-ketoglutarate (AKG) upon carbon starvation. Notably, AKG supplementation rescues the starvation survival defect of a ppGpp0 strain. Together, these studies provide an example of a human gut commensal that relies on intracellular signals that halt growth in favor of starvation survival in order to persist in the gut of a non-starved host.
RESULTS
Bacteroides thetaiotaomicron Encodes Two (p)ppGpp Synthases Required for Carbon Starvation Survival but Dispensable for Amino Acid Biosynthesis
Human gut Bacteroides encode two multi-domain RSH enzymes (represented by BT0700 and BT3998 in B. thetaiotaomicron) that have not been functionally characterized. These enzymes share greater sequence similarity with each other than either does to RelA or SpoT from Gammaproteobacteria, suggesting that RSH gene duplication events occurred independently in both the Bacteroidetes and Gammaproteobacteria lineages (Figure 1B) (Atkinson et al., 2011). Three lines of evidence suggest that BT0700 and its homologs, like E. coli RelA, have lost (p)ppGpp hydrolase activity. First, half of the amino acid positions that are required for hydrolase activity in homologous proteins (Hogg et al., 2004) are altered to functionally dissimilar amino acids in BT0700 and its homologs in Bacteroides ovatus, Bacteroides eggerthii, Bacteroides uniformis, and Bacteroides vulgatus (Figure 1B, Table S1). By contrast, the hydrolase domain in BT3998 and its homologs contain functionally dissimilar amino acids in few of these positions. Second, random transposon mutagenesis of each of these species yields numerous insertions in the bt0700 homolog, but none in the bt3998 homolog encoded in each species (Figure S1A) (Cullen et al., 2015), consistent with previous assignment of bt3998 as a candidate essential gene (Goodman et al., 2009). Third, bt3998 is readily deleted in the bt0700 background, but not in the wild-type background (Table S2).
To determine whether BT0700 and BT3998 are indeed required for (p)ppGpp synthesis, we analyzed 32P-labeled nucleotide extracts from wild-type and mutant strains by thin-layer chromatography. In response to carbon starvation, wild-type B. thetaiotaomicron increases the levels of two characteristic nucleotides that migrate between GTP and the origin. The levels of these nucleotides are reduced in the bt0700 strain and not detected in the bt0700 bt3998 strain (Figure 1C). Quantification of (p)ppGpp levels relative to GTP reveals that during carbon starvation, the wild-type strain accumulates three times more alarmone than the bt0700 mutant (Figure S1B). Detection of ppGpp prior to carbon starvation in 32P-labeled wild-type cells likely results from minor oxygen exposure, which induces alarmone production in B. thetaiotaomicron (Glass et al., 1979). Liquid chromatography-coupled massspectrometry (LC-qTOF) quantification confirms production of ppGpp upon carbon starvation (Figure S1C). Based on these results, we designated the bt0700 bt3998 strain as ppGpp0.
Since carbon starvation activates (p)ppGpp production by B. thetaiotaomicron, we next determined whether this signal is important for survival in this condition. Indeed, wild-type B. thetaiotaomicron readily withstands 24 hr of carbon starvation with no significant loss of viability; by contrast, the viability of the ppGpp0 strain decreases by four orders of magnitude (Figure 1D). Since deletion of bt0700 decreases viability only 2-fold at the same time point (Table S3), we conclude that (p)ppGpp produced by BT3998 is largely sufficient to maintain cellular survival during 24 hr of carbon starvation.
In many bacteria, (p)ppGpp signaling is essential for activation of amino acid biosynthetic pathways in the absence of exogenous amino acids; as a result, ppGpp0 strains are auxotrophic for multiple amino acids (Hauryliuk et al., 2015). Notably, the B. thetaiotaomicron ppGpp0 strain readily grows in defined amino acid-free minimal medium (Figure 1E). Although the ppGpp0 growth rate is 20% slower than the wild-type, amino acid supplementation increases both growth rates to an equivalent extent (Figure 1F). Together, these results suggest that (p)ppGpp signaling is essential for carbon starvation survival, but not amino acid biosynthesis, in B. thetaiotaomicron.
B. thetaiotaomicron Requires (p)ppGpp for Establishment and Maintenance of Gut Colonization
To assess the role of (p)ppGpp signaling in mammalian gut colonization, we conducted three experiments in gnotobiotic mice. First, we colonized germfree mice fed nutrient-rich chow ad libitum with a combination of B. thetaiotaomicron wild-type, bt0700, and ppGpp0 strains (1:10:10), and measured population dynamics over time in fecal samples. Within 8 days of initial colonization, the ppGpp0 strain is outcompeted by six orders of magnitude (Figure 2A). The bt0700 strain exhibits a transient decrease in competitive fitness, which is no longer apparent by day 15 (Figures 2A and S2, Table S3). There is no difference in the colonization levels of wild-type, bt0700, and ppGpp0 strains when introduced individually into separate mice (Figure 2B).
Figure 2. B. thetaiotaomicron Requires (p)ppGpp for Establishment and Maintenance of Mouse Gut Colonization.

(A and B) Relative abundance of WT, bt0700, and ppGpp0 strains in feces of gnotobiotic mice colonized with these isogenic strains together (A) or separately (B).
(C) Population dynamics of WT, bt0700, and ppGpp0 strains in gnotobiotic mice carrying defined, multi-species human gut communities representing Bacteroidetes, Firmicutes, and Actinobacteria phyla.
(D) Population dynamics of a barcoded WT B. thetaiotaomicron strain (WTB) in gnotobiotic mice previously colonized with either WT B. thetaiotaomicron (WTA) or the ppGpp0 strain. Error bars represent SD of five biological replicates. Significant differences between WT and mutant strains during co-colonization are indicated with asterisks (*p < 0.05; **p < 0.01; ***p < 0.001, Tukey’s HSD test (A–C) or t test (D) and FDR adjustment with Benjamini-Hochberg procedure).
Second, to determine whether (p)ppGpp signaling is also required in the presence of other abundant members of the human gut microbiota, we colonized gnotobiotic mice with the B. thetaiotaomicron wild-type, bt0700, and ppGpp0 strains together with six human gut Bacteroidetes or six prominent human gut Firmicutes and Actinobacteria (STAR Methods). In each of these defined communities, the B. thetaiotaomicron ppGpp0 strain demonstrates an equivalent fitness defect as observed in the absence of other species (Figure 2C).
Bacteroides species exhibit intraspecific niche exclusion in the gut, in which initial colonizers prevent subsequent establishment by the same species (Lee et al., 2013). In the third experiment, we colonized germfree mice with barcoded wild-type (WTA) or ppGpp0 B. thetaiotaomicron strains; after 3 days, we introduced a differently barcoded wild-type strain (WTB), and measured population dynamics over time (Figure 2D). As expected, the WTA strain efficiently prevented WTB colonization. By contrast, the ppGpp0 strain was unable to exclude the WTB strain, suggesting that (p)ppGpp signaling provides a fitness advantage both for initial colonization and long-term persistence in the gut.
B. thetaiotaomicron Maintains a Common (p)ppGpp-Dependent Metabolic Gene Expression Program In Vivo and during Carbon Starvation In Vitro
To identify (p)ppGpp-dependent processes that determine B. thetaiotaomicron fitness, we performed RNA-seq analysis of wild-type, bt0700, and ppGpp0 strains during growth in vitro before and after 1 hr of carbon starvation and in vivo in cecal contents of monocolonized gnotobiotic mice. Overall, nearly 60% of the transcriptome is differentially expressed between the wild-type and ppGpp0 strains in at least one condition (Table S4), reflecting a broad transcriptional program that responds to the (p)ppGpp signal.
Principal component analysis (PCA) of the normalized RNA-seq data separates transcriptional profiles by experimental condition, suggesting that environment plays the largest role in defining the observed transcriptional profiles (Figure 3A). When PCA is applied separately to in vitro and in vivo data, the first principal component separates ppGpp0 from the wild-type and bt0700 strains in vivo and during starvation in vitro, implying that (p)ppGpp-dependent gene regulation has a broad effect in these conditions (Figures 3B and 3C).
Figure 3. B. thetaiotaomicron Uses (p)ppGpp as a Global Transcriptional Regulator during In Vitro Starvation and In Vivo Colonization.

(A) PCA of normalized RNA-seq data of WT, bt0700, and ppGpp0 strains measured during exponential growth conditions in vitro, after 1 hr carbon starvation in vitro, and during growth in vivo in the cecum of monoassociated gnotobiotic mice.
(B and C) PCA plots of RNA-seq data from in vitro (B) and in vivo (C) conditions analyzed separately.
(D and E) KEGG pathway enrichment analysis of significantly changing genes between ppGpp0 and WT strains across conditions (D); and between genotypes in vivo (E). Pathways are displayed if the enrichment p value (FDR adjusted with Benjamini-Hochberg procedure) is < 0.01 in at least one condition; black, n.s. (not significant). Pathways changing in the ppGpp0 strain compared with WT and bt0700 in vivo are marked in red. m., metabolism; b., biosynthesis; d., degradation.
(F and G) Metabolic subnetworks of genes expressed at significantly different levels between ppGpp0 and both the bt0700 and WT genotypes, but not between bt0700 and WT genotypes, during gut colonization. Subnetwork edges are colored according to gene fold changes between ppGpp0 and WT in vivo (F) or in vitro after 1-hr carbon starvation (G). Edge numbering corresponds to Ref-seq locus tags.
To survey the processes affected by (p)ppGpp deficiency, we performed pathway enrichment analysis to identify Kyoto Encyclopedia of Genes and Genomes (KEGG) pathways (Ogata et al., 1999) enriched in differentially expressed genes between ppGpp0 and wild-type strains in each condition (|log2[fold change]| ≥ 1, false discovery rate [FDR] ≤0.05). The majority of pathways enriched in downregulated genes in the ppGpp0 strain are condition-independent, and few pathways are enriched in ppGpp0-upregulated genes during in vitro growth (Figure 3D, Table S4). During both carbon starvation and gut colonization, pathways associated with metabolism of various amino acids, folate, and biotin, aminoacyl-tRNA biosynthesis, and ABC transporters are enriched in upregulated genes in the ppGpp0 strain (Figure 3D). These results further indicate that B. thetaiotaomicron uses (p)ppGpp signaling to control shared processes in these different environments.
Because the wild-type and bt0700 strains both exhibit a significant fitness advantage over the ppGpp0 strain during gut colonization (Figure 2A), we reasoned that the gene regulatory events that determine in vivo fitness are likely shared between wild-type and bt0700 strains, and distinct between either of these strains and the ppGpp0 strain. Pathway enrichment analysis highlights folate, polyketide sugar unit, and aliphatic amino acid biosynthesis pathways enriched in ppGpp0-upregulated genes; and tricarboxylic acid (TCA) cycle and alanine/aspartate/glutamate metabolism pathways enriched in ppGpp0-downregulated genes as compared with both wild-type and bt0700 strains (Figure 3E). Several pathways are enriched in both upregulated and downregulated genes, suggesting that parts of these pathways may fulfill different functions and undergo different regulatory programs.
To characterize these ppGpp0-specific differences independent from pathway definitions, we selected the differentially expressed genes in the ppGpp0 compared with both the wild-type and bt0700 strains in vivo, and performed a metabolic subnetwork analysis (Zimmermann et al., 2017). We mapped these 395 genes onto a network generated from KEGG reaction pairs (Ogata et al., 1999) representing substrate and product metabolites as nodes, connected by enzymes (edges). We then used a shortest path search algorithm to identify subnetworks consisting of at least three connected genes regulated in a (p)ppGpp-specific manner. We detected five such subnetworks that cover central metabolism (glycolysis, pentose phosphate pathway, and TCA cycle), amino acid metabolism, polyketide sugar unit biosynthesis, starch and sucrose metabolism, and lipoic acid metabolism (Figure 3F, Table S4). Notably, these in vivo (p)ppGpp-regulated metabolic subnetworks exhibit the same expression pattern during carbon starvation in vitro (Figure 3G, Table S4). Concordant with the KEGG pathway enrichment analysis, subnetworks associated with amino acid metabolism are repressed in a (p)ppGpp-dependent manner, while subnetworks associated with central metabolism require (p)ppGpp for upregulation, both in vivo and in vitro during starvation.
Carbon Starvation Induces (p)ppGpp-Dependent Changes in TCA Cycle Gene Expression and TCA Cycle Metabolites
Since transcriptional analysis revealed (p)ppGpp-dependent regulation of numerous metabolic pathways, we set out to investigate stress-induced metabolic adaptations by directly measuring intracellular metabolites. Given the difficulty of distinguishing bacterial and host central metabolites in vivo, and the high similarity between (p)ppGpp-dependent transcriptional responses in the gut and during carbon starvation (Figures 3F and 3G), we focused on wild-type and ppGpp0 B. thetaiotaomicron cultures collected before and 1 hr after carbon starvation. At this time point, the ppGpp0 strain does not yet exhibit a significant loss of viability (Figure 1D, Table S3).
Transcriptional changes induced by carbon starvation fall into three categories: KEGG pathways enriched in upregulated genes by both strains, in downregulated genes by both strains, and in genes downregulated only by the wild-type strain (Figure S3A, Table S4). Glycan and lipid degradation, as well as galactose, histidine, and pentose metabolism pathways were upregulated, whereas glycolysis, several amino acids, propanoate, and ribosome pathways were downregulated in a (p)ppGpp-independent manner. Numerous pathways involved in amino acid, purine and pyrimidine, peptidoglycan, folate, biotin, and aminoacyl-tRNA biosynthesis, as well as RNA polymerase and RNA degradation, were downregulated only by the wild-type strain, consistent with an inability of the (p)ppGpp-deficient strain to inhibit growth upon starvation. Transcriptional changes in the bt0700 strain resembled those of the wild-type (Figure S3A), suggesting that (p)ppGpp it produces (Figure 1C) is sufficient to induce the response to carbon starvation.
Because (p)ppGpp signaling impacts expression of many metabolic genes in vivo and during starvation, we next measured metabolites directly by untargeted metabolomics analysis of wild-type and ppGpp0 samples. We detected 2,512 ions shared between the growth and starvation conditions, 176 of which could be annotated and assigned to 70 out of 77 KEGG metabolic pathways in B. thetaiotaomicron (Table S5). Pathway enrichment analysis of significantly changing metabolites between the 1-hr carbon starvation and carbon-replete conditions in the wild-type and ppGpp0 strains (|log2[fold change]| ≥ log2[1.5], FDR ≤0.05) reveals heterogeneous changes, with many pathways being enriched in both decreasing and increasing metabolites (Figure 4A). Similar to the transcriptional response, the ppGpp0 strain fails to decrease metabolites in amino acid and aminoacyl-tRNA biosynthesis pathways. Furthermore, ppGpp0 fails to increase metabolites associated with amino acid, butanoate, glyoxylate metabolism, and TCA cycle pathways (Figure 4A, Table S5).
Figure 4. B. thetaiotaomicron Triggers Significant, (p)ppGpp-Dependent Changes in TCA Cycle Genes and Metabolites in Response to Carbon Starvation.

(A) KEGG pathway enrichment analysis of significantly changing metabolites (measured by untargeted metabolomics) between starvation and growth conditions in WT and ppGpp0 strains. Pathways are displayed if the enrichment p-value (FDR adjusted with Benjamini-Hochberg procedure) is < 0.01 in at least one condition; black, n.s. (not significant). Pathways changing in a (p)ppGpp-dependent manner during starvation are marked in red. m., metabolism; b., biosynthesis; d., degradation.
(B) Clustergram of metabolite fold changes between starvation and growth conditions in WT and ppGpp0 strains as quantified by targeted metabolomics analysis.
(C and D) Metabolite and RNA-seq fold changes between starvation and growth conditions for WT (C) and ppGpp0 (D) projected on the metabolic subnetwork defined in Figure 3F.
3P-glycerate, 3-phosphoglycerate; BP-glycerate, bisphosphoglycerate; b., biosynthesis; DHAP, dihydroxyacetone phosphate; F1P, fructose-1-phospate; F6P, fructose-6-phospate; FBP, fructose-bisphosphate; G1P, glucose-1-phospate; G6P, glucose-6-phospate; GABA, gamma-aminobutyric acid; m., metabolism; PEP, phosphoenolpyruvate; S7P, sedoheptulose 7-phosphate. See also Figure S3, Table S5.
We next used targeted metabolite measurements (liquid chromatography coupled tandem mass spectrometry [LC-MS/MS]) to selectively quantify the levels of 30 metabolites associated with central, amino acid, and nucleoside metabolism. Consistent with the role of GTP as the precursor of pppGpp (Figure 1A) (Krásný and Gourse, 2004), guanosine diphosphate (GDP) and GTP levels decrease in wild-type B. thetaiotaomicron but not in the ppGpp0 strain upon carbon starvation (Figure 4B). Whereas both the wild-type and ppGpp0 strains decrease glycolysis and pentose phosphate pathway intermediates upon starvation, the TCA cycle metabolites succinate and alpha-ketoglutarate (AKG) are highly and specifically increased in a (p)ppGpp-dependent manner when the carbon source is withdrawn (Figure 4B, Table S5). Concurrently, the wild-type strain upregulates several TCA cycle genes, while the ppGpp0 strain fails to do so (Figures 4C and 4D, Table S4). We therefore hypothesized that these (p)ppGpp-dependent differences in succinate and AKG levels contribute to the stress response program. We set out to further investigate the source of these accumulating TCA cycle metabolites and their effect on bacterial survival during carbon starvation.
B. thetaiotaomicron Produces Alpha-Ketoglutarate via the Reductive Branch of the TCA Cycle during Growth and Starvation
To investigate succinate and AKG production in B. thetaiotaomicron, we first analyzed TCA cycle operation in B. thetaiotaomicron during growth in glucose minimal medium. To this end, we shifted exponentially growing wild-type B. thetaiotaomicron from [U-12C]-glucose to labeled [U-13C]-glucose on a filter under continual culture medium flow, and measured mass isotopologues of intracellular metabolites over the course of 5 minutes by LC-MS/MS as described (Link et al., 2013) (Figure S4A). The metabolite labeling patterns reflect 13C propagation from [U-13C]-glucose and 12CO2 integration from the anaerobic atmosphere, which contains 20% CO2.
After exponentially growing B. thetaiotaomicron cultures are shifted to [U-13C]-glucose, the label rapidly propagates through glycolysis, with its intermediates fructose-bisphosphate (FBP) and phosphoenolpyruvate (PEP) reaching the labeled isotopic steady state within 160 s. Labeling steady state is nearly reached in malate and succinate in the reductive branch, and not reached in citrate in the oxidative branch of the TCA cycle within this time (Figure 5A). The labeling pattern of glutamate matches that of succinate and not citrate, suggesting that glutamate and its immediate precursor AKG are produced via the reductive TCA cycle (Figures 5A and 5E). Consistent with these observations, providing growing cells with [U-13C]-acetate (metabolized in the first step of the oxidative branch) results in label propagation to citrate, but not glutamate (Figures 5B and 5E, Table S6).
Figure 5. B. thetaiotaomicron Produces Alpha-Ketoglutarate through the Reductive Branch of the TCA Cycle during Growth and Starvation.

(A–D) Labeled isotopologue fractions of metabolites collected from B. thetaiotaomicron cultures shifted from (A) unlabeled glucose to [U-13C] glucose; (B) unlabeled glucose and acetate to unlabeled glucose and [U-13C] acetate; (C) unlabeled glucose and [U-13C] acetate to [U-13C] acetate; (D) unlabeled glucose and glutamine to [U-13C] glutamine. [M + X] indicates the number of 13C-labeled carbon atoms in an isotopologue of a metabolite (maximal value of X is the number of carbons in the molecule). 13C isotopologue fractions reflect the proportions of differently labeled isotopologues in the total pool of a metabolite.
(E) Schematic representation of label propagation observed in each shift experiment and underlying metabolic fluxes. AKG, alpha-ketoglutarate; FBP, fructose-bisphosphate; OAA, oxaloacetate; PEP, phosphoenolpyruvate. [M + X] indicates mass isotopologue with X 13C atoms.
We next took two approaches to investigate TCA cycle operation during carbon starvation. Because B. thetaiotaomicron is unable to grow on acetate or glutamine as a sole carbon source (Figure S4B), we shifted cells from medium containing unlabeled glucose and either [U-13C] acetate or [U-12C] glutamine to medium lacking glucose and containing either [U-13C]-acetate or [U-13C] glutamine to probe the fluxes to AKG through the oxidative TCA cycle and from amino acids. During the acetate shift, the 13C label propagates to citrate but not to glutamate or other measured metabolites, suggesting that AKG is not produced from the oxidative branch (Figures 5C and 5E). In the presence of [U-13C]-glutamine, the label was detected only in glutamate (Figure 5D). Since we could not directly measure the AKG labeling pattern, we cannot exclude that some label from citrate or glutamate propagates to AKG, but not further. Parallel experiments conducted with the ppGpp0 mutant revealed similar patterns in label propagation in intracellular metabolites (Figures S4C and S4D). Together, these studies establish that both wild-type and ppGpp0 strains of B. thetaiotaomicron operate a bifurcated TCA cycle, with AKG and glutamate derived from succinate via the reductive branch. Our data suggest that during carbon starvation, the reductive branch remains the major source of increased AKG, despite the upregulation of the oxidative branch enzymes.
Supplementation with Alpha-Ketoglutarate Enhances ppGpp0 Survival during Carbon Starvation
Our transcriptomic and metabolomic analyses point out the engagement of the TCA cycle in the (p)ppGpp-dependent global regulatory program in B. thetaiotaomicron. To determine whether the failure of the ppGpp0 strain to modulate the TCA cycle contributes to its lack of fitness, we focused on AKG, which is highly increased upon starvation in a (p)ppGpp-dependent manner (Figures 4B–4D) and is derived from succinate (Figure 5). To this end, we treated ppGpp0 cells with dimethyl-AKG (a membrane-permeable AKG precursor [Doucette et al., 2011]) 30 min prior and during carbon starvation. The intracellular levels of AKG, glutamate, and glutamine significantly increased, suggesting that dimethyl-AKG readily enters the cells and is hydrolyzed to AKG (Figures 6A and S5A). Strikingly, exogenous dimethyl-AKG protects the ppGpp0 strain from its normal loss of viability during carbon starvation by nearly two orders of magnitude (Figure 6B, Table S3). It is unlikely that exogenous dimethyl-AKG rescues the ppGpp0 strain by serving as a precursor for amino acids derived from glutamine, because addition of glutamine is not protective (Figure 6C). Further, it is unlikely that the protective effect of dimethyl-AKG can be explained by its replenishment of a carbon source, because its addition to growing B. thetaiotaomicron cultures results in growth arrest (Figure 6D).
Figure 6. Alpha-Ketoglutarate (AKG) Is Sufficient to Promote ppGpp0 Survival and Partially Restore Its Metabolic Phenotype during Carbon Starvation.

(A) AKG levels in the ppGpp0 mutant during carbon starvation with and without dimethyl-AKG supplementation. Error bars represent standard deviation of three biological replicates.
(B and C) Survival of WT and ppGpp0 strains during carbon starvation with and without dimethyl-AKG (B) or glutamine (C). Error bars represent standard deviation of three biological replicates. Significant differences between survival of a given strain with and without supplementation are indicated with asterisks (***p < 0.001, Tukey’s HSD test and FDR adjustment with Benjamini-Hochberg procedure).
(D) Growth curves of WT and ppGpp0 strains in glucose minimal medium with and without dimethyl-AKG.
(E) KEGG pathway enrichment analysis for increasing (orange) and decreasing (blue) metabolites in the B. thetaiotaomicron ppGpp0 strain during carbon starvation with dimethyl-AKG versus no dimethyl-AKG supplementation. Pathways are displayed if the enrichment p-value (FDR adjusted with Benjamini-Hochberg procedure) is < 0.1 in at least one condition; black, n.s. (not significant). m., metabolism, b., biosynthesis.
To better understand how AKG protects B. thetaiotaomicron from loss of viability during starvation, we performed untargeted metabolomic profiling of the ppGpp0 strain before and during carbon starvation, with and without dimethyl-AKG supplementation. Of 3,104 detected ions, 171 could be annotated and 68 had distinct dynamic profiles between the two conditions (Table S7). The large number of changing metabolites and the bidirectionality of changes suggest that AKG acts as a regulator, affecting pathways both proximal and distal from its entry point into the TCA cycle (Figure 6E, Table S7). Interestingly, dimethyl-AKG treatment does not prevent accumulation of GDP or other nucleotides in the ppGpp0 strain (Figure S5B), suggesting that its protective effects are independent of guanosine nucleotide regulation.
Overall, our results suggest that upon starvation, B. thetaiotaomicron increases AKG levels in a (p)ppGpp-dependent manner. Elevated AKG, in turn, likely serves as a metabolic regulator and affects amino acid, pantothenate, propanoate, and central carbon metabolism, among others. An isogenic B. thetaiotaomicron strain genetically altered to lack (p)ppGpp signaling cannot increase AKG levels upon starvation and exhibits a severe viability defect under these conditions, which is substantially rescued by exogenous AKG supplementation.
DISCUSSION
The distal gut is a dynamic ecosystem, with enormous populations of bacteria competing for resources while facing rigorous immune surveillance, introduction of foreign microbes, and constant perfusion. Perhaps as a result, dominant gut microbes dedicate a large portion of their genomes to machineries that efficiently convert dietary polysaccharides into biomass for growth. These systems are well represented and best characterized in B. thetaiotaomicron, and transcriptomic studies in the gut of monoassociated gnotobiotic mice revealed that this species maintains a genomewide expression profile in vivo that is consistent with rapid growth (Sonnenburg et al., 2005). Here we report that B. thetaiotaomicron also relies on an intracellular signal to arrest growth in order to compete in the mammalian gut.
Genome-scale transcriptomics and metabolomics analyses uncover a broad (p)ppGpp-dependent metabolic response that B. thetaiotaomicron maintains in the gut. This (p)ppGpp-dependent gene expression program is also required to survive carbon starvation in vitro. In both conditions, B. thetaiotaomicron uses (p)ppGpp signaling to upregulate TCA cycle genes, and direct measurement of metabolite levels in vitro reveal a concordant, (p)ppGpp-dependent increase in TCA cycle metabolites. The TCA cycle intermediate AKG rescues the survival defect of a ppGpp0 strain during starvation, highlighting this molecule as a key component of the (p)ppGpp regulatory repertoire.
(p)ppGpp as a Global Transcriptional Regulator in Starving B. thetaiotaomicron
B. thetaiotaomicron shares several general features of (p)ppGpp signaling observed in other bacterial phyla. As initially described in stringent strains of E. coli, B. thetaiotaomicron employs (p)ppGpp to repress rRNA and tRNA synthesis during starvation. Further, (p)ppGpp serves as a global regulator, altering the expression of more than 50% of the B. thetaiotaomicron genome during starvation (Table S4); this broad effect is also observed in other phyla (Potrykus and Cashel, 2008). This gene expression program extends beyond the transcription and translation apparatus to include (p)ppGpp-dependent repression of biosyntheticpathways for peptidoglycan, amino acids, and other metabolic pathways. Direct comparison of (p)ppGpp-mediated regulation with previous studies is hindered by differences in starvation conditions, since amino acid starvation is typically used to induce (p)ppGpp production in other bacteria (Eymann et al., 2002; Traxler et al., 2008), whereas B. thetaiotaomicron does not require (p)ppGpp to activate amino acid biosynthesis (Figures 1E and 1F). Caulobacter crescentus, another bacterium that does not require (p)ppGpp for activation of amino acid biosynthesis, exhibits similar (p)ppGpp-dependent downregulation of amino acid biosynthetic genes upon carbon starvation (Boutte and Crosson, 2011). Notably, the hourly time resolution of our studies does not differentiate between direct and secondary effects of (p)ppGpp regulation, both of which are likely important for its protective effects. Other aspects of B. thetaiotaomicron carbon starvation response are (p)ppGpp-independent, including upregulation of genes responsible for degrading glycans and lipids, and downregulation of genes associated with central metabolism (with the exception of the TCA cycle).
The Regulation of Starvation Response by Alpha-Ketoglutarate
In response to carbon starvation, B. thetaiotaomicron significantly upregulates TCA cycle gene expression in a (p)ppGpp-dependent manner and quadruples the levels of the TCA cycle metabolite AKG, which likely contributes to prolonged survival by promoting growth arrest. A regulatory role for AKG has been reported in Proteobacteria, where it coordinates carbon and nitrogen metabolism (Doucette et al., 2011) and peptidoglycan biosynthesis (Irnov et al., 2017). However, the proposed mechanism of AKG inhibition of glucose uptake in response to nitrogen starvation is unlikely to explain our observations, because B. thetaiotaomicron does not use the phosphotransferase system to transport glucose and is not nitrogen limited in these experiments; further, no glucose is present in the starvation condition. In Caenorhabditis elegans, AKG is reported to prolong lifespan through inhibition of ATP synthase (Chin et al., 2014). However, this mechanism is also unlikely to explain our results, since AKG supplementation does not change AMP or ADP levels in B. thetaiotaomicron (Figure S5B). Dimethyl-AKG supplementation of the ppGpp0 mutant at the onset of carbon starvation leads to a decrease in metabolic pathway intermediates which were decreased in the wild-type, but not in the unsupplemented ppGpp0 strain (including metabolites associated with aminoacyl-tRNA biosynthesis, amino acid metabolism and biosynthesis pathways), and an increase in metabolic pathway intermediates increased in the wild-type but not in the ppGpp0 strain (alanine, aspartate and glutamate, butanoate metabolism) (Figures 6E and 4A). We therefore hypothesize that AKG serves as a signal that coordinates the allocation of multiple resources away from biosynthesis pathways, and that the absence of this signal leads to rapid death during starvation.
The mechanisms by which (p)ppGpp stimulates AKG accumulation during starvation remain unclear. Although B. thetaiotaomicron induces expression of genes in the oxidative branch of the TCA cycle in a (p)ppGpp-dependent manner, no flux from citrate to AKG is detected during growth or starvation. TCA cycle bifurcation around succinate during anaerobic growth has been observed in other species (Amador-Noguez et al., 2010; Chen et al., 2011; Sauer et al., 1999). Bacteroides fragilis bifurcates the TCA cycle around AKG, which is produced either from succinate through the heme-dependent reductive branch, or from citrate through the heme-independent oxidative branch (Baughn and Malamy, 2002); however, their relative contributions have not been determined. Because B. thetaiotaomicron is auxotrophic for heme, we have not been able to investigate the contribution of the oxidative branch by eliminating heme. Notably, the oxidative branch of the TCA cycle is also upregulated during amino acid starvation in E. coli with concomitant increase of glutamate, a direct product of AKG, in a (p)ppGpp-dependent manner (Traxler et al., 2008). This suggests that the accumulation of AKG and related metabolites in response to stress is a conserved mechanism of (p)ppGpp-mediated regulation.
(p)ppGpp as an Essential Regulatory Mechanism for Gut Colonization
Our finding that B. thetaiotaomicron relies on the same intracellular signal to survive carbon starvation and to persist in the gut suggests that it faces significant and continual stresses in the gut environment, and that common physiological adaptations that favor stasis rather than growth are beneficial in both conditions. Although the mammalian gut provides a protected habitat of constant temperature and a continuous flow of nutrients that supports enormous bacterial populations, local environments encountered by bacteria are likely heterogeneous. The environmental cues that trigger (p)ppGpp-mediated stress responses in other bacteria vary between species (Boutte and Crosson, 2013). In Proteobacteria, RSH gene duplication further diversifies its stringent response, with RelA responding to single amino acid depletion (Haseltine and Block, 1973) and SpoT to fatty acid (Seyfzadeh et al., 1993), iron (Vinella et al., 2005), and carbon limitation. The Bacteroides lineage has also (independently) duplicated its ancestral RSH gene, although the spectrum and enzyme specificity of (p)ppGpp-inducing environmental cues remain undefined in these organisms.
In the gut, bacteria could be exposed to temporary nutrient and iron shortages, high or low oxygen and CO2 levels, and high bacterial densities. The striking similarities between the transcriptional profiles of the B. thetaiotaomicron ppGpp0 strain during in vitro carbon starvation and in vivo colonization suggest that carbon starvation might challenge bacteria in the gut, even though the mice are fed ad libitum. In fact, the set of pathways differentially regulated between in vitro carbon-replete conditions and either carbon starvation or gut colonization are almost identical (Figures S3A and S3B). Pathways upregulated upon glucose removal in vitro and gut colonization (glycan degradation, sphingolipid metabolism, and others) are largely (p)ppGpp-independent, while (p)ppGpp primarily signals cells to stop growing by downregulating numerous biosynthetic pathways. The ppGpp0 strain, which retains the ability to upregulate many of the same genes as the wild-type strain and adjust metabolite levels (with AKG as a notable exception) but lacks the ability to inhibit biosynthetic genes, rapidly loses viability during carbon starvation and exhibits a drastic fitness defect in the gut.
Several pathogenic bacteria require (p)ppGpp to colonize the lungs (Dahl et al., 2003; Kazmierczak et al., 2009) and intestines (Haralalka et al., 2003; Pizarro-Cerdá and Tedin, 2004), which has been mainly attributed to the inability of (p)ppGpp-deficient mutants to produce virulence factors. In addition to activating virulence factor production, (p)ppGpp is also associated with antibiotic resistance in diverse pathogens, making it an attractive drug target (Gaca et al., 2015). Indeed, several antibacterial agents have been reported to inhibit (p)ppGpp production and interfere with pathogenic infections (de la Fuente-Núñez et al., 2014; Wexselblatt et al., 2012). Our results suggest that molecules that inhibit (p)ppGpp might invoke an antibiotic rather than anti-virulence effect that could have a significant impact on the resident microbiota. Overall, we conclude that the ability to halt growth is a counter-intuitive but important requirement for intentional introduction of new members to the microbiome.
STAR★METHODS
Detailed methods are provided in the online version of this paper and include the following:
KEY RESOURCES TABLE.
| REAGENT or RESOURCE | SOURCE | IDENTIFIER |
|---|---|---|
| Bacterial and Virus Strains | ||
| E. coli S17-1 lambda pir | ATCC | ATCC BAA-2428 |
| B. thetaiotaomicron VPI-5482 tdk | PMID_18611383 | N/A |
| B. thetaiotaomicron VPI-5482 tdk Δbt0700 | This study | N/A |
| B. thetaiotaomicron VPI-5482 tdk Δbt0700Δbt3998 | This study | N/A |
| B. thetaiotaomicron VPI-5482 tdk att1::pNBUBC21 | This study | N/A |
| B. thetaiotaomicron VPI-5482 tdk Δbt0700 att1::pNBUBC14 | This study | N/A |
| B. thetaiotaomicron VPI-5482 tdk Δbt0700Δbt3998 att1::pNBUBC22 | This study | N/A |
| Bacteroides thetaiotaomicron VPI 5482 | ATCC | ATCC 29148 |
| Bacteroides vulgatus NCTC11154 | ATCC | ATCC 8482 |
| Bacteroides caccae VPI 3452A | ATCC | ATCC 43185 |
| Bacteroides ovatus NCTC11153 | ATCC | ATCC 8483 |
| Bacteroides uniformis VPI 0061 | ATCC | ATCC 8492 |
| Prevotella copri 18205 | DSM | DSM 18205 |
| Parabacteroides distasonis | ATCC | ATCC 8503 |
| Bifidobacterium adolescentis | DSM | DSM 20083 |
| Collinsella aerofaciens VPI 1003 | ATCC | ATCC 25986 |
| Clostridium scindens VPI 13733 | ATCC | ATCC 35704 |
| Dorea longicatena 111-35 | DSM | DSM 13814 |
| Eubacterium rectale VPI 0990 | ATCC | ATCC 33656 |
| Blautia obeum VPI B3-21 | ATCC | ATCC 29174 |
| Chemicals, Peptides, and Recombinant Proteins | ||
| Guanosine tetraphosphate, ppGpp | TriLink | Cat#N-6001 |
| Phosphorus-32 Radionuclide, as dipotassium phosphate | PerkinElmer | Cat#NEX055002MC |
| PEI-cellulose TLC plates | Sigma-Aldrich | Cat#Z122882-25EA |
| Durapore membrane filters 0.45um HV | Millipore | Cat#HLVP02500 |
| D-glucose (U-13C6, 99%) | Cambridge Isotope Laboratories | Cat#CLM 1396 PK |
| L-glutamine (13C5, 99%) | Cambridge Isotope Laboratories | Cat#CLM-1822-H-0.25 |
| Sodium acetate (1,2-13C2, 99%) | Cambridge Isotope Laboratories | Cat#CLM-440-1 |
| Dimethyl 2-oxoglutarate | Sigma-Aldrich | Cat#349631-5G |
| Critical Commercial Assays | ||
| RNAProtect | Qiagen | Cat#76526 |
| RNeasy Mini kit | Qiagen | Cat#74106 |
| Baseline-ZERO DNase | Epicentre | Cat#DB0715K |
| Ribo-Zero rRNA Removal Kit (Gram-Negative Bacteria) | Illumina | Cat#MRZGN126 |
| ScriptSeq RNA-Seq Library Preparation Kit | Illumina | Cat#SSV21124 |
| Deposited Data | ||
| Raw RNAseq data | This study | ArrayExpress: E-MTAB-6412 |
| B. thetaiotaomicron VPI-5482 reference genome (NC_004663) | PMID_12663928 | https://www.ncbi.nlm.nih.gov/nuccore/NC_004663 |
| Experimental Models: Organisms/Strains | ||
| Mouse: Swiss Webster | Taconic | Tac: SW-F.
SW-M. RRID:IMSR_TAC:sw |
| Oligonucleotides | ||
| Bt0700A-F forward primer for the flanking region A: TATCGAATTCCTGCAGCCGATTGTGACCAGGCTTTA | This study | N/A |
| Bt0700A-R reverse primer for the flanking region A: CGTCGAATTAACAAGATTGAATATGTAAGCACTCTATGCTAACAACAAATC | This study | N/A |
| Bt0700B-F forward primer for the flanking region B: GATTTGTTGTTAGCATAGAGTGCTTACATATTCAATCTTGTTAATTCGACG | This study | N/A |
| Bt0700B-R reverse primer for the flanking region B: GGCGGCCGCTCTAGAGTTCGCGATGTTCGGTAGAG | This study | N/A |
| BT3998A-F forward primer for the flanking region A: TATCGAATTCCTGCAGATTCGGGAATGGACTTCTCC | This study | N/A |
| BT3998A-R reverse primer for the flanking region A: CGAATGAAAGGATAACGAATATGTAATTTATCGTCCGTCCAGTTC | This study | N/A |
| BT3998B-F forward primer for the flanking region B: GAACTGGACGGACGATAAATTACATATTCGTTATCCTTTCATTCG | This study | N/A |
| BT3998B-R reverse primer for the flanking region B: GGCGGCCGCTCTAGACGCCCGTTACTTGAAAGAGA | This study | N/A |
| Uni-R: CACAATATGAGCAACAAGGAATCC | PMID_18996345 | N/A |
| BC21-F: ATGTTCGATCATCAGTTCAGTAGC | P. Degnan | N/A |
| BC14-F: GGCACGCCATTCTTCATCTAACTG | PMID_18996345 | N/A |
| BC22-F: ATCGTACAAGTTATACACCGTTGC | P. Degnan | N/A |
| Recombinant DNA | ||
| pExchange_tdk | PMID_18611383 | N/A |
| pExchange_tdk_Δbt0700 | This study | N/A |
| pExchange_tdk_Δbt3998 | This study | N/A |
| pBNUBC21 | P. Degnan | N/A |
| pBNUBC14 | PMID_18996345 | N/A |
| pBNUBC22 | P. Degnan | N/A |
| Software and Algorithms | ||
| DESeq2 | PMID_25516281 | |
| EDGE-Pro | PMID_23531787 | |
| PATRIC database (BLAST analysis) | PMID_27899627 | https://www.patricbrc.org/ |
| Cytoscape v3.4.0 | PMID_14597658 | http://cytoscape.org |
| MassHunter Quantitative Analysis Software, version 6.0 | Agilent | |
| MatLab 2013 | Mathworks | |
| K-Shortest Path - Yen’s algorithm | Meral Shirazipour, 2011 | http://www.mathworks.com/matlabcentral/fileexchange/32513-k-shortest-path-yen-s-algorithm |
CONTACT FOR REAGENT AND RESOURCE SHARING
Requests for further information and resources may be directed to and will be fulfilled by Lead Contact Andrew Goodman (andrew. goodman@yale.edu).
EXPERIMENTAL MODEL AND SUBJECT DETAILS
Microbial Strains and Growth Conditions
Bacteroides thetaiotaomicron VPI-5482 tdk (Koropatkin et al., 2008) was cultured anaerobically at 37°C in liquid TYG medium (Holdeman et al., 1977), glucose minimal medium [0.5% glucose, 100 mM KH2PO4 (pH 7.2), 15 mM NaCl, 8.5 mM (NH4)2SO4, 0.5 g L−1 cysteine, 0.2 mM histidine, 1.9 μM hematin, 100 mM MgCl2, 1.4 mM FeSO4, 50 mM CaCl2, 1 mg mL−1 vitamin K3, and 5 ng mL−1 vitamin B12] (Martens et al., 2008), amino acid free glucose minimal medium [in which cysteine is replaced by 4 mM dithiothreitol and 4 mM Na2S, histidine removed and hematin replaced by Hemin-HCl] or on brain heart infusion (BHI; Becton Dickinson) agar supplemented with 10% horse blood (Quad Five). An anaerobic chamber (Coy Laboratory Products) containing 20% CO2, 10% H2, and 70% N2 was used for all anaerobic microbiology procedures. Escherichia coli S17-1 λ pir was cultured aerobically in LB medium at 37°C. Antibiotics were added, when appropriate, at the following final concentrations: ampicillin 100 μg mL−1, gentamicin 200 μg mL−1, erythromycin 25 μg mL−1, and tetracycline 2 μg mL−1.
Gnotobiotic Animal Experiments
All experiments using mice were performed using protocols approved by the Yale University Institutional Animal Care and Use Committee. Germ-free Swiss Webster mice were maintained in plastic gnotobiotic isolators with a 12 hour light/dark cycle. Individually caged animals (n = 5 per group, littermates of mixed sex were randomly assigned to experimental groups) were fed a standard, autoclaved mouse chow (5K67 LabDiet, Purina) ad libitum. In all experiments, mice were 12–21 weeks of age at the time of gavage; within an experiment, mice were age-matched within 2 weeks.
METHOD DETAILS
Genetic Techniques
DNA purification, PCR, and restriction cloning were performed using standard methods. Primer sequences are provided in Key Resources Table. In-frame, unmarked, nonpolar deletions were generated using a counterselectable allelic exchange procedure (Koropatkin et al., 2008) and confirmed by sequencing. Oligonucleotide barcodes in pNBU2 vectors were introduced into the genome in single copy as described (Martens et al., 2008).
In Vitro Growth Assays
Individual colonies from BHI-blood agar plates were cultured in amino acid-free glucose minimal medium with and without supplementation with 20 amino acids at 0.5 mM each for 16 hours, and back-diluted to OD600=0.0005. Bacterial growth rates were calculated from OD600 measurements collected over 30 hours on a Biotek Eon Microplate Spectrophotometer and significant differences were determined by Tukey’s HSD test.
Survival Assays during Carbon Starvation
Individual colonies from BHI-blood agar plates were cultured in glucose minimal medium in triplicate for 16 hours, and back-diluted to OD600=0.0001. After reaching OD600=0.4, cultures were pelleted and washed once in pre-warmed minimal medium without glucose, resuspended in pre-warmed minimal medium without glucose, and incubated for up to 100 hours at 37°C under anaerobic conditions. Cell viability was monitored by CFU (colony forming unit) counting on BHI-blood agar plates. Significant differences were determined by repeated measures ANOVA and post hoc Tukey’s HSD test.
Mouse Colonization Experiments
For the competition experiments, barcoded bacterial strains were cultured individually for 16 hours in glucose minimal medium, combined (1:10:10 wildtype:bt0700:ppGpp0 strains) and 108 CFUs were administered to each animal by oral gavage. For the community co-colonization experiments, animals were colonized with 108 CFU of each species in the 6- or 7-member human commensal communities described in Table S3 together with 108 CFUs of combined (1:10:10 wildtype:bt0700:ppGpp0) barcoded B. thetaiotaomicron strains. Fecal samples were collected over a time course of 15–24 days and frozen immediately at −80°C. For monocolonization studies, animals were colonized with 108 CFUs of a single bacterial culture, fecal samples were collected over 6 days and frozen immediately at −80°C. Total gDNA was recovered from the gavage material and fecal samples, and strain abundances were determined using qPCR targeting strain-specific barcodes or genes as described (Cullen et al., 2015). Significant differences were determined by repeated measures ANOVA and post hoc Tukey’s HSD test. In the sequential colonization experiments, significant differences were determined by t-test with FDR adjustment for multiple hypotheses testing with Benjamini-Hochberg procedure. For the RNAseq measurements, monocolonized mice were euthanized 6 days after gavage, cecal material was collected, immediately frozen in liquid nitrogen and stored at −80°C until further processing.
RNAseq Sample Preparation and Analysis
In Vitro Sample Preparation
For in vitro RNAseq measurements, individual colonies from BHI-blood agar plates where cultured in glucose minimal medium in triplicate for 16 hours, and back-diluted to OD600=0.0001. After reaching OD600=0.4, 5 mL of culture were combined with 10 mL RNAProtect (Qiagen), vortexed for 5 seconds, incubated for 2 minutes, pelleted by spinning for 2 minutes at 7,000 G and the pellet was stored at −80°C until further processing. For starvation profiling, 5 mL of the same culture were pelleted anaerobically by spinning at 7,000 G for 30 seconds, resuspended in 20 mL of pre-warmed minimal medium without glucose, pelleted and resuspended in 10 mL of the same medium, and incubated at 37°C under anaerobic conditions. After 1 hour, 5 mL of culture were collected, combined with RNAProtect and processed as described above. RNA was purified by resuspending cell pellets in 200 μl lysis buffer (10mM tris, 1mM ETDA, 5 mg mL−1 lysozyme (Sigma), 12.5 μg mL−1 proteinase K (pH=8.0) followed by incubation at room temperature (RT) for 10 minutes. RNA was cleaned using an RNeasy Mini kit (Qiagen) with on column DNase I treatment, followed by treatment with Baseline-ZERO DNase (Epicentre), and a second cleaning by RNeasy Mini.
In Vivo Sample Preparation
For in vivo RNAseq measurements, aliquots of ~100 mg of frozen cecal samples were thawed in 1 mL of RNAProtect, resuspended, incubated at RT for 2 minutes, and pelleted by centrifugation for 1 minute at 15,000 G at 4°C. RNA was then purified as described (Rey et al., 2010). Briefly, pellets were resuspended in a solution containing 250 μL of acid-washed glass beads (Sigma-Aldrich), 500 μL of extraction buffer A (200 mM NaCl, 20 mM EDTA), 210 μL of 20% SDS, and 500 μL of phenol:chloroform:isoamyl alcohol (125:24:1, pH 4.5; Ambion), and lysed in a bead beater (BioSpec Products). Cellular debris was removed by centrifugation (8,000 G, 3 min). The extraction was repeated, and the nucleic acids were precipitated with isopropanol and sodium acetate (pH 5.5). The crude extracts were cleaned by RNeasy Mini (Qiagen) with on column DNase I treatment, treated with Baseline-ZERO DNase (Epicentre), and cleaned again by RNeasy Mini. Four RNA extracts per mouse were pooled. For both in vitro and in vivo samples, RNA quality was assayed on 2100 Bioanalyzer (Agilent), and only samples with RIN score above 8 were used for RNAseq measurements.
Preparation and Sequencing of mRNA Libraries
rRNA was depleted using the Ribo-zero rRNA removal kit for gram-negative bacteria (Illumina). RNAseq libraries were prepared using ScriptSeq v2 kit (Illumina) with multiplexing, as recommended by the manufacturer. RNAseq measurements were performed at the Yale Center for Genome Analysis using a HiSeq2000 sequencer and 1x75 bp sequencing to generate ~10–30 million reads per sample.
(p)ppGpp Labeling
Cells were cultured anaerobically in low phosphate glucose minimal medium [0.5% glucose, 1.5 mM KH2PO4 (pH 7.2), 2X MOPS (pH 7.2) 15 mM NaCl, 8.5 mM (NH4)2SO4, 4 mM L-Cysteine, 5 ng mL−1 haemin chloride, 100 mM MgCl2, 1.4 mM FeSO4, 50 mM CaCl2, 1 mg mL−1 vitamin K3, and 5 ng mL−1 vitamin B12]. After reaching OD600=0.25, 960 μL of culture were removed from the anaerobic chamber for the remainder of the experiment in a microcentrifuge tube, supplemented with 40 μL of 2550 μCi mL−1 KH232PO4 (PerkinElmer, Waltham, MA, USA), and incubated at 37°C for 2 hours. At this point, a 160 μl aliquot was removed and nucleotides were extracted. The remaining culture was pelleted, resuspended in pre-warmed low phosphate minimal medium without glucose, incubated for 1 hour at 37°C, and nucleotides were extracted from 160 μl of culture. Nucleotides were extracted by the addition of 40 μL 10 M ice-cold formic acid plus glass beads, 15 seconds vortexing, incubation on ice for 20 minutes, 5 seconds vortexing, and incubation on dry ice for 20 minutes. These samples were thawed, vortexed for 5 seconds, and centrifuged for 1 minute at 20,000 G to remove cell debris. To analyze labeled nucleotides by thin-layer chromatography, 3 μL of extract was spotted on PEI-cellulose TLC sheets (Sigma) and developed in 1.5 M KH2PO4 (pH 3.9). TLC plates were imaged with a Typhoon Phosphoscanner and analyzed with QuantityOne software.
Metabolomics Experiments
Sample Preparation
Intracellular metabolites were extracted in the anaerobic chamber at 37°C as previously described (Link et al., 2013). In brief, biomass equivalents corresponding to 1 mL bacterial culture at OD600 2.0 were filtered through 0.45 μm filter membranes (HVLP, Millipore, Billerica, MA, USA) prewarmed with medium, and filtered bacteria were washed with 2 mL prewarmed, fresh medium. Filters were rapidly transferred to 2 mL of extraction solution (acetonitrile:methanol:water (2:2:1), 100 mM formic acid) and 200 μL of 13C-labeled internal standard were added. Extraction solutions were kept at −20°C for 1 hour, dried under vacuum at 22°C, resuspended in 60 μL H2O, centrifuged for 1 minute at 21,000 G, and supernatant was removed for further analysis.
Targeted Metabolomics
Targeted metabolite quantification was carried out using an Agilent 1290 UHPLC system coupled to an Agilent 6490A QqQ mass spectrometer. Chromatographic separation was performed on a Luna NH2 column (Phenomenex, 50 x 3 mm, 3 μm particle size) using mobile phase A: 20 mM ammonium acetate buffer (pH 9.45) with 5% acetonitrile and B: acetonitrile (Bajad et al., 2006). 7.5 μL of sample were injected at 15% B followed by a linear gradient to 50% B over 3 min and to 98% over 17 min with subsequent isocratic conditions at 98% for 12 min. The flow was kept constant at 0.6 mL min−1 and the column was re-equilibrated at starting conditions for 8 min. The QqQ was operated in negative ionization mode using dynamic MRM scan settings with the following source parameters: VCap: 3500 V, nozzle voltage: 2000 V, gas temperature: 275°C; drying gas 12 L min−1; nebulizer: 35 psig; sheath gas temperature 275°C; sheath gas flow 12 L min−1. MRM parameters were optimized for each compound (Table S5) separately following the manufacturer’s recommendation using direct injection of chemical standards. 13C-labeled internal standard solution was prepared from E. coli MG1655 cultured in M9 minimal medium [22 mM KH2PO4, 22 mM Na2HPO4, 85 mM NaCl, 0.1% NH4Cl, 0.2 mM MgSO4, 0.1 mM CaCl2, 0.4% [U-13C]-glucose (Cambridge Isotope Laboratories)]. After reaching OD600=0.6, cells were filtered and extracted as described above at a ratio of 20 OD600 to 2 mL of extraction solution. The MassHunter Quantitative Analysis Software (Agilent, version 6.0) was used for peak integration and quantification was based on calibration curves using chemical standards and the signal intensity of the internal standard spiked into each sample.
Untargeted Metabolomics
Untargeted metabolomics was carried out using an Agilent 1290 UHPLC system coupled to an Agilent 6550 qTOF mass spectrometer. Chromatographic separation was performed on a ZIC-pHILIC column (Merck, 150 mm × 2.1 mm, 5 μm particle size) using mobile phase A: 10 mM ammonium carbonate buffer (pH 9.3) and B: acetonitrile. 3 μL of sample were injected at 80% B and 0.1 mL min−1 flow followed by a linear gradient to 50% B over 20 min and 0.1 mL min−1 flow (Chaleckis et al., 2014). The column was re-equilibrated at starting conditions for 8 min. The qTOF was operated in positive (50 – 1000 m/z) and negative (50 – 1050 m/z) scanning mode and source parameters optimized following the manufacturer’s recommendations: VCap: 3500 V, nozzle voltage: 2000 V, gas temp: 225°C; drying gas 13 L min−1; nebulizer: 20 psig; sheath gas temp 225°C; sheath gas flow 12 L min−1. Online mass calibration was performed using a second ionization source and a constant flow (5 μL min−1) of reference solution (positive mode: 121.0509 and 922.0098 m/z and negative mode: 112.9856 and 1033.9881 m/z).
13C Labeling Experiments
Growth Experiments
To monitor carbon flux during growth in glucose, cells were cultured in minimal medium with 0.3% unlabeled glucose to OD600=0.4 in an anaerobic chamber heated to 37°C and transferred to a prewarmed filter membrane as described for metabolomics extractions. Medium switch was performed under continual flow of minimal medium with 0.3% of 100% [U-13C]-glucose (Cambridge Isotope Laboratories CLM-1396-PK) for up to 5 minutes, and metabolites were extracted after 10, 20, 40, 80, 160 and 320 seconds as described above (without the spike-in of the 13C labeled internal standard). The acetate growth shift experiment was conducted following the same procedure, with the cells grown in minimal medium containing 0.3% unlabeled glucose and 0.1% unlabeled acetate and switched to medium containing 0.3% unlabeled glucose and 0.1% of 100% [U-13C]-acetate (Cambridge Isotope Laboratories).
Starvation Experiments
To monitor carbon flux from acetate during starvation, cells were cultured in minimal medium with 0.3% unlabeled glucose and 0.1% of 100% [U-13C]-acetate to OD600=0.4, pelleted, washed twice in minimal medium without glucose containing 0.1% of 100% [U-13C]-acetate, and incubated in the same medium for up to 20 hours. Metabolites were extracted at 1, 5, 15 and 19 hours as described for metabolomics measurements (without the 13C internal standard). To monitor carbon flux from glutamine during starvation, cells were cultured in minimal medium lacking (NH4)2SO4 in the presence of 0.3% unlabeled glucose and 1mM unlabeled glutamine as the sole nitrogen source, grown to OD600=0.4, pelleted, and washed twice in the same minimal medium except unlabeled glucose and glutamine were omitted and 0.25 mM 100% [U-13C]-glutamine (Cambridge isotope Laboratories) was included. Cultures were incubated in this medium for up to 20 hours. Metabolites were extracted at 1, 3, 5, 9, and 20 hours as described for metabolomics measurements (without the 13C internal standard). Metabolite isotopomers were quantified by LC-MS/MS as described for targeted metabolomics measurements using separate transitions for each possible mass isomer. Isotope fractions were calculated by normalizing each isotopomer intensity by the sum of intensities of all isotopomers detected for the same metabolite.
Alpha-Ketoglutarate and Glutamine Supplementation Experiments
To test the effect of AKG supplementation on growing cells, B. thetaiotaomicron wildtype and ppGpp0 strains were cultured in glucose minimal medium to OD600=0.1 and supplemented with 1 mM dimethyl-AKG from a 1 M DMSO stock (Sigma). Growth was monitored for 8 hours by OD600 measurements with a microplate spectrophotometer (Biotek Eon). To test the effect of AKG and glutamine on B. thetaiotaomicron viability during starvation, wildtype and ppGpp0 strains were grown in glucose minimal medium to OD600=0.3. Each culture was divided into three subcultures and supplemented with 1 mM of either dimethyl-AKG, DMSO as a dimethyl-AKG vehicle control, or glutamine. After 30 minutes, cells were pelleted and washed twice in minimal medium lacking glucose and supplemented with 1 mM dimethyl-AKG, DMSO, or glutamine to match the 30 minute incubation of that culture. Cultures were resuspended in the same medium and incubated for 40 hours. Cell viability was monitored by CFU counting on BHI-blood plates. Metabolites were extracted by filtration as described for metabolomics experiments from ppGpp0 samples before and 0, 1, 3, 5, 10 and 20 hours after the wash step and measured with liquid chromatography-coupled mass spectrometry (LC-qTOF).
QUANTIFICATION AND STATISTICAL ANALYSIS
BLAST Alignment of (p)ppGpp Synthases
Nucleotide sequence alignment to (p)ppGpp synthetase/hydrolase RelSeq gene from Gammaproteobacterium Streptococcus equisimilis (Table S1) was performed using BLAST service of the PATRIC database (Wattam et al., 2017) for reference genomes of B. thetaiotaomicron, B. ovatus, B. eggerthii, B. uniformis, and B. vulgatus.
Analysis of Starvation and Competition Assays
Growth, starvation and mouse colonization datasets were analyzed in MatLab 2013 (Mathworks). Growth rates of WT, bt0700 and ppGpp0 strains were compared with Tukey’s HSD test (multcompare function with ‘hsd’ option). Time-course starvation and mouse colonization data were analyzed with repeated measures ANOVA (ranova function). Statistical significance of pairwise comparisons between genotypes within each timepoint was assessed with Tukey’s HSD test. P-values were adjusted for multiple hypothesis testing with Benjamini-Hochberg procedure (mafdr function with ‘bhfdr’ option). P-values, FDR and n values are indicated in the associated figure legends for each figure and in Tables S3, S4, S5, S6, and S7.
RNAseq Data Mapping
RNAseq sequences were aligned to the B. thetaiotaomicron VPI-5482 reference genome (NC_004663) (Xu et al., 2003) using EDGE-Pro (Magoc et al., 2013) and reads were normalized using DESeq2 (Love et al., 2014).
Metabolomic Data Filtering and Annotation
Ions were annotated to metabolites based on exact mass considering [M-H+] and [M+H+] ions using the metabolite reference list compiled from the Kyoto Encyclopedia of Genes and Genomes (KEGG) metabolite repository bth (B. thetaiotaomicron) (Ogata et al., 1999). Ions were assigned to metabolites allowing a mass tolerance of 1 mDa and an intensity cutoff of 5,000 counts. Reference retention times of pure chemical standards measured with the same settings were used for annotation, when available. Raw intensity values were quantile-normalized with quantnorm function in MatLab 2013a (MathWorks). For each metabolite, only the annotation with the top score was retained. The concentration of intercellular ppGpp was determined by LC-qTOF using the procedure described above and a standard curve established using a pure ppGpp standard (TriLink) with a linear detection range of 1 nM – 1 μM.
RNAseq and Metabolomics Data Analysis
Metabolomics and RNAseq data were imported into MatLab 2013a (MathWorks) for quantitative and statistical analysis. Principal component analysis was performed on log2-transformed RNAseq data normalized by mean expression of each gene with the pca function in MatLab. For differential analysis, pairwise comparisons were performed with log2-transformed normalized RNAseq reads between genotypes in each condition, and between conditions within each genotype using Welch test (t-test with unequal variances) with two to four biological replicates per condition. Log2-transformed normalized metabolite intensities were compared between genotypes in each condition, and between conditions within each genotype using Welch test with three biological replicates per condition. P-values were corrected for multiple hypotheses testing by calculating the false-discovery rate (FDR) with the Benjamini-Hochberg procedure (mafdr function in MatLab).
Pathway Enrichment Analysis
For pathway enrichment analysis, pathway descriptions were downloaded from the KEGG database, and the gene set enrichment analysis (GSEA) method (Subramanian et al., 2005) was applied as described (Zimmermann et al., 2017). Significantly changing transcripts and metabolites (|log2(fold change)| ≥1, FDR ≤0.05 for transcripts and |log2(fold change)| ≥log2(1.5), FDR ≤ 0.05 for metabolites) were ranked either by fold change or by FDR, and enrichment p-values were calculated with the Fisher exact test for each subset of size varying from 1 to the total changing set size. For each pathway, the smallest p-value of all the subsets was retained, and p-values were adjusted for multiple hypotheses testing by calculating FDR with the Benjamini-Hochberg procedure. In AKG supplementation experiments, pathway enrichment was performed for metabolites that follow each of the rules: 1) |log2(fold change in starvation versus growth)| ≥ log2(1.5) in at least 3 time points either with or without AKG supplementation; 2) |log2(fold change in starvation with AKG compared to no AKG)| ≥ log2(1.5) in at least 3 time points; 3) area between the metabolite profile curves with and without AKG supplementation ≥ 50% of the total area. Metabolites were sorted according to the area under the curve difference between conditions in descending order.
Reaction Pair Network Analysis
For KEGG reaction pair network analysis, the KEGG reaction pair list, KEGG reaction pair – B. thetaiotaomicron gene association list, and KEGG compound list were downloaded from KEGG API (application programming interface) (http://rest.kegg.jp/, accessed July 2015), and only the main (substrate-product) reaction pairs were retained. These datasets were used to define the list of metabolites involved in reactions associated with each gene. A gene-gene connectivity matrix was built based on the metabolites associated with the genes (if two genes are associated with reactions sharing a metabolite, they are connected through this metabolite). K-shortest path script based on Yen’s algorithm (Yen, 1971) (implementation by Meral Shirazipour (2011) K-Shortest Path - Yen’s algorithm http://ninwww.mathworks.com/matlabcentral/fileexchange/32513-k-shortest-path-yen-s-algorithm, accessed July 2015) was used to calculate the shortest paths between two genes based on the connectivity matrix. All paths of length four and more which connect ppGpp0-specific changing genes (|log2(fold change)| ≥1, FDR ≤0.05 in ppGpp0 compared to wildtype and bt0700, but not between wildtype and bt0700 in vivo, one unchanged reaction allowed) were represented as a table and visualized in Cytoscape software (Cytoscape 3.4.0) (Shannon et al., 2003). Subnetworks were manually grouped and assigned to KEGG pathways for better visualization.
DATA AVAILABILITY
The raw RNAseq data have been deposited in the EMBL-EBI European Nucleotide Archive under accession no. E-MTAB-6412. The metabolomics data are provided in Tables S5, S6, and S7.
Supplementary Material
Figure S1 (related to Figure 1). Characterization of B. thetaiotaomicron (p)ppGpp synthetase-hydrolase proteins. (A) Genomewide transposon mutagenesis of Bacteroidetes strains produces distinct transposon insertion patterns in RSH homologue genes, suggesting that the non-hit homologues are essential for viability in the wildtype background. Transposon insertion sites (TA dinucleotide sequences) were identified by Insertion Sequencing (INSeq). Error bars indicate standard deviation of n=3 replicates. (B) (p)ppGpp to GTP ratios in B. thetaiotaomicron wildtype and bt0700 strains measured by TLC analysis of 32P-labeled cultures after two hours in glucose replete (+) or deplete (−) medium. Quantification is based on radiolabeled spot intensity of nucleotide extracts separated by TLC; error bars indicate standard deviation of n=3 replicates. (C) LC-qTOF quantification of ppGpp concentration in wildtype B. thetaiotaomicron after 1 or 3 hours of carbon starvation. ppGpp levels at time point 0 were below the detection limit. Error bars indicate standard deviation of n=3–4 replicates.
Figure S2 (related to Figure 2). Effect of bt0700 deletion on long-term fitness in vivo. Relative abundance of WT, bt0700 and ppGpp0 strains in fecal samples of gnotobiotic mice colonized with these isogenic strains together and measured over 24 days (error bars indicate standard deviation of n=5 replicates, * FDR<0.05, Tukey’s HSD test with Benjamini-Hochberg FDR correction).
Figure S3 (related to Figures 3 and 4). Pathways changing between stress and growth conditions in wildtype and ppGpp0 strains. KEGG pathway enrichment analysis of (A) differentially expressed genes (measured by RNASeq) between starvation and growth conditions in WT, bt0700 and ppGpp0 strains and B) differentially expressed genes (measured by RNAseq) between in vivo and in vitro growth conditions in WT, bt0700, and ppGpp0 strains. Pathways are displayed if the enrichment p-value (FDR adjusted with Benjamini-Hochberg procedure) is <0.01 in at least one condition; black – n.s. (not significant). M. – metabolism, b. – biosynthesis. Pathways differently changing in the WT and bt0700 strains compared to ppGpp0 are marked in red.
Figure S4 (related to Figure 5). Labeled isotopologue fractions of metabolites collected from B. thetaiotaomicron ppGpp0 cultures during growth and starvation. (A) Schematic representation of growth shift experiment with 13C-labeled medium. (B) Growth curves of wildtype (left) and ppGpp0 (right) strains in minimal medium with glucose, acetate or glutamine as the sole carbon source. Error bars indicate standard deviation of n=3 replicates. (C) Labeled isotopologue fractions of metabolites detected with LC-MS/MS during [U-13C] glucose shift experiments in the B. thetaiotaomicron ppGpp0 strain. (D) Labeled isotopologue fractions of metabolites in the ppGpp0 strain during shift from growth with [U-12C] glucose and [U-12C] glutamine to starvation in the presence of [U-13C] glutamine. [M+X] indicates the number of 13C-labeled carbon atoms in an isotopologue of a metabolite (maximal value of X is the number of carbons in the molecule). 13C isotopologue fractions reflect the proportions of differently labeled isotopologues in the total pool of a metabolite. Notably, the fraction of labeled glutamate is significantly (p < 0.01, Student’s t-test) larger in the ppGpp0 mutant than in the wildtype strain starting after 9 h of carbon starvation, whereas the labeling patterns of other metabolites are not different from the wildtype strain. The higher labeling fraction detected in glutamate could be explained by a lower flux from unlabeled succinate to AKG and glutamate in the ppGpp0 strain. However, (p)ppGpp-dependent differences in cell viability 3 hours after carbon limitation (Figure 1D) may also contribute to these labeling patterns.
Figure S5 (related to Figure 6). Effect of AKG supplementation on levels of amino acid and purine metabolism intermediates in the ppGpp0 mutant during starvation. (A) Amino acid and (B) purine metabolism intermediates in B. thetaiotaomicron ppGpp0 measured with LC-qTOF mass spectrometry over the time course of starvation, with or without AKG supplementation. Time point -1 corresponds to steady state growth prior to addition of AKG. Error bars indicate standard deviation of 3 replicates, where applicable. AKG, Alpha-ketoglutarate; FGAM, 2-(Formamido)-N1-(5′-phosphoribosyl) acetamidine.
Table S1. Related to Figure 1. Sequence alignment of Bacteroides genes homologous to (p)ppGpp synthetase/hydrolase from Gammaproteobacterium Streptococcus equisimilis (RelSeq).
Table S2. Related to Figure 1. Numbers of resolved merodiploids tested and mutants confirmed in attempts to delete bt0700, bt3998 and both genes from B. thetaiotaomicron. Nonpolar, unmarked deletions of the complete open reading frame of each gene were made by allelic exchange.
Table S3. (related to Figures 1, 2 and 6) Starvation and mouse colonization survival data.
Table S4. (related to Figures 3 and 4) RNAseq analysis for wildtype, bt0700 and ppGpp0 strains during growth in glucose minimal medium before and after 1 hour carbon starvation, and in the cecal contents of gnotobiotic mice.
Table S5. (related to Figure 4) Metabolomics analysis for wildtype and ppGpp0 strains during growth in glucose minimal medium before and after 1 hour carbon starvation.
Table S6. (related to Figure 5) 13C labeling data for wildtype and ppGpp0 strains during growth and starvation.
Table S7. (related to Figure 6) Metabolomics analysis for the ppGpp0 strain over 20 hours of carbon starvation with and without dimethyl-AKG supplementation.
Highlights.
Gut commensal B. thetaiotaomicron uses alarmone (p)ppGpp to shift from growth to stasis
(p)ppGpp is required for colonization in the gut of freely fed mice
The (p)ppGpp-dependent response is recapitulated during carbon starvation in vitro
(p)ppGpp is required to elevate α-ketoglutarate, which prolongs starvation survival
Acknowledgments
We thank E. Groisman, H. Kornberg, and members of the Goodman lab for helpful discussions. This work was supported by NIH grants GM105456, GM103574, GM118159, AI124275, the Burroughs Wellcome Fund, and the HHMI Faculty Scholars Program to A.L.G. M.Z.-K. and M.Z. received Early Postdoc Mobility Fellowships from the Swiss National Science Foundation (P2EZP3_178482 and P2EZP3_162256, respectively) and M.Z. received a Long-Term Fellowship (ALTF 670-2016) from the European Molecular Biology Organization.
Footnotes
Supplemental Information includes five figures and seven tables and can be found with this article online at https://doi.org/10.1016/j.chom.2018.06.002.
DECLARATION ON INTERESTS
The authors declare no competing interests.
AUTHOR CONTRIBUTIONS
Conceptualization: W.B.S., M.Z.-K., A.L.G.; Methodology: W.B.S., M.Z.-K., M.Z., N.A.B., A.L.G.; Formal analysis: M.Z.-K., W.B.S.; Investigation: W.B.S., M.Z.-K., M.Z., N.A.B.; Data curation: M.Z.-K., W.B.S.; Writing – Original Draft: M.Z.-K., W.B.S., A.L.G.; Writing – Review & Editing: M.Z.-K., W.B.S., M.Z., A.L.G.; Visualization: M.Z.-K., W.B.S.; Supervision: A.L.G.; Funding Acquisition: A.L.G., M.Z., M.Z.-K.
References
- Amador-Noguez D, Feng X-J, Fan J, Roquet N, Rabitz H, Rabinowitz JD. Systems-level metabolic flux profiling elucidates a complete, bifurcated tricarboxylic acid cycle in Clostridium acetobutylicum. J Bacteriol. 2010;192:4452–4461. doi: 10.1128/JB.00490-10. [DOI] [PMC free article] [PubMed] [Google Scholar]
- Atkinson GC, Tenson T, Hauryliuk V. The RelA/SpoT homolog (RSH) superfamily: distribution and functional evolution of ppGpp synthetases and hydrolases across the tree of life. PLoS One. 2011;6:e23479. doi: 10.1371/journal.pone.0023479. [DOI] [PMC free article] [PubMed] [Google Scholar]
- Bajad SU, Lu W, Kimball EH, Yuan J, Peterson C, Rabinowitz JD. Separation and quantitation of water soluble cellular metabolites by hydrophilic interaction chromatography-tandem mass spectrometry. J Chromatogr A. 2006;1125:76–88. doi: 10.1016/j.chroma.2006.05.019. [DOI] [PubMed] [Google Scholar]
- Baughn AD, Malamy MH. A mitochondrial-like aconitase in the bacterium Bacteroides fragilis: implications for the evolution of the mitochondrial Krebs cycle. Proc Natl Acad Sci USA. 2002;99:4662–4667. doi: 10.1073/pnas.052710199. [DOI] [PMC free article] [PubMed] [Google Scholar]
- Bojanova DP, Bordenstein SR. Fecal transplants: what is being transferred? PLoS Biol. 2016;14:e1002503. doi: 10.1371/journal.pbio.1002503. [DOI] [PMC free article] [PubMed] [Google Scholar]
- Boutte CC, Crosson S. The complex logic of stringent response regulation in Caulobacter crescentus: starvation signalling in an oligotrophic environment. Mol Microbiol. 2011;80:695–714. doi: 10.1111/j.1365-2958.2011.07602.x. [DOI] [PMC free article] [PubMed] [Google Scholar]
- Boutte CC, Crosson S. Bacterial lifestyle shapes stringent response activation. Trends Microbiol. 2013;21:174–180. doi: 10.1016/j.tim.2013.01.002. [DOI] [PMC free article] [PubMed] [Google Scholar]
- Braeken K, Moris M, Daniels R, Vanderleyden J, Michiels J. New horizons for (p)ppGpp in bacterial and plant physiology. Trends Microbiol. 2006;14:45–54. doi: 10.1016/j.tim.2005.11.006. [DOI] [PubMed] [Google Scholar]
- Cashel M, Gentry DR, Hernandez VJ, Vinella D. The stringent responseEscherichia coli and Salmonella. In: Neidhardt FC, Curtiss R III, Ingraham JL, Lin ECC, Low KB, Magasanik B, Reznikoff W, Riley M, Schaechter M, Umbarger AE, editors. Cellular and Molecular Biology. ASM Press; 1996. pp. 913–931. [Google Scholar]
- Chaleckis R, Ebe M, Pluskal T, Murakami I, Kondoh H, Yanagida M. Unexpected similarities between the Schizosaccharomyces and human blood metabolomes, and novel human metabolites. Mol Biosyst. 2014;10:2538–2551. doi: 10.1039/c4mb00346b. [DOI] [PubMed] [Google Scholar]
- Chen X, Alonso AP, Allen DK, Reed JL, Shachar-Hill Y. Synergy between 13C-metabolic flux analysis and flux balance analysis for understanding metabolic adaption to anaerobiosis in E. coli. Metab Eng. 2011;13:38–48. doi: 10.1016/j.ymben.2010.11.004. [DOI] [PubMed] [Google Scholar]
- Chin RM, Fu X, Pai MY, Vergnes L, Hwang H, Deng G, Diep S, Lomenick B, Meli VS, Monsalve GC, et al. The metabolite α-ketoglutarate extends lifespan by inhibiting ATP synthase and TOR. Nature. 2014;510:397–401. doi: 10.1038/nature13264. [DOI] [PMC free article] [PubMed] [Google Scholar]
- Cullen TW, Schofield WB, Barry NA, Putnam EE, Rundell EA, Trent MS, Degnan PH, Booth CJ, Yu H, Goodman AL. Antimicrobial peptide resistance mediates resilience of prominent gut commensals during inflammation. Science. 2015;347:170–175. doi: 10.1126/science.1260580. [DOI] [PMC free article] [PubMed] [Google Scholar]
- Dahl JL, Kraus CN, Boshoff HIM, Doan B, Foley K, Avarbock D, Kaplan G, Mizrahi V, Rubin H, Barry CE. The role of RelMtb-mediated adaptation to stationary phase in long-term persistence of Mycobacterium tuberculosis in mice. Proc Natl Acad Sci USA. 2003;100:10026–10031. doi: 10.1073/pnas.1631248100. [DOI] [PMC free article] [PubMed] [Google Scholar]
- Dalebroux ZD, Swanson MS. ppGpp: magic beyond RNA polymerase. Nat Rev Microbiol. 2012;10:203–212. doi: 10.1038/nrmicro2720. [DOI] [PubMed] [Google Scholar]
- Dalebroux ZD, Svensson SL, Gaynor EC, Swanson MS. ppGpp conjures bacterial virulence. Microbiol Mol Biol Rev. 2010;74:171–199. doi: 10.1128/MMBR.00046-09. [DOI] [PMC free article] [PubMed] [Google Scholar]
- Doucette CD, Schwab DJ, Wingreen NS, Rabinowitz JD. α-Ketoglutarate coordinates carbon and nitrogen utilization via enzyme I inhibition. Nat Chem Biol. 2011;7:894–901. doi: 10.1038/nchembio.685. [DOI] [PMC free article] [PubMed] [Google Scholar]
- Eymann C, Homuth G, Scharf C, Hecker M. Bacillus subtilis functional genomics: global characterization of the stringent response by proteome and transcriptome analysis. J Bacteriol. 2002;184:2500–2520. doi: 10.1128/JB.184.9.2500-2520.2002. [DOI] [PMC free article] [PubMed] [Google Scholar]
- Fischbach MA, Sonnenburg JL. Eating for two: how metabolism establishes interspecies interactions in the gut. Cell Host Microbe. 2011;10:336–347. doi: 10.1016/j.chom.2011.10.002. [DOI] [PMC free article] [PubMed] [Google Scholar]
- de la Fuente-Núñez C, Reffuveille F, Haney EF, Straus SK, Hancock REW. Broad-spectrum anti-biofilm peptide that targets a cellular stress response. PLoS Pathog. 2014;10:e1004152. doi: 10.1371/journal.ppat.1004152. [DOI] [PMC free article] [PubMed] [Google Scholar]
- Gaca AO, Colomer-Winter C, Lemos JA. Many means to a common end: the intricacies of (p)ppGpp metabolism and its control of bacterial homeostasis. J Bacteriol. 2015;197:1146–1156. doi: 10.1128/JB.02577-14. [DOI] [PMC free article] [PubMed] [Google Scholar]
- Glass TL, Holmes WM, Hylemon PB, Stellwag EJ. Synthesis of guanosine tetra- and pentaphosphates by the obligately anaerobic bacterium Bacteroides thetaiotaomicron in response to molecular oxygen. J Bacteriol. 1979;137:956–962. doi: 10.1128/jb.137.2.956-962.1979. [DOI] [PMC free article] [PubMed] [Google Scholar]
- Goodman AL, McNulty NP, Zhao Y, Leip D, Mitra RD, Lozupone CA, Knight R, Gordon JI. Identifying genetic determinants needed to establish a human gut symbiont in its habitat. Cell Host Microbe. 2009;6:279–289. doi: 10.1016/j.chom.2009.08.003. [DOI] [PMC free article] [PubMed] [Google Scholar]
- Haralalka S, Nandi S, Bhadra RK. Mutation in the relA gene of Vibrio cholerae affects in vitro and in vivo expression of virulence factors. J Bacteriol. 2003;185:4672–4682. doi: 10.1128/JB.185.16.4672-4682.2003. [DOI] [PMC free article] [PubMed] [Google Scholar]
- Haseltine WA, Block R. Synthesis of guanosine tetra- and pentaphosphate requires the presence of a codon-specific, uncharged transfer ribonucleic acid in the acceptor site of ribosomes. Proc Natl Acad Sci USA. 1973;70:1564–1568. doi: 10.1073/pnas.70.5.1564. [DOI] [PMC free article] [PubMed] [Google Scholar]
- Hauryliuk V, Atkinson GC, Murakami KS, Tenson T, Gerdes K. Recent functional insights into the role of (p)ppGpp in bacterial physiology. Nat Rev Microbiol. 2015;13:298–309. doi: 10.1038/nrmicro3448. [DOI] [PMC free article] [PubMed] [Google Scholar]
- Hogg T, Mechold U, Malke H, Cashel M, Hilgenfeld R. Conformational antagonism between opposing active sites in a bifunctional RelA/SpoT homolog modulates (p)ppGpp metabolism during the stringent response. Cell. 2004;117:57–68. doi: 10.1016/s0092-8674(04)00260-0. [DOI] [PubMed] [Google Scholar]
- Holdeman LV, Cato EP, Moore WE. Anaerobe Laboratory Manual. Virginia Polytechnic Institute and State University Anaerobe Laboratory; 1977. [Google Scholar]
- Irnov I, Wang Z, Jannetty ND, Bustamante JA, Rhee KY, Jacobs-Wagner C. Crosstalk between the tricarboxylic acid cycle and peptidoglycan synthesis in Caulobacter crescentus through the homeostatic control of α-ketoglutarate. PLoS Genet. 2017;13:e1006978. doi: 10.1371/journal.pgen.1006978. [DOI] [PMC free article] [PubMed] [Google Scholar]
- Jishage M, Kvint K, Shingler V, Nyström T. Regulation of sigma factor competition by the alarmone ppGpp. Genes Dev. 2002;16:1260–1270. doi: 10.1101/gad.227902. [DOI] [PMC free article] [PubMed] [Google Scholar]
- Kanjee U, Ogata K, Houry WA. Direct binding targets of the stringent response alarmone (p)ppGpp. Mol Microbiol. 2012;85:1029–1043. doi: 10.1111/j.1365-2958.2012.08177.x. [DOI] [PubMed] [Google Scholar]
- Kazmierczak KM, Wayne KJ, Rechtsteiner A, Winkler ME. Roles of rel(Spn) in stringent response, global regulation and virulence of serotype 2 Streptococcus pneumoniae D39. Mol Microbiol. 2009;72:590–611. doi: 10.1111/j.1365-2958.2009.06669.x. [DOI] [PMC free article] [PubMed] [Google Scholar]
- Koropatkin NM, Martens EC, Gordon JI, Smith TJ. Starch catabolism by a prominent human gut symbiont is directed by the recognition of amylose helices. Structure. 2008;16:1105–1115. doi: 10.1016/j.str.2008.03.017. [DOI] [PMC free article] [PubMed] [Google Scholar]
- Koropatkin NM, Cameron EA, Martens EC. How glycan metabolism shapes the human gut microbiota. Nat Rev Microbiol. 2012;10:323–335. doi: 10.1038/nrmicro2746. [DOI] [PMC free article] [PubMed] [Google Scholar]
- Krásný L, Gourse RL. An alternative strategy for bacterial ribosome synthesis: Bacillus subtilis rRNA transcription regulation. EMBO J. 2004;23:4473–4483. doi: 10.1038/sj.emboj.7600423. [DOI] [PMC free article] [PubMed] [Google Scholar]
- Lee SM, Donaldson GP, Mikulski Z, Boyajian S, Ley K, Mazmanian SK. Bacterial colonization factors control specificity and stability of the gut microbiota. Nature. 2013;501:426–429. doi: 10.1038/nature12447. [DOI] [PMC free article] [PubMed] [Google Scholar]
- Lemke JJ, Durfee T, Gourse RL. DksA and ppGpp directly regulate transcription of the Escherichia coli flagellar cascade. Mol Microbiol. 2009;74:1368–1379. doi: 10.1111/j.1365-2958.2009.06939.x. [DOI] [PMC free article] [PubMed] [Google Scholar]
- Link H, Kochanowski K, Sauer U. Systematic identification of allosteric protein-metabolite interactions that control enzyme activity in vivo. Nat Biotechnol. 2013;31:357–361. doi: 10.1038/nbt.2489. [DOI] [PubMed] [Google Scholar]
- Liu K, Bittner AN, Wang JD. Diversity in (p)ppGpp metabolism and effectors. Curr Opin Microbiol. 2015;24:72–79. doi: 10.1016/j.mib.2015.01.012. [DOI] [PMC free article] [PubMed] [Google Scholar]
- Love MI, Huber W, Anders S. Moderated estimation of fold change and dispersion for RNA-seq data with DESeq2. Genome Biol. 2014;15:550. doi: 10.1186/s13059-014-0550-8. [DOI] [PMC free article] [PubMed] [Google Scholar]
- Magoc T, Wood D, Salzberg SL. EDGE-pro: estimated degree of gene expression in prokaryotic genomes. Evol Bioinform Online. 2013;9:127–136. doi: 10.4137/EBO.S11250. [DOI] [PMC free article] [PubMed] [Google Scholar]
- Martens EC, Chiang HC, Gordon JI. Mucosal glycan foraging enhances fitness and transmission of a saccharolytic human gut bacterial symbiont. Cell Host Microbe. 2008;4:447–457. doi: 10.1016/j.chom.2008.09.007. [DOI] [PMC free article] [PubMed] [Google Scholar]
- Maurice CF, Haiser HJ, Turnbaugh PJ. Xenobiotics shape the physiology and gene expression of the active human gut microbiome. Cell. 2013;152:39–50. doi: 10.1016/j.cell.2012.10.052. [DOI] [PMC free article] [PubMed] [Google Scholar]
- Myhrvold C, Kotula JW, Hicks WM, Conway NJ, Silver PA. A distributed cell division counter reveals growth dynamics in the gut microbiota. Nat Commun. 2015;6:10039. doi: 10.1038/ncomms10039. [DOI] [PMC free article] [PubMed] [Google Scholar]
- Ogata H, Goto S, Sato K, Fujibuchi W, Bono H, Kanehisa M. KEGG: Kyoto encyclopedia of genes and genomes. Nucleic Acids Res. 1999;27:29–34. doi: 10.1093/nar/27.1.29. [DOI] [PMC free article] [PubMed] [Google Scholar]
- Pizarro-Cerdá J, Tedin K. The bacterial signal molecule, ppGpp, regulates Salmonella virulence gene expression. Mol Microbiol. 2004;52:1827–1844. doi: 10.1111/j.1365-2958.2004.04122.x. [DOI] [PubMed] [Google Scholar]
- Potrykus K, Cashel M. (p)ppGpp: still magical? Annu Rev Microbiol. 2008;62:35–51. doi: 10.1146/annurev.micro.62.081307.162903. [DOI] [PubMed] [Google Scholar]
- Rey FE, Faith JJ, Bain J, Muehlbauer MJ, Stevens RD, Newgard CB, Gordon JI. Dissecting the in vivo metabolic potential of two human gut acetogens. J Biol Chem. 2010;285:22082–22090. doi: 10.1074/jbc.M110.117713. [DOI] [PMC free article] [PubMed] [Google Scholar]
- Ross W, Vrentas CE, Sanchez-Vazquez P, Gaal T, Gourse RL. The magic spot: a ppGpp binding site on E. coli RNA polymerase responsible for regulation of transcription initiation. Mol Cell. 2013;50:420–429. doi: 10.1016/j.molcel.2013.03.021. [DOI] [PMC free article] [PubMed] [Google Scholar]
- Sauer U, Lasko DR, Fiaux J, Hochuli M, Glaser R, Szyperski T, Wüthrich K, Bailey JE. Metabolic flux ratio analysis of genetic and environmental modulations of Escherichia coli central carbon metabolism. J Bacteriol. 1999;181:6679–6688. doi: 10.1128/jb.181.21.6679-6688.1999. [DOI] [PMC free article] [PubMed] [Google Scholar]
- Seyfzadeh M, Keener J, Nomura M. spoT-dependent accumulation of guanosine tetraphosphate in response to fatty acid starvation in Escherichia coli. Biochemistry. 1993;90:11004–11008. doi: 10.1073/pnas.90.23.11004. [DOI] [PMC free article] [PubMed] [Google Scholar]
- Shannon P, Markiel A, Ozier O, Baliga NS, Wang JT, Ramage D, Amin N, Schwikowski B, Ideker T. Cytoscape: a software environment for integrated models of biomolecular interaction networks. Genome Res. 2003;13:2498–2504. doi: 10.1101/gr.1239303. [DOI] [PMC free article] [PubMed] [Google Scholar]
- Sonnenburg JL, Xu J, Leip DD, Chen CH, Westover BP, Weatherford J, Buhler JD, Gordon JI. Glycan foraging in vivo by an intestine-adapted bacterial symbiont. Science. 2005;307:1955–1959. doi: 10.1126/science.1109051. [DOI] [PubMed] [Google Scholar]
- Subramanian A, Tamayo P, Mootha VK, Mukherjee S, Ebert BL, Gillette MA, Paulovich A, Pomeroy SL, Golub TR, Lander ES, et al. Gene set enrichment analysis: a knowledge-based approach for interpreting genome-wide expression profiles. Proc Natl Acad Sci USA. 2005;102:15545–15550. doi: 10.1073/pnas.0506580102. [DOI] [PMC free article] [PubMed] [Google Scholar]
- Traxler MF, Summers SM, Nguyen H-T, Zacharia VM, Hightower GA, Smith JT, Conway T. The global, ppGpp-mediated stringent response to amino acid starvation in Escherichia coli. Mol Microbiol. 2008;68:1128–1148. doi: 10.1111/j.1365-2958.2008.06229.x. [DOI] [PMC free article] [PubMed] [Google Scholar]
- Vinella D, Albrecht C, Cashel M, D’Ari R. Iron limitation induces SpoT-dependent accumulation of ppGpp in Escherichia coli. Mol Microbiol. 2005;56:958–970. doi: 10.1111/j.1365-2958.2005.04601.x. [DOI] [PubMed] [Google Scholar]
- Wattam AR, Davis JJ, Assaf R, Boisvert S, Brettin T, Bun C, Conrad N, Dietrich EM, Disz T, Gabbard JL, et al. Improvements to PATRIC, the all-bacterial Bioinformatics Database and Analysis Resource Center. Nucleic Acids Res. 2017;45:D535–D542. doi: 10.1093/nar/gkw1017. [DOI] [PMC free article] [PubMed] [Google Scholar]
- Wexselblatt E, Oppenheimer-Shaanan Y, Kaspy I, London N, Schueler-Furman O, Yavin E, Glaser G, Katzhendler J, Ben-Yehuda S. Relacin, a novel antibacterial agent targeting the stringent response. PLoS Pathog. 2012;8:e1002925. doi: 10.1371/journal.ppat.1002925. [DOI] [PMC free article] [PubMed] [Google Scholar]
- Xiao H, Kalman M, Ikehara K, Zemel S, Glaser G, Cashel M. Residual guanosine 3′,5′-bispyrophosphate synthetic activity of relA null mutants can be eliminated by spoT null mutations. J Biol Chem. 1991;266:5980–5990. [PubMed] [Google Scholar]
- Xu J, Bjursell MK, Himrod J, Deng S, Carmichael LK, Chiang HC, Hooper LV, Gordon JI. A genomic view of the human- Bacteroides thetaiotaomicron symbiosis. Science. 2003;299:2074–2076. doi: 10.1126/science.1080029. [DOI] [PubMed] [Google Scholar]
- Yen JY. Finding the K shortest loopless paths in a network. Manage Sci. 1971;17:712–716. [Google Scholar]
- Zimmermann M, Kogadeeva M, Gengenbacher M, McEwen G, Mollenkopf HJ, Zamboni N, Kaufmann SHE, Sauer U. Integration of metabolomics and transcriptomics reveals a complex diet of Mycobacterium tuberculosis during early macrophage infection. mSystems. 2017;2:e00057–17. doi: 10.1128/mSystems.00057-17. [DOI] [PMC free article] [PubMed] [Google Scholar]
Associated Data
This section collects any data citations, data availability statements, or supplementary materials included in this article.
Supplementary Materials
Figure S1 (related to Figure 1). Characterization of B. thetaiotaomicron (p)ppGpp synthetase-hydrolase proteins. (A) Genomewide transposon mutagenesis of Bacteroidetes strains produces distinct transposon insertion patterns in RSH homologue genes, suggesting that the non-hit homologues are essential for viability in the wildtype background. Transposon insertion sites (TA dinucleotide sequences) were identified by Insertion Sequencing (INSeq). Error bars indicate standard deviation of n=3 replicates. (B) (p)ppGpp to GTP ratios in B. thetaiotaomicron wildtype and bt0700 strains measured by TLC analysis of 32P-labeled cultures after two hours in glucose replete (+) or deplete (−) medium. Quantification is based on radiolabeled spot intensity of nucleotide extracts separated by TLC; error bars indicate standard deviation of n=3 replicates. (C) LC-qTOF quantification of ppGpp concentration in wildtype B. thetaiotaomicron after 1 or 3 hours of carbon starvation. ppGpp levels at time point 0 were below the detection limit. Error bars indicate standard deviation of n=3–4 replicates.
Figure S2 (related to Figure 2). Effect of bt0700 deletion on long-term fitness in vivo. Relative abundance of WT, bt0700 and ppGpp0 strains in fecal samples of gnotobiotic mice colonized with these isogenic strains together and measured over 24 days (error bars indicate standard deviation of n=5 replicates, * FDR<0.05, Tukey’s HSD test with Benjamini-Hochberg FDR correction).
Figure S3 (related to Figures 3 and 4). Pathways changing between stress and growth conditions in wildtype and ppGpp0 strains. KEGG pathway enrichment analysis of (A) differentially expressed genes (measured by RNASeq) between starvation and growth conditions in WT, bt0700 and ppGpp0 strains and B) differentially expressed genes (measured by RNAseq) between in vivo and in vitro growth conditions in WT, bt0700, and ppGpp0 strains. Pathways are displayed if the enrichment p-value (FDR adjusted with Benjamini-Hochberg procedure) is <0.01 in at least one condition; black – n.s. (not significant). M. – metabolism, b. – biosynthesis. Pathways differently changing in the WT and bt0700 strains compared to ppGpp0 are marked in red.
Figure S4 (related to Figure 5). Labeled isotopologue fractions of metabolites collected from B. thetaiotaomicron ppGpp0 cultures during growth and starvation. (A) Schematic representation of growth shift experiment with 13C-labeled medium. (B) Growth curves of wildtype (left) and ppGpp0 (right) strains in minimal medium with glucose, acetate or glutamine as the sole carbon source. Error bars indicate standard deviation of n=3 replicates. (C) Labeled isotopologue fractions of metabolites detected with LC-MS/MS during [U-13C] glucose shift experiments in the B. thetaiotaomicron ppGpp0 strain. (D) Labeled isotopologue fractions of metabolites in the ppGpp0 strain during shift from growth with [U-12C] glucose and [U-12C] glutamine to starvation in the presence of [U-13C] glutamine. [M+X] indicates the number of 13C-labeled carbon atoms in an isotopologue of a metabolite (maximal value of X is the number of carbons in the molecule). 13C isotopologue fractions reflect the proportions of differently labeled isotopologues in the total pool of a metabolite. Notably, the fraction of labeled glutamate is significantly (p < 0.01, Student’s t-test) larger in the ppGpp0 mutant than in the wildtype strain starting after 9 h of carbon starvation, whereas the labeling patterns of other metabolites are not different from the wildtype strain. The higher labeling fraction detected in glutamate could be explained by a lower flux from unlabeled succinate to AKG and glutamate in the ppGpp0 strain. However, (p)ppGpp-dependent differences in cell viability 3 hours after carbon limitation (Figure 1D) may also contribute to these labeling patterns.
Figure S5 (related to Figure 6). Effect of AKG supplementation on levels of amino acid and purine metabolism intermediates in the ppGpp0 mutant during starvation. (A) Amino acid and (B) purine metabolism intermediates in B. thetaiotaomicron ppGpp0 measured with LC-qTOF mass spectrometry over the time course of starvation, with or without AKG supplementation. Time point -1 corresponds to steady state growth prior to addition of AKG. Error bars indicate standard deviation of 3 replicates, where applicable. AKG, Alpha-ketoglutarate; FGAM, 2-(Formamido)-N1-(5′-phosphoribosyl) acetamidine.
Table S1. Related to Figure 1. Sequence alignment of Bacteroides genes homologous to (p)ppGpp synthetase/hydrolase from Gammaproteobacterium Streptococcus equisimilis (RelSeq).
Table S2. Related to Figure 1. Numbers of resolved merodiploids tested and mutants confirmed in attempts to delete bt0700, bt3998 and both genes from B. thetaiotaomicron. Nonpolar, unmarked deletions of the complete open reading frame of each gene were made by allelic exchange.
Table S3. (related to Figures 1, 2 and 6) Starvation and mouse colonization survival data.
Table S4. (related to Figures 3 and 4) RNAseq analysis for wildtype, bt0700 and ppGpp0 strains during growth in glucose minimal medium before and after 1 hour carbon starvation, and in the cecal contents of gnotobiotic mice.
Table S5. (related to Figure 4) Metabolomics analysis for wildtype and ppGpp0 strains during growth in glucose minimal medium before and after 1 hour carbon starvation.
Table S6. (related to Figure 5) 13C labeling data for wildtype and ppGpp0 strains during growth and starvation.
Table S7. (related to Figure 6) Metabolomics analysis for the ppGpp0 strain over 20 hours of carbon starvation with and without dimethyl-AKG supplementation.
Data Availability Statement
The raw RNAseq data have been deposited in the EMBL-EBI European Nucleotide Archive under accession no. E-MTAB-6412. The metabolomics data are provided in Tables S5, S6, and S7.