

Abstract
Inherited sensory neuropathies are caused by mutations in genes affecting either primary afferent neurons, or the Schwann cells that myelinate them. Using RNA-Seq, we analyzed the transcriptome of human and rat DRG and peripheral nerve, which contain sensory neurons and Schwann cells, respectively. We subdivide inherited sensory neuropathies based on expression of the mutated gene in these tissues, as well as in mouse TRPV1 lineage DRG nociceptive neurons, and across 32 human tissues from the Human Protein Atlas. We propose that this comprehensive approach to neuropathy gene expression leads to better understanding of the involved cell types in patients with these disorders. We also characterize the genetic “fingerprint” of both tissues, and present the highly tissue-specific genes in DRG and sciatic nerve that may aid in the development of gene panels to improve diagnostics for genetic neuropathies, and may represent specific drug targets for diseases of these tissues.
Keywords: Pain, Proprioception, Charcot Marie Tooth, neuropathy, pain channelopathy, transcriptomics, Schwann Cells, gene expression, Glia, RNA-Seq, dorsal root ganglion, spinal cord, sodium channels, TRPV1, TRPA1, Inherited peripheral neuropathy, HSAN, sciatic nerve, adipocytes, myelin protein zero, peripheral myelin protein 22, neurofilament, peptidyl-alpha-amidating monooxygenase
Introduction
Charcot-Marie-Tooth diseases (CMT) are among the most common inherited neuropathies, with a prevalence of between 1 in 1200 to 1 in 2500 (Braathen, 2012). CMT neuropathies presently are incurable and patients can eventually exhibit muscle wasting and loss of sensory modalities, usually beginning in the hands and feet and progressing proximally. Although symptoms vary, it is common for CMT patients to retain nociceptive innervation in the absence of other sensory modalities, and despite muscle wasting. This leads to a high incidence of neuropathic pain (Carter et al., 1998), although the severity spans a broad range. The clinical variability of CMT and of peripheral neuropathies in general is perhaps explained by the malfunction of specific cell types in each individual. One clinically used criterion is whether the myelinating Schwann cell (demyelinating, CMT1), or the peripheral nerve cell bodies or axons (CMT2) are primarily affected. These two subtypes of CMT can be differentiated by measuring the conduction velocity of the peripheral nerve, with slower conduction velocities associating with an insult to the Schwann cell. This differentiation guides diagnosis, genetic screening and prediction of disease progression and management. Beyond this, it highlights the two general cell populations that are aberrant in CMT patients, and a detailed molecular investigation of these cell types is the focus of the present report. The aims are to obtain a greater molecular understanding of peripheral nerve function, delineate quantitative aspects of sensory genetic disorders including pain channelopathies, and probe the etiology and phenotypes of CMT neuropathies.
With the advent of high-throughput genomic DNA sequencing, the relationship between genetic defects and CMT phenotypes has been studied in detail. The most common genetic cause of CMT is duplication in the short arm region of chromosome 17 (17p) that contains peripheral myelin protein 22 (PMP22). The duplication of this protein, in aggregate with mutations in PMP22, myelin protein zero (MPZ) or connexin 32 (GJB1) are responsible for ~75% of CMT1 cases (Murphy et al., 2012; Rossor et al., 2013). Currently, a large number of additional genetic defects are known that cause CMT neuropathies in humans, with still more proposed from animal studies. Despite this abundance of genetic information, the mechanisms by which these genes cause CMT are not always apparent. It is also unclear in many cases why genes with essential functions in many cell types would exhibit a clinical symptom in PNS neurons or Schwann cells to produce a CMT neuropathy. One example is loss of function mutation in the Glycyl-tRNA synthetase (GARS)(Griffin et al., 2014) a broadly expressed gene. These observations point to the need for a more comprehensive understanding of the processes underlying CMT neuropathies, to consider involvement of tissues not classically associated with the syndrome, or to consider interactions between multiple cell types within the canonical network. As genotyping of neuropathy patients becomes more commonplace, it becomes informative to investigate the expression pattern of the specific gene to make predictions and inform treatments. A similar set of considerations applies to congenital pain problems, which are often neuropathies selectively affecting primary afferent nociceptors in dorsal root and trigeminal ganglia. The number of gene mutations associated with increases and decreases in pain sensitivity continues to grow (Chen et al., 2015; Cox et al., 2006; Mogil, 2012; Nahorski et al., 2015) and knowing the expression levels in the various circuits and neurons provides a quantitative template for understanding the specific or more general roles these genes play in nociceptive function. The range of protein classes is now known to include ion channels, transcription factors, growth factors, their receptors, and clathrin-mediated endocytic defects (Chen et al., 2015; Hisama et al., 1993; Indo et al., 1996; Nahorski et al., 2015; Rosemberg et al., 1994; Yang et al., 2004).
The present study provides a comprehensive quantitative view of the genes in both the DRG and Schwann cells, the two tissues most strongly implicated in the etiology of CMT neuropathy. The level of expression of these genes in one tissue relative to another or to other organs or tissues in the body can have an impact on defining or refining the clinical phenotype. In addition to understanding the biology of DRG and sciatic nerve, the transcriptomic data can be used to identify other putative CMT candidates from the pool of most highly expressed and highly differentially expressed transcripts in the two critical tissues. Such biologically-driven characterizations of this set of neurological disorders can segregate the genetic subtypes of CMT neuropathies based on quantitative expression profiles and provide new insights into patient evaluations.
Materials and Methods
Nomenclature and classifications
In this paper we investigate the transcriptional status of many of the genes involved in CMT and pain disorders. As such the focus is on the genes and their expression levels. More details on the clinical classification and the various symptoms resulting from their mutation can be found in several recent reviews (Rossor et al., 2013) and in the OMIM database (http://omim.org/). For pain channelopathies, we include not only loss of function mutations leading to neuropathy, but gain of function leading to overactivation of primary sensory neurons leading to pain syndromes of varying severity (Drenth and Waxman, 2007; Yang et al., 2004). In many cases, loss or overactivation of these ion channels is responsible for diminished or enhanced pain sensation (Boukalova et al., 2014; Cox et al., 2006; Drenth and Waxman, 2007; Hisama et al., 1993; Leipold et al., 2013; Park et al., 2007; Yang et al., 2004).
Tissue preparation and RNA purification
All procedures were approved by the NIH Animal Care and Use Committee. Rats were housed in pairs and given access to food and water ad libitum. To obtain DRG and sciatic nerve, rats were anesthetized with isoflurane, decapitated and dissected immediately. L4 and L5 DRGs were removed after laminectomy and sciatic nerves were dissected starting from just distal to the sciatic notch and extending to just above the sciatic trifurcation. Tissues were frozen immediately on dry ice and stored at −80°C until processed. Human L3 DRGs (N=4) were purchased from Anabios (San Diego, CA). Samples were homogenized in 1 mL Qiazol reagent (Qiagen Inc, Valencia CA) using a Fastprep 24 homogenizer (MP Biomedicals, Santa Ana, CA) and purified using the RNeasy Mini kit (Qiagen Inc, Valencia CA) with added DNase digestion. RNA integrity was assessed after gel electrophoresis using an Agilent Bioanalyzer (Agilent Technologies, Santa Clara, CA). Samples with an RNA integrity number above 8.5 were sequenced, except for human DRG samples from Anabios, which were sequenced if they were above a RIN of 7.0.
Next-gen sequencing and genomic mapping
The TruSeq RNA Library Preparation Kit v2 (Illumina, San Diego, CA) with Biomek liquid handling automation (Beckman Coulter, Pasadena, CA) was used to perform cDNA synthesis and adaptor ligation. Sequencing was performed on the Illumina HiSeq2500 instrument at 2×100 bp read length using v4 chemistry according to the manufacturer’s protocols. Default quality trimming was performed with removal of reads that fall below CASAVA’s (Illumina) passing filter. Subsequently, reads were trimmed to 75bp and used to generate demultiplexed FASTQ files.
Reads were aligned to the genome using RNA-Seq Unified Mapper (RUM v 2.0.5) and the rn5 rat genome assembly (including the mitochondrial genome) or hg19 human genome assembly. Mapped reads were assembled using gene models from RefSeq and Ensembl. The transcript accounting for the most unique mapped reads was selected to represent gene expression, with preference given to RefSeq models for genes where both RefSeq and Ensembl models are established. Raw count and RPKM values were extracted from standard RUM output files as well as from previously published datasets (Consortium, 2013; Goswami et al., 2014a; Goswami et al., 2014b). Raw counts were used to calculate differential expression between rat DRG and sciatic nerve using a negative bionomial test within the bioinformatics tool DESeq from Bioconductor (Anders and Huber, 2010). A set of mostly muscle-specific transcripts was evident in a single sample of DRG (1 out of 8) and were excluded from further analyses (Supplementary Fig S1).
Databases
For identification of mutant genes underlying the pain channelopathies and CMT neuropathies we examined the literature as well as the Online Mendelian Inheritance in Man (OMIM) database maintained by the NCBI. Heatmap data was generated by extracting FPKM values from the Human Protein Atlas RNA-Seq repository (Uhlen et al., 2015). Datasets generated by the research in the present paper have been made available through the SRA database under project number PRJNA313202. Mouse TRPV1 lineage and non-TRPV1 lineage datasets were previously published in (Goswami et al., 2014a) and can be accessed under project number PRJNA308243.
Prediction of peptidyl alpha-amidating monooxygenase (PAM) substrates from sciatic nerve enriched genes
Protein products of genes presented in Figure 5 were analyzed for C-terminal Gly residues based on Uniprot amino acid sequences containing signal peptides, indicating their presence within the secretory pathway. This search included mature C-terminals if a processing step was reported in Uniprot. Gly residues revealed after removal of C-terminal basic residues were also considered. Additionally, ProP 1.0 was used to predict putative furin-like cleavages that were predicted to expose C- terminal Gly residues for processing by PAM.
Figure 5. Most abundant transcripts greater than >3 fold differentially expressed in sciatic nerve relative to DRG.
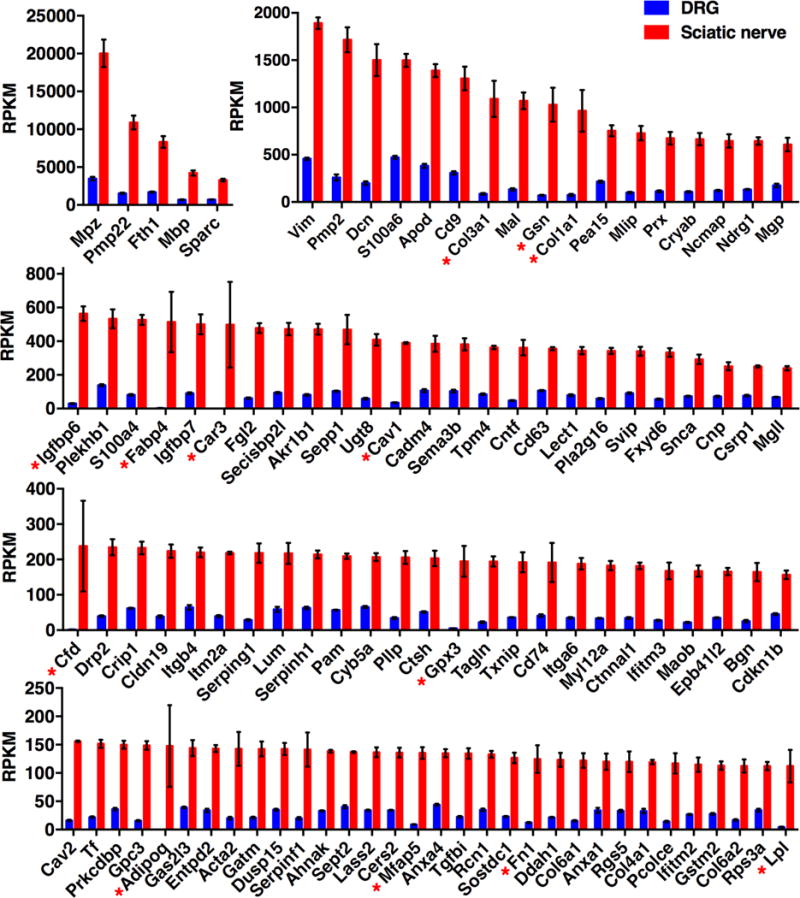
Transcriptomics data were filtered for genes >3 fold differentially expressed in sciatic relative to DRG, and ordered by RPKM value. Genes >10 fold differentially expressed are marked with an asterisk. Given that Schwann cells and nerve tracks are a subset of DRG, very few genes are more than 3 fold differentially expressed in sciatic, and generally have a high SEM (error bars). DRG n =8, sciatic n = 4.
Histology and immunohistochemistry
DRGs and peripheral nerve were dissected as above, fixed by immersion in 4% paraformaldehyde, embedded in paraffin, and sectioned at 6μm. Sections of DRG were stained immunohistochemically for neurofilament light chain (Dako, Carpinteria, CA, 1:100) to demonstrate axons and neuronal perikarya and for myelin protein zero (Aves Labs Inc., Tigard, OR, 1:1000) to stain Schwann cells and the axonal myelin sheath. After washing with PBS, primary antisera were detected with biotinlylated species-specific secondary antibodies and the Vector Labs Elite ABC kit according to manufacturer’s instructions; colored product was developed with diaminobenzidine. Sections were counterstained with hematoxylin.
Staining for Adipocytes
The RNA-Seq data indicated the presence of fat specific genes (Fabp4, Lep, Adipoq) in the peripheral nerve, although the transcript signals were variable, with variance correlating strongly with each particular animal (Fig. 5) indicating that some dissected nerves had more adipose tissue than others. Additional analysis revealed a subset of genes whose variance correlated with animal sample number, most likely contributed by genes enriched in adipocytes adhering to the nerve. To examine adipose distribution, several rat sciatic nerves were dissected starting below the sciatic notch and extending to below the trifurcation, where there are additional fat pads. Nerve samples were fixed by immersion in 4 % paraformaldehyde and then either (a) embedded in paraffin, sectioned at 6 μm and stained using Masson’s trichrome or (b) processed as a whole mount and stained with 0.5% oil Red O in polyethylene glycol. Oil red stained nerves were destained in sequential washes of 100%, then 85% polyethylene glycol in PBS. Photomicrographs were obtained with an Olympus BX60 microscope and DP- 80 digital camera. Whole mounted tissue samples were photographed with a Zeiss Stemi 2000-C and a Nikon D5100 SLR.
Heatmap analysis of CMT genes and DRG/sciatic nerve enriched genes
Using data mined from the GTEx (Consortium, 2013) and Human Protein Atlas (Uhlen et al., 2015) databases, in conjunction with the datasets presented in this manuscript, we performed a comprehensive tissue distribution analysis for CMT genes (Fig 10). Tissue expression was calculated as a % of the highest RPKM/FPKM value in any tissue across all datasets for each gene, and colored according to value to create a heatmap (Fig 10). Because of technical differences in sequencing, analysis and units, a demarcation is shown between the data from each of datasets and species. For each gene, division into subgroups was based on a two-pass approach. In the first filter, genes were selected for expression in CMT target tissue vs. all others by creating a filter requiring 90% of maximum expression in at least one CMT target tissue (first 6 columns, Fig 10). The resulting two groups (Strongly enriched genes, and a second group) were each sorted by an enrichment score, calculated as the maximum value in any CMT target tissue divided by the average expression in non-CMT target tissues, multiplied by the max expression in a non-CMT target tissue. Genes which did not show at least 90% max expression in a CMT target tissue were further subdivided into genes with a pattern of enrichment in one or more tissues other than the DRG or sciatic, or those that are broadly expressed. All three groups are plotted on the heatmap, sorted by enrichment score calculated based on the average normalized value, and enrichment in any of the six target neuropathy tissues. To create a heatmap of highly enriched genes in DRG or sciatic nerve (Fig 11), a similar approach was taken, plotting DRG and sciatic nerve from rat compared with the 32 tissues from the Human Protein Atlas. After normalization, genes were selected with less than 200% of the max expression in the DRG in all 32 tissues from the protein atlas dataset combined. For sciatic nerve, genes were selected with total gene expression in the 32 protein atlas tissues, totaling less than 400% of the max expression in sciatic nerve. Resulting gene lists were sorted by maximum RPKM/FPKM in any tissue examined, and the top 35 genes in each category are shown (Fig 11). Complete lists are represented in Supplementary Figures 4 and 5 for DRG and sciatic nerve, respectively.
Figure 10. Heatmap of CMT neuropathy and pain channelopathy gene expression levels across neural and non-neural tissues.
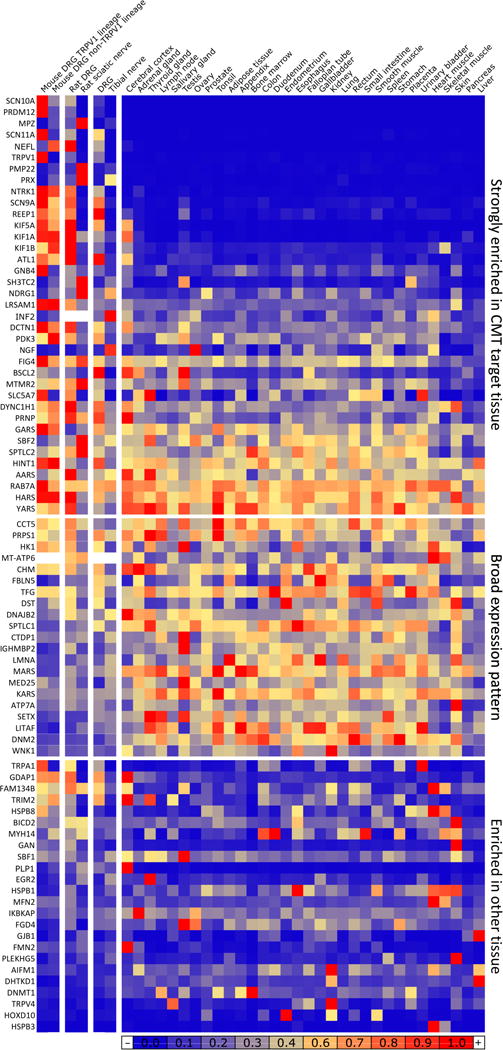
CMT and neuropathy genes were normalized to a % of maximum expression and colored according to numeric value. Sorting of the matrix was performed by segregating values into several classes. Genes in the top group are most highly expressed in DRG, neurons, or nerve/Schwann cell-containing tissues (first six columns), while genes in the lower two groups have higher level of expression in at least one tissue. The remaining genes were divided into homogeneous (middle) or punctate (bottom) levels of expression. All three groups were sorted for enrichment in first six columns.
Figure 11. Heatmap of DRG and sciatic nerve enriched genes.
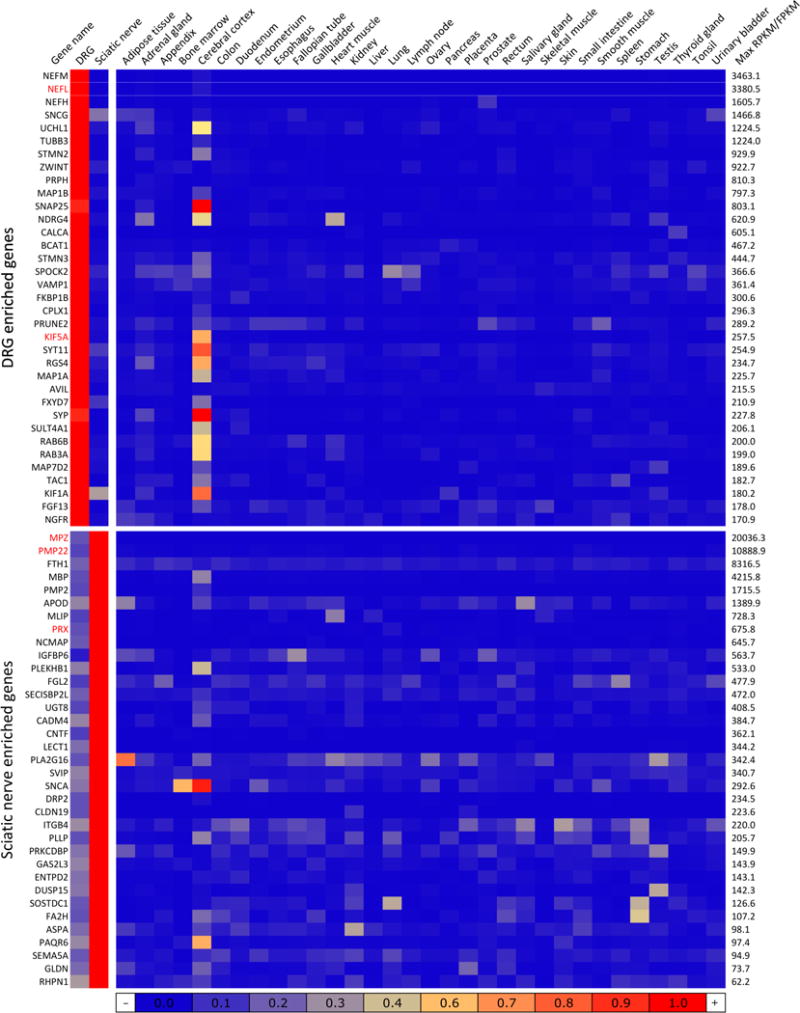
Genes strongly differential between DRG and sciatic were additionally probed for enrichment relative to 32 tissues present in the Human Protein Atlas. These genes were normalized to a % of maximum expression in any tissue and colored according to numeric value. Genes that are strongly enriched in DRG or sciatic relative to a broad complement of tissues are likely to be molecular signatures of this tissue. Genes are sorted by maximum expression (RPKM/FPKM) in any of the 34 tissues. Several CMT genes (NEFL, KIF5A in DRG and MPZ, PMP22 and PRX in sciatic) are among the most highly differential genes in DRG or sciatic. Both DRG and sciatic show enhanced similarity to the cerebral cortex, the only brain tissue presented in the Atlas data
Results
Organizational Structure
In section I we demonstrate the cellular composition of DRG and sciatic nerve. In section II we examine (a) general transcriptomic metrics of sciatic nerve and DRG, (b) patterns of expression and (c) specific gene transcripts that are differentially expressed in each tissue with a focus on the sciatic nerve. The subsequent series of analyses (III) examines the transcriptome expression data in relationship to genetically inherited Charcot-Marie-Tooth neuropathies and sensory nociceptive gain and loss of function disorders.
I. Anatomical compartments in DRG and peripheral nerve
Immunohistochemistry was performed for two of the most highly expressed genes in the transcriptomes of DRG or peripheral nerve: neurofilament light chain (Nefl) and myelin protein zero (Mpz), respectively. Staining at the level of the DRG showed distinct cellular and subcellular compartmentation for both proteins (Fig 1A, B). Neurofilament stained axons very strongly and neuronal cell bodies, although the perikarya exhibited a heterogeneous intensity with the larger diameter cell bodies being more strongly stained than the smaller cell bodies, which is consistent with previous studies (Mitchell et al., 2014). MPZ staining was also present in DRG where staining was confined to the myelin sheaths. No neuronal cell bodies were stained for MPZ. While the axons stain for neurofilament protein, RNA-Seq of the sciatic nerve revealed that only low amounts of neurofilament transcript are present in the peripheral nerve compared to the DRG where the neuronal perikarya are located (e.g. sciatic nerve contained ~1/1000th of the level in the DRG).
Figure 1. Histological assessment of DRG tissue.
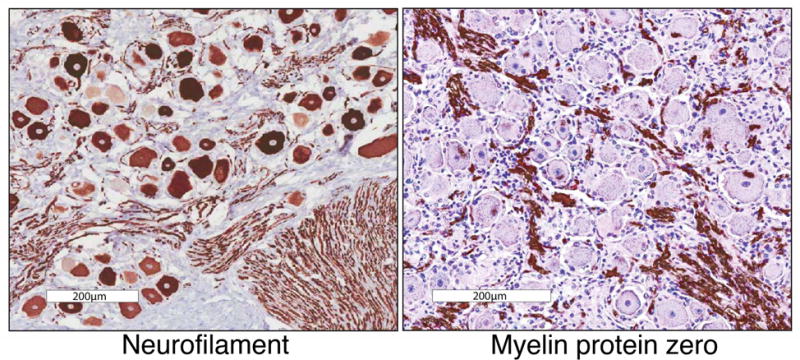
DRG tissue was stained for either neurofilamen light chain (left) or myelin protein zero (right), which are markers for neurons and Schwann cells respectively. In the case of neurofilament, these proteins are made in the soma, but functional assembly is also required for axonal structure. Because of this, this protein stains both neuronal cell bodies and axonal bundles. These genes are among the most highly expressed, highly differential genes in each tissue. The presence of myelin protein tracks in the DRG is indicative of Schwann cell coated myelinated axonal sheaths extending out from the DRG into the dorsal roots, and to the periphery and the spinal cord. These cells represent a major non-neuronal component of DRGs. Scale bar represents 200μm.
II. General Metrics and Comparative Transcriptomics of DRG and Sciatic Nerve
Overall expression metrics
Figure 2 shows frequency histograms of the levels of gene expression in the two tissues constructed using RPKM values of all expressed genes in sciatic nerve and DRG (Fig 2). In sciatic nerve there were a total of 12,012 genes expressed using a lower limit cutoff of 0.5 RPKM. In DRG there were a total of 12,679 genes expressed using in lower limit cutoff of 0.5 RPKM. Genes are placed into 4 groups comprised of low to medium (0.5–30 RPKM moderate (30–300), strong (300–1500) and high (>1500) levels of expression. The groupings along the x-axes use different non-overlapping bin widths to accommodate the distributions of expression. In general the pattern mirrored that reported for transcript distribution previously reported for mouse DRG (Goswami et al., 2014a) with the majority of genes expressed in the low to medium range. At the high end of the expression range, in both DRG and sciatic nerve, there were 9 to 10 genes expressed above 1500 RPKM. However, within this quantitatively select group, in sciatic nerve the myelin components are expressed at a much higher level than any transcripts in the DRG. We interpret this as a reflection of several factors. First, the sciatic nerve has more uniform cell populations than the DRG. In DRG, the neurons with large diameter axons contribute the majority of the neurofilament transcripts and they only comprise a fraction of the total DRG neuronal population. Second, the Schwann cells are extremely specialized to produce myelin and, thirdly the high expression level of these mRNAs likely corresponds to the pool of protein that is being actively synthesized, and does not necessarily reflect the pool of stable protein, which may turnover at a slower rate.
Figure 2. Histograms of gene expression data for DRG and sciatic nerve.
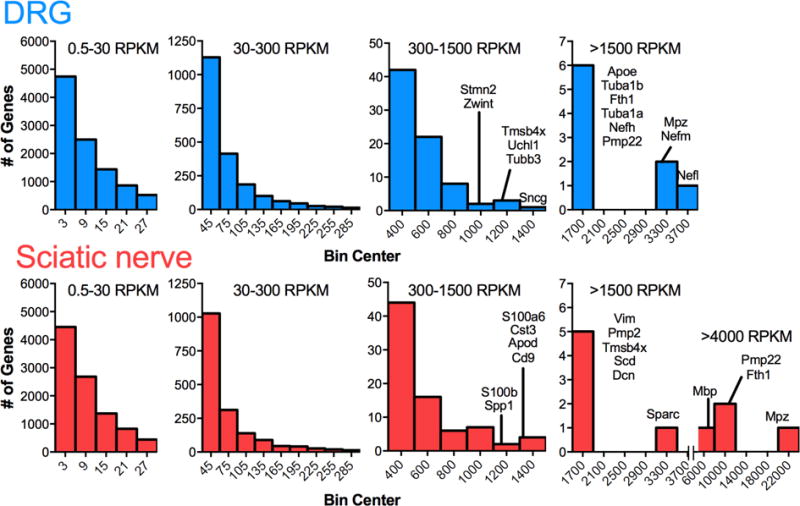
Genes from transcriptomic data were ranked by RPKM values and binned according to level of expression. In both tissue types, number of detectable annotated genes decreases as RPKM value increases, with a small number of genes expressed at extremely high levels. Compared with the DRG, which is a more diverse tissue containing several types of neurons, satellite cells, fibroblasts, and Schwann cells, the sciatic nerve is more homogeneous containing mostly Schwann cells and some adipose. The extremely high level of expression of myelin-related proteins in Schwann exceeds the level of any transcript from DRG.
Metrics of DRG and sciatic nerve genes
Supplementary Figure S2 examines the general quantitative metrics focusing on DRG- and sciatic-specific transcripts compared to those common to both tissues. For DRG and sciatic nerve, individual transcripts that are >3 fold differentially expressed are depicted. For the genes common to both tissues, those less than 1.5 fold differentially expressed are analyzed in Panel 3 (Fig S2). This group likely represents genes that perform general housekeeping and metabolic functions shared by both tissues. In all cases, and as with the tissues as a whole, the preponderance (~80%) of neuronal or Schwann cell genes are expressed below 30 RPKM (~10,000 out of 12,000). The importance of these numerical considerations is that they provide a clear guide of where, in the overall scheme of expression levels, to place the quantitative abundance numbers of a gene product, especially when making comparisons or using other techniques for measurement or interaction studies.
Global Assessment of Differential Expression
Raw count numbers from RUM alignment and mapping were used to perform a negative binomial test using DESeq (R, Bioconductor), and resulting genes with Benjamini-Hochberg adjusted p-value < 0.01 are plotted using RPKM values calculated by RUM as an estimate of absolute expression. Adjusted fold change between DRG and sciatic nerve was plotted vs. average RPKM across both tissues for significantly differential genes and colored according to tissue in which they are enriched (Fig 3A). This analysis yielded 4615 genes significantly differentially expressed (enriched) in the DRG and 4277 genes with enriched expression in the sciatic nerve, showing that the majority of the expressed transcriptome is differentially expressed between these two cell types. Non-significant genes were plotted on the same Y-axis (Fig 3B), and spanned substantially fewer orders of magnitude, indicating that virtually all highly differential genes (RPKM) are also identified as significant by DESEQ analysis of raw counts. An increased variance, most likely due to noise is observed among genes below 1 RPKM (lighter shading). DRG and sciatic nerve groups were divided in half and each half compared to each other in the same manner as for the between tissues comparison and plotted on the same Y axis (Fig 3C, D). Within tissues comparisons revealed variance spanning fewer orders of magnitude, indicating that the within tissues variance is much smaller than the between tissues variance.
Figure 3. Summary statistics and differential gene expression between DRG and sciatic nerve.
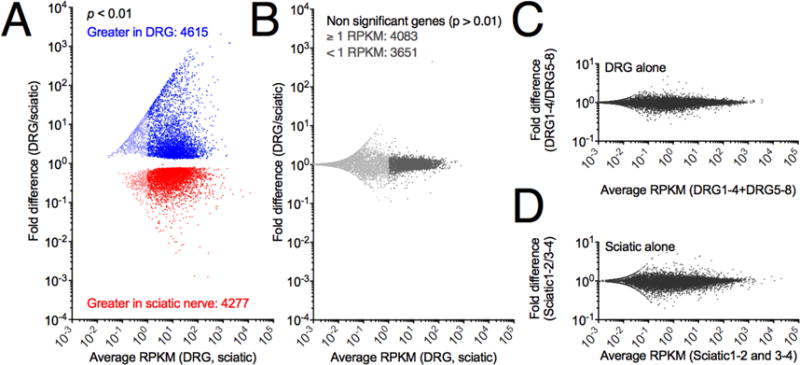
Significance of differential expression was calculated from raw reads using DESEQ (R, Bioconductor) normalization and testing. Separately, RPKM values were calculated as an abundance estimate. A. All genes were plotted according to average RPKM between the two tissues examined and fold difference (DRG/sciatic). Significantly differentially expressed genes (p < .01) are colored by enrichment in the DRG (blue) or sciatic (red), with genes below 1 RPKM shown in a lighter shade. In general large fold change genes and highly expressed genes were significant with 4615 genes enriched in the DRG and 4277 genes enriched in the sciatic nerve. B Non-significant genes using the same color scheme to denote genes below 1 RPKM, which are in general more variable than more highly expressed genes. C, D. Control plots of average expression vs fold change expression were generated by dividing each group of samples into two halves, and plotting them against each other, and are plotted on the same Y-axis scale as in the cross-tissue comparions. Panels C and D span 2 orders of magnitude differential expression, whereas panel A spans >7.
Differential Expression in DRG and Sciatic Nerve
These two tissues exhibited profound differences in expression of specific genes as demonstrated by the preceding more global evaluations. Examination of the specific genes involved provides a unique perspective on the functional requirements of the two tissues. The highest expressed and most highly differential genes were tabulated for the DRG (Table 1) and sciatic (Table 2) and divided into functional categories. Because of the large number of differentially expressed genes, these tables were curated based on functional categories rather than mathematical parameters, although in each category genes are arranged from highest to lowest expression. These two tables contain only a sampling of the differentially expressed DRG and sciatic genes and the full datasets are presented in Supplementary Tables 1 and 2, respectively.
Table 1.
Transcripts showing strong differential expression in DRG
| Gene symbol | Gene name | DRG RPKM | Sciatic RPKM | Fold DRG enriched |
|---|---|---|---|---|
| Cytoskeleton | ||||
| Nefl | Neurofilament, light polypeptide | 3773.2 | 3.0 | 1202.1 |
| Nefm | Neurofilament, medium polypeptide | 3463.1 | 2.7 | 1229.3 |
| Nefh | Neurofilament, heavy polypeptide | 1605.7 | 0.7 | 2049.0 |
| Tubb3 | Tubulin, beta 3 | 1224.0 | 8.7 | 138.8 |
| Stmn2 | Stathmin-like 2 | 929.9 | 7.8 | 118.0 |
| Prph | Peripherin | 810.3 | 4.8 | 165.2 |
| Stmn3 | Stathmin-like 3 | 444.7 | 7.8 | 56.1 |
| Avil | Advillin | 215.5 | 1.4 | 142.6 |
| Tuba4a | Tubulin, alpha 4a | 204.2 | 2.6 | 74.4 |
| Vesicles, SNARE, fusion | ||||
| Snap25 | Synaptosomal-associated protein, 25kDa | 741.7 | 1.3 | 535.8 |
| Cplx1 | Complexin 1 | 296.3 | 0.8 | 337.2 |
| Syp | Synaptophysin | 208.5 | 0.5 | 328.6 |
| Sv2c | Synaptic vesicle glycoprotein 2C | 122.1 | 0.5 | 211.1 |
| Rph3a | Rabphilin 3A homolog | 117.8 | 0.2 | 460.3 |
| Synpr | Synaptoporin | 97.1 | 0.1 | 423.5 |
| Slc17a7 | Solute carrier family 17, member 7 | 92.2 | 0.0 | 793.8 |
| Syt2 | Synaptotagmin II | 91.4 | 0.0 | 632.9 |
| Cadps | Calcium-dependent secretion activator | 84.2 | 0.3 | 215.1 |
| Ap3b2 | Adaptor-related protein complex 3, beta 2 subunit | 72.3 | 0.4 | 139.7 |
| Syt4 | Synaptotagmin IV | 66.0 | 0.2 | 228.9 |
| Stx1b | Syntaxin 1B | 65.6 | 0.8 | 75.1 |
| Syn1 | Synapsin I | 55.9 | 0.7 | 73.8 |
| Slc17a6 | Solute carrier family 17, member 6 | 28.1 | 0.0 | 261.2 |
| Stxbp5l | Syntaxin binding protein 5-like | 6.2 | 0.0 | 57.6 |
| Peptides/chaperones/granins | ||||
| Calca | Calcitonin-related polypeptide alpha | 605.1 | 0.5 | 982.5 |
| Tac1 | Tachykinin, precursor 1 | 182.7 | 0.2 | 674.3 |
| Scg5 | Secretogranin V (7B2) | 115.6 | 0.6 | 170.7 |
| Scg2 | Secretogranin II | 110.6 | 0.1 | 446.3 |
| Calcb | Calcitonin-related polypeptide beta | 86.4 | 0.2 | 337.0 |
| Chgb | Chromogranin B | 84.3 | 0.1 | 375.7 |
| Chga | Chromogranin A | 60.5 | 0.2 | 173.5 |
| Sst | Somatostatin | 39.1 | 0.1 | 189.9 |
| Channels and pumps | ||||
| Atp1b1 | ATPase, Na+/K+ transporting, beta 1 polypeptide | 520.8 | 5.0 | 101.3 |
| Atp1a3 | ATPase, Na+/K+ transporting, alpha 3 polypeptide | 142.4 | 0.2 | 498.9 |
| Scn4b | Sodium channel, voltage-gated, type IV, beta | 129.4 | 0.1 | 557.5 |
| Kcnab2 | Potassium voltage-gated channel, shake-related subfamily, beta member 2 | 122.4 | 2.2 | 53.0 |
| P2rx3 | Purinergic receptor P2X, ligand-gated ion channel, 3 | 85.0 | 0.5 | 135.6 |
| Scn10a | Sodium channel, voltage-gated, type X, alpha subunit | 79.2 | 0.0 | 732.6 |
| Glrb | Glycine receptor, beta | 78.1 | 0.2 | 298.7 |
| Gabrg2 | Gamma-aminobutyric acid (GABA) A receptor, gamma 2 | 66.9 | 0.1 | 432.5 |
| Slc24a2 | Solute carrier family 24 (sodium/potassium/calcium exchanger), member 2 | 66.5 | 0.9 | 64.7 |
| Gabra2 | Gamma-aminobutyric acid (GABA) A receptor, alpha 2 | 62.1 | 0.1 | 260.1 |
| Scn11a | Sodium channel, voltage-gated, type XI, alpha subunit | 59.5 | 0.0 | 516.5 |
| Cacng7 | Calcium channel, voltage-dependent, gamma subunit 7 | 45.6 | 0.2 | 148.2 |
| Scn8a | Sodium channel, voltage gated, type VIII, alpha subunit | 37.6 | 0.2 | 124.7 |
| Gabrg1 | Gamma-aminobutyric acid (GABA) A receptor, gamma 1 | 29.4 | 0.0 | 244.9 |
| Grin1 | Glutamate receptor, ionotropic, N-methyl D-aspartate 1 | 22.1 | 0.1 | 138.3 |
| Gabrb3 | Gamma-aminobutyric acid (GABA) A receptor, beta 3 | 21.9 | 0.1 | 129.4 |
| Growth factors/receptors/transcriptional reg | ||||
| Fgf13 | Fibroblast growth factor 13 | 178.0 | 0.7 | 209.9 |
| Ngfr | Nerve growth factor receptor (TNFR superfamily, member 16) | 170.9 | 3.0 | 54.6 |
| Zcchc18 | Zinc finger, CCHC domain containing 18 | 94.6 | 1.4 | 64.1 |
| Tagln3 | Transgelin 3 | 80.6 | 0.7 | 102.7 |
| Dner | Delta/notch-like EGF repeat containing | 74.1 | 0.6 | 106.3 |
| Bex2 | Brain expressed X-inked 2 | 72.9 | 0.8 | 83.2 |
| Ntrk1 | Neurotrophic tyrosine kinase, receptor, type 1 | 65.1 | 0.3 | 158.2 |
Table 2.
Transcripts showing strong differential expression in sciatic nerve
| Gene symbol | Gene name | Sciatic RPKM | DRG RPKM | Fold sciatic enriched |
|---|---|---|---|---|
| Myelin | ||||
| Mpz | Myelin protein zero | 20036.3 | 3487.6 | 5.7 |
| Pmp22 | Peripheral myelin protein 22 | 10888.9 | 1541.4 | 7.1 |
| Mbp | Myelin basic protein | 4215.8 | 689.5 | 6.1 |
| Pmp2 | Peripheral myelin protein 2 | 1715.5 | 259.5 | 6.6 |
| Mal | Mal, T-cell differentiation protein | 1070.3 | 134.2 | 8.0 |
| Prx | Periaxin | 675.8 | 113.5 | 5.9 |
| Ncmap | Noncompact myelin associated protein | 645.7 | 121.4 | 5.3 |
| Ugt8 | UDP glycosyltransferase 8 | 408.5 | 59.1 | 6.9 |
| Cnp | 2′,3′-cyclic nucleotide 3′ phosphodiesterase | 251.3 | 72.6 | 3.5 |
| Cldn19 | Claudin 19 | 223.6 | 38.2 | 5.8 |
| Pllp | Plasma membrane proteolipid (plasmolipin) | 205.7 | 34.1 | 6.0 |
| Cldn1 | Claudin 1 | 90.4 | 7.4 | 12.1 |
| Emp2 | Epithelial membrane protein 2 | 84.7 | 14.2 | 5.9 |
| Emp1 | Epithelial membrane protein 1 | 79.3 | 11.7 | 6.7 |
| Cldn5 | Claudin 5 | 52.8 | 17.4 | 3.0 |
| Tjp1 | Tight junction protein 1 | 40.4 | 12.6 | 3.2 |
| Cldn22 | Claudin 22 | 11.0 | 0.4 | 22.2 |
| ECM proteins | ||||
| Vim | Vimentin | 1891.6 | 457.1 | 4.1 |
| Dcn | Decorin | 1500.6 | 200.2 | 7.5 |
| Col3a1 | Collagen, type III, alpha 1 | 1090.5 | 86.3 | 12.6 |
| Collai | Collagen, type I, alpha 1 | 964.6 | 74.6 | 12.9 |
| Mgp | Matrix Gla protein | 607.6 | 175.2 | 3.5 |
| Tpm4 | Tropomyosin 4 | 362.7 | 85.2 | 4.3 |
| Lum | Lumican | 217.4 | 58.8 | 3.7 |
| Gpc3 | Glypican 3 | 148.5 | 15.4 | 9.6 |
| Acta2 | Smooth muscle aortic alpha-actin | 142.6 | 20.2 | 7.0 |
| Col6a1 | Collagen, type VI, alpha 1 | 122.0 | 15.5 | 7.8 |
| Col4a1 | Collagen, type IV, alpha 1 | 119.3 | 32.9 | 3.6 |
| Pcolce | Procollagen C-endopeptidase enhancer | 117.1 | 14.2 | 8.2 |
| Col6a2 | Collagen, type VI, alpha 2 | 112.4 | 16.6 | 6.7 |
| Col5a2 | Collagen, type V, alpha 2 | 87.1 | 17.0 | 5.1 |
| Aebp1 | AE-binding protein 1 | 71.3 | 10.2 | 6.9 |
| Col14a1 | Collagen, type XIV, alpha 1 | 61.2 | 13.2 | 4.6 |
| Col5a1 | Collagen, type V, alpha 1 | 41.9 | 13.3 | 3.1 |
| Cpxm2 | Carboxypeptidase X2 | 37.9 | 5.5 | 6.8 |
| Col24a1 | Collagen, type XXIV, alpha 1 | 23.0 | 6.0 | 3.8 |
| Col6a3 | Collagen, type VI, alpha 3 | 16.5 | 4.4 | 3.7 |
| Colec12 | Collectin sub-family member 12 | 13.4 | 2.7 | 4.8 |
| Col9a1 | Collagen, type IX, alpha 1 | 10.7 | 0.7 | 13.5 |
| Cpxm1 | Carboxypeptidase X1 | 10.3 | 3.2 | 3.2 |
| Col11a1 | Collagen, type XI, alpha 1 | 7.9 | 1.8 | 4.2 |
| Col4a5 | Collagen, type IV, alpha 5 | 5.3 | 1.2 | 4.2 |
| Col1a2 | Collagen, type I, alpha 2 | 3.4 | 0.6 | 5.0 |
| Processing enzymes | ||||
| Pam | Peptidylglycine alpha-amidating monooxygenase | 209.3 | 56.7 | 3.7 |
| Maob | Monoamine oxidase B | 167.4 | 22.0 | 7.6 |
| Aspa | Aspartoacylase | 98.1 | 22.2 | 4.4 |
| Padi2 | Peptidyl arginine deiminase, type II | 31.8 | 6.8 | 4.6 |
| Ace | Angiotensin converting enzyme | 25.8 | 2.4 | 10.4 |
| Pcsk6 | Proprotein convertase subtilisin/kexin type 6 | 20.0 | 4.6 | 4.3 |
| Cpa3 | Carboxypeptidase A3 | 17.3 | 0.1 | 87.0 |
| Cpz | Carboxypeptidase Z | 16.8 | 1.8 | 8.9 |
| Growth factors and TFs | ||||
| Ndrg1 | N-myc downstream regulated 1 | 645.4 | 132.4 | 4.9 |
| Igfbp6 | Insulin-like growth factor binding protein 6 | 563.7 | 29.5 | 19.0 |
| Igfbp7 | Insulin-like growth factor binding protein 7 | 500.7 | 90.9 | 5.5 |
| Sema3b | Semaphorin 3B | 381.9 | 104.2 | 3.7 |
| Lect1 | Leukocyte cell derived chemotaxin 1 | 344.2 | 79.4 | 4.3 |
| Sema5a | Semaphorin 5A | 94.9 | 17.4 | 5.4 |
| Fgf7 | Fibroblast growth factor 7 | 70.4 | 8.9 | 7.8 |
| Slit2 | Slit homolog 2 | 30.6 | 9.0 | 3.4 |
| Bmp1 | Bone morphogenetic protein 1 | 29.4 | 9.2 | 3.2 |
| Egr2 | Early growth response 2 | 27.4 | 8.8 | 3.1 |
| Sema4g | Semaphorin 4G | 21.2 | 5.1 | 4.1 |
| Foxo4 | Forkhead box O4 | 20.9 | 5.1 | 4.0 |
| Fzd2 | Frizzled homolog 2 | 16.4 | 2.8 | 5.7 |
| Bmp4 | Bone morphogenetic protein 4 | 10.5 | 1.0 | 9.6 |
| Fgf4 | Fibroblast growth factor 4 | 9.1 | 1.2 | 7.1 |
| Proteostasis | ||||
| Cryab | Crystallin, alpha B | 664.6 | 108.3 | 6.1 |
| Ctsh | Cathepsin H | 203.0 | 51.4 | 3.9 |
| Hspa2 | Heat shock 70kDa protein 2 | 111.6 | 20.4 | 5.4 |
| Hspb2 | Heat shock 27kDa protein 2 | 43.2 | 10.1 | 4.2 |
| Psmb8 | Proteasome subunit beta type-8 | 7.0 | 2.2 | 3.2 |
| Metal handling | ||||
| Fth1 | Ferritin heavy chain | 8316.5 | 1696.3 | 4.9 |
| S100a6 | S100a6 | 1498.6 | 471.6 | 3.2 |
| S100a4 | S100a6 | 526.9 | 81.8 | 6.4 |
| Sepp1 | Selenoprotein P | 469.2 | 103.2 | 4.5 |
| Tf | Transferrin | 151.7 | 21.9 | 6.9 |
| S100a3 | S100a3 | 39.4 | 6.8 | 5.7 |
| Complement | ||||
| C1r | Complement C1r subcomponent | 90.0 | 12.1 | 7.4 |
| C1s | Complement C1s subcomponent | 88.0 | 9.3 | 9.3 |
| C4b | Complement C4-B | 42.6 | 0.6 | 61.6 |
| C2 | Complement C2 | 33.1 | 3.3 | 9.7 |
| C1qc | Complement C1q subcomponent subunit C | 29.4 | 6.5 | 4.5 |
| C1ql3 | Complement C1q-like protein 3 | 27.7 | 5.6 | 4.9 |
| C1qa | Complement C1q subcomponent subunit A | 27.4 | 5.5 | 4.9 |
| C6 | Complement component C6 | 10.9 | 0.4 | 23.9 |
| C1qtnf6 | Complement C1q tumor necrosis factor-related protein | 10.5 | 1.9 | 5.4 |
| C1qtnf9 | Complement C1q tumor necrosis factor-related protein | 4.0 | 0.4 | 8.2 |
Fold enrichment is smaller in the sciatic nerve relative to the DRG because sciatic nerve Schwann cells are represented in the DRG.
DRG Transcriptomics
In DRG, many of the highly expressed and highly differential genes mediate neuron-specific functions (Table 1, Fig 4.). Examples comprise the molecular machinery for vesicle fusion, the contents of such vesicles (e.g. neuropeptides, granins), neuron specific cytoskeletal components, molecular components necessary for transmitting regenerative action potentials (Scn4b, and two sodium potassium ATPases) and noci-responsive ion channels (Julius, 2013). All were strongly and strongly differentially expressed. What also became apparent was that the gene for one of the most highly expressed DRG transcripts, neurofilament light chain (Nefl), when mutated, also caused a CMT neuropathy (Jordanova et al., 2003), CMT2E, which is characterized by a progressive peripheral sensory and motor axon neuropathy.
Figure 4. Most abundant transcripts greater than >3 fold differentially expressed in DRG relative to sciatic nerve.
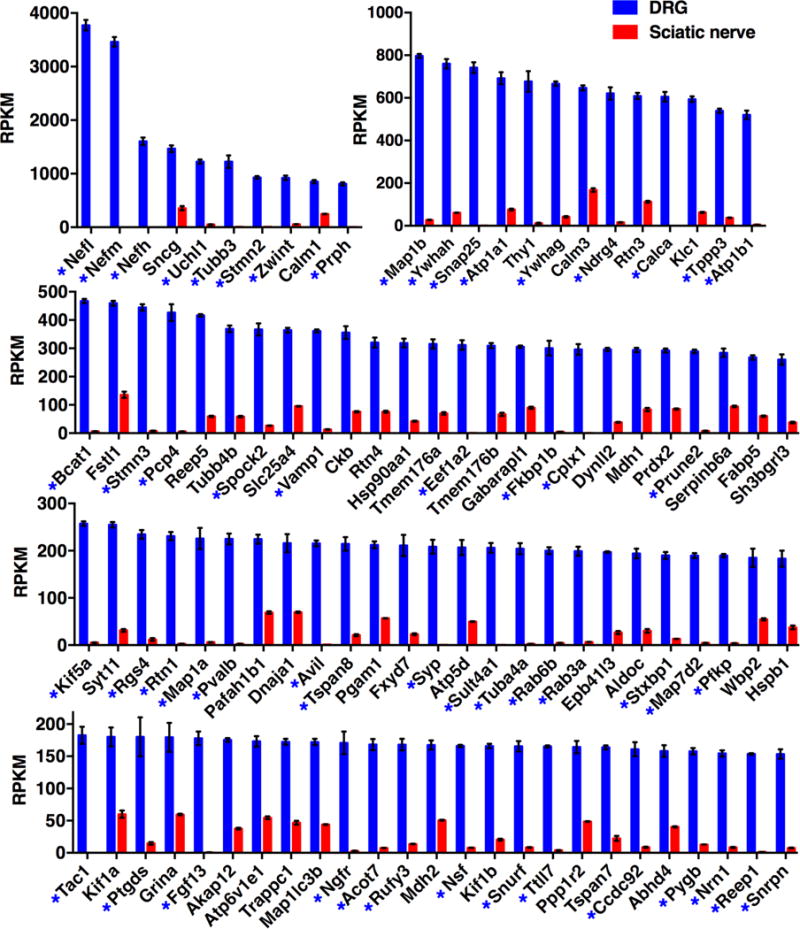
Transcriptomics data were filtered for genes >3 fold differentially expressed in DRG relative to sciatic, and ordered by RPKM value. Genes >10 fold differentially expressed are marked with an asterisk. Error bars show SEM. DRG n =8, sciatic nerve n = 4.
Sciatic Nerve Transcriptomics
In the sciatic nerve, the most highly expressed, highly differential genes were the major myelin components and extracellular matrix (ECM) proteins such as vimentin, decorin and glypican (Table 2). The sciatic nerve also expressed secretory pathway processing enzymes, proteins involved in cell growth and differentiation (e.g., NDRG1 and IGF binding proteins), and several proteins in the complement system. These functional gene groups are highlighted because they implicate a network of activity central to Schwann cells or supportive fibroblasts. What became evident during this analysis is that several of the very highly expressed, highly differential genes in sciatic nerve, such as Ndrg1 and myelin components are molecular substrates of CMT neuropathies, and pathological mutations in these genes have been identified in humans (Hunter et al., 2003; Rossor et al., 2013).
Among the significantly changing genes (p <0.05) a subset was selected for strongly differential expression, defined as >3 fold differential expression (Supplementary Tables 1 and 2, respectively). Because of the large number of differential genes between these two tissues, we focus on the >3 fold differentially expressed genes to better estimate the biologically significant genes that define either the DRG (Fig 4) or sciatic nerve (Fig 5). Genes that were >10 fold differential are marked with an asterisk. In general, strongly neuron-specific genes in DRG are in the >10-fold category. In contrast, fewer genes are >10 fold differential in the sciatic compared to DRG. As shown in Figure 1, myelinated axons are also present within DRG. Since most cells in the sciatic are also present in the DRG, although in smaller numbers, the finding that any gene would be >10 fold differentially expressed suggested additional cell types present in the sciatic nerve that are not present in DRG. Many of the >10 fold enriched sciatic (red asterisks, Fig 5) genes are characteristic of adipose tissue and are likely contributed by adipocytes in and around the nerve.
Additional Cell Populations in Sciatic Nerve
The analysis of whole tissues, by definition, will contain several cell types. Some populations in the nerve, such as fibroblasts, are expected due to the presence of the epineurial, perineurial and endoneurial connective tissue sheaths. Other distinctive transcriptional signals may be the result of genuine signals from other known sources (e.g., reticulocytes in blood vessels), contamination by adherent tissue, or cell populations not well appreciated because they are only sparsely reported in the literature. We encountered all of these possibilities in the sciatic and the two most well represented types, adipocytes and fibroblasts, are briefly treated here.
Adipocytes in Sciatic Nerve
In examining the graphs of the differentially expressed genes in sciatic (Figure 5) we observed several that had a substantially higher standard error than most of the genes in the group and showed a higher fold differential than expected given the presence of most sciatic nerve cell types within the DRG. Further analysis showed that the fat cell genes covaried by sample number with one nerve sample exhibiting low levels of fat cell transcripts (Fig. 6A sample 1), another being well enriched (Fig 6A sample 2) with the remaining two exhibiting intermediate levels. Extracting genes that followed this pattern allowed us to identify the major transcripts comprising the fat cell signature. Those encoding proteins such as fatty acid binding protein 4 (Fabp4)(Shan et al., 2013), adiponectin (Adipoq)(Hu et al., 1996) and leptin (Lep)(Caro et al., 1996), are reported to be adipocyte markers. Based on the variable pattern of expression we hypothesized that the fat cells were unevenly distributed in the nerve and addressed this question by neuroanatomical analysis of paraffin sections of fixed sciatic nerve (Fig 6B) and by staining sciatic nerve whole mounts with oil red O (Fig 6C). Both methods showed the presence of fat cells between nerve fascicles. The accumulations of fat cells were apparent in the whole mount as translucent but bright red globular cells separated by the nerve fascicles and connective tissue. Adipocytes became more evident as the sciatic trunk began to divide distally into individual nerve fascicles and even more prominent still as the nerve trunk split up nearer the popliteal fossa. While our gross dissections used for transcriptome analysis did not extend that distally, there were enough fat cells more proximally to provide readily detectable transcriptional signals in all 4 samples, with highly variable levels between the samples indicative of different amounts of fat cells in each. While we articulate an “anatomical admixture” frame of reference for the adipocyte signature, adipocytes may have additional roles in nerve repair since adipose-derived stem cells can transdifferentiate and exhibit Schwann cell-like characteristics (Tomita et al., 2013). What is also clear is that the DRG does not contain a fat cell signature.
Figure 6. Characterization of intrafascicular and adherent adipose tissue in the sciatic nerve.
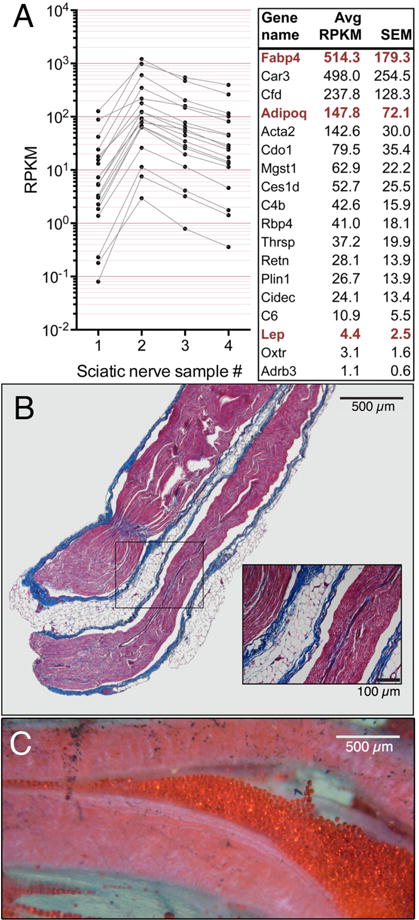
Genes observed to be highly enriched in the sciatic and highly variable were plotted by individual sample. A subset of these genes followed a pattern that varied by sample number suggesting a subpopulation that was present in all samples in variable amounts.
We also present a comprehensive list of sciatic nerve-enriched GPCRs (Fig. 7). The sample-to-sample variance was used to differentiate adipose-like and non-adipose patterns of GPCR expression and therefore the Schwann and adipocyte subgroups of GPCRs are presented separately.
Figure 7. GPCR expression in sciatic nerve.
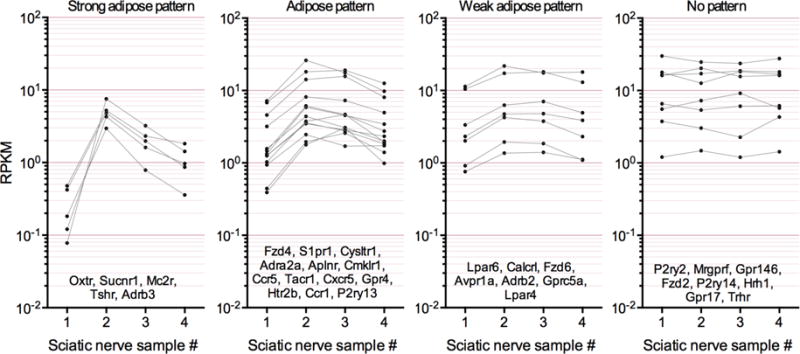
Differentially expressed GPCRs in sciatic nerve were extracted and plotted by sample number to observe sample-to-sample variation. These genes were subsequently subcategorized by degree of sample to sample variation, used here as a surrogate for contribution from variable levels of adipose or other adherent tissue (see Figure 6). GPCRs with a weak pattern or no pattern of sample to sample variation are most likely expressed by major cell types of the sciatic nerve, such as Schwann cells, while those with a strong variable pattern indicate that they are most likely produced by adipose (leftmost panel).
Fibroblasts in sciatic nerve
In addition to Schwann cells and adipocytes, the molecular signature of a third population could be attributed to fibroblasts. The presence of fibroblasts was revealed by the presence of high transcript levels for multiple subunits of collagen. This population could be discriminated in part by the strong enrichment in sciatic nerve relative to DRG and includes Col3a1 and Collai among the most highly expressed differential sciatic genes. In addition, several other collagens are enriched in the sciatic nerve including Col4a1, Col5a1 and 2, Col6a1, 2 and 3, Col14a1 and Col24a1. The level of expression for these genes does not substantially vary by sample number indicating a more even distribution in the sciatic nerve relative to adipocytes, as might be expected from cells that generate the endo-, peri-, and epineurial sheaths found throughout the nerve. Interestingly, the Schwann cells themselves express the collagen paralogs Col6a1, 6a2 and 6a3 (Chen et al., 2014) and these transcripts exhibit less variation than the fibroblast enriched collagens and are enriched in sciatic nerve, but present in DRG, consistent with Schwann cell expression.
III. Comparison of CMT and Pain Channelopathy/Defect Transcript Levels
Two subsets of genes were extracted from the DRG and sciatic nerve datasets based on whether mutations or copy number variations in those genes had been implicated either in CMT, related sensory neuropathies, or pain channelopathies. Transcripts corresponding to CMT neuropathies are plotted in Figure 8A according to transcript abundance (RPKM) on the x-axis and fold difference (DRG/sciatic) on the y-axis with DRG enriched transcripts in blue and sciatic enriched transcripts in red as assessed according to DESEQ significance for the raw count data from the sequencing runs. Similar parameters were applied to the pain channelopathy transcripts (Fig 8B). The degree of fold change between the nociception transmitting or modifying genes compared to many of the CMT genes is notable, as all of the pain modifying genes are highly specific for the DRG.
Figure 8. Transciptomic analysis of Charcot Marie Tooth and pain channelopathy and insensitivity genes in rat DRG and sciatic nerve.
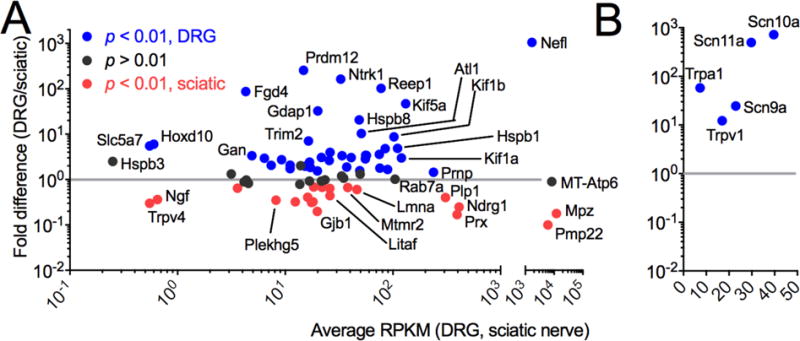
(A) DRG and sciatic nerve tissue were collected, and RNA was extracted, sequenced and mapped. Genes are plotted by fold difference between tissues vs. average RPKM, and colored according to significance values. Grey line at 1 indicates no change. Nefl, MT-Atp6, Mpz and Pmp22 are plotted on a separate axis because of their high level of expression, and are among the highest expressed genes in DRG and/or sciatic nerve. Five genes (Hsbp3, Slc5a7, Hodx10, Trpv4 and Ngf) are expressed below 1 RPKM in the adult rat. In general, some peripheral neuropathy genes are either highly expressed or highly differential between sciatic nerve and DRG, although the majority of the genes are common to both tissues. (B) All pain channelopathy genes are highly enriched in the DRG. DRG n = 8, sciatic nerve n =4.
Categorization and Body-Wide Distribution of CMT and Pain Channelopathy/Defect Genes
In Tables 3 and 4 the CMT and pain channelopathy genes, respectively, are organized according to functional categories. Data were also collected from our previously published studies and integrated encompassing expression data from human, rat and mouse. These three species are generally in accordance, with some differences between rat sciatic nerve and human tibial nerve, especially Mpz and Pmp22, which are much lower in human tibial nerve. The selected genes span functional categories ranging from structural components of the neuron or Schwann cell, to transcriptional regulators. Notably, several tRNA synthetases have been implicated in neuropathies (Wallen and Antonellis, 2013), as well as a number of genes related to mitochondrial function. The number of CMT disorders and the range of possible phenotypic variation in humans is perhaps expected given the ubiquitous function of these genes. Others, such as myelin components and neurofilament light chain are highly enriched in Schwann cells and neurons, respectively.
Table 3.
Transcriptional profiling of genes underlying peripheral neuropathies.
| Gene Symbol | Gene Name | Disease Phenotype | TRPV1 Lineage | Non-TRPV1 Lineage | DRG | Sciatic | DRG | Tibial |
|---|---|---|---|---|---|---|---|---|
|
| ||||||||
| Mouse | Rat | Human | ||||||
|
|
||||||||
| Proteostasis/folding | ||||||||
| Prnp | Prion protein | HSAN + dementia | 149.2 | 214.0 | 281.3 | 194.9 | 263.7 | 93.2 |
| Hspb8 | Heat shock protein, beta 8 | CMT2L | 184.9 | 81.6 | 92.9 | 4.4 | 31.3 | 7.1 |
| Cct5 | T-complex protein 1 subunit epsilon | HSN+SPG | 92.6 | 78.6 | 111.4 | 66.9 | 43.9 | 31.0 |
| Dnajb2 | (Hsp40) homolog, subfamily B, member 2 | DSMA5 | 23.1 | 30.1 | 60.0 | 38.3 | 32.2 | 57.5 |
| Trim2 | Tripartite motif containing 2 | CMT2 | 37.9 | 58.1 | 28.9 | 4.0 | 55.6 | 5.5 |
| Channel | ||||||||
| Gjb1 | Gap junction protein, beta-1, 32kD (connexin 32) | CMTX | 0.8 | 10.7 | 6.5 | 33.2 | 1.3 | 11.8 |
| Atp7a | ATPase, Cu(2+)-transporting | CMT2-like | 2.3 | 2.5 | 3.6 | 2.7 | 3.4 | 2.2 |
| Transcriptional regulation | ||||||||
| Prdm12 | PR Domain Containing 12 | CIPS | 136.4 | 21.8 | 29.6 | 0.0 | 11.3 | 0.0 |
| Egr2 | Early growth response 2 | CMT1 | 3.3 | 8.4 | 8.8 | 27.4 | 5.0 | 30.2 |
| Med25 | Mediator of RNA polymerase II transcription, subunit 25 | CMT2B2 | 20.8 | 13.1 | 18.6 | 9.2 | 3.7 | 19.5 |
| Ikbkap | Inhibitor of kappa light polypeptide gene enhancer in B-cells, kinase | HSAN3 | 7.7 | 9.3 | 14.1 | 8.1 | 11.5 | 14.3 |
| Dnmt1 | DNA (cytosine-5-)-methyltransferase 1 | HSN1E | 7.0 | 5.8 | 3.9 | 4.4 | 5.1 | 11.6 |
| Setx | Senataxin | SCAR1 or ALS4 | 4.2 | 5.7 | 4.3 | 4.4 | 10.7 | 9.6 |
| Ighmbp2 | Immunoglobulin mu binding protein 2 | DSMA1 | 1.8 | 2.9 | 9.6 | 3.2 | 3.1 | 6.4 |
| Ctdp1 | Carboxy-terminal domain, RNA polymerase II, polypeptide A phosphatase, subunit 1 | CMT1 | 3.7 | 3.4 | 4.1 | 5.0 | 2.5 | 6.0 |
| Hoxd10 | Homeo box-D10 | CMT + CVT | 1.1 | 1.2 | 1.1 | 0.1 | 1.2 | 1.5 |
| Cytoskeletal | ||||||||
| Nefl | Neurofilament, light polypeptide | CMT2E | 535.7 | 2808.3 | 3380.5 | 3.1 | 1211.5 | 0.8 |
| Prx | Periaxin | CMT1 | 17.3 | 132.2 | 113.5 | 675.8 | 29.2 | 337.4 |
| Reep1 | Receptor accessory protein 1 | HMN5B or SPG31 | 169.9 | 130.4 | 153.6 | 1.4 | 212.6 | 1.1 |
| Atl1 | Atlastin-1 | HSN1D | 72.2 | 55.3 | 93.0 | 8.9 | 91.0 | 9.0 |
| Dst | Dystonin | HSAN4, lethal | 34.8 | 65.9 | 87.8 | 25.7 | 81.3 | 19.0 |
| Fbln5 | Fibulin 5 | CMT1 + | 7.2 | 19.3 | 36.1 | 33.7 | 84.6 | 60.9 |
| Lmna | Lamin A | CMT2B1 | 30.1 | 28.2 | 34.9 | 57.8 | 37.7 | 82.9 |
| Tfg | TRK-fused gene | CMT2 | 51.4 | 51.6 | 48.6 | 25.8 | 52.1 | 21.0 |
| Fgd4 | FYVE, RhoGEF, and PH domain-containing protein 4 | CMT4H | 1.4 | 2.2 | 8.6 | 0.0 | 7.2 | 7.5 |
| Inf2 | Inverted formin 2 | CMTDIE | 8.1 | 16.5 | no data | no data | 21.0 | 95.8 |
| Gan | Gigaxonin | GAN | 4.8 | 3.9 | 7.6 | 2.2 | 1.9 | 0.7 |
| Axonal transport and trafficking | ||||||||
| Kif5a | Kinesin heavy chain isoform 5A | CMT2 | 234.8 | 168.4 | 257.5 | 5.4 | 166.9 | 4.5 |
| Kif1b | Kinesin family member 1B | CMT2A1 | 98.8 | 165.7 | 183.6 | 21.0 | 43.1 | 8.9 |
| Hspb1 | Heat shock protein, beta 1 | CMT2F | 32.1 | 42.7 | 183.4 | 37.6 | 54.4 | 141.6 |
| Kif1a | Kinesin family member 1A | HSN2C or SPG30 | 168.7 | 170.3 | 180.2 | 60.1 | 59.9 | 24.6 |
| Dctn1 | Dynactin-1 | HMN7B | 155.9 | 114.6 | 140.5 | 29.1 | 85.8 | 29.6 |
| Bscl2 | Berardinelli-Seip congenital lipodystrophy 2 | CMT2D-like | 49.9 | 38.3 | 37.2 | 14.1 | 146.0 | 1.9 |
| Dync1h1 | Dynein, cytoplasmic, heavy chain 1 | CMT2O | 67.9 | 85.8 | 117.0 | 32.5 | 90.2 | 33.6 |
| Fam134b | Family with sequence similarity 134, member B | HSAN2B/1B | 38.9 | 31.7 | 56.3 | 42.9 | 42.0 | 13.8 |
| Myh14 | Myosin, heavy chain 14, non-muscle | PNMHH | 8.7 | 23.5 | 17.6 | 26.3 | 7.5 | 12.0 |
| Dnm2 | Dynamin-2 | CMT2 | 15.1 | 16.3 | 16.1 | 17.4 | 11.9 | 26.3 |
| Bicd2 | Bicaudal D homolog 2 | SMALED | 14.1 | 12.4 | 23.2 | 23.6 | 9.7 | 9.9 |
| Cltcl1 | Clathrin heavy chain 22 | CIPS + touch insensitive | N.O. | N.O. | N.O. | N.O. | 5.1 | 6.1 |
| Endosomal sorting and cell signaling | ||||||||
| Ndrg1 | N-myc downstream-regulated gene 1 | CMT4D | 57.6 | 174.0 | 164.0 | 659.4 | 162.9 | 418.3 |
| Rab7a | Ras-associated protein RAB7A | CMT2B | 180.8 | 117.0 | 105.6 | 103.9 | 116.5 | 123.0 |
| Ntrk1 | Neurotrophic tyrosine kinase, receptor, type 1 | CIPA or HSAN4 | 85.2 | 73.1 | 65.1 | 0.3 | 32.2 | 0.3 |
| Gnb4 | Guanine nucleotide binding protein (G protein), beta polypeptide 4 | CMTD1F | 68.0 | 8.1 | 22.2 | 12.0 | 15.0 | 6.3 |
| Mtmr2 | Myotubularin-related protein 2 | CMT4B1 | 20.1 | 26.6 | 30.4 | 45.7 | 17.6 | 8.9 |
| Litaf | LPS-induced TNFA factor | CMT1C | 13.0 | 7.2 | 15.9 | 36.1 | 32.1 | 39.2 |
| Lrsam1 | Leucine rich repeat and sterile alpha motif containing 1 | CMT2P | 34.5 | 35.1 | 23.8 | 9.8 | 9.6 | 7.8 |
| Wnk1 | WNK lysine deficient protein kinase 1 | HSAN2A | 20.0 | 27.0 | 20.8 | 22.5 | 24.5 | 19.9 |
| Sbf2 | SET binding factor 2 (MTMR13) | CMT4B2 | 4.1 | 8.1 | 8.3 | 26.8 | 9.0 | 12.8 |
| Fig4 | SAC domain-containing inositol phosphatase | CMT4J | 25.1 | 16.6 | 14.9 | 21.8 | 14.0 | 6.6 |
| Sbf1 | SET binding factor 1 (MTMR5) | CMT1 | 21.7 | 16.9 | 20.3 | 10.3 | 8.6 | 23.6 |
| Sh3tc2 | SH3 domain and tetratricopeptide repeats 2 | CMT1 | 0.6 | 3.5 | 6.0 | 18.8 | 1.2 | 4.8 |
| Plekhg5 | Pleckstrin homology domain containing, family G member 5 | RI-CMT | 1.6 | 8.3 | 4.2 | 12.2 | 4.4 | 16.3 |
| Chm | Choroideremia (Rab escort protein 1) | CMT1B | 8.9 | 8.6 | 10.0 | 4.8 | 9.9 | 3.0 |
| Mitochondrial | ||||||||
| MT-Atp6 Mitochondrially encoded ATP synthase 6 | CMT2 | no data | no data | 7829.8 | 8726.0 | no data | no data | |
| Hk1 | Hexokinase 1 | CMT1 | 85.6 | 76.0 | 82.1 | 28.7 | 67.0 | 17.6 |
| Mfn2 | Mitofusin 2 | CMT2A2 | 50.4 | 47.7 | 61.8 | 20.2 | 27.8 | 24.5 |
| Gdap1 | Ganglioside-induced differentiation-associated protein 1 | CMT2H/K | 34.5 | 35.6 | 39.0 | 1.1 | 33.4 | 5.9 |
| Pdk3 | Pyruvate dehydrogenase kinase, isozyme 3 | CMTX6 | 10.8 | 21.3 | 13.6 | 4.9 | 13.9 | 2.7 |
| Aifm1 | Apoptosis-inducing factor 1 | CMTX | 10.8 | 12.1 | 15.0 | 7.2 | 7.8 | 7.1 |
| Dhtkd1 | Dehydrogenase E1 and transketolase domain containing 1 | CMT2 | 0.3 | 1.0 | 2.8 | 4.4 | 5.4 | 8.7 |
| Myelin sheath | ||||||||
| Mpz | Myelin protein zero | CMT1B | 244.7 | 3387.1 | 3638.5 | 20467.3 | 228.0 | 2057.8 |
| Pmp22 | Peripheral myelin protein-22 | CMT1A | 384.7 | 1334.2 | 1107.4 | 11105.4 | 540.3 | 1329.1 |
| Plp1 | Proteolipid protein 1 | CMT1A | 66.1 | 188.3 | 176.4 | 439.7 | 311.9 | 210.9 |
| Nucleotide and tRNA Synthesis | ||||||||
| Aars | Alanyl-tRNA synthetase | CMT2N | 23.2 | 38.3 | 86.4 | 25.1 | 32.9 | 43.3 |
| Gars | Glycyl-tRNA synthetase | CMT2D | 81.9 | 64.4 | 9.3 | 23.0 | 53.7 | 27.3 |
| Hars | Histidyl-tRNA synthetase | CMT2 | 50.5 | 50.7 | 52.0 | 15.4 | 32.2 | 16.9 |
| Yars | Tyrosyl-tRNA synthetase | CMTDIC | 25.1 | 29.8 | 41.7 | 10.4 | 16.5 | 9.2 |
| Kars | Lysyl tRNA synthetase | CMTRIB | 29.1 | 29.6 | 36.4 | 30.4 | 34.9 | 35.9 |
| Prps1 | Phosphoribosyl pyrophosphate synthetase 1 | CMTX5 | 24.1 | 19.6 | 32.7 | 10.6 | 33.0 | 20.2 |
| Mars | Methionyl-TRNA synthetase | CMT2 | 8.9 | 9.4 | 24.2 | 15.6 | 21.7 | 27.1 |
| Very low expression | ||||||||
| Ngf | Nerve growth factor | HSAN5 | 0.3 | 0.5 | 0.3 | 1.0 | 0.6 | 7.3 |
| Slc5a7 | Solute carrier family 5 (sodium/choline cotransporter), member 7 | HMN7A | 1.3 | 0.1 | 1.0 | 0.1 | 0.6 | 0.0 |
| Trpv4 | Transient receptor potential cation channel, subfamily V, member 4 | CMT2C | 0.8 | 0.4 | 0.2 | 0.9 | 0.1 | 0.6 |
| Hspb3 | Heat shock protein, beta 3 | HMN2C | 0.1 | 0.1 | 0.4 | 0.1 | 0.0 | 0.2 |
| Other | ||||||||
| Hint1 | Histidine triad nucleotide binding protein 1 | NMAN | 245.8 | 274.1 | 97.0 | 54.3 | 228.8 | 62.3 |
| Sptlc2 | Serine palmitoyltransferase, long chain base subunit 2 | HSAN1C | 11.1 | 14.8 | 20.2 | 31.7 | 13.8 | 8.4 |
| Sptlc1 | Serine palmitoyltransferase, long chain base subunit 1 | HSAN1A | 8.3 | 8.5 | 12.0 | 15.3 | 26.7 | 13.3 |
Note: Abbreviations are given for general diseases but not for subtypes. Charcot-Marie-Tooth is classically diagnosed in two broad categories: those affecting the myelin sheath (CMT1) and those affecting the neuron (CMT2) as determined by slow or normal nerve conduction velocity, respectively. TRPV1 lineage and non-lineage datasets are re-analyzed from Goswami, et al 2014. TRPV1 lineage are sorted from the DRG and include nociceptive sensory neurons as well as TH+ hair cells. TRPV1 non-lineage samples are cells remaining in the DRG after the Trpv1 promoter is used to drive a toxic gene product, which includes neurons not expressing TRPV1, as well as non-neural cells.
Abbreviations: N.O. - no ortholog; HSAN - hereditary sensory and autonomic neuropathy; CMT, Charcot-Marie Tooth; HSN - hereditary sensory neuropathy; SPG - spastic paraplegia; DSMA - distal spinal muscular atrophy; CIPS - congenital insensitivity to pain syndrome; SCA - spinocerebellar ataxia; ALS - amyotrophic lateral sclerosis; CVT - congenital vertical talus; HMN - hereditary motor neuropathy; GAN - giant axonal neuropathy; PNMHH - peripheral neuropathy, myopathy, hoarseness and hearing loss; SMALED - spinal muscular atrophy, lower extremity-predominant, autosomal dominant; CIPA - congenital insensitivity to pain with anhidrosis; NMAN - neuromyotonia and axonal neuropathy
Table 4.
Transcriptional profiline of pain channelopathy genes
| Gene name | Protein name | Pain phenotype(s) | Trpv1 Enriched | Trpv1 depleted | DRG | Sciatic | DRG | Tibial |
|---|---|---|---|---|---|---|---|---|
|
| ||||||||
| Mouse | Rat | Human | ||||||
|
|
||||||||
| SCN10A | Nav1.8 | Gain of function: painful neuropathy | 214.8 | 59.7 | 79.2 | 0.0 | 26.8 | 0.0 |
| SCN11A | Nav1.9 | Gain of function: HSAN7, insensitivity to pain | 169.2 | 16.4 | 59.5 | 0.0 | 91.9 | 0.3 |
| TRPV1 | TRPV1 | SNPs correlate with neuropathic pain, migraine. Loss of function causes insensitivity to capsaicin. Gain of function painful. |
151.2 | 1.3 | 31.5 | 2.5 | 39.1 | 0.6 |
| SCN9A | Nav1.7 | Loss of function: insensitivity to pain Gain of function: paroxysmal extreme pain disorder, small fiber neuropathy, erythermalgia, HSAN2D |
53.9 | 31.1 | 44.2 | 1.7 | 40.6 | 3.1 |
| TRPA1 | TRPA1 | Gain of function: familial episodic pain syndrome | 23.6 | 0.9 | 14.4 | 0.2 | 9.7 | 0.0 |
Abbreviations: HSAN - hereditary sensory and autonomic neuropathy; SNP - single nucleotide polymorphism.
Some genes are expressed at extremely low levels in both DRG and sciatic nerve, presenting the possibility that their contribution is indirect. For example TRPV4 is very low in both, and mutations cause a complex phenotype in humans extending beyond peripheral nerve to include many organ systems (Lamande et al., 2011; Landoure et al., 2010). What is evident is that, while some genes are specific to either the neuronal or Schwann cell populations, the majority of the CMT genes are expressed in both cell types and at fairly equal amounts in each group. This overlap prompted us to consider whether there was a wider expression in additional tissues other than DRG and sciatic. We examined the quantitative relationships of the expression profiles in order to obtain new, objective gene expression criteria for further phenotyping and possibly organ-specific intervention. For this purpose several human databases were also examined as noted below.
Cellular distribution of CMT and Pain disorder genes
The data presented in the present manuscript provide a heuristic framework for predicting the cellular insult of pathogenic mutations related to neuropathies by explaining the quantitative relationship between expression in the two tissues containing implicated cell types: DRG sensory neurons, and sciatic nerve Schwann cells. The summary quantitative data in Fig. 9 are focused on the cellular and subcellular localization of the protein products for known CMT and pain disorder genes within neurons and Schwann cells. However, the present state of distributed in silico genetic information provided an opportunity to perform a more comprehensive investigation of the expression of CMT and pain disorder genes in many other tissues of the human body. This question is addressed in the next section and the potential predictive capability of this approach is examined subsequently.
Figure 9. Summary of transcriptomic data for CMT neuropathies and nociception-related genes.
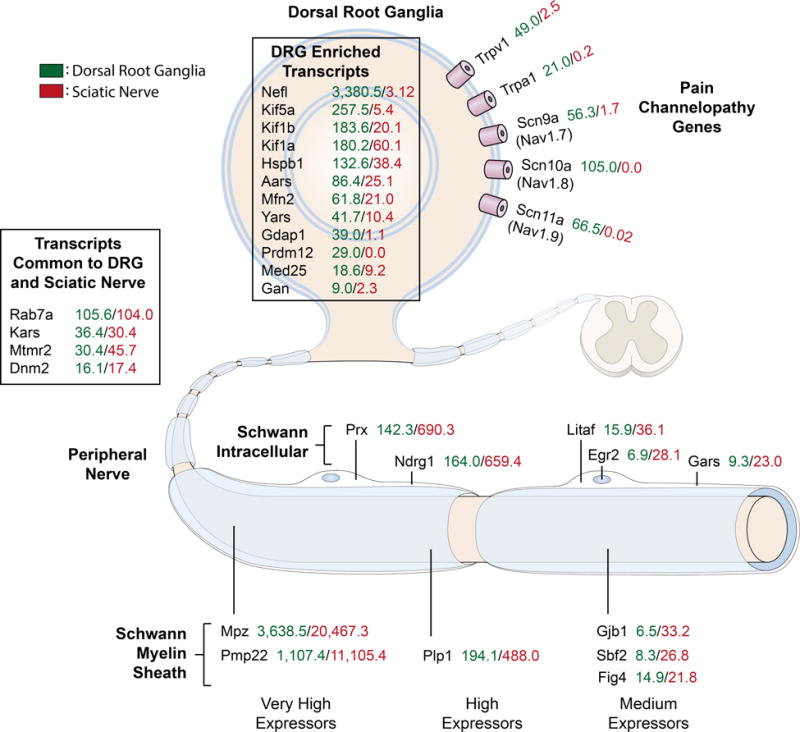
This figure was adapted from Rossor, et al (2013) with the addition of quantitative data (RPKM values) from transcriptomics experiments. This provides a quantitative measure of the level of expression of these genes between the two major tissues involved in CMT and nociception. In general these genes can be divided into the sciatic nerve/Schwann cell enriched population and the DRG population.
Human Transcriptomics of CMT and Pain Channelopathy/Defect Genes
To determine a comprehensive tissue distribution for all CMT and pain channelopathy genes, we mined FPKM values generated by RNA- Seq of 32 human tissues publicly available from the Human Protein Atlas (Uhlen et al., 2015). These data were combined with the data described in other sections of this manuscript, and normalized to the highest expression level in any tissue. These data were subdivided based on enrichment in DRG or sciatic nerve and/or nociceptive and non-nociceptive populations of DRG neurons. The six tissues (left side of Fig. 10) are arranged as follows: (1) mouse DRG TRPV1 lineage, (2) mouse DRG TRPV1 non-lineage population, (3) rat DRG, (4) rat sciatic, (5) human DRG and (6) human tibial nerve; the remaining entries are comprised of expression levels of 32 different organs/tissues of the human body. When the larger tissue expression profile is taken into consideration, 3 major categories emerged (Figure 10 top to bottom). The first category had the highest level of expression (100% - 90% of max value) within one of these six tissues. In fact for the first 20 entries in the heat map, expression is highly specific to nerve tissues. The second and third groups had a higher value in another of the 32 tissues from the Protein Atlas database. Within each group, entries are sorted by enrichment scores, which were calculated for the max tissue relative to other tissues. The second (middle) group were not enriched and are considered to be broadly expressed, while the third group are enriched in tissues other than DRG or sciatic nerve. Interestingly, the algesic chemo-responsive nociceptive ion channel TRPA1 is in this latter category because of its high expression in urinary bladder, in addition to DRG nociceptors (first column).
Transcriptomics as a Route to Neuropathy Gene Discovery
The underlying genetic targets of inherited peripheral neuropathies are incompletely elucidated. This is especially the case for axonal forms of CMT. In an analysis of over 1,000 patients examining genetic testing hit rates and phenotypic associations Saporta et al. (2011) found that 33% had no identified genetic cause, and only 10% of these had demyelinating CMT phenotype. In order to facilitate identification of additional potential CMT or pain disorder genes we generated two sets of highly differentially expressed genes from the DRG and sciatic nerve datasets. We hypothesized that highly differential genes in the DRG would be enriched for pain disorder and CMT genes, and differential genes in the sciatic would be enriched mainly for CMT neuropathies. The top 35 enriched genes in DRG and sciatic from this analysis are shown in Figure 11, while the full list of enriched genes is presented in Supplementary Fig S3–4.
Discussion
Defining the molecular composition of peripheral nerve and sensory ganglion is integral to understanding basic mechanisms of neuronal and glial communication and the structural composition of somatosensory systems. These considerations are particularly relevant to peripheral nerve, which frequently is the source of neurological dysfunction resulting from genetic mutations or nerve injury. The present report examines the complete transcriptomes of both DRG and peripheral nerve in a quantitative and comprehensive fashion. The issues considered in this paper encompass the transcriptional profile provided by Schwann cells in peripheral nerve compared to DRG, the expression levels of genes, mutations in which underlie pain channelopathies, hereditary insensitivity to pain, and the spectrum of Charcot Marie Tooth neuropathies, and the expression profile across tissues and organs in humans in comparison to DRG and peripheral nerve from both human and animal transcriptome datasets. Our observations reveal a commonality of expression for many of the CMT gene in both DRG and Schwann cells, but a very sharp demarcation for the pain channelopathy/defect genes, with several notable exceptions that are discussed below. The transcriptional profiles provide a new objective basis for subdivision and classification that supports the idea that clinical phenotypes can encompass neurons or Schwann cells or both, and in many cases supports extension to other cell populations outside the nervous system.
Dorsal Root Ganglion and Primary Afferent Neurons
At the most basic level we observe a similarity in the distribution of transcript abundance between the two tissues that is consistent across neuronal and non-neuronal transcriptional datasets from our earlier work using RNA-Seq of mouse ganglion (Goswami et al., 2014a) such that the majority of genes are expressed in the low to moderate range of 0.5 to 30 RPKM. RNA-Seq explicitly identifies and quantitates all of the genes expressed in this range, but the observation also agrees with earlier studies using various lower resolution techniques which show most genes are expressed at low to moderate levels. Sharper tissue-specific differentiation can be seen at the high end of the expression spectrum.
The highly expressed genes can be used to extract a characteristic transcriptional fingerprint of the tissue-specific cell types. It is also important to note that the ganglion contains many myelinated axons (see Fig 1). Out of the nine highest expressed genes in DRG, five are neuronal and three are Schwann. The very highly expressed DRG transcripts coded for specialized neuronal cytoskeletal and axonal structural proteins (the three neurofilament genes and the 1a and 1b paralogs of alpha tubulin). While all of these are important for neuronal and axonal integrity, the neurological disorders resulting from mutation are vastly different: Mutations of TUBA1A cause lissencephaly type 3 (LIS3), whereas mutations of neurofilament light chain cause Charcot-Marie Tooth disease types 1F and 2E. The latter is consistent with the crucial role of neurofilaments in maintaining axon caliber and the large number of large-diameter Aβ sensory and motor axons in peripheral nerves which are heavily myelinated, although there are differences in nerve conduction velocity for the 1F and 2E variants (De Jonghe and Jordanova, 1993). Thus, the clinical phenotypes appear to be a composite of a key susceptibility for a particular gene in a neural structure as well as contributions from several other interacting elements to confer the clinically evident defect.
Non-painful sensory modalities
It is recognized that the functional neuronal composition of the DRG is heterogeneous, with neurons subserving a variety of somatosensory modalities spanning low threshold pressure and vibration mechanoreceptors (Heidenreich et al., 2012), neurons innervating hair follicles (Li et al., 2011), cutaneous and deep tissue mechano-nociceptors, as well as those sensing noxious and non-noxious thermal inputs (Dubin and Patapoutian, 2010) and chemical and mechanical itch stimuli (Mishra and Hoon, 2013). Despite the range of sensory modalities represented, genetic mutation of the underlying transducing ion channels for sensations other than pain, for example light touch, have only rarely been described, mainly because the sensory phenotype is not always clinically obvious. One example is Kcnq4 (Kv7.4). The genetic defect was initially identified as an inactivating mutation causing deafness due to malfunction of mechanosensitive inner ear hair cells and long QT syndrome (Coucke et al., 1999). It is also expressed in Meissner’s corpuscles and certain fibers innervating hair follicles. Interestingly, these patients have an enhanced sensation of touch and exhibit a greater capacity for vibro-tactile discrimination (Heidenreich et al., 2012). Transcriptomics shows that KCNq4 is well expressed in the non-TRPV1 lineage of DRG neurons (A-β fibers) in mouse (0.6 vs 22.0 RPKM), and in rat DRG Kcnq2 is the main paralog and it is strongly differentially transcribed in DRG (29.2 RPKM) versus sciatic nerve (0.02 RPKM). Detailed expression data for touch neuron-related genes in the DRG (Piezo 1 and 2, Whrn/DFNB31, MafA, Ret, Gfrα2 and the transcriptomic levels for mouse rat and human are available in supplementary table 3). What is apparent is that the underlying transcriptomics of the diverse somatosensory modalities represents a fertile source for further genetic examination of sensory dysfunctions.
Sciatic Nerve and Schwann Cells
In the case of the sciatic nerve, Schwann cells are the major cell type and not surprisingly three of the most highly expressed genes were myelin protein zero (Mpz), peripheral myelin protein 22 (Pmp22), myelin basic protein (Mpb). In general, mRNA levels explain most of the variation of protein levels, despite contributions from other factors such as variation in half-life of the protein (Vogel et al., 2010). Studies of the myelin protein, PMP22, have shown a complex glycosylation process which results in a high probability of misfolded and/or misprocessed protein, 70% of which is degraded before secretion (Li et al., 2013). Therefore the very high level of expression of this mRNA may in part be a function of its inherent instability. However, given that PMP22 is among the highest expressed transcripts in sciatic nerve, even if these estimates are exaggerated by its unusually high instability, it is most likely still one of the most abundant proteins in this tissue. The extraordinarily high expression of myelin protein zero reflects not only its extraordinary abundance at the protein level, but also the presence of a pool of MPZ protein which is actively being turned over.
A small number of reads for DRG genes are detectable in sciatic nerve samples: neurofilament heavy, medium and light chain transcript levels were approximately 1000× greater in DRG yet were still detectable and well above background in sciatic nerve. The RPKM for DRG vs. sciatic nerve are Nefl, 3773.2 vs. 3.04; Nefm 3463.1 vs. 2.71; Nefh 1605.7 vs. 0.68 for the three transcripts. Several other highly expressed, highly DRG enriched genes show a low, but detectable, expression level in sciatic nerve (Supplemental Table 3). This observation is consistent with the idea of mRNAs with translatable potential in the axons of peripheral nerves, as has been suggested in previous studies (Piper and Holt, 2004). This detectable level of expression is not due to contamination with DRG tissue because the sciatic sample site is (a) outside the vertebral column and (b) the distance between the sciatic sample site and the neuronal cell body in the DRG is nearly 4 cm, making the possibility of admixture with DRG neurons very unlikely.
Differentiation of DRG from Sciatic Nerve Transcriptomes
Deconvoluting the admixture of Schwann cells and neurons within the DRG using transcriptomes derived from adult tissue in vivo is an important resource provided by this report. We provide two rat transcriptome databases for further studies on primary afferent neurobiology, investigations of peripheral nerve damage and regeneration, and various neuropathic pain models that involve nerve injury (Bennett and Xie, 1988; Decosterd and Woolf, 2000; Kim and Chung, 1992; Seltzer et al., 1990; Wall et al., 1979). The two tissues exhibited a remarkable degree of dissimilarity with more than 4,615 genes showing significantly higher expression in DRG relative to sciatic. The unique tissue-specific expression profile can be appreciated in Figs. 2 through 5. Figure 3 shows graphically the large number of differentially expressed genes in both the sciatic and DRG, and the magnitude of these changes. A detailed, gene-by-gene examination of the top ~100 differentially expressed genes for the two tissues can be found in Figures 4 and 5. What is evident is the strong enrichment of DRG genes with functions specific to neurotransmission mechanisms. These include the process of vesicle fusion and membrane recycling, the neuropeptide contents of the vesicles, genes involved in generation of ion fluxes and those responsible for maintenance of the membrane potential. However, a very wide range of other functions is represented spanning adaptor-scaffold proteins such as Akap12 (175.4 RPKM) to motor proteins (Kif5a and Kif1b, 257.5, 165.9 RPKM respectively) to ubiquitin carboxyl-terminal esterase L1 (Uchl1, 1224.5 RPKM, known also as Pgp9.5) and several zinc finger transcription factors (See Fig. 4). Interestingly, given its high level of expression in DRG, peripheral neuropathy is one of the symptoms, among many, in patients with homozygous mutations of UCHL1.
Differentiating Cell Types Within Sciatic Nerve
The characterization of the sciatic nerve tissue transcriptome encompasses mainly the Schwann cells, but also adipocytes and connective tissue cells. The Schwann cells contribute a secretory component that accounts for many of the highly expressed genes (Table 2) which includes extracellular matrix proteins such vimentin, decorin and lumican which are major matrix components in the sciatic nerve along with collagens. Several processing and metabolic enzymes are abundant in sciatic nerve as well, including Maob (monoamine oxidase B). Some very highly enriched genes such as Cpa3, a mast cell marker, are most likely contributed by the blood or blood vessels, which may be more elaborate in the nerve relative to the DRG.
Sciatic Nerve GPCRs
The intercellular communication processes that Schwann cells may participate in is another area we examined through transcriptomic profiling of sciatic nerve GPCRs. This analysis revealed a somewhat small number (~20) of Schwann-cell enriched GPCRs compared to, for example, DRG or spinal cord (well over 100). Additionally, multiple members of specific gene families were represented (e.g. the P2Y and lysophosphatidic acid receptor families), which further highlights the types of input signals Schwann cells are prepared to react to. One well-studied example of neuron- Schwann interactions mediated by a GPCR is the signaling that occurs through GPR126 (ADGRG6 in human), a laminin-binding receptor essential for initiation of myelination (Monk et al., 2009; Petersen et al., 2015). This GPCR is expressed in both DRG and Schwann cells which is consistent with an integratory signaling role between the ECM and both neurons and Schwann cells (Petersen et al., 2015). Lysophosphatidic acid (LPA) and leukotriene receptors (Lpar4, Lpar6, S1pr1, Cysltr1) are well represented in sciatic nerve, and LPA signaling can regulate Schwann cell migration and differentiation (Anliker et al., 2013). Interestingly, autotaxin (ENPP2), which synthesizes LPA (Inoue et al., 2008) also is enriched in the sciatic transcriptome (21.9 in sciatic vs. 6.8 RPKM in DRG). Several receptors involved in detecting extracellular nucleotides (P2ry2, P2ry14, P2ry13, and Gpr17) are enriched and well represented in sciatic nerve transcriptome. These receptors have been described to participate in the initiation of myelination as well as axon-Schwann cell signaling, detecting ATP released from firing neurons which exerts control over proliferation and differentiation of Schwann cells (Jahromi et al., 1992; Mayer et al., 1998; Stevens and Fields, 2000). Chronic suppression of purinergic receptor activation on Schwann cells during active myelination has been shown to cause hypomyelination (Ino et al., 2015). Taken together, a large proportion of the intercellular signaling receptors in the adult sciatic nerve, and one example of post-translational processing, appear to be related to maintenance of myelin. Somewhat of an open question is exactly what physiological variables on a day-to-day basis generate the ligands for these receptors? While nerve injury and neural activity are obvious candidate stimuli for ligand generation, a more detailed molecular network governing neuron-Schwann homeostasis can be elaborated using this transcriptomic profile.
Transcriptonal Profiling of CMT Neuropathy and Pain Channelopathy Genes
Cellular localization and expression levels of CMT genes
The cellular locations of the CMT and pain channelopathy/defect genes are shown diagrammatically in Figure 9 with the quantitative expression levels for each gene in the DRG or sciatic nerve depicted. What is immediately appreciable is the wide range of expression of genes that, when mutated, generate a peripheral neuropathy or pain disorder. Neurofilament light chain (Nefl 3,380 RPKM) is among the highest expressed genes in neurons, and mutations in this gene cause CMT2. Although expressed at much lower levels, gigaxonin (Gan, 9.0 RPKM) causes giant axonal neuropathy (Bomont et al., 2000), a syndrome in which intermediate filaments are massively disorganized in many cell types including neurons. Despite its crucial role in maintaining axonal integrity, endogenous gigaxonin is hard to detect at the protein level (Bomont, 2016). A similar huge range of expression for CMT genes is seen in sciatic nerve Schwann cells where Mpz and Pmp22 are expressed at ~20,000 and 11,000 RPKM, respectively, compared to the gap junction protein connexin 32 (Gjb1, 33 RPKM). Our data show that, the potential for contributing to pathology of peripheral nerve is found throughout the transcriptional expression spectrum. As a result, strategies for diagnostic gene discovery in idiopathic inherited peripheral neuropathies (IPNs) based on level of expression does not fit/conform to the molecular disease profile. In general, three groups of genes are evident: sciatic nerve enriched, DRG enriched, and transcripts expressed equally in the two tissues. In this regard, the quantitative differential expression between the two tissues is notable, and in this case the expression levels provide a framework for fine-tuning inclusion criteria for candidate neuropathy genes based on results of diagnostic conduction velocity studies whereby the slow conduction velocity seen in CMT1 is hypothesized to be consonant with enriched expression in the Schwann cell population. Integration of these considerations with genomic pathology is addressed in the next section. We suggest that consideration of transcriptional expression levels can amplify the ability to infer functional and pathophysiological ramifications from either known targets or newly identified candidates.
Implications of the expression profiles
A wide range of neurological and corresponding pathophysiological symptoms result from the genetic defects classified as CMT neuropathies. We mined RNA-Seq data from 32 human tissues and examined the expression pattern for neuropathy genes. Upon construction of the summary heat maps (Figs. 10 and 11), it was apparent that many of the CMT genes are not specific to the nervous system but are quite broadly expressed across multiple tissues and organs. This provides a new perspective on approximately half of the implicated genes. In contrast, the pain channelopathy/deficit genes are almost exclusively expressed in nervous system tissue, specifically the DRG. The expression pattern across tissues for multiple genes reported as neuropathy genes shows they are expressed at much higher levels in tissues that have no obvious relationship to neuronal transmission. In fact, many of these genes are ubiquitously expressed, with a small subset expressed at lower levels in DRG and nerve than in one of the other 32 tissues. These data can enhance the predictive power of diagnostics by considering the mutated gene in concert with a detailed appreciation of its expression pattern. Expression of some CMT genes in other organ systems may predict additional complications in patients affected with mutations in these genes, or new pharmacological targets and/or tissues to target. For example, TRPA1 a chemo-nociceptive ion channel was strongly expressed in the urinary bladder where it has been proposed to mediate bladder hyperalgesia (DeBerry et al., 2014) and overactivity (Andrade et al., 2011) and TRPA1 antagonists are being evaluated for bladder disorders. Expression profiling may help explain how what initially seems a series of unrelated clinical presentations may evolve from a single molecular insult. The distribution of these molecules forms a framework to better understand how these genes cause neuropathy and, potentially, insight into genotype-phenotype relationships that may not be wholly accounted for by a focus on the sensory neuropathy symptomatology. For neuropathies cause by broadly expressed genes, clinical observation of additional organs may be advantageous.
Our finding that TRPV4, NGF, HSPB3 and SLC5A7 are expressed at very low levels in DRG and sciatic nerve prompted us to examine other tissues. The SLC5A7 gene codes for a high affinity choline transporter and is the gene underlying autosomal dominant distal hereditary motor neuronopathy type VIIA. An obvious place to look was in a set of ventral spinal cord RNA-Seq datasets we had generated (Iadarola, unpublished) where it is expressed at 63.1 ± 6.0 RPKM whereas in DRG it is 0.98 RPKM. From the heat map entries it is unclear how TRPV4 and HSPB3 act given their low level of expression. In the case of TRPV4 mutations, many other roles have been proposed for this protein, including osmotic regulation and bone development. Given the near-total absence of its expression in DRG or sciatic nerve in mouse, rat and human it is possible it acts indirectly on neurons through another of its proposed functions (McNulty et al., 2015). NGF is secreted by peripheral tissues and binds to the TRKA receptors that are expressed by DRG neurons. The NGF heat map entry shows that human ovary and tibial nerve contain high amounts of NGF transcripts, but further studies are needed to determine if NGF expression is a generalized feature of peripheral nerves. Incorporation of the RNA-Seq data can amplify the amount of factual information that can be applied to peripheral nerve components and in general amplify the knowledge base surrounding peripheral nerve disorders.
ATP7A is a copper-transporting ATPase required for the dietary absorption of copper, delivery across the blood-cerebrospinal fluid and blood-brain barriers, and overall maintenance of copper homeostasis. Mutations in this gene cause a spectrum of neurological problems including Menkes disease, occipital horn syndrome, and distal motor neuropathy (Chelly et al., 1993; Kennerson et al., 2010; Mercer et al., 1993; Vulpe et al., 1993). The link between copper deficiency and motor and sensory neuropathies has long been known, with prominent examples being the cuprizone model of demyelination in rodents (Torkildsen et al., 2008). Systemic copper deficiency in humans and animals may also cause central nervous system defects including demyelination (Kumar, 2006). The mechanisms by which copper deficiency cause these defects remain unclear. One copper-requiring enzyme is the peptide-processing enzyme peptidyl alpha-amidating monoxygenase (PAM)(Bousquet-Moore et al., 2010), which is highly enriched in sciatic nerve relative to the DRG despite the absence of known peptide precursors that generate amidated peptides (Fig 5). PAM has been reported previously in Schwann cells (Rhodes et al., 1990), although it remains unclear what accounts for its extremely high level of relative expression, or if it could also be expressed in fibroblasts, adipocytes, or vascular endothelium within the nerve sheath. We screened the most highly expressed, highly differential genes in sciatic nerve (Fig 5) for C-terminal Gly residues that could indicate substrates for PAM processing. This search also considered C-terminal Gly residues that could be exposed after processing by furin-like cleavages and/or processing by carboxypeptidases E or D (CPE, CPD), and reported mature C-terminal sequences in the Uniprot database. This search yielded 6 hits, including the collagen Col3a1, of which three are known to have an exposed C-terminal Gly residue (Table 5). While C-terminal amidation of Col3a1 has not been reported, Menkes disease is known to cause collagen defects often ascribed to reduced activity of another copper- dependent enzyme, lysyl oxidase (Kuivaniemi et al., 1985; Royce et al., 1980). If Col3a1 is indeed C- terminally amidated, PAM inactivation may also contribute to the observed collagen defects in Menkes disease.
Table 5.
Predictive screening of putative peptidyl alpha-amidating monoxygenase substrates in sciatic nerve.
| Gene symbol | Required processing | Surrounding sequence (rat) | ProP 1.0 score (rat) | Surrounding sequence (human) | ProP 1.0 score (human) | Cleavage reported in Uniprot |
|---|---|---|---|---|---|---|
| Known C-terminal Gly | ||||||
| Col3a1 | Mature C-terminal | GFSPYYG↓DD | N/A | GFAPYYG↓DE | N/A | Yes |
| Igfbp6 | C-terminal | SARSSG* | N/A | PTGSSG* | N/A | N/A |
| Lpl | C-terminal | SLKKSG* | N/A | LNKKSG* | N/A | N/A |
| Potential C-terminal Gly | ||||||
| Col1a1 | Furin-like/CPE | AGEEGKR↓GA | 0.925 | AGEEGKR↓GA | 0.925 | No |
| Pcolce | Furin-like/CPE | SGQRLGR↓FC | 0.786 | SGQRLGR↓FC | 0.786 | No |
| Pcolce | Furin-like/CPE | None | N/A | LLWYSGR↓AT | 0.541 | No |
| Ugt8 | Furin-like/CPE | FLLSEGR↓DI | 0.512 | None | N/A | No |
Predictive Profiling
Beyond the expression profiling, we attempted to identify an additional set of genes that could form the basis for further investigations of genetically undiagnosed inherited peripheral neuropathies (IPNs). The heat map in Figure 11 depicts a set of probable candidates based on strong differential expression between DRG and sciatic (and vice versa) whether they are enriched relative to 32 tissues present in the Human Protein Atlas. The only tissue that shows consistent overlapping expression with the DRG was the cerebral cortex, which is expected given the presence of neurons in both tissues. The differential data set can be used to extract candidate genes coming from whole exome sequencing or can form a set of candidates for targeted exome sequencing based on results of clinical conduction velocity measurements. The fact that several CMT genes are already represented in this list (Nefl, Kif5a in DRG and Mpz, Pmp22 and Prx in sciatic) provides a partial validation of this approach. Similarly, for pain disorders, several well-known genes that participate in nociceptive processes are present such as two primary afferent neuropeptides: Tac1 codes for the preprotachykinin precursor protein that is processed to Substance P and Substance K, and Calca codes for the calcitonin gene related peptide (CGRP) precursor. More broadly expressed genes can also have an effect on peripheral axonal function. Overexpression of Sncg, which encodes γ-synuclin has been shown to cause a “disintegration of the neurofilament network” in spinal motor neurons (Ninkina et al., 2009) and certain heterozygous missense mutations in tubulin-β3 (Tubb3) can produce an axonal sensorimotor polyneuropathy (Tischfield et al., 2010). Other differential proteins like advillin, a calcium-regulated actin binding protein of the gelsolin family, are strongly and selectively expressed in DRG neurons and the mouse knockout shows an impaired response to axonal injury (Hasegawa et al., 2007). Thus, the differential analysis includes many potential targets for genetic analysis of IPNs although a clear role for all of them in DRG neuronal or Schwann cell biology has yet to be defined. Some of the genes likely function in the CNS, but are not shown in the present heatmap because the CNS expression profile is limited to the cerebral cortex, and because expression in a specific subpopulation of neurons may be diluted by a large amount of surrounding tissue. A number of sciatic nerve enriched genes may also be shared with oligodendrocytes.
Diagnostic Implications
The advantages of obtaining a defined genetic diagnosis for a suspected inherited peripheral neuropathy (IPN) were pointed out by Rossor et al., (Rossor et al., 2013) and include the capacity for personal and family planning, a molecular basis for antenatal genetic testing, and elimination of misdiagnoses. However, several recent reviews and diagnostic or discovery investigations of IPNs and pain insensitivity demonstrate that the standard set of ~60 known genes is capable of providing a genetic diagnosis in only 30 to 40 percent of the patients (Antoniadi et al., 2015; Chen et al., 2015). This shortfall suggests that a much larger set of genes can give rise to neuropathies or gain or loss of function pain sensitivity disorders. While pinpointing new candidate genes is a difficult proposition, identification of genes exhibiting enriched expression in DRG or Schwann cells may provide a targeted pool of genes for further investigation using next-gen exome sequencing. Such a set of genes for either DRG or Schwann cells is illustrated in Fig 11. Specific exome sequencing has been done for 56 genes known to produce various CMT neuropathies (Antoniadi et al., 2015). The results were remarkably informative: several new mutations in known genes were identified as well as patients with combinations of mutations in two different causative genes. However, despite the analytical power of next-gen sequencing, a genetic diagnosis was obtained in only 137 of the 448 patients in the cohort, which leaves about 70% of the cases with an unknown etiology. This suggests that multiple other genes can give rise to IPNs but identifying them in an undirected fashion is challenging. While some genetic loci can contribute a high proportion of the genetic diagnoses for IPNs (PMP22, GJB1, MPZ for CMT), and SCN9A (NaV1.7) for pain channelopathies, the remainder appear to conform to a rare gene allele model as has been proposed for several diseases including schizophrenia (McClellan et al., 2007), especially where a clear family history is lacking. Thus, it is suggested that the present expression profiling in the relevant tissues can winnow down the number of potential contributing genes to a more manageable number that may speed up clinical genetic diagnostic efforts for IPNs and disorders of pain sensation. This is important given the expense of both data collection and analysis, and may provide a framework to simplify the process of diagnosis.
Supplementary Material
Acknowledgments
This research was supported by the Intramural Research Program of the NIH Clinical Center. We thank Ruth Yaskovich for her help with tissue sectioning and histology. The support of the National Center for Complementry and Integrative Health is gratefully acknowledged.
References
- Anders S, Huber W. Differential expression analysis for sequence count data. Genome biology. 2010;11:R106. doi: 10.1186/gb-2010-11-10-r106. [DOI] [PMC free article] [PubMed] [Google Scholar]
- Andrade EL, Forner S, Bento AF, Leite DF, Dias MA, Leal PC, Koepp J, Calixto JB. TRPA1 receptor modulation attenuates bladder overactivity induced by spinal cord injury. Am J Physiol Renal Physiol. 2011;300:F1223–1234. doi: 10.1152/ajprenal.00535.2010. [DOI] [PubMed] [Google Scholar]
- Anliker B, Choi JW, Lin ME, Gardell SE, Rivera RR, Kennedy G, Chun J. Lysophosphatidic acid (LPA) and its receptor, LPA1, influence embryonic schwann cell migration, myelination, and cell-to-axon segregation. Glia. 2013;61:2009–2022. doi: 10.1002/glia.22572. [DOI] [PMC free article] [PubMed] [Google Scholar]
- Antoniadi T, Buxton C, Dennis G, Forrester N, Smith D, Lunt P, Burton-Jones S. Application of targeted multi-gene panel testing for the diagnosis of inherited peripheral neuropathy provides a high diagnostic yield with unexpected phenotype-genotype variability. BMC Med Genet. 2015;16:84. doi: 10.1186/s12881-015-0224-8. [DOI] [PMC free article] [PubMed] [Google Scholar]
- Bennett GJ, Xie YK. A peripheral mononeuropathy in rat that produces disorders of pain sensation like those seen in man. Pain. 1988;33:87–107. doi: 10.1016/0304-3959(88)90209-6. [DOI] [PubMed] [Google Scholar]
- Bomont P. Degradation of the Intermediate Filament Family by Gigaxonin. Methods Enzymol. 2016;569:215–231. doi: 10.1016/bs.mie.2015.07.009. [DOI] [PubMed] [Google Scholar]
- Bomont P, Cavalier L, Blondeau F, Ben Hamida C, Belal S, Tazir M, Demir E, Topaloglu H, Korinthenberg R, Tuysuz B, Landrieu P, Hentati F, Koenig M. The gene encoding gigaxonin, a new member of the cytoskeletal BTB/kelch repeat family, is mutated in giant axonal neuropathy. Nature genetics. 2000;26:370–374. doi: 10.1038/81701. [DOI] [PubMed] [Google Scholar]
- Boukalova S, Touska F, Marsakova L, Hynkova A, Sura L, Chvojka S, Dittert I, Vlachova V. Gain-of-function mutations in the transient receptor potential channels TRPV1 and TRPA1: how painful? Physiol Res 63 Suppl. 2014;1:S205–213. doi: 10.33549/physiolres.932658. [DOI] [PubMed] [Google Scholar]
- Bousquet-Moore D, Mains RE, Eipper BA. Peptidylgycine alpha-amidating monooxygenase and copper: a gene-nutrient interaction critical to nervous system function. Journal of neuroscience research. 2010;88:2535–2545. doi: 10.1002/jnr.22404. [DOI] [PMC free article] [PubMed] [Google Scholar]
- Braathen GJ. Genetic epidemiology of Charcot-Marie-Tooth disease. Acta neurologica Scandinavica Supplementum. 2012:iv–22. doi: 10.1111/ane.12013. [DOI] [PubMed] [Google Scholar]
- Caro JF, Sinha MK, Kolaczynski JW, Zhang PL, Considine RV. Leptin: the tale of an obesity gene. Diabetes. 1996;45:1455–1462. doi: 10.2337/diab.45.11.1455. [DOI] [PubMed] [Google Scholar]
- Carter GT, Jensen MP, Galer BS, Kraft GH, Crabtree LD, Beardsley RM, Abresch RT, Bird TD. Neuropathic pain in Charcot-Marie-Tooth disease. Archives of physical medicine and rehabilitation. 1998;79:1560–1564. doi: 10.1016/s0003-9993(98)90421-x. [DOI] [PubMed] [Google Scholar]
- Chelly J, Tumer Z, Tonnesen T, Petterson A, Ishikawa-Brush Y, Tommerup N, Horn N, Monaco AP. Isolation of a candidate gene for Menkes disease that encodes a potential heavy metal binding protein. Nature genetics. 1993;3:14–19. doi: 10.1038/ng0193-14. [DOI] [PubMed] [Google Scholar]
- Chen P, Cescon M, Megighian A, Bonaldo P. Collagen VI regulates peripheral nerve myelination and function. FASEB J. 2014;28:1145–1156. doi: 10.1096/fj.13-239533. [DOI] [PubMed] [Google Scholar]
- Chen YC, Auer-Grumbach M, Matsukawa S, Zitzelsberger M, Themistocleous AC, Strom TM, Samara C, Moore AW, Cho LT, Young GT, Weiss C, Schabhuttl M, Stucka R, Schmid AB, Parman Y, Graul-Neumann L, Heinritz W, Passarge E, Watson RM, Hertz JM, Moog U, Baumgartner M, Valente EM, Pereira D, Restrepo CM, Katona I, Dusl M, Stendel C, Wieland T, Stafford F, Reimann F, von Au K, Finke C, Willems PJ, Nahorski MS, Shaikh SS, Carvalho OP, Nicholas AK, Karbani G, McAleer MA, Cilio MR, McHugh JC, Murphy SM, Irvine AD, Jensen UB, Windhager R, Weis J, Bergmann C, Rautenstrauss B, Baets J, De Jonghe P, Reilly MM, Kropatsch R, Kurth I, Chrast R, Michiue T, Bennett DL, Woods CG, Senderek J. Transcriptional regulator PRDM12 is essential for human pain perception. Nature genetics. 2015;47:803–808. doi: 10.1038/ng.3308. [DOI] [PMC free article] [PubMed] [Google Scholar]
- Consortium G. The GenotypePTissue Expression (GTEx) project. Nature genetics. 2013;45:580–585. doi: 10.1038/ng.2653. [DOI] [PMC free article] [PubMed] [Google Scholar]
- Coucke PJ, Van Hauwe P, Kelley PM, Kunst H, Schatteman I, Van Velzen D, Meyers J, Ensink RJ, Verstreken M, Declau F, Marres H, Kastury K, Bhasin S, McGuirt WT, Smith RJ, Cremers CW, Van de Heyning P, Willems PJ, Smith SD, Van Camp G. Mutations in the KCNQ4 gene are responsible for autosomal dominant deafness in four DFNA2 families. Human molecular genetics. 1999;8:1321–1328. doi: 10.1093/hmg/8.7.1321. [DOI] [PubMed] [Google Scholar]
- Cox JJ, Reimann F, Nicholas AK, Thornton G, Roberts E, Springell K, Karbani G, Jafri H, Mannan J, Raashid Y, Al-Gazali L, Hamamy H, Valente EM, Gorman S, Williams R, McHale DP, Wood JN, Gribble FM, Woods CG. An SCN9A channelopathy causes congenital inability to experience pain. Nature. 2006;444:894–898. doi: 10.1038/nature05413. [DOI] [PMC free article] [PubMed] [Google Scholar]
- Jonghe De P, Jordanova AK. Charcot-Marie-Tooth Neuropathy Type 2E/1F. In: Pagon RA, Adam MP, Ardinger HH, Wallace SE, Amemiya A, Bean LJH, Bird TD, Fong CT, Mefford HC, Smith RJH, Stephens K, editors. GeneReviews(R) Seattle (WA): 1993. [Google Scholar]
- DeBerry JJ, Schwartz ES, Davis BM. TRPA1 mediates bladder hyperalgesia in a mouse model of cystitis. Pain. 2014;155:1280–1287. doi: 10.1016/j.pain.2014.03.023. [DOI] [PMC free article] [PubMed] [Google Scholar]
- Decosterd I, Woolf CJ. Spared nerve injury: an animal model of persistent peripheral neuropathic pain. Pain. 2000;87:149–158. doi: 10.1016/S0304-3959(00)00276-1. [DOI] [PubMed] [Google Scholar]
- Drenth JP, Waxman SG. Mutations in sodium-channel gene SCN9A cause a spectrum of human genetic pain disorders. The Journal of clinical investigation. 2007;117:3603–3609. doi: 10.1172/JCI33297. [DOI] [PMC free article] [PubMed] [Google Scholar]
- Dubin AE, Patapoutian A. Nociceptors: the sensors of the pain pathway. The Journal of clinical investigation. 2010;120:3760–3772. doi: 10.1172/JCI42843. [DOI] [PMC free article] [PubMed] [Google Scholar]
- Goswami SC, Mishra SK, Maric D, Kaszas K, Gonnella GL, Clokie SJ, Kominsky HD, Gross JR, Keller JM, Mannes AJ, Hoon MA, Iadarola MJ. Molecular signatures of mouse TRPV1-lineage neurons revealed by RNA-Seq transcriptome analysis. The journal of pain: official journal of the American Pain Society. 2014a;15:1338–1359. doi: 10.1016/j.jpain.2014.09.010. [DOI] [PMC free article] [PubMed] [Google Scholar]
- Goswami SC, Thierry-Mieg D, Thierry-Mieg J, Mishra S, Hoon MA, Mannes AJ, Iadarola MJ. Itch-associated peptides: RNA-Seq and bioinformatic analysis of natriuretic precursor peptide B and gastrin releasing peptide in dorsal root and trigeminal ganglia, and the spinal cord. Molecular pain. 2014b;10:44. doi: 10.1186/1744-8069-10-44. [DOI] [PMC free article] [PubMed] [Google Scholar]
- Griffin LB, Sakaguchi R, McGuigan D, Gonzalez MA, Searby C, Zuchner S, Hou YM, Antonellis A. Impaired function is a common feature of neuropathy-associated glycyl-tRNA synthetase mutations. Human mutation. 2014;35:1363–1371. doi: 10.1002/humu.22681. [DOI] [PMC free article] [PubMed] [Google Scholar]
- Hasegawa H, Abbott S, Han BX, Qi Y, Wang F. Analyzing somatosensory axon projections with the sensory neuron-specific Advillin gene. The Journal of neuroscience : the official journal of the Society for Neuroscience. 2007;27:14404–14414. doi: 10.1523/JNEUROSCI.4908-07.2007. [DOI] [PMC free article] [PubMed] [Google Scholar]
- Heidenreich M, Lechner SG, Vardanyan V, Wetzel C, Cremers CW, De Leenheer EM, Aranguez G, Moreno-Pelayo MA, Jentsch TJ, Lewin GR. KCNQ4 K(+) channels tune mechanoreceptors for normal touch sensation in mouse and man. Nature neuroscience. 2012;15:138–145. doi: 10.1038/nn.2985. [DOI] [PubMed] [Google Scholar]
- Hisama FM, Dib-Hajj SD, Waxman SG. SCN9A-Related Inherited Erythromelalgia. In: Pagon RA, Adam MP, Ardinger HH, Wallace SE, Amemiya A, Bean LJH, Bird TD, Fong CT, Mefford HC, Smith RJH, Stephens K, editors. GeneReviews(R) Seattle (WA): 1993. [Google Scholar]
- Hu E, Liang P, Spiegelman BM. AdipoQ is a novel adipose-specific gene dysregulated in obesity. The Journal of biological chemistry. 1996;271:10697–10703. doi: 10.1074/jbc.271.18.10697. [DOI] [PubMed] [Google Scholar]
- Hunter M, Bernard R, Freitas E, Boyer A, Morar B, Martins IJ, Tournev I, Jordanova A, Guergelcheva V, Ishpekova B, Kremensky I, Nicholson G, Schlotter B, Lochmuller H, Voit T, Colomer J, Thomas PK, Levy N, Kalaydjieva L. Mutation screening of the N-myc downstream-regulated gene 1 (NDRG1) in patients with Charcot-Marie-Tooth Disease. Human mutation. 2003;22:129–135. doi: 10.1002/humu.10240. [DOI] [PubMed] [Google Scholar]
- Indo Y, Tsuruta M, Hayashida Y, Karim MA, Ohta K, Kawano T, Mitsubuchi H, Tonoki H, Awaya Y, Matsuda I. Mutations in the TRKA/NGF receptor gene in patients with congenital insensitivity to pain with anhidrosis. Nature genetics. 1996;13:485–488. doi: 10.1038/ng0896-485. [DOI] [PubMed] [Google Scholar]
- Ino D, Sagara H, Suzuki J, Kanemaru K, Okubo Y, Lino M. Neuronal Regulation of Schwann Cell Mitochondrial Ca(2+) Signaling during Myelination. Cell reports. 2015;12:1951–1959. doi: 10.1016/j.celrep.2015.08.039. [DOI] [PubMed] [Google Scholar]
- Inoue M, Ma L, Aoki J, Chun J, Ueda H. Autotaxin, a synthetic enzyme of lysophosphatidic acid (LPA), mediates the induction of nerve-injured neuropathic pain. Molecular pain. 2008;4:6. doi: 10.1186/1744-8069-4-6. [DOI] [PMC free article] [PubMed] [Google Scholar]
- Jahromi BS, Robitaille R, Charlton MP. Transmitter release increases intracellular calcium in perisynaptic Schwann cells in situ. Neuron. 1992;8:1069–1077. doi: 10.1016/0896-6273(92)90128-z. [DOI] [PubMed] [Google Scholar]
- Jordanova A, De Jonghe P, Boerkoel CF, Takashima H, De Vriendt E, Ceuterick C, Martin JJ, Butler IJ, Mancias P, Papasozomenos S, Terespolsky D, Potocki L, Brown CW, Shy M, Rita DA, Tournev I, Kremensky I, Lupski JR, Timmerman V. Mutations in the neurofilament light chain gene (NEFL) cause early onset severe Charcot-Marie-Tooth disease. Brain: a journal of neurology. 2003;126:590–597. doi: 10.1093/brain/awg059. [DOI] [PubMed] [Google Scholar]
- Julius D. TRP channels and pain. Annual review of cell and developmental biology. 2013;29:355–384. doi: 10.1146/annurev-cellbio-101011-155833. [DOI] [PubMed] [Google Scholar]
- Kennerson ML, Nicholson GA, Kaler SG, Kowalski B, Mercer JF, Tang J, Lanos RM, Chu S, Takata RI, Speck-Martins CE, Baets J, Almeida-Souza L, Fischer D, Timmerman V, Taylor PE, Scherer SS, Ferguson TA, Bird TD, De Jonghe P, Feely SM, Shy ME, Garbern JY. Missense mutations in the copper transporter gene ATP7A cause X-linked distal hereditary motor neuropathy. American journal of human genetics. 2010;86:343–352. doi: 10.1016/j.ajhg.2010.01.027. [DOI] [PMC free article] [PubMed] [Google Scholar]
- Kim SH, Chung JM. An experimental model for peripheral neuropathy produced by segmental spinal nerve ligation in the rat. Pain. 1992;50:355–363. doi: 10.1016/0304-3959(92)90041-9. [DOI] [PubMed] [Google Scholar]
- Kuivaniemi H, Peltonen L, Kivirikko KI. Type IX Ehlers-Danlos syndrome and Menkes syndrome: the decrease in lysyl oxidase activity is associated with a corresponding deficiency in the enzyme protein. American journal of human genetics. 1985;37:798–808. [PMC free article] [PubMed] [Google Scholar]
- Kumar N. Copper deficiency myelopathy (human swayback) Mayo Clin Proc. 2006;81:1371–1384. doi: 10.4065/81.10.1371. [DOI] [PubMed] [Google Scholar]
- Lamande SR, Yuan Y, Gresshoff IL, Rowley L, Belluoccio D, Kaluarachchi K, Little CB, Botzenhart E, Zerres K, Amor DJ, Cole WG, Savarirayan R, McIntyre P, Bateman JF. Mutations in TRPV4 cause an inherited arthropathy of hands and feet. Nature genetics. 2011;43:1142–1146. doi: 10.1038/ng.945. [DOI] [PubMed] [Google Scholar]
- Landoure G, Zdebik AA, Martinez TL, Burnett BG, Stanescu HC, Inada H, Shi Y, Taye AA, Kong L, Munns CH, Choo SS, Phelps CB, Paudel R, Houlden H, Ludlow CL, Caterina MJ, Gaudet R, Kleta R, Fischbeck KH, Sumner CJ. Mutations in TRPV4 cause Charcot-Marie-Tooth disease type 2C. Nature genetics. 2010;42:170–174. doi: 10.1038/ng.512. [DOI] [PMC free article] [PubMed] [Google Scholar]
- Leipold E, Liebmann L, Korenke GC, Heinrich T, Giesselmann S, Baets J, Ebbinghaus M, Goral RO, Stodberg T, Hennings JC, Bergmann M, Altmuller J, Thiele H, Wetzel A, Nurnberg P, Timmerman V, De Jonghe P, Blum R, Schaible HG, Weis J, Heinemann SH, Hubner CA, Kurth I. A de novo gain-of-function mutation in SCN11A causes loss of pain perception. Nature genetics. 2013;45:1399–1404. doi: 10.1038/ng.2767. [DOI] [PubMed] [Google Scholar]
- Li J, Parker B, Martyn C, Natarajan C, Guo J. The PMP22 gene and its related diseases. Molecular neurobiology. 2013;47:673–698. doi: 10.1007/s12035-012-8370-x. [DOI] [PMC free article] [PubMed] [Google Scholar]
- Li L, Rutlin M, Abraira VE, Cassidy C, Kus L, Gong S, Jankowski MP, Luo W, Heintz N, Koerber HR, Woodbury CJ, Ginty DD. The functional organization of cutaneous low-threshold mechanosensory neurons. Cell. 2011;147:1615–1627. doi: 10.1016/j.cell.2011.11.027. [DOI] [PMC free article] [PubMed] [Google Scholar]
- Mayer C, Quasthoff S, Grafe P. Differences in the sensitivity to purinergic stimulation of myelinating and non-myelinating Schwann cells in peripheral human and rat nerve. Glia. 1998;23:374–382. doi: 10.1002/(sici)1098-1136(199808)23:4<374::aid-glia9>3.0.co;2-2. [DOI] [PubMed] [Google Scholar]
- McClellan JM, Susser E, King MC. Schizophrenia: a common disease caused by multiple rare alleles. Br J Psychiatry. 2007;190:194–199. doi: 10.1192/bjp.bp.106.025585. [DOI] [PubMed] [Google Scholar]
- McNulty AL, Leddy HA, Liedtke W, Guilak F. TRPV4 as a therapeutic target for joint diseases. Naunyn Schmiedebergs Arch Pharmacol. 2015;388:437–450. doi: 10.1007/s00210-014-1078-x. [DOI] [PMC free article] [PubMed] [Google Scholar]
- Mercer JF, Livingston J, Hall B, Paynter JA, Begy C, Chandrasekharappa S, Lockhart P, Grimes A, Bhave M, Siemieniak D, et al. Isolation of a partial candidate gene for Menkes disease by positional cloning. Nature genetics. 1993;3:20–25. doi: 10.1038/ng0193-20. [DOI] [PubMed] [Google Scholar]
- Mishra SK, Hoon MA. The cells and circuitry for itch responses in mice. Science. 2013;340:968–971. doi: 10.1126/science.1233765. [DOI] [PMC free article] [PubMed] [Google Scholar]
- Mitchell K, Lebovitz EE, Keller JM, Mannes AJ, Nemenov MI, Iadarola MJ. Nociception and inflammatory hyperalgesia evaluated in rodents using infrared laser stimulation after Trpv1 gene knockout or resiniferatoxin lesion. Pain. 2014;155:733–745. doi: 10.1016/j.pain.2014.01.007. [DOI] [PMC free article] [PubMed] [Google Scholar]
- Mogil JS. Pain genetics: past, present and future. Trends in genetics: TIG. 2012;28:258–266. doi: 10.1016/j.tig.2012.02.004. [DOI] [PubMed] [Google Scholar]
- Monk KR, Naylor SG, Glenn TD, Mercurio S, Perlin JR, Dominguez C, Moens CB, Talbot WS. A G protein-coupled receptor is essential for Schwann cells to initiate myelination. Science. 2009;325:1402–1405. doi: 10.1126/science.1173474. [DOI] [PMC free article] [PubMed] [Google Scholar]
- Murphy SM, Laura M, Fawcett K, Pandraud A, Liu YT, Davidson GL, Rossor AM, Polke JM, Castleman V, Manji H, Lunn MP, Bull K, Ramdharry G, Davis M, Blake JC, Houlden H, Reilly MM. Charcot-Marie-Tooth disease: frequency of genetic subtypes and guidelines for genetic testing. Journal of neurology, neurosurgery, and psychiatry. 2012;83:706–710. doi: 10.1136/jnnp-2012-302451. [DOI] [PMC free article] [PubMed] [Google Scholar]
- Nahorski MS, Al-Gazali L, Hertecant J, Owen DJ, Borner GH, Chen YC, Benn CL, Carvalho OP, Shaikh SS, Phelan A, Robinson MS, Royle SJ, Woods CG. A novel disorder reveals clathrin heavy chain-22 is essential for human pain and touch development. Brain: a journal of neurology. 2015;138:2147–2160. doi: 10.1093/brain/awv149. [DOI] [PMC free article] [PubMed] [Google Scholar]
- Ninkina N, Peters O, Millership S, Salem H, van der Putten H, Buchman VL. Gamma- synucleinopathy: neurodegeneration associated with overexpression of the mouse protein. Human molecular genetics. 2009;18:1779–1794. doi: 10.1093/hmg/ddp090. [DOI] [PMC free article] [PubMed] [Google Scholar]
- Park JJ, Lee J, Kim MA, Back SK, Hong SK, Na HS. Induction of total insensitivity to capsaicin and hypersensitivity to garlic extract in human by decreased expression of TRPV1. Neuroscience letters. 2007;411:87–91. doi: 10.1016/j.neulet.2006.10.046. [DOI] [PubMed] [Google Scholar]
- Petersen SC, Luo R, Liebscher I, Giera S, Jeong SJ, Mogha A, Ghidinelli M, Feltri ML, Schoneberg T, Piao X, Monk KR. The adhesion GPCR GPR126 has distinct, domain-dependent functions in Schwann cell development mediated by interaction with laminin-211. Neuron. 2015;85:755–769. doi: 10.1016/j.neuron.2014.12.057. [DOI] [PMC free article] [PubMed] [Google Scholar]
- Piper M, Holt C. RNA translation in axons. Annual review of cell and developmental biology. 2004;20:505–523. doi: 10.1146/annurev.cellbio.20.010403.111746. [DOI] [PMC free article] [PubMed] [Google Scholar]
- Rhodes CH, Xu RY, Angeletti RH. Peptidylglycine alpha-amidating monooxygenase (PAM) in Schwann cells and glia as well as neurons. The journal of histochemistry and cytochemistry: official journal of the Histochemistry Society. 1990;38:1301–1311. doi: 10.1177/38.9.2387985. [DOI] [PubMed] [Google Scholar]
- Rosemberg S, Marie SK, Kliemann S. Congenital insensitivity to pain with anhidrosis (hereditary sensory and autonomic neuropathy type IV) Pediatric neurology. 1994;11:50–56. doi: 10.1016/0887-8994(94)90091-4. [DOI] [PubMed] [Google Scholar]
- Rossor AM, Polke JM, Houlden H, Reilly MM. Clinical implications of genetic advances in Charcot-Marie-Tooth disease. Nature reviews Neurology. 2013;9:562–571. doi: 10.1038/nrneurol.2013.179. [DOI] [PubMed] [Google Scholar]
- Royce PM, Camakaris J, Danks DM. Reduced lysyl oxidase activity in skin fibroblasts from patients with Menkes’ syndrome. Biochem J. 1980;192:579–586. doi: 10.1042/bj1920579. [DOI] [PMC free article] [PubMed] [Google Scholar]
- Saporta AS, Sottile SL, Miller LJ, Feely SM, Siskind CE, Shy ME. Charcot-Marie-Tooth disease subtypes and genetic testing strategies. Annals of neurology. 2011;69:22–33. doi: 10.1002/ana.22166. [DOI] [PMC free article] [PubMed] [Google Scholar]
- Seltzer Z, Dubner R, Shir Y. A novel behavioral model of neuropathic pain disorders produced in rats by partial sciatic nerve injury. Pain. 1990;43:205–218. doi: 10.1016/0304-3959(90)91074-S. [DOI] [PubMed] [Google Scholar]
- Shan T, Liu W, Kuang S. Fatty acid binding protein 4 expression marks a population of adipocyte progenitors in white and brown adipose tissues. FASEB J. 2013;27:277–287. doi: 10.1096/fj.12-211516. [DOI] [PMC free article] [PubMed] [Google Scholar]
- Stevens B, Fields RD. Response of Schwann cells to action potentials in development. Science. 2000;287:2267–2271. doi: 10.1126/science.287.5461.2267. [DOI] [PubMed] [Google Scholar]
- Tischfield MA, Baris HN, Wu C, Rudolph G, Van Maldergem L, He W, Chan WM, Andrews C, Demer JL, Robertson RL, Mackey DA, Ruddle JB, Bird TD, Gottlob I, Pieh C, Traboulsi EI, Pomeroy SL, Hunter DG, Soul JS, Newlin A, Sabol LJ, Doherty EJ, de Uzcategui CE, de Uzcategui N, Collins ML, Sener EC, Wabbels B, Hellebrand H, Meitinger T, de Berardinis T, Magli A, Schiavi C, Pastore-Trossello M, Koc F, Wong AM, Levin AV, Geraghty MT, Descartes M, Flaherty M, Jamieson RV, Moller HU, Meuthen I, Callen DF, Kerwin J, Lindsay S, Meindl A, Gupta ML, Jr, Pellman D, Engle EC. Human TUBB3 mutations perturb microtubule dynamics, kinesin interactions, and axon guidance. Cell. 2010;140:74–87. doi: 10.1016/j.cell.2009.12.011. [DOI] [PMC free article] [PubMed] [Google Scholar]
- Tomita K, Madura T, Sakai Y, Yano K, Terenghi G, Hosokawa K. Glial differentiation of human adipose-derived stem cells: implications for cell-based transplantation therapy. Neuroscience. 2013;236:55–65. doi: 10.1016/j.neuroscience.2012.12.066. [DOI] [PubMed] [Google Scholar]
- Torkildsen O, Brunborg LA, Myhr KM, Bo L. The cuprizone model for demyelination. Acta neurologica Scandinavica Supplementum. 2008;188:72–76. doi: 10.1111/j.1600-0404.2008.01036.x. [DOI] [PubMed] [Google Scholar]
- Uhlen M, Fagerberg L, Hallstrom BM, Lindskog C, Oksvold P, Mardinoglu A, Sivertsson A, Kampf C, Sjostedt E, Asplund A, Olsson I, Edlund K, Lundberg E, Navani S, Szigyarto CA, Odeberg J, Djureinovic D, Takanen JO, Hober S, Alm T, Edqvist PH, Berling H, Tegel H, Mulder J, Rockberg J, Nilsson P, Schwenk JM, Hamsten M, von Feilitzen K, Forsberg M, Persson L, Johansson F, Zwahlen M, von Heijne G, Nielsen J, Ponten F. Proteomics. Tissue-based map of the human proteome. Science. 2015;347:1260419. doi: 10.1126/science.1260419. [DOI] [PubMed] [Google Scholar]
- Vogel C, Abreu Rde S, Ko D, Le SY, Shapiro BA, Burns SC, Sandhu D, Boutz DR, Marcotte EM, Penalva LO. Sequence signatures and mRNA concentration can explain two-thirds of protein abundance variation in a human cell line. Mol Syst Biol. 2010;6:400. doi: 10.1038/msb.2010.59. [DOI] [PMC free article] [PubMed] [Google Scholar]
- Vulpe C, Levinson B, Whitney S, Packman S, Gitschier J. Isolation of a candidate gene for Menkes disease and evidence that it encodes a copper-transporting ATPase. Nature genetics. 1993;3:7–13. doi: 10.1038/ng0193-7. [DOI] [PubMed] [Google Scholar]
- Wall PD, Devor M, Inbal R, Scadding JW, Schonfeld D, Seltzer Z, Tomkiewicz MM. Autotomy following peripheral nerve lesions: experimental anaesthesia dolorosa. Pain. 1979;7:103–111. doi: 10.1016/0304-3959(79)90002-2. [DOI] [PubMed] [Google Scholar]
- Wallen RC, Antonellis A. To charge or not to charge: mechanistic insights into neuropathy- associated tRNA synthetase mutations. Curr Opin Genet Dev. 2013;23:302–309. doi: 10.1016/j.gde.2013.02.002. [DOI] [PMC free article] [PubMed] [Google Scholar]
- Yang Y, Wang Y, Li S, Xu Z, Li H, Ma L, Fan J, Bu D, Liu B, Fan Z, Wu G, Jin J, Ding B, Zhu X, Shen Y. Mutations in SCN9A, encoding a sodium channel alpha subunit, in patients with primary erythermalgia. J Med Genet. 2004;41:171–174. doi: 10.1136/jmg.2003.012153. [DOI] [PMC free article] [PubMed] [Google Scholar]
Associated Data
This section collects any data citations, data availability statements, or supplementary materials included in this article.