

SUMMARY
tRNAs are subject to numerous modifications including methylation. Mutations in the human N7-methylguanosine (m7G) methyltransferase complex METTL1/WDR4 cause primordial dwarfism and brain malformation yet the molecular and cellular function in mammals is not well understood. We developed m7G methylated tRNA immunoprecipitation sequencing (MeRIP-Seq) and tRNA reduction and cleavage sequencing (TRAC-Seq) to reveal the m7G tRNA methylome in mouse embryonic stem cells (mESCs). A subset of 22 tRNAs are modified at a ‘RAGGU’ motif within the variable loop. We observe increased ribosome occupancy at the corresponding codons in Mettl1 knockout mESCs implying widespread effects on tRNA function, ribosome pausing, and mRNA translation. Translation of cell cycle genes and those associated with brain abnormalities is particularly affected. Mettl1 or Wdr4 knockout mESCs display defective self-renewal and neural differentiation. Our study uncovers the complexity of the mammalian m7G tRNA methylome and highlights its essential role in ESCs with links to human disease.
Keywords: N7-methylguanosine, m7G, RNA methylation, MeRIP-Seq, tRNA, TRAC-Seq, translation, embryonic stem cells, neural development, Mettl1, Wdr4
ETOC BLURB
Lin and Liu et al. developed two independent methods, MeRIP-Seq and TRAC-Seq, to profile the m7G tRNA methylome in mouse ESCs and revealed that Mettl1/Wdr4- mediated m7G tRNA methylome is required for normal mRNA translation and ESC self- renewal and differentiation.

INTRODUCTION
Transfer RNAs (tRNAs) are subject to numerous posttranscriptional modifications including methylation, which can control tRNA folding, stability, and function in messenger RNA (mRNA) translation (Chou et al., 2017; Liu et al., 2016; Phizicky and Alfonzo, 2010). Dysregulation of specific tRNA modifications has been linked to a range of genetic disorders and cancers (Kirchner and Ignatova, 2015; Torres et al., 2014). Individual tRNA modifications have different functional roles, with several of the tRNA modifications in the anticodon region being essential for translation and growth in yeast, whereas the numerous tRNA modifications outside of the anticodon region are often non- essential and might regulate tRNA stability, folding, and/or function under certain growth conditions including the stress response (Kirchner and Ignatova, 2015; Phizicky and Alfonzo, 2010).
N7-methylguanosine (m7G) at nucleotide 46 (m7G46) is one of the most prevalent tRNA modifications found in prokaryotes, eukaryotes, and in some archaea. In yeast, m7G46 is found in the variable loop region of 11 tRNA species (Sprinzl et al., 1998), including PheGAA, ValAAC, ValCAC, MetCAT, and LysTTT (Phizicky and Alfonzo, 2010), and the tRNAPhe structure shows a C13–G22- m7G46 base triple interaction (Jovine et al., 2000). The m7G modification is also one of the few known modifications that introduces a positive charge or zwitterion onto the nucleobase. However, m7G is a nonessential tRNA modification in yeast. The yeast methyltransferase Trm8p and its essential co- factor Trm82p form a heterodimeric complex that catalyzes the S-adenosylmethionine (SAM)- dependentm7G modification of tRNA (Alexandrov et al., 2002; Leulliot et al., 2008). Depletion of Trm8, Trm82, or double mutations of Trm8 and Trm82 has no effect on tRNA expression and do not affect yeast growth under normal culture conditions (Alexandrov et al., 2006; Alexandrov et al., 2005). However, the Trm8 or Trm82 yeast mutants have increased sensitivity to high temperature and show growth defects due to the rapid decay of tRNA ValAAC under heat stress (Alexandrov et al., 2006).
In human, mutations in the gene encoding WDR4 (WD Repeat Domain 4), the ortholog of yeast Trm82p and a component of the human m7G tRNA methyltransferase complex, causes impaired tRNA m7G modification and a distinct form of microcephalic primordial dwarfism characterized by facial dysmorphism, brain malformation, and severe encephalopathy with seizures (Shaheen et al., 2015; Trimouille et al., 2018). WDR4, located at human chromosome 21q22.3 is also a candidate gene for some of the Down syndrome phenotypes including mental retardation caused by trisomy of this chromosomal region in human patients (Michaud et al., 2000). Indeed, Wdr4 is one a handful of candidate genes whose overexpression in mouse influences learning and memory in a model of Down syndrome (Pereira et al., 2009). This suggests that the m7G tRNA modification might have more important physiological functions in mammals compared to yeast. In addition, the m7G tRNA methyltransferase METTL1 (Methyltransferase like 1) (ortholog of Trm8) was reported to be regulated by the protein kinase B (PKB) and ribosomal S6 kinase (RSK) under growth factor stimulation (Cartlidge et al., 2005), and influences cancer cell viability and sensitivity to 5-fluorouracil (Barbieri et al., 2017; Okamoto et al., 2014). The more severe phenotypes and physiological functions associated with dysregulation of m7G tRNA modifications in humans suggest differential evolutionary requirements for m7G tRNA modifications between mammals and yeast. However, the full extent of m7G tRNA modification has not been examined in a mammalian system and the molecular and cellular mechanisms underlying the severe developmental consequences of defective m7G tRNA modification due to METTL1/WDR4 deficiency remain unknown.
In this study, we developed two independent methods, m7G methylated tRNA immunoprecipitation sequencing (MeRIP-Seq) and m7G tRNA reduction and cleavage sequencing (TRAC-Seq) to profile the global m7G tRNA methylome in mouse embryonic stem cells (mESCs). Our data identified the global m7G tRNA methylome that is essential for the proper translation of cell cycle genes and genes associated with brain abnormalities in mESCs. In addition, knockout of Mettl1 or Wdr4 resulted in impaired mESC self-renewal and neural lineage differentiation capacity, consistent with the severe brain malformations seen in human patients with WDR4 mutations. Our study uncovers the complex tRNA m7G methylome in mammals and highlights the essential molecular and cellular role of Mettl1-Wdr4 and m7G modification in regulation of stem cells and disease.
RESULTS
Global profiling of tRNA m7G modification by m7G MeRIP-Seq
To study the tRNA m7G methylome in mammalian cells, we first knocked out the tRNA m7G methyltransferase Mettl1 using CRISPR/Cas9 in mESCs (Figure 1A, Figure S1A-B). Analysis of RNA extracted from control and Mettl1 knockout ESCs using an anti-m7G Northwestern assay whereby extracted total RNA samples were resolved on a denaturing polyacrylaminde gel, transferred to a nylon membrane, and blotted using α-m7G antibody, revealed the specific depletion of the m7G signal in tRNAs in the Mettl1 knockout (KO) cells but did not affect m7G-modified rRNAs (Figure 1B, Figure S1C). We further generated a mutant of the m7G methyltransferase METTL1 by mutating the active site (aa160-163, LFPD to AFPA) and found that expression of the WT METTL1 cDNA in the KO ESCs rescued the m7G modification on tRNAs whereas expression of the catalytic mutant METTL1 (Mut) did not (Figure 1C-D). We further confirmed by Northern blot that MeRIP performed using the anti-m7G antibody specifically enriched the known m7G modified tRNAs, but not the U6 small nuclear RNA (snRNA) control. Moreover, Mettl1 depletion specifically abolished the enrichment of m7G modified tRNAs in the anti-m7G MeRIP (Figure 1E).
Figure 1. Global profiling of tRNA m7G modifications by m7G MeRIP-Seq.
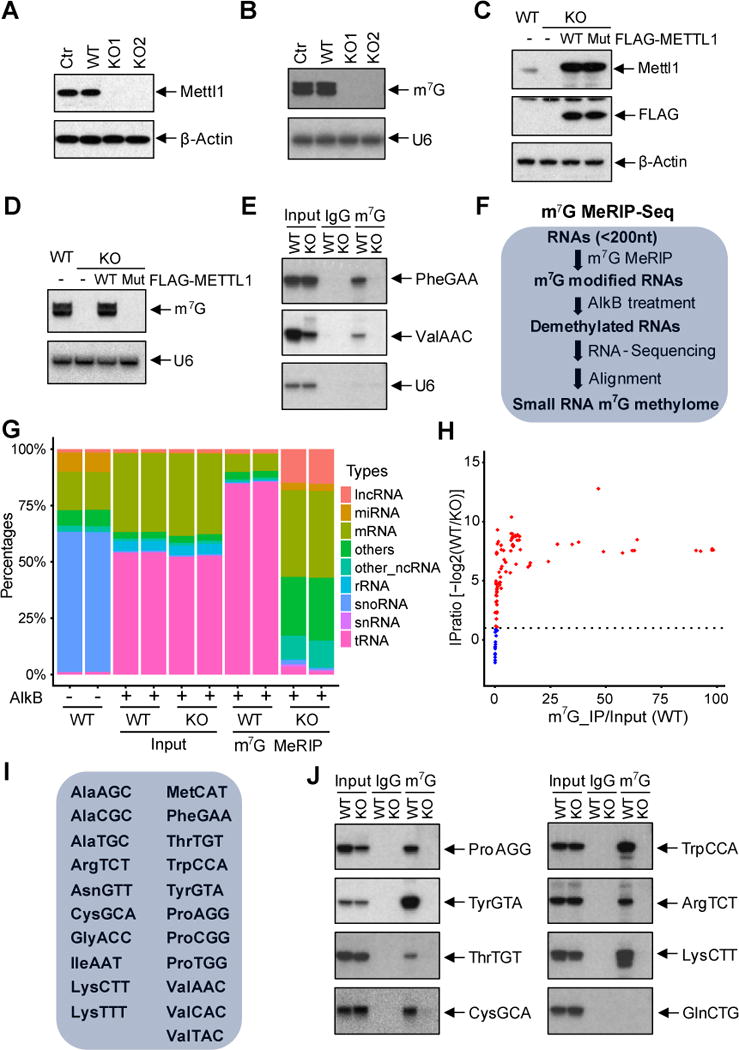
(A) Western blot of the control and Mettl1 KO samples with indicated antibodies. (B) Anti-m7G Northwestern blot of m7G modifications (Upper panel). RNA samples were separated on a TBE-urea gel, then transferred to nylon membrane for Western blotting using anti-m7G antibody. Northern blot of U6 snRNA was used a loading control (Lower panel). (C) Western blot of the METTL1 rescue samples with indicated antibodies. (D) Anti-m7G Northwestern blot of m7G modifications (Upper panel) and Northern blot of U6 snRNA (Lower panel). (E) Small RNA Northern blot of the anti-m7G IP products with indicated probes. (F) Schematic diagram of small RNA m7G MeRIP-seq to identify the m7G methylome. Small RNAs were isolated and treated with Alkb to remove modifications and then used for cDNA library construction. (G) Population of small RNA mapping in m7G MeRIP-Seq. Samples without Alkb treatment (Alkb-) were used as controls. n=2. (H) Scatter plot of tRNA relative enrichment of tRNA in m7G MeRIP-Seq. Relative enrichment was calculated by comparing the IP/Input ratio in the WT samples to the KO samples. (I) List of m7G modified tRNAs identified by m7G MeRIP-Seq. (J) Confirmation of m7G modified tRNAs by anti-m7G IP and Northern blot with indicated probes. No m7G modification was identified in GlnCTG, which was used as a control.
To examine m7G modifications globally, we developed a small RNA m7G MeRIP-Seq methodology using small RNAs (< 200 nt) isolated from KO and control ESCs to identify the global m7G modification in tRNAs. Because the extensive modifications on tRNAs can block the reverse transcription, we adopted a recently developed strategy of using the purified bacterial demethylase AlkB to remove tRNA methylation to achieve more efficient and accurate tRNA sequencing (Figure 1F) (Cozen et al., 2015; Zheng et al., 2015). This revealed that AlkB treatment of input small RNAs dramatically increased the proportion of tRNA reads in the sequencing library (Figure 1G, left four samples). Sequencing of the anti-m7G MeRIP enriched and the input small RNAs revealed that m7G MeRIP-Seq strongly enriched certain tRNAs, and this enrichment was abolished in the Mettl1 knockout cells (Figure 1G). Analysis of m7G MeRIP-Seq data uncovered the widespread m7G modification of tRNAs in mESCs. In addition to the several known m7G tRNAs, we identified a total of 21 tRNAs that contain m7G modifications (Figure 1H-I, Table S1). Several of the newly identified m7G tRNAs were confirmed by m7G MeRIP and Northern blotting (Figure 1J). Given that in yeast, only 11 m7G tRNAs were reported, our data revealed a more complex m7G tRNA modification landscape in mESCs.
Single nucleotide resolution mapping of tRNA m7G modifications by m7G TRAC-Seq
We next used a chemical cleavage method to confirm the newly identified m7G modifications on tRNAs. RNAs were subjected to reduction with sodium borohydride (NaBH4) and aniline-induced cleavage (Wintermeyer and Zachau, 1975; Zueva et al., 1985), and the cleaved tRNA fragments were analyzed by Northern blot using specific tRNA probes (Figure 2A-B). Our data revealed that, after chemical treatment, cleaved tRNA fragments could be detected in the RNA samples from WT cells but not the Mettl1 knockout cells, supporting the specificity of the chemical method in the cleavage of m7G modified RNAs. We next aimed to apply this chemical method for single nucleotide resolution identification of m7G sites by adaptor ligation and sequencing. 18S rRNA was tested because it has a known m7G site and is long enough for PCR based cloning and sequencing (Figure S2A). The total RNA sample from mESCs were first treated with NaBH4 and aniline, then an RNA adaptor was ligated to the 5′ end of the cleaved 3′ fragments, and RT-PCR was performed using primers to amplify the region that contains the adaptor-cleaved fragment junction site (Figure S2A-B). Sanger sequencing of the PCR products revealed the chemical treatment followed by adaptor ligation can specifically detect the known m7G site on G1639 of mouse 18S rRNA (Figure S2C).
Figure 2. Single nucleotide resolution mapping of m7G modifications by m7G TRAC-Seq.

(A) Schematic diagram of tRNA reduction and cleavage at m7G sites. RNA samples were treated with NaBH4 and aniline to induce the site-specific cleavage of RNA at m7G modified guanosines. (B) Northern blot of the chemical treated RNA samples with indicated probes. (C) Schematic diagram of the m7G TRAC-Seq. (D) Representative images of reads alignment to indicated tRNAs in the Integrative Genomics Viewer (IGV) using m7G TRAC-Seq data. Chemical treatment resulted in a site specific decrease of reads at m7G modified position. n=2. (E) Schematic diagram of the method to calculate the cleavage score at individual positions using TRAC-Seq data. (F) Representative images of cleavage scores of indicated tRNAs. Pictures show a specific increase of cleavage score at the m7G sites. (G) Overlap of m7G modified tRNAs identified in m7G MeRIP-Seq and m7G TRAC-Seq.
To perform the single nucleotide resolution mapping of global m7G modifications in tRNAs, we developed the m7G site-specific tRNA reduction and cleavage-sequencing (TRAC-Seq) method. The isolated small RNAs were first treated with AlkB that removes many methylation modifications but does not affect m7G, and AlkB-treated RNA was subjected to chemical reduction and cleavage conditions, as described above. A cDNA library was then constructed with adaptor ligation and PCR amplification. The sequence reads obtained from deep sequencing of these libraries were aligned to a small RNA database to identify new cleavage sites induced by chemical treatment (Figure 2C). Our m7G TRAC-Seq data revealed that chemical treatment resulted in the site specific initiation of reads after the known m7G46 site of tRNA PheGAA in WT mESC cells, but not in Mettl1 KO cells (Figure 2D). We also found site-specific cleavages in other known m7G tRNAs, as well as those newly identified by m7G MeRIP-Seq (Figure 2D). To identify m7G cleavage sites in tRNAs globally, we calculated the cleavage score by comparing the ratio of the number of reads that initiated from a specific site to the number of reads across that site in the treated and control samples (Figure 2E). We found a site-specific increase of cleavage score in the m7G sites, which allowed us to identify global m7G modifications in tRNAs at single nucleotide resolution (Figure 2F). Analysis of the m7G TRAC-Seq identified a total of 22 tRNAs that contain m7G modifications (Figure 2F, Figure S3), which includes all of the 21 m7G-modified tRNAs identified in our m7G meRIP-Seq as well as IleTAT (Figure 2G). IleTAT expression was very low in the input samples and was below the level of detection in the m7G MeRIP-Seq (not shown). Overall, our tRNA m7G MeRIP-Seq and m7G TRAC-Seq reproducibly identified the tRNA m7G methylome in mESCs, and uncovered a considerably more complex tRNA m7G modification landscape in mammals than had been previously found in yeast tRNAs.
Evolutionally different m7G tRNA modification and function in mouse and yeast
The fact that more tRNAs contain m7G modification in mouse than in yeast suggested the potential evolutionary differences in tRNA m7G modification and function between different species. Analysis of cleavage sites in m7G TRAC-Seq identified a ‘RAGGU’ m7G modification motif, in which the second guanosine is modified (Figure 3A). We next studied the mechanisms underlying the differences in m7G modified tRNAs between mouse and yeast. Currently there are 60 types of tRNA in mouse and only 42 types of tRNA in yeast annotated in the Genomic tRNA Database (Chan and Lowe, 2016). Comparison between the mouse and yeast tRNA genes revealed that several ‘RAGGU’ motif containing tRNAs, for example, GlyACC, are present in mouse but not in yeast (Figure 3B). Moreover, although some tRNAs are common in both mouse and yeast, their sequences in the V-loop have slightly changed during evolution. For example, tRNAs ArgTCT and AsnGTT contain the ‘AAGGU’ motif in the V-loop in mouse, while in yeast and other lower organisms, the corresponding sequences are ‘AAGAU’ (Figure 3C). Overall, these data suggest that tRNA types and sequences within the V-loop of tRNA have evolutionarily changed, resulting a more complex and widespread m7G tRNA methylome in mammals.
Figure 3. Evolutionary sequence conservation and function of m7G tRNA modifications.

(A) Sequence motif in the m7G sites identified by m7G TRAC-Seq in mouse cells. (B) Sequences of Gly-tRNAs in mouse and yeast. GlyAAC tRNA exists in mouse but not in the yeast. Green box labels the anticodon and red box indicates the m7G motif. (C) Sequences of ArgTCT and AsnGTT tRNAs in different species. Green box labels the anticodon and red box indicates the m7G motif. (D) Scatter plot of tRNA expression levels in the Mettl1 KO and control cells. Each dot represents one tRNA genes. x- axis indicates the changes of tRNA expression levels, y-axis indicates p-value. (E) Mann-Whitney test on the expression of the m7G and non-m7G tRNAs. (F) Expression profile of the 22 m7G modified tRNAs. Each box plot shows the expression of a tRNA type that was calculated from the combined expression of all the tRNA genes for the same tRNA type. (G) Small RNA Northern blot of the METTL1 rescue samples with indicated probes. U6 snRNA was used as a loading control.
We further determined whether the function of m7G tRNA modification is different between mouse and yeast. In yeast, depletion of the m7G tRNA methyltransferase Trm8 or its partner Trm82 has no effect on the expression level of m7G containing tRNA and does not affect yeast growth under normal culture conditions at 28°C but does induce s ensitivity at elevated growth temperature of 37°C (Alexandrov et al., 2006; Alexandrov et al., 2005). In mouse, we found that knockout of Mettl1 resulted in expression changes in the majority of m7G-modified tRNAs under normal culture conditions at 37°C. The mean expression of 6 tRNAs including ValTAC, ValAAC, ValCAC, ProCGG, ProAGG, and IleAAT, decreased more than 2-fold in Mettl1 knockout cells, while expression of several other tRNAs was more modestly decreased (Figure 3D-F). Surprisingly, CysGCA expression is increased when Mettl1 is depleted (Figure 3D-F). Overexpression of the WT METTL1 but not the catalytic dead mutant can rescue the expression of the ProAGG and ValAAC m7G tRNAs in the Mettl1 knockout cells (Figure 3G). Determination of tRNA aminoacylation by acid urea polyacrylamide gel electrophoresis followed by Northern blot revealed that depletion of tRNA m7G has little effect on tRNA aminoacylation (Figure S4). Taken together, our results revealed that the m7G tRNA modification is widespread and is essential for the proper expression of m7G modified tRNAs in mammalian cells under normal growth conditions.
Mettl1 depletion causes ribosome pausing at m7G-tRNA dependent codons and is required for the translation of cell cycle genes
To study the function of Mettl1-mediated m7G tRNA modifications, we first performed polysome profiling to determine the role of m7G tRNA modifications in regulation of global translation. Our result revealed that depletion of Mettl1 causes a reduction of polyribosome peak (Figure 4A), suggesting that global translation is decreased in the Mettl1 knockout cells. We further performed ribosome footprinting to identify the specific genes with altered translation in Mettl1-deficient cells (Table S2). Our ribosome footprinting identified ribosome protected fragments (RPF) that are located mainly in the coding DNA sequence (CDS) as expected (Figure S5A-C). Analysis of the translation efficiency (TE) and codon frequency revealed that the mRNAs with decreased translation efficiency have a significantly higher frequency of the codons decoded by the m7G modified tRNAs. On the other hand, the mRNAs with increased translation efficiency have a lower frequency of m7G-tRNA dependent codons (Figure 4B-C). Comparison of ribosome occupancy in the Mettl1 knockout and WT cells revealed that depletion of Mettl1 results in the increased ribosome pausing at m7G-tRNA dependent codons in the charged tRNA binding sites (A sites), while as control there is little change in the ribosome occupancy in the A+1 site, suggesting that the Mettl1 mediated tRNA modification is essential for efficient codon recognition during mRNA translation (Figure 4D). Moreover, ribosome occupancy in Mettl1-deficient cells was overall more pronounced at the A sites compared the P sites consistent with perturbation at the codon recognition step (Figure S5D-E). However, certain other codons that are decoded by m7G-modified tRNAs including AUA(I) and GUA(V) showed increased ribosome occupancy at the P sites suggesting that loss of m7G for the corresponding tRNAs might impede ribosome translocation (Figure S5D). The codon occupancy for the m7G-modified tRNAs (except for CysGCA) is significantly higher than the codon occupancy for the non-m7G-modified tRNAs (Figure S5F). Consistent with the increased expression of CysGCA tRNA, the codon occupancy for CysGCA tRNA decreased compared to occupancy on the non-m7G tRNAs decoded codons (Figure S5F). We also tested for the correlation between A site occupancy changes and tRNA abundance changes and revealed that decreased tRNA abundance is significantly associated with increased A site occupancy (Figure S5G). Taken together, these data further support the essential role of m7G tRNA modification in regulation of tRNA level and mRNA translation.
Figure 4. Mettl1 depletion causes ribosome pausing at m7G tRNA-dependent codon containing cell cycle and disease genes.

(A) Polysome profiling of the Mettl1 KO and WT cells. (B) Scatter plot of translation efficiency (TE) in the Mettl1 KO and WT cells. TE was calculated by dividing the ribosome protected fragments (RPF) signals to the input RNA-Seq signals. (C) Codon frequency in the CDS region of the genes with increased TE (up), decreased TE (down) and other genes (non) in the Mettl1 KO cells. (D) Ribosome occupancy at individual codon at A sites and A+1 sites. Data were presented as the relative ribosome footprinting signals from Mettl1 KO and WT cells. The codons are separated into four groups based on the modification and expression status of their corresponding tRNAs: codons decoded the m7G tRNAs (red); codons decoded by m7G tRNAs by wobble effect because of the not detected levels of their corresponding tRNAs (pink); codons decoded by non-m7G tRNAs by wobble effect because of the not detected levels of their corresponding tRNAs (grey); codons decoded by non-m7G tRNAs (black). (E) Gene ontology analysis of function enrichment in human phenotype and biological process using the TE down-regulated genes upon Mettl1 KO. (F-G) Cell cycle analysis of Mettl1 KO and WT cells. n=3, *p<0.05, **p<0.01.
Gene ontology analysis of human phenotypes associated with the TE decreased genes upon Mettl1 knockout revealed that those genes are selectively enriched in abnormality of forebrain morphology, cerebrum, and skull size (Figure 4E), which is consistent with the brain malformation and microcephaly described in WDR4 mutated patients. Moreover, the genes with decreased TE are associated with cell cycle progression (Figure 4E), suggesting the role of Mettl1-mediated m7G tRNA methylation in regulation of the cell cycle. Indeed, cell cycle analysis revealed that in the Mettl1 knockout cells, the percentage of cells in the G2 phase is significantly increased (Figure 4F-G), suggesting that depletion of Mettl1 results in impaired G2/M transition. Overall, our data uncovered the function of Mettl1-mediated m7G tRNA methylation in regulating the translation of disease and cell cycle related genes.
Mettl1is required for ESC self-renewal
Considering the widespread m7G tRNA modifications, and their role in regulating translation of disease and cell cycle genes in the mESCs, we decided to study the requirement of Mettl1-mediated m7G tRNA modifications in mESC biology. Depletion of Mettl1 resulted in decreased expression of stem cell markers Nanog and KLF4 (Figure 5A-B). Moreover, consistent with the impaired cell cycle progression, the Mettl1 knockout cells proliferate more slowly than the control cells (Figure 5C). Depletion of Mettl1 resulted in smaller colony size and impaired colony formation ability (Figure 5D–5F). In addition, alkaline phosphatase (AP) staining revealed a significant decrease of the AP positive population in the Mettl1 knockout cells (Figure 5G-H), suggesting that Mettl1 depleted mESCs have defective self-renewal and may undergo partial differentiation. Overall, the above data suggested that Mettl1 is essential for normal ESC self-renewal.
Figure 5. Mettl1 is required for mESCs self-renewal.

(A) qRT-PCR analysis of mRNA expression in Mettl1 KO and control cells with indicated primers. Error bars = mean ±SEM, n=3. (B) Western blot with indicated antibodies. (C) Cellular proliferation in the Mettl1 KO and control cells. 105 cells were seeded in 100 mm tissue culture dishes and then the cell numbers were counted at Day 3 and Day 5. n=3. (D-F) Colony formation assay of Mettl1 KO and control cells. 500 cells were seeded in 6 well plate, one week later, the colony size and number were measured. (D) The representative images of the colonies. Scale bar, 50uM. (E) Colony diameters. n=8, ***p<0.001. (F) Colony numbers. n=6, **p<0.01, ***p<0.001. (G-H) AP staining of the Mettl1 KO and control cells. Scale bar, 100uM. (G) Representative images; (H) Percentage of AP positive colonies. n=10, *p<0.05, ***p<0.001. (I) Scatter plot of mRNA expression using the RNA-Seq data from the Mettl1 KO and control cells. (J-K) Gene ontology analysis of the up-regulated and down-regulated genes upon Mettl1 knockout in mESCs. (L-M) q-RT-PCR analysis of mRNA expression in Mettl1 KO and control cells with indicated primers. Error bars = mean ±SEM, n=3.
We further performed RNA-sequencing analysis to study the global gene expression profiles in the Mettl1 knockout cells. Our data identified 174 up-regulated and 174 down-regulated genes in the Mettl1 knockout mESCs (Figure 5I and Table S3). Gene ontology analysis revealed that the up- regulated genes function in regulation of animal organ morphogenesis and development (Figure 5J). On the other hand, the down-regulated genes are associated with negative regulation of multicell organismal process and cell differentiation (Figure 5K). Real-time quantitative RT-PCR (qRT-PCR) was used to confirm the gene expression changes in the Mettl1 knockout cells (Figure 5L-M). Taken together, our results identify a critical role of Mettl1-mediated m7G tRNA methylome in maintaining ESC self-renewal and suggest that Mettl1 might influence ESC differentiation.
Mettl1-deficiency disrupts ESC differentiation to neural lineages
We next explored the requirement of Mettl1-mediated m7G tRNA methylome in mESC differentiation. First we induced spontaneous differentiation of mESCs by embryoid body (EB) formation assay (Figure 6A), in which the mESCs differentiate into derivatives of all three embryonic germ layers. The Mettl1 knockout cells and the control cells were induced to differentiate for 6 days and the relative expression of a panel of different lineage markers was measured by qRT-PCR. Interestingly, we found that depletion of Mettl1 selectively increased the expression of mesoderm and endoderm lineage markers, while the expression of ectoderm markers was decreased or remained unchanged in the Mettl1 knockout cells (Figure 6A), this suggested that Mettl1 depletion might disrupt the balance of ESCs differentiation. Transcriptome profiling of differentiated Mettl1 knockout and control cells revealed that depletion of Mettl1 resulted in the increased expression of 466 genes, most of which are involved in embryonic development such as cardiovascular system development (Figure 6B-C, and Table S4). On the other hand, Mettl1 knockout resulted in the down-regulation of 218 genes that are associated with the reproductive process and fertilization (Figure 6C and Table S4). Overall, our data revealed that Mettl1 deficiency leads to skewed differentiation towards the mesoderm and endoderm lineages and uncovers an essential function of Mettl1-mediated m7G tRNA methylome in mESC fate determination.
Figure 6. Mettl1 knockout disrupts balance of ESC differentiation and impairs neural lineage differentiation.

(A) Upper panel: schematic diagram of ESC embryoid body differentiation procedure. Lower panel: qRT-PCR analysis of mRNA expression in Mettl1 KO and control cells (after differentiation for 6 days) with indicated primers. Error bars = mean ±SEM, n=3. (B) Scatter plot of mRNA expression using the RNA-Seq data from the Mettl1 KO and control embryonic bodies (differentiated for 6 days). (C) Gene ontology analysis of functional enrichment in biological process using the differentially expression genes between the Day6 Mettl1 KO and control embryoid bodies. (D) Upper panel: schematic diagram of ESC neural lineage differentiation procedure. Lower panel: qRT-PCR analysis of mRNA expression in Mettl1 KO and control cells (after differentiation for 6 days) with indicated primers. Error bars = mean ±SEM, n=3. (E) Western blot of the METTL1 rescue samples with indicated antibodies. (F) qRT-PCR analysis of mRNA expression in METTL1 rescue samples (after differentiation for 6 days) with indicated primers. Error bars = mean ±SEM, n=3.
Mutations in the Mettl1-interacting partner WDR4 result in defective tRNA m7G modification and severe brain malformations in human patients. Considering that Mettl1 depletion favored the differentiation of mESCs to mesoderm and endoderm at the expense of ectoderm that gives rise to the entire nervous system, we specifically induced differentiation to the neural lineage and analyzed the effect of Mettl1 deficiency to determine whether Mettl1 knockout impaired the neural differentiation potential of mESCs. For this purpose, the Mettl1 knockout and control cells were cultured in the N2B27 medium to induce differentiation towards neural lineages for 6 days (Ying et al., 2003) (Figure 6D). We measured relative expression of a selection of neuronal marker genes by qRT-PCR. Our data revealed the Mettl1 depletion resulted in a striking decrease in the expression of neural lineage genes (Figure 6D), supporting that Mettl1 knockout cells have severely compromised neural differentiation. In addition, overexpression of METTL1 WT but not the catalytic dead mutant can rescue the expression of Nanog and neural markers in the Mettl1 knockout cells, further confirming the essential role of Mettl1 activity in regulation of neural differentiation (Figure 6E-F). To study why the neural lineage genes are specifically affected, we compared the codon frequencies, and CDS length of the neural genes (selected from the neural-related Gene Ontology terms) with the same number of randomly selected genes. We found that the frequencies of codons decoded by m7G methylated tRNAs are significant higher in neural genes than that of random genes (Figure S6A). In addition, the gene length analysis demonstrated that the CDS and UTRs are significantly longer in the neural genes than the randomly selected genes (Figure S6B). Taken together, the higher frequency of codons decoded by m7G methylated tRNAs and the longer CDS and UTR in the neural lineage genes might explain why neural lineage genes are more affected by the loss of m7G tRNA modification. Overall, our data uncover that Mettl1-deficiency disrupted the balance of ESCs differentiation and impaired differentiation to the neural lineage.
Wdr4 deficiency abolishes m7G tRNA modification and impairs ESC proliferation and neural differentiation
To further study the role of m7G tRNA methylation in regulation of stem cell pluripotency and differentiation, we generated the Wdr4 knockout mESCs (Figure 7A-B). Removal of the exons 4-6 of Wdr4 gene by CRISPR/Cas9 resulted in strong decrease of Wdr4 mRNA expression (Figure 7C). Our Northwestern blot showed that knockout of Wdr4 resulted in complete loss of m7G modification in tRNAs (Figure 7D). Anti-m7G MeRIP and chemical mediated cleavage assay further confirmed the critical function of Wdr4 in mediating the m7G tRNA modification in mESCs (Figure 7E-F). We next studied the role of Wdr4 in the regulation of mESC proliferation and differentiation. Similar to Mettl1 knockout, depletion of Wdr4 resulted in the slower proliferation of mESCs (Figure 7G). Most importantly, when induced for neural lineage differentiation, the WDR4 knockout cells showed decreased expression of neural differentiation markers (Figure 7H), suggesting that depletion of WDR4 impairs the neural lineage differentiation capacity of mESCs. Taken together, our data support the essential roles of the Mettl1- and Wdr4-mediated m7G tRNA modification in regulation of mESCs self-renewal and differentiation.
Figure 7. Wdr4 knockdown abolishes m7G tRNA modification and impairs ESC proliferation and neural differentiation.

(A) Schematic diagram of CRISPR mediated knockout of Wdr4 expression in mESCs. (B) PCR to confirm the knockout of Wdr4 in mESCs using genome DNA samples from the knockout and control cells. (C) qRT-PCR analysis of Wdr4 mRNA expression in knockout and control cells. Error bars = mean ±SEM, n=3. (D) Anti-m7G Northwestern blot of m7G modifications. RNA samples were separated with TBE-UREA gel, when transferred to nylon membrane for Western blotting using anti-m7G antibody. Northern blot of U6 snRNA was used a loading control. (E) Small RNA Northern blot of the anti-m7G IP products with indicated probes. (F) Northern blot of the chemical treated RNA samples with indicated probes. (G) Cellular proliferation in the Wdr4 and control cells. 105 cells were seeded in 100 mm tissue culture dishes and then the cell numbers were counted at Day 3 and Day 5. (H) Upper panel: schematic diagram of ESC neural lineage differentiation procedure. Lower panel: qRT-PCR analysis of mRNA expression in Mettl1 KO and control cells (after differentiation for 6 days) with indicated primers. Error bars = mean ±SEM, n=3.
DISCUSSION
This study developed two methods including m7G MeRIP-Seq and TRAC-Seq to reveal the mammalian m7G tRNA methylome at single nucleotide resolution. We find a specific subset of 22 tRNAs that are m7G-modified and contain a ‘RAGGU’ sequence motif in the variable loop. Unlike in yeast where m7G is dispensable for growth under normal conditions, our work reveals an essential role for m7G tRNA modification for ESC self-renewal and neural differentiation and this is most likely explained by the more complex m7G tRNA modification landscape in mammals and a particular requirement of the m7G-modified tRNAs for the efficient translation of mRNAs involved in mitosis and brain development. This conclusion is based on loss-of-function studies of the components of the m7G methyltransferase complex Mettl1 and Wdr4 where we observe a complete loss of m7G tRNA modification. Ribosome profiling identifies widespread effects on mRNA translation especially for mRNAs related to the cell cycle and those controlling forebrain morphology that are less efficiently translated in Mettl1 knockout ESCs. Accordingly, Mettl1-deficient cells have an altered cell cycle, proliferate more slowly, and are prone to spontaneous differentiation under self-renewing conditions. Moreover, we found Mettl1 or Wdr4 knockout ESCs have defects in cell differentiation, in particular showing compromised ability to give rise to neural lineages.
The antibody-based methylated RNA immunoprecipitation coupled with next generation sequencing (MeRIP-Seq) technique is a powerful strategy for transcriptome-wide mapping of RNA modifications in mRNAs (Dominissini et al., 2013; Zhao et al., 2017). However, there was no reported global MeRIP-seq mediated profiling of tRNA modifications because the extensive tRNA modifications interfere with reverse transcription during cDNA library construction. Recently two independent groups developed efficient tRNA sequencing methods (DM-tRNA-Seq and ARM-Seq). Both methods use the bacterial demethylase AlkB to remove tRNA methylation to facilitate efficient reverse transcription (Cozen et al., 2015; Zheng et al., 2015). These tRNA sequencing methods served as a basis for our development of the tRNA MeRIP-Seq technique for the global profiling of m7G tRNA modification. We combined the m7G MeRIP and the AlkB-mediated tRNA sequencing approach to develop the m7G tRNA MeRIP-Seq method (Figure 1), which allowed us to profile the global m7G tRNA methylome to study the molecular mechanisms underlying the dysregulated m7G tRNA modifications in diseases. While we focused here on m7G because of the severe phenotypes associated with altered m7G modifications in human patients, we anticipate that adaption of our method using antibodies that recognize other RNA modifications will be useful to interrogate and map the global landscape other tRNA modifications. To confirm and extend our findings from the m7G tRNA meRIP-Seq method, we further developed an antibody independent, tRNA reduction and cleavage-sequencing (TRAC-Seq) method. In TRAC-Seq, the small RNA-enriched samples are first treated with AlkB, which can remove other dominant methylation marks but not m7G modification, the RNAs are then subsequently treated with sodium borohydride followed by aniline to induce the site-specific cleavage of tRNAs at the m7G residue (Wintermeyer and Zachau, 1975; Zueva et al., 1985). The 3′ fragment released by this chemical cleavage carries a 5′ phosphate that is compatible with linker ligation, thereby enabling cDNA library preparation for next generation sequencing. m7G TRAC-Seq specifically identified the chemical induced cleavage sites, facilitating the global mapping of m7G modification at single nucleotide resolution (Figure 2).
Our m7G tRNA MeRIP-Seq and m7G TRAC-Seq methods identified 22 m7G modified tRNAs in mESCs that possess a ‘RAGGU’ motif, revealing much more widespread m7G tRNA modifications in mammals than is known for yeast. The requirement of the ‘RAGGU’ sequence motif could explain the larger number of m7G modified tRNAs in mammals than in yeast: 1) The mouse genome contains a larger repertoire of tRNAs, and some of the tRNAs present in mouse such as GlyAAC contain a ‘RAGGU’ motif and therefore are modified (Figure 3B). 2) The sequences of certain tRNAs are slightly different between different species during evolution; for example, the mouse ArgTCT tRNA has ‘AAGGU’ motif in the V-loop, while the corresponding sequence in yeast ArgTCT tRNA is ‘AAGAU’, such that it lacks the ‘G’ that is modified in mouse tRNA. Interestingly, most of the mouse mitochondrial tRNAs do not have the ‘RAGGU’ motif, and concomitantly we did not detect m7G modification in mitochondrial tRNAs (data now shown). Analysis of all mouse tRNAs in the database revealed that 2 additional tRNAs that contain the RAGGU, SerGGA contains ‘AAGGU” and HisATG contains “GAGGU”, but are not included in our list of 22 tRNA since they were not detected in mESCs yet based on our findings might be expected to be m7G-modified in other cell-types where they are expressed.
Polysome profiling and ribosome footprinting revealed that depletion of Mettl1-mediated m7G tRNA modifications resulted in ribosome pausing at m7G tRNA dependent codons. Interestingly, the genes that are translationally regulated by the Mettl1 are enriched in cell cycle genes and the genes associated with brain abnormality. Consistent with the gene ontology analysis, Mettl1 knockout in mESCs increased G2 phase percentage and resulted in slower proliferation and impaired colony formation ability. AP staining and gene expression profiling revealed that the Mettl1 depleted mESCs undergo partial spontaneous differentiation. Overall, the above data revealed that Mettl1-mediated m7G tRNA modification is essential to maintain ESC self-renewal. Most importantly, when induced for spontaneous differentiation, the Mettl1 knockout cells tend to differentiate into mesoderm and endoderm lineages but not ectoderm. Neural specific differentiation of mESCs further confirmed that Mettl1-mediated tRNA m7G modification is essential for the proper expression of neural lineage genes. Considering that 1) Mettl1 depletion decreases the translation of genes associated with abnormality of forebrain morphology, cerebrum and skull size, 2) Mettl1 knockout in mESCs results in impaired neural differentiation, and 3) Mutation of WDR4 causes impaired tRNA m7G modification and microcephalic primordial dwarfism with neural defects (Shaheen et al., 2015; Trimouille et al., 2018), our data provide strong evidence for the molecular and cellular requirement for m7G tRNA modifications that is likely responsible for the pathogenesis of this human disease. It will be of substantial interest to apply m7G MeRIP-Seq and/or TRAC-Seq to explore changes in the tRNA methylome and links with human developmental disorders including microcephalic primordial dwarfism with neural defects as well as Down syndrome to better understand these tantalizing links between the tRNA methylome and disease.
STAR★METHODS
Detailed methods are provided in the online version of this paper and include the following:
KEY RESOURCES TABLE
| REAGENT or RESOURCE | SOURCE | IDENTIFIER |
|---|---|---|
| Antibodies
| ||
| Rabbit polyclonal anti-Mettl1 | Proteintech | Cat# 14994-1-AP |
| Rabbit polyclonal anti-beta-Acin | Abcam | Cat# ab8227 |
| Rabbit polyclonal anti-Nanog | Abcam | Cat# ab70482 |
| Mouse monoclonal 7-methylguanosine (m′ G) | MBL International | Cat# RN017M |
| Mouse monoclonal anti-FLAG | Sigma | Cat# A8592 |
|
Bacterial and Virus Strains | ||
| GC10 chemically competent cells | Genesee Scientific | Cat# 42-657 |
| BL21(DE3) Competent E. coli | New England Biolabs | Cat# C2527I |
|
Chemicals, Peptides, and Recombinant Proteins | ||
| DMEM | Gibco | Cat#11965092 |
| DMEM/F12 | Gibco | Cat#11330032 |
| Neurobasal medium | Gibco | Cat#21103049 |
| Opti-MEM™ I Reduced Serum Medium | Gibico | Cat# 31985070 |
| MEM Non-Essential Amino Acids Solution (NEAA) | Gibco | Cat#11140050 |
| L-Glutamine | Gibco | Cat# 25030081 |
| Sodium Pyruvate | Gibco | Cat# 11360070 |
| Penicillin-Streptomycin | Gibco | Cat# 15140163 |
| B-27™ Supplement | Gibco | Cat# 12587010 |
| N-2 Supplement | Gibco | Cat# 17502048 |
| Trypsin-EDTA | Gibco | Cat# 15400054 |
| DPBS | Gibco | Cat# 14190250 |
| Stem Cell Qualified Fetal Bovine Serum | Gemini | Cat# 100-125 |
| Mouse Leukemia Inhibitory Factor (LIF) | Gemini | Cat# 400-495 |
| Gelatin from porcine skin | Sigma | Cat# G1890 |
| Formaldehyde solution | Sigma | Cat# 252549 |
| Acetic acid glacial, ≥99.85% | ThermoFisher | Cat# A38-212 |
| 2-Mercaptoethanol | ThermoFisher | Cat# 60-24-2 |
| Poly(2-hydroxyethyl methacrylate) (polyHEMA) | Sigma | Cat# 192066 |
| ZnCl2 | Sigma | Cat# Z0152 |
| Trizma® base | Sigma | Cat# T4661 |
| EDTA | Sigma | Cat# 431788 |
| NaCl | Sigma | Cat# S7653 |
| KCl | Sigma | Cat# P9541 |
| MgCl2 | Sigma | Cat# M8266 |
| Igepal CA-630 | Sigma | Cat# I8896 |
| Bovine Serum Albumin | Sigma | Cat# 05470 |
| Isopropyl β-D-1-thiogalactopyranoside (IPTG) | Sigma | Cat# I5502 |
| MES | Sigma | Cat# M3671 |
| α-Ketoglutaric acid | Sigma | Cat# 75890 |
| Ammonium iron(II) sulfate hexahydrate | Sigma | Cat# 215406 |
| L-Ascorbic acid | Sigma | Cat# A92902 |
| Sodium borohydride | Sigma | Cat# 452882 |
| Aniline | Sigma | Cat# 242284 |
| RNasin® Ribonuclease Inhibitors | Pormega | Cat# N2518 |
| Lipofectamine™ 2000 Transfection Reagent | Invitrogen | Cat# 11668019 |
| SuperScript™ II Reverse Transcriptase | Invitrogen | Cat# 18064014 |
| SuperScript™ III Reverse Transcriptase | Invitrogen | Cat# 18080093 |
| Platinum™ High Fidelity Taq DNA Polymerase | Invitrogen | Cat# 11304029 |
| TRIzol™ Reagent | Invitrogen | Cat# 15596026 |
|
Critical Commercial Assays | ||
| TruSeq Stranded mRNA Sample Prep Kits | Illumina | Cat# RS-122-2101 |
| TruSeq Ribo Profile for Mammalian | Illumina | Cat# PHMR12126 |
| Ribo-Zero Gold rRNA Removal Kit | Illumina | Cat# MRZG12324 |
| NEBNext® Small RNA Library Prep Kit | New England Biolabs | Cat# E7330S |
| Q5® Site-Directed Mutagenesis Kit | New England Biolabs | Cat# E0554 |
| Fast SYBR™ Green Master Mix | Applied Biosystems | Cat# 4385612 |
| PolyATtract® mRNA Isolation System | Promega | Cat# Z5310 |
| MinElute PCR Purification Kit (50) | Qiagen | Cat# 28004 |
| Oligo Clean & Concentrator | Zymo research | Cat# D4061 |
| Blue-color ™ AP Staining Kit | SBI | Cat# AP100 B-1 |
|
Deposited Data | ||
| RNA-seq, m7G-MeRIP-Seq, m7G-TRAC-Seq | This paper | GEO: GSE112670 |
|
Experimental Models: Cell Lines | ||
| Mouse cell line: R1/E mESCs | ATCC | SCRC-1036 |
|
Oligonucleotides | ||
| Oligonucleotides were listed in Table S5
| ||
| Recombinant DNA
| ||
| pFLAG-CMV2 vector | Sigma | Cat# E7033 |
| pET30a-AlkB | Addgene | Cat# 79050 |
| pET30a-AlkB-D135S | Addgene | Cat# 79051 |
| pX330 | Addgene | Cat# 42230 |
|
Software and Algorithms | ||
| trim_galore | https://www.bioinformatics.babraham.ac.uk/projects/trim_galore | NA |
| Bowtie2 | http://bowtie-bio.sourceforge.net | NA |
| TopHat | https://ccb.jhu.edu/software/tophat/manual.shtml | NA |
| Toppgene | https://toppgene.cchmc.org/ | NA |
| HTSeq | https://htseq.readthedocs.io | NA |
| edegR | http://bioconductor.org/packages/release/bioc/html/edgeR.html | NA |
| Bedtools | http://bedtools.readthedocs.io | NA |
CONTACT FOR REAGENT AND RESOURCE SHARING
Further queries and reagent requests may be directed and will be fulfilled by the lead contact, Richard I. Gregory (rgregory@enders.tch.harvard.edu)
EXPERIMENTAL MODEL AND SUBJECT DETAILS
Cell culture
Mouse R1/E ESCs (gift from Dr. Lizi Wu) were cultured in either Serum/LIF medium [DMEM (Gibco) with 1000u/ml mLIF (Gemini), 15% stem cell FBS (Gemini),1X Sodium Pyruvate (Gibco), 1X NEAA (Gibco), 1X L- glutamine (Gibco), 50μM 2-mercaptoethanol (ThermoFisher) and 1% Penicillin-Streptomycin (Gibco)] in a 5% CO2 cell culture incubator at 37°C. Cells were cultured in feeder free condition, and the cultured dishes were coated with 0.1% Gelatin for 30 minutes at 37°C to enhance cell attachment. For cell passage, cells were firstly washed with PBS for twice. Trypsin (0.1% in PBS) was added to the dishes, which were then incubate at 37°C for 3 minutes, and Serum/LIF medium above was used to inactive trypsin. After collected by centrifuge at 1000g for 3 minutes, cells were counted and split for different purposes. To knockout Mettl1 or WDR4 with CRISPR technique, sgRNAs targeting Mettl1 or WDR4 were cloned into pX330 vectors (Cong et al., 2013). Then the vectors were transfected into mESCs with Lipofectamine 2000 (Invitrogen) together with a puromycin resistant plasmid. The second day after transfection, cells were seeded in low density and selected with 2.5ug/ml puromycin for 24 hours. One week later, single colonies were screened with PCR to identify the knockout clones. The sgRNAs sequences and primer sequences were listed in Table S5.
METHOD DETAILS
Plasmid Construction
For preparation of Mettl1 or WDR4 sgRNA vector for CRISPR knockout, sgRNAs were designed using CRISPR design tool (http://crispr.mit.edu). Sense and antisense sgRNA oligos were annealed and then ligated into BbsI site of pX330 vector following the instructions from Addgene (http://www.addgene.org/crispr/zhang). For cloning of METTL1 expression, the full length METTL1 cDNA was first PCR amplified from the 293T cDNA with primers that contain the NotI (forward primer) and BglII (reverse primer) sites. Then the PCR product was gel purified and digested with NotI and BglII at 37°C overnight. After that the digested PCR product was purified again and ligated into the NotI/BglII cut pFLAG-CMV2 vector. The METTL1 catalytic dead mutant (aa160-163, LFPD to AFPA) was generated using the Q5® Site-Directed Mutagenesis Kit (New England Biolabs).
mESCs self-renewal and differentiation
To determine self-renewal capacities of the Mettl1 or Wdr4 knockout and control mESCs, 105 cells were seeded in 100 mm tissue culture dishes and then the cell numbers were counted at Day3 and Day5. For colony formation assay, 500 cells were seeded in 6 well plate, the colony size and number were measured one week later. Alkaline phophatase staining was performed with Blue-Color AP Staining Kit (System Biosciences) following the manufacturer’s instructions. For spontaneous differentiation of mESCs, the cell culture dishes were first coated with Poly(2-hydroxyethyl methacrylate) (polyHEMA) to prevent cell attachment. Briefly, 2ml polyHEMA (Sigma) (20mg/ml in 75% ethanol) was added into 100 mm dishes, which were dried in cell culture hood for more than 4 hours. Then 5 × 10⁶ mESCs were cultured with LIF (-) medium in the Poly(2-hydroxyethyl methacrylate) coated dishes to induce embryoid body formation for 6 days. To induce the neural lineage differentiation of mESCs, 5 × 10⁵ mESCs were cultured in N2B27 medium for 6 days using a previously established protocol (Ying et al., 2003). Briefly, 60mm dishes were first coated with 0.1% Gelatin, then 5 × 10⁵ mESCs were cultured in 60 mm dishes using the N2B27 medium [1:1 mixture of DMEM/F12 (Gibco) supplemented with N2 and Neurobasal medium supplemented with B27 (Gibco)].
RNA isolation, reverse transcription and qRT-PCR
Total RNA samples were isolated with Trizol following the manufacturer’s instructions. Briefly, cells were washed with PBS twice, then 1ml Trizol were added to dishes for RNA isolation. The concentrations of isolated RNA samples were measured by Nanodrop. Reverse transcription was performed with SuperScript III Reverse Transcriptase (Invitrogen) using 2μg total RNA in a 20ul reaction system. Random hexamers were used for the reverse transcription. After reverse transcription, the cDNA samples were diluted 1:10 for the analysis of gene expression using qRT-PCR. qRT-PCR was performed using SYBR Green PCR Master Mix with the Step One Real-Time PCR System (Applied Biosystems). The primers used for qRT-PCR assays were listed in Table S5.
Northern blot, Northwestern blot and Western blot
Northern blot and Western blot were performed as previously described (Lin and Gregory, 2015). Briefly, for Northern blotting of tRNAs or U6 snoRNA, 2ug total RNA samples were mixed with 2X TBE loading buffer (Bio- Rad) and incubated at 95°C for 5 minutes, then the samples were loaded into 10% TBE-UREA (Bio-Rad) gene to separate the RNAs by molecular weight. 5% TBE-UREA gel was used for the Northern blot of 18S rRNA. After electrophoresis, the RNAs were transferred onto a positive charged nylon membrane. The RNAs on the membrane were crosslinked with UV and then the membrane was blotted with radioactive labeled probes against tRNAs or 18S rRNA, or U6 snRNA. The probe sequences were listed in Table S5. For Northwestern blotting, the RNA containing membranes were blotted with anti-m7G antibody (MBL International, #RN017M), and then the m7G signals were detected following the Western blot protocol described previously (Lin and Gregory, 2015).
tRNA aminoacylation analysis
tRNA aminoacylation was determined by acid urea polyacrylamide gel electrophoresis (acid urea PAGE) followed by Northern blot method as previously described (Janssen et al., 2012; Kohrer and Rajbhandary, 2008). Briefly, RNA samples were isolated with Trizol and treated with 0.1 M Tris PH9.5 at 37°C for 1 hour, then the treated and control RNA samples were precipitated with 2.5 volume of ethanol and 1/10 volume of 3M sodium acetate (pH5.2), and resuspended in 10 mM sodium acetate pH 5.0. 2ug RNA samples were loaded into acid (pH5.0) urea polyacrylamide gel, then the RNAs were separated by electrophoresis using 0.1 M sodium acetate (pH 5.0) as electrophoresis buffer. After electrophoresis, the RNAs in the gel were transferred onto a positive charged nylon membrane. The RNAs on the membrane were crosslinked with UV and then the membrane was blotted with radioactive labeled probes against m7G modified tRNAs. The probe sequences were listed in Table S5.
Recombinant protein purification
Recombinant wild-type and D135S AlkB proteins were purified as previous described (Lin and Gregory, 2015). pET30a-AlkB and pET30a-AlkB-D135S were gifts from Tao Pan (Addgene plasmid # 79050 and #79051)(Zheng et al., 2015). pET30a-AlkB and pET30a-AlkB-D135S were transformed into BL21 bacteria for induced expression of recombinant proteins. Bacteria were inoculated and cultured in LB medium at 37°C. Recombinant wild-type and D135S AlkB protein expressions were induced in BL21 bacteria (OD 0.4-0.6) using 0.5mM IPTG at 20°C overnight. Then the bacteria were collected and lyzed by sonication, centrifuged at 15000rpm at 4°C for 60 minutes. The supernatant were collected for the purification of recombinant proteins using Ni-NTA Agarose (Qiagen) following the manufacturer’s instructions.
m7G tRNA meRIP-Seq
For m7G tRNA meRIP-Seq, small RNAs (<200nt) were first purified using the mirVana miRNA Isolation Kit (Thermo Fisher Scientific). Then anti-m7G meRIP was performed on the small RNA by modifying the previously established mRNA meRIP protocol (Dominissini et al., 2013; Lin et al., 2016). Briefly, 75 μg small RNAs were incubated with 7.5 μg anti-m7G antibody (MBL International, #RN017M) for 2 hours, and then 100 μl pre-washed Protein A/G Magnetic Beads (Thermo Fisher Scientific, #88802) were added to purify the m7G modified small RNAs. After extensive wash, the beads bound RNAs were extracted with Trizol reagent following the manufacturer’s instructions. The precipitated small RNAs and input small RNAs were treated with purified recombinant wild-type and D135S AlkB proteins to remove dominant methylations as previously described (Zheng et al., 2015). Briefly, the precipitated small RNAs and 1ug input small RNAs were treated with were treated with 80 pmol wtAlkB and 160 pmol D135S AlkB mutant in a 100 ul demethylation reaction [300 mM KCl, 2 mM MgCl2, 50 M of (NH4)2Fe(SO4)2·6H2O, 300 M 2-ketoglutarate (2-KG), 2 mM L-ascorbic acid, 50 g/mL BSA, 50 mM MES buffer (pH 5.0)]. After incubation at room temperature for 2 hours, the reaction was quenched with at final concentration of 5 mM EDTA. Then the treated RNAs were purified by phenol–chloroform extraction and ethanol precipitation. After that, small RNA libraries were constructed with NEBNext Small RNA Library Prep Set (New England Biolabs) (Cozen et al., 2015). The cDNA libraries were sequenced with an Illumina Nextseq 500.
m7G TRAC-Seq
For m7G TRAC-Seq, isolated small RNAs were first treated with recombinant wild-type and D135S AlkB proteins to remove the dominant methylations on RNAs. 2.5 μg Alkb-treated RNAs were treated with 0.1M NaBH4 for 30 minutes on ice at dark in the presence of 1 mM free m7GTP as methylation carrier. Then the RNAs were precipitated with 0.1 volume 3M sodium acetate (PH5.2) and 2.5 volume cold ethanol at −20°C for at least two hours. After precipitation, the NaBH4-treated RNAs were subsequently treated with aniline-acetate solution (H2O: glacial acetate acid:aniline, 7:3:1) at room temperature at dark for 2 hours to induce the site specific cleavage (Wintermeyer and Zachau, 1975; Zueva et al., 1985). The RNA samples were purified by ethanol precipitation and used for cDNA library construction, followed by sequencing with Illumina Nextseq 500.
Ribosome footprinting
Ribosome footprinting was performed using the TruSeq Ribo Profile kit from Illumina. Briefly, cells were treated with cycloheximide, then the ribosome protected fragments were generated by Nuclease digestion. Ribo-Zero Gold kit (Illumina) was used to remove rRNA. The purified RPF and fragmented input RNA samples were subjected to end repair, 3′ adaptor ligation, reverse transcription, cDNA circularization and library amplification following the manufacturer’s instructions.
Ribo-Seq data analysis
Adapter sequences were trimmed and low quality sequences (Q30) were discarded using trim_galore (https://www.bioinformatics.babraham.ac.uk/projects/trim_galore). The sequences with length at less 25 nt were further aligned to mouse rRNA and tRNA sequence index constructed from Ensembl (Release 91) (https://useast.ensembl.org/Mus_musculus/Info/Index) and GtRNAdb databases (Chan and Lowe, 2016), respectively. The remaining reads were aligned to the UCSC canonical known gene transcripts of the mouse reference genome (mm10) using Bowtie (Langmead et al., 2009) with a maximum one mismatch allowed. The uniquely mapped reads with mapping quality ≥ 20 were used for further analysis.
For codon occupancy analysis, 28-31 nt reads translated in the 0-frame of CDS were used to infer the A site codon with an offset of 15 nt from 5′ end of the read (Nedialkova and Leidel, 2015). The footprinting reads mapped in the first 15 codon of CDS were not taken into account to exclude the influence of sample preparation. The codon occupancy of an A-site was normalized by its basal occupancy which is computed as the average codon occupancy of these sites in +1, +2 and +3 positions downstream of the A site (Nedialkova and Leidel, 2015).
For ribosome occupancy analysis, the translation efficiency (TE) was calculated by dividing the CDS footprinting abundancy (excluding the starting 15 codons) by its mRNA abundancy. The genes with 1.5 fold change of TE were considered as the differential translation genes (Zinshteyn and Gilbert, 2013).
tRNA, tRNA-IP and Alkb treated tRNA sequencing data analysis
The mouse tRNA sequences (mm10) were downloaded from GtRNAdb database (Chan and Lowe, 2016). The microRNA sequences and other small non-coding RNA sequences (such as snRNA, snoRNA and rRNA) were retrieved from miRBase database (Release 21) (http://www.mirbase.org/) and Ensembl noncoding database (Release 91) (https://useast.ensembl.org/Mus_musculus/Info/Index), respectively. The mRNA and long noncoding RNA sequences were downloaded from RefSeq database and NONCODE database (Version 5, http://www.noncode.org), respectively. To further process the tRNA sequence, the sequences containing the tRNA genes and 100 bp at both upstream and downstream of tRNA genes were extracted for precursor tRNA genes. For mature tRNA sequences, the introns were removed and “CCA” was added to the 3′-end of the tRNA gene sequences.
After adaptor trimming and low quality filtering (Q30), the clean sequencing data were first mapped to the tRNA sequences using Bowtie2 (http://bowtie-bio.sourceforge.net). Then read count for each tRNA was calculated using the method in (Cozen et al., 2015). The read counts of tRNA are then normalized as reads per million (RPM) by the total number of small RNA reads that are matched to tRNAs in each sample. For sequence mapping statistic plots, the clean reads were mapped to different types of RNA libraries with the orders: tRNA, miRNA, snRNA, snoRNA, rRNA, other sncRNA, mRNA and long non-coding RNAs. The non-mapped reads were lastly mapped to mouse reference genome (mm10).
RNA-Seq expression analysis of ESC differentiation
For RNA-Seq data of ESC differentiation samples (D0, D6) with METTL1 Knockdown, each time point has two replicates. After adapter trimming and low quality sequence filtering (Q30), the clean reads were mapped to mouse reference genome (mm10) using Tophat2 (Kim et al., 2013). The raw counts of reads mapping to the GENCODE genes (v19) (Harrow et al., 2012) were computed by HTSeq with ‘union’ overlap mode (Anders et al., 2015). The raw counts were then normalized as Reads per kilo base per million mapped reads (RPKM) using edegR (Robinson et al., 2010). The genes with 1.5 fold change and FDR < 0.05 were considered as the differential expressed genes.
tRNA chemical sequencing data analysis
For tRNA chemical sequencing data, clean reads were mapped to the mouse mature tRNA sequences generated previously using Bowtie with a maximum of two mismatches allowed (Langmead et al., 2009). The alignments were then processed to record the read depth of each site and the number of reads staring at that position using Bedtools (http://bedtools.readthedocs.io). We defined the cleavage ratio of site i as the ratio between the number of reads starting at site i and the read depth of site i (Schwartz et al., 2014). Then, the cleavage score of site was calculated as:
The positions with a cleavage score > 6 and the cleavage ratio > 0.1 in both samples were considered as the candidate m7G sites.
Gene Ontology and Disease Ontology analysis
Gene Ontology and Disease Ontology analysis of differential expressed genes and differential translation genes were conducted using the ToppFunn module of the ToppGene Suite (http://toppgene.cchmc.org/enrichment.jsp). The ontology terms with Benjamini Hochberg adjusted P-value (FDR) < 0.05 were considered as significantly enriched.
QUANTIFICATION AND STATISTICAL ANALYSIS
Quantification and statistical analysis methods were described in individual method sections and Figure legends.
DATA AND SOFTWARE AVAILABILITY
Data Resource
The RNA-seq, m7G MeRIP-Seq and TRAC-Seq data have been deposited at GEO: GSE112670.
Supplementary Material
Table S1 (Related to Figure 1): m7G tRNA MeRIP-Seq data
Table S2 (Related to Figure 4): Ribosome profiling data in WT and Mettl1 KO ESCs
Table S3 (Related to Figure 5): RNA-seq data in WT and Mettl1 KO ESCs
Table S4 (Related to Figure 6): RNA-seq data in WT and Mettl1 KO (Day 6) EBs
Highlights.
Develop MeRIP-Seq and TRAC-Seq for mapping of m7G modification
Reveal the m7G tRNA methylome in mammalian cells at single nucleotide resolution
Mettl1/Wdr4-mediated m7G tRNA methylome is required for normal mRNA translation
Mettl1/Wdr4-mediated m7G tRNA methylome regulates ESC self-renewal and differentiation
Acknowledgments
We thank Ronald Mathieu (Boston Children’s Hospital) for help with flow cytometry analysis. SL was supported by a Damon Runyon-Sohn Pediatric Fellowship from Damon Runyon Cancer Research Foundation (DRSG-7–13) and a Young Investigator grant from Alex’s Lemonade Stand Foundation. RIG was supported by grants from the US National Institute of General Medical Sciences (NIGMS) (R01GM086386) and National Cancer Institute (NCI) (R01CA211328).
Footnotes
Publisher's Disclaimer: This is a PDF file of an unedited manuscript that has been accepted for publication. As a service to our customers we are providing this early version of the manuscript. The manuscript will undergo copyediting, typesetting, and review of the resulting proof before it is published in its final citable form. Please note that during the production process errors may be discovered which could affect the content, and all legal disclaimers that apply to the journal pertain.
AUTHOR CONTRIBUTIONS
SL designed and performed most of the experiments. QL performed most of the bioinformatics analysis with input from SL. VSL optimized the RNA chemical reduction and cleavage conditions. VSL and JWS helped conceive of the RNA cleavage and sequencing method. JC performed the polysome profiling assay. JWS and RIG designed and supervised the project. SL, QL and RIG wrote the paper with input from other authors.
DECLARATION OF INTERESTS
The authors declare no competing interests
References
- Alexandrov A, Chernyakov I, Gu W, Hiley SL, Hughes TR, Grayhack EJ, Phizicky EM. Rapid tRNA decay can result from lack of nonessential modifications. Molecular cell. 2006;21:87–96. doi: 10.1016/j.molcel.2005.10.036. [DOI] [PubMed] [Google Scholar]
- Alexandrov A, Grayhack EJ, Phizicky EM. tRNA m7G methyltransferase Trm8p/Trm82p: evidence linking activity to a growth phenotype and implicating Trm82p in maintaining levels of active Trm8p. Rna. 2005;11:821–830. doi: 10.1261/rna.2030705. [DOI] [PMC free article] [PubMed] [Google Scholar]
- Alexandrov A, Martzen MR, Phizicky EM. Two proteins that form a complex are required for 7- methylguanosine modification of yeast tRNA. Rna. 2002;8:1253–1266. doi: 10.1017/s1355838202024019. [DOI] [PMC free article] [PubMed] [Google Scholar]
- Anders S, Pyl PT, Huber W. HTSeq–a Python framework to work with high-throughput sequencing data. Bioinformatics. 2015;31:166–169. doi: 10.1093/bioinformatics/btu638. [DOI] [PMC free article] [PubMed] [Google Scholar]
- Barbieri I, Tzelepis K, Pandolfini L, Shi J, Millan-Zambrano G, Robson SC, Aspris D, Migliori V, Bannister AJ, Han N, et al. Promoter-bound METTL3 maintains myeloid leukaemia by m(6)A- dependent translation control. Nature. 2017;552:126–131. doi: 10.1038/nature24678. [DOI] [PMC free article] [PubMed] [Google Scholar]
- Cartlidge RA, Knebel A, Peggie M, Alexandrov A, Phizicky EM, Cohen P. The tRNA methylase METTL1 is phosphorylated and inactivated by PKB and RSK in vitro and in cells. The EMBO journal. 2005;24:1696–1705. doi: 10.1038/sj.emboj.7600648. [DOI] [PMC free article] [PubMed] [Google Scholar]
- Chan PP, Lowe TM. GtRNAdb 2.0: an expanded database of transfer RNA genes identified in complete and draft genomes. Nucleic acids research. 2016;44:D184–189. doi: 10.1093/nar/gkv1309. [DOI] [PMC free article] [PubMed] [Google Scholar]
- Chou HJ, Donnard E, Gustafsson HT, Garber M, Rando OJ. Transcriptome-wide Analysis of Roles for tRNA Modifications in Translational Regulation. Molecular cell. 2017;68:978–992 e974. doi: 10.1016/j.molcel.2017.11.002. [DOI] [PMC free article] [PubMed] [Google Scholar]
- Cong L, Ran FA, Cox D, Lin S, Barretto R, Habib N, Hsu PD, Wu X, Jiang W, Marraffini LA, et al. Multiplex genome engineering using CRISPR/Cas systems. Science. 2013;339:819–823. doi: 10.1126/science.1231143. [DOI] [PMC free article] [PubMed] [Google Scholar]
- Cozen AE, Quartley E, Holmes AD, Hrabeta-Robinson E, Phizicky EM, Lowe TM. ARM-seq: AlkB-facilitated RNA methylation sequencing reveals a complex landscape of modified tRNA fragments. Nature methods. 2015;12:879–884. doi: 10.1038/nmeth.3508. [DOI] [PMC free article] [PubMed] [Google Scholar]
- Dominissini D, Moshitch-Moshkovitz S, Salmon-Divon M, Amariglio N, Rechavi G. Transcriptome-wide mapping of N(6)-methyladenosine by m(6)A-seq based on immunocapturing and massively parallel sequencing. Nature protocols. 2013;8:176–189. doi: 10.1038/nprot.2012.148. [DOI] [PubMed] [Google Scholar]
- Harrow J, Frankish A, Gonzalez JM, Tapanari E, Diekhans M, Kokocinski F, Aken BL, Barrell D, Zadissa A, Searle S, et al. GENCODE: the reference human genome annotation for The ENCODE Project. Genome research. 2012;22:1760–1774. doi: 10.1101/gr.135350.111. [DOI] [PMC free article] [PubMed] [Google Scholar]
- Janssen BD, Diner EJ, Hayes CS. Analysis of aminoacyl- and peptidyl-tRNAs by gel electrophoresis. Methods in molecular biology. 2012;905:291–309. doi: 10.1007/978-1-61779-949-5_19. [DOI] [PMC free article] [PubMed] [Google Scholar]
- Jovine L, Djordjevic S, Rhodes D. The crystal structure of yeast phenylalanine tRNA at 2.0 A resolution: cleavage by Mg(2+) in 15-year old crystals. J Mol Biol. 2000;301:401–414. doi: 10.1006/jmbi.2000.3950. [DOI] [PubMed] [Google Scholar]
- Kim D, Pertea G, Trapnell C, Pimentel H, Kelley R, Salzberg SL. TopHat2: accurate alignment of transcriptomes in the presence of insertions, deletions and gene fusions. Genome biology. 2013;14:R36. doi: 10.1186/gb-2013-14-4-r36. [DOI] [PMC free article] [PubMed] [Google Scholar]
- Kirchner S, Ignatova Z. Emerging roles of tRNA in adaptive translation, signalling dynamics and disease. Nature reviews Genetics. 2015;16:98–112. doi: 10.1038/nrg3861. [DOI] [PubMed] [Google Scholar]
- Kohrer C, Rajbhandary UL. The many applications of acid urea polyacrylamide gel electrophoresis to studies of tRNAs and aminoacyl-tRNA synthetases. Methods. 2008;44:129–138. doi: 10.1016/j.ymeth.2007.10.006. [DOI] [PMC free article] [PubMed] [Google Scholar]
- Langmead B, Trapnell C, Pop M, Salzberg SL. Ultrafast and memory-efficient alignment of short DNA sequences to the human genome. Genome biology. 2009;10:R25. doi: 10.1186/gb-2009-10-3-r25. [DOI] [PMC free article] [PubMed] [Google Scholar]
- Leulliot N, Chaillet M, Durand D, Ulryck N, Blondeau K, van Tilbeurgh H. Structure of the yeast tRNA m7G methylation complex. Structure. 2008;16:52–61. doi: 10.1016/j.str.2007.10.025. [DOI] [PubMed] [Google Scholar]
- Lin S, Choe J, Du P, Triboulet R, Gregory RI. The m(6)A Methyltransferase METTL3 Promotes Translation in Human Cancer Cells. Molecular cell. 2016;62:335–345. doi: 10.1016/j.molcel.2016.03.021. [DOI] [PMC free article] [PubMed] [Google Scholar]
- Lin S, Gregory RI. Identification of small molecule inhibitors of Zcchc11 TUTase activity. RNA biology. 2015;12:792–800. doi: 10.1080/15476286.2015.1058478. [DOI] [PMC free article] [PubMed] [Google Scholar]
- Liu F, Clark W, Luo G, Wang X, Fu Y, Wei J, Wang X, Hao Z, Dai Q, Zheng G, et al. ALKBH1- Mediated tRNA Demethylation Regulates Translation. Cell. 2016;167:816–828 e816. doi: 10.1016/j.cell.2016.09.038. [DOI] [PMC free article] [PubMed] [Google Scholar]
- Michaud J, Kudoh J, Berry A, Bonne-Tamir B, Lalioti MD, Rossier C, Shibuya K, Kawasaki K, Asakawa S, Minoshima S, et al. Isolation and characterization of a human chromosome 21q22.3 gene (WDR4) and its mouse homologue that code for a WD-repeat protein. Genomics. 2000;68:71–79. doi: 10.1006/geno.2000.6258. [DOI] [PubMed] [Google Scholar]
- Nedialkova DD, Leidel SA. Optimization of Codon Translation Rates via tRNA Modifications Maintains Proteome Integrity. Cell. 2015;161:1606–1618. doi: 10.1016/j.cell.2015.05.022. [DOI] [PMC free article] [PubMed] [Google Scholar]
- Okamoto M, Fujiwara M, Hori M, Okada K, Yazama F, Konishi H, Xiao Y, Qi G, Shimamoto F, Ota T, et al. tRNA modifying enzymes, NSUN2 and METTL1, determine sensitivity to 5-fluorouracil in HeLa cells. PLoS genetics. 2014;10:e1004639. doi: 10.1371/journal.pgen.1004639. [DOI] [PMC free article] [PubMed] [Google Scholar]
- Pereira PL, Magnol L, Sahun I, Brault V, Duchon A, Prandini P, Gruart A, Bizot JC, Chadefaux-Vekemans B, Deutsch S, et al. A new mouse model for the trisomy of the Abcg1-U2af1 region reveals the complexity of the combinatorial genetic code of down syndrome. Hum Mol Genet. 2009;18:4756–4769. doi: 10.1093/hmg/ddp438. [DOI] [PMC free article] [PubMed] [Google Scholar]
- Phizicky EM, Alfonzo JD. Do all modifications benefit all tRNAs? FEBS letters. 2010;584:265–271. doi: 10.1016/j.febslet.2009.11.049. [DOI] [PMC free article] [PubMed] [Google Scholar]
- Robinson MD, McCarthy DJ, Smyth GK. edgeR: a Bioconductor package for differential expression analysis of digital gene expression data. Bioinformatics. 2010;26:139–140. doi: 10.1093/bioinformatics/btp616. [DOI] [PMC free article] [PubMed] [Google Scholar]
- Schwartz S, Bernstein DA, Mumbach MR, Jovanovic M, Herbst RH, Leon-Ricardo BX, Engreitz JM, Guttman M, Satija R, Lander ES, et al. Transcriptome-wide mapping reveals widespread dynamic- regulated pseudouridylation of ncRNA and mRNA. Cell. 2014;159:148–162. doi: 10.1016/j.cell.2014.08.028. [DOI] [PMC free article] [PubMed] [Google Scholar]
- Shaheen R, Abdel-Salam GM, Guy MP, Alomar R, Abdel-Hamid MS, Afifi HH, Ismail SI, Emam BA, Phizicky EM, Alkuraya FS. Mutation in WDR4 impairs tRNA m(7)G46 methylation and causes a distinct form of microcephalic primordial dwarfism. Genome biology. 2015;16:210. doi: 10.1186/s13059-015-0779-x. [DOI] [PMC free article] [PubMed] [Google Scholar]
- Sprinzl M, Horn C, Brown M, Ioudovitch A, Steinberg S. Compilation of tRNA sequences and sequences of tRNA genes. Nucleic Acids Res. 1998;26:148–153. doi: 10.1093/nar/26.1.148. [DOI] [PMC free article] [PubMed] [Google Scholar]
- Torres AG, Batlle E, Ribas de Pouplana L. Role of tRNA modifications in human diseases. Trends in molecular medicine. 2014;20:306–314. doi: 10.1016/j.molmed.2014.01.008. [DOI] [PubMed] [Google Scholar]
- Trimouille A, Lasseaux E, Barat P, Deiller C, Drunat S, Rooryck C, Arveiler B, Lacombe D. Further delineation of the phenotype caused by biallelic variants in the WDR4 gene. Clinical genetics. 2018;93:374–377. doi: 10.1111/cge.13074. [DOI] [PubMed] [Google Scholar]
- Wintermeyer W, Zachau HG. Tertiary structure interactions of 7-methylguanosine in yeast tRNA Phe as studied by borohydride reduction. FEBS letters. 1975;58:306–309. doi: 10.1016/0014-5793(75)80285-7. [DOI] [PubMed] [Google Scholar]
- Ying QL, Stavridis M, Griffiths D, Li M, Smith A. Conversion of embryonic stem cells into neuroectodermal precursors in adherent monoculture. Nature biotechnology. 2003;21:183–186. doi: 10.1038/nbt780. [DOI] [PubMed] [Google Scholar]
- Zhao BS, Roundtree IA, He C. Post-transcriptional gene regulation by mRNA modifications. Nature reviews Molecular cell biology. 2017;18:31–42. doi: 10.1038/nrm.2016.132. [DOI] [PMC free article] [PubMed] [Google Scholar]
- Zheng G, Qin Y, Clark WC, Dai Q, Yi C, He C, Lambowitz AM, Pan T. Efficient and quantitative high-throughput tRNA sequencing. Nature methods. 2015;12:835–837. doi: 10.1038/nmeth.3478. [DOI] [PMC free article] [PubMed] [Google Scholar]
- Zinshteyn B, Gilbert WV. Loss of a conserved tRNA anticodon modification perturbs cellular signaling. PLoS genetics. 2013;9:e1003675. doi: 10.1371/journal.pgen.1003675. [DOI] [PMC free article] [PubMed] [Google Scholar]
- Zueva VS, Mankin AS, Bogdanov AA, Baratova LA. Specific fragmentation of tRNA and rRNA at a 7-methylguanine residue in the presence of methylated carrier RNA. European journal of biochemistry. 1985;146:679–687. doi: 10.1111/j.1432-1033.1985.tb08704.x. [DOI] [PubMed] [Google Scholar]
Associated Data
This section collects any data citations, data availability statements, or supplementary materials included in this article.
Supplementary Materials
Table S1 (Related to Figure 1): m7G tRNA MeRIP-Seq data
Table S2 (Related to Figure 4): Ribosome profiling data in WT and Mettl1 KO ESCs
Table S3 (Related to Figure 5): RNA-seq data in WT and Mettl1 KO ESCs
Table S4 (Related to Figure 6): RNA-seq data in WT and Mettl1 KO (Day 6) EBs