

Summary
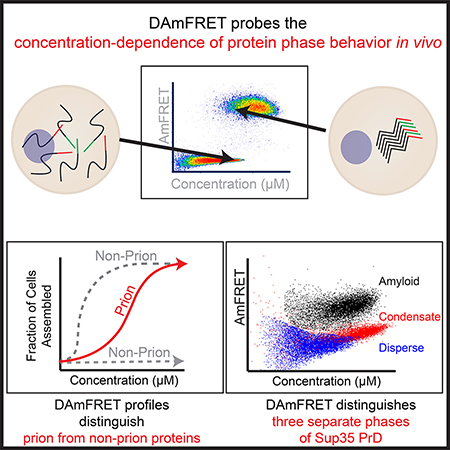
Protein self-assemblies modulate protein activities over biological time scales that can exceed the lifetimes of the proteins or even the cells that harbor them. We hypothesized that these time scales relate to kinetic barriers inherent to the nucleation of ordered phases. To investigate nucleation barriers in living cells, we developed Distributed Amphifluoric FRET (DAmFRET). DAmFRET exploits a photoconvertible fluorophore, heterogeneous expression, and large cell numbers to quantify via flow cytometry the extent of a protein’s self-assembly as a function of cellular concentration. We show that kinetic barriers limit the nucleation of ordered self-assemblies, and that the persistence of the barriers with respect to concentration relates to structure. Supersaturation resulting from sequence-encoded nucleation barriers gave rise to prion behavior, and enabled a prion-forming protein, Sup35 PrD, to partition into dynamic intracellular condensates or to form toxic aggregates. Our results suggest that nucleation barriers govern cytoplasmic inheritance, subcellular organization, and proteotoxicity.
Keywords: prions, amyloid, nucleation, phase transition, proteopathy, aggregation
eTOC Blurb
Prion phenomena result from protein phase separations that are rate-limited by nucleation. Here, Khan et al. introduce a method to quantify nucleation in living cells. By comparing diverse proteins with and without prion behavior, they show that the kinetic barrier to nucleation derives from structural order in the new phase.
INTRODUCTION
Ordered protein self-assemblies can transduce biological signals and encode molecular memories, but they also precipitate incurable degenerative diseases like Alzheimer’s, Parkinson’s, and ALS. These phenomena emerge over much longer timescales than those typical either of protein folding or of liquid-liquid phase separation.
At the extreme, remarkable self-assemblies known as prions govern protein activity over multiple generations of the host organism. Prion-forming proteins normally exist as dispersed monomers. But this state is only kinetically stable with respect to a thermodynamically-favored, assembled state (Glover et al., 1997; Tanaka et al., 2006). The assemblies typically take the form of exquisitely ordered quasi-two-dimensional polymers known as amyloids (Eisenberg and Sawaya, 2017; Tycko and Wickner, 2013). Prion assemblies appear spontaneously at very low frequencies, but can be “induced” by transient over-expression of the protein. Once formed, they template the conversion of other molecules of the protein to the same state (Prusiner, 1982; Serio et al., 2000). Should a fragment of the assembly then enter a naive pool of the protein within a foreign cell or organism, it converts them as well. This capability grants prions properties otherwise found only in nucleic acids -- the ability to transmit phenotypes between organisms and across generations.
The many molecular degrees of freedom that must be lost upon ordered self-assembly de novo can render that event, known as nucleation, inherently probabilistic on the molecular scale. The “ nucleation barrier” describes the extent of that improbability. It therefore theoretically determines the fraction of otherwise identical systems that will acquire the assembly spontaneously over a given period of time, as well as how long, on average, any single system will remain free of it. Although nucleation barriers are well-grounded in theory (Kashchiev, 2015; Michaels et al., 2017; Vekilov, 2012), their relevance to complex biological phenomena is underexplored.
To what extent do nucleation barriers govern protein kinetics in biological systems? Quantifying low probability nucleation events under cellular conditions is crucial to answering this question but doing so necessitates probing millions of reaction vessels of microscopic volumes. Existing assays for protein self-assembly rely on the formation of visible puncta or the inactivation of fusion partners (Alberti et al., 2009; Morell et al., 2011; Narayanaswamy et al., 2009; Newby et al., 2017; Noree et al., 2010; Pereira et al., 2018; Ramdzan et al., 2012; Waldo et al., 1999; Zhao et al., 2016). They require restrictive subcellular localization (Sivanathan and Hochschild, 2013), and/or necessitate expression from dual constructs (Arslan et al., 2015; Blakeley et al., 2012; Cabantous et al., 2013; Holmes et al., 2014; Shyu and Hu, 2008). None of these directly inform on nucleation barriers. We developed a facile approach -- DAmFRET -- to do so. DAmFRET measures the frequency of nucleation as a function of protein concentration in living cells. Applying it to diverse proteins, we reveal that sequence-encoded nucleation barriers relate to the structures and functions of self-assemblies. Our findings suggest that nucleation barriers broadly govern supersaturation-dependent protein activities, ranging from prion behavior, to stress-responsive condensation, to proteotoxicity.
RESULTS
Distributed Amphifluoric FRET (DAmFRET) reveals nucleation barriers to self-assembly in the cellular milieu
Self-assemblies differ from their corresponding unassembled polypeptides in one or more critical order parameters. These are both intermolecular (e.g. density and relative orientation) and intramolecular (i.e. conformation) in nature. Nucleation occurs when random fluctuations in those parameters happen to produce a minimal cluster of the polypeptides thermodynamically sufficient for further growth. In sufficiently small systems, the improbability of those fluctuations occurring simultaneously results in a kinetic barrier that can allow soluble proteins to accumulate beyond the minimal -- or “saturating” -- concentration required for growth. Such supersaturated systems go on to nucleate in probabilistic fashion, resulting in a collective bimodal dependence of assembly on concentration.
Detecting nucleation barriers therefore calls for the examination of very large numbers of independent molecular systems over a wide range of concentrations. Compartmentalizing purified proteins into microdroplets is one approach to do so (Ildefonso et al., 2012; Michaels et al., 2017; Peters, 2011). However, it divorces proteins from myriad intracellular factors that influence their structure.
We therefore sought a single-cell reporter of protein self-assembly which could be assessed in large populations of independent cells expressing the protein over a range of concentrations. To achieve this goal, the system would have to: provide single-cell readouts; scale to report on thousands of cells in a population; ensure independence between cells; be manipulable to produce expression over a wide concentration range; provide a sensitive readout of protein expression and cytosolic volume (as required for determining concentration); and work equally well across dozens of different target proteins. We achieved these goals in the creation of Distributed Amphifluoric FRET or DAmFRET (see Fig 1A-C, Method S1 and Method Details).
Figure 1. Distributed Amphifluoric FRET (DAmFRET) reveals nucleation barriers to self-assembly in vivo.
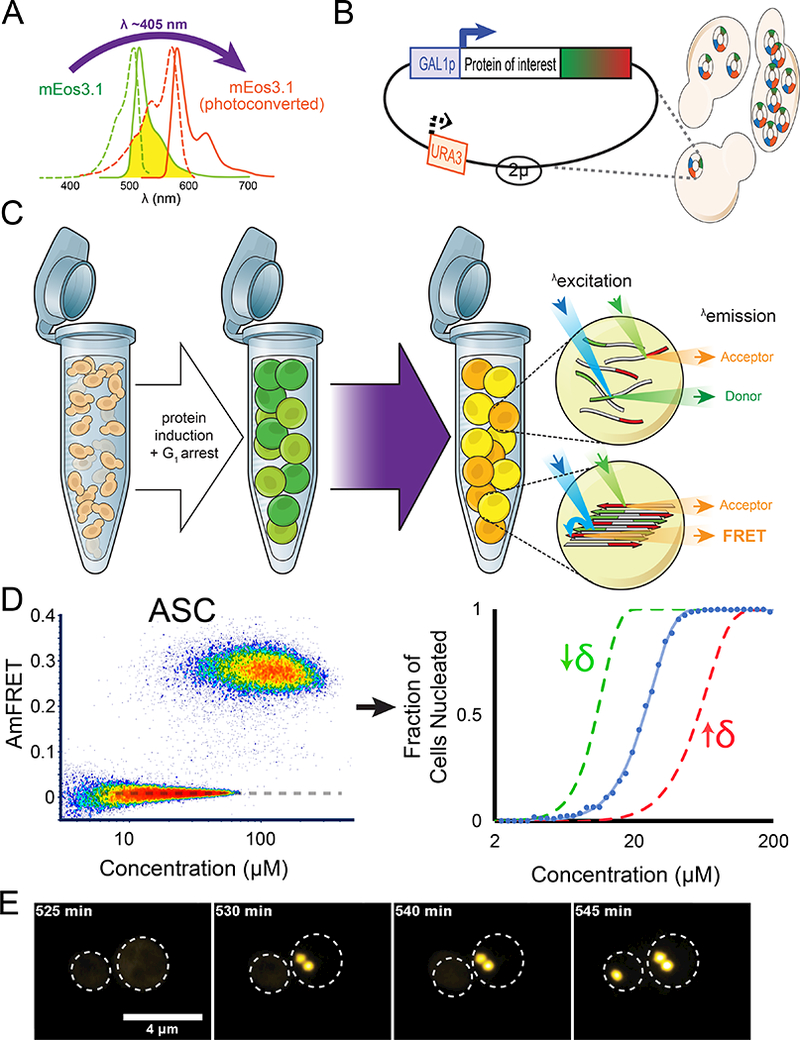
(A) Proteins of interest were tagged to mEos3.1, which is photoconvertible by violet light and in a highly controlled and reproducible manner.
(B) The 2μ-origin of the plasmid, along with strong selection enables variable and high copy numbers in a population of cells. The Gal promoter ensures high concentrations of protein in an inducible manner.
(C) Cells were genetically engineered to undergo cell cycle arrest upon Gal induction, thereby eliminating propagation via cell division and ensuring each nucleation event is an independent one in a de facto closed reaction vessel. Non-collinearity of the 488 nm (in blue) and 561 nm (in green) lasers in the ImageStream®x MkII ensures that direct and sensitized emission (FRET) of the red molecules can be distinguished. See also Method S1.
(D) DAmFRET plot of human ASC. The dashed line approximates the mean AmFRET value of cells expressing fully monomeric protein. The blue curve to the right represents the fit of the DAmFRET plot to a Weibull distribution (see Method Details). The parameter δ relates to the sharpness of the transition and describes the persistence of the low population with respect to concentration. The green and red curves represent hypothetical distributions with values of δ that are lower or higher, respectively, than that of the blue curve.
(E) Montage of cells expressing ASC protein, showing switch-like acquisition of puncta. Images represent sum projection of confocal slices.
To validate DAmFRET, we used the well-characterized human signaling protein, ASC, whose nucleation into a right-handed triple helical polymer confers a digital, all-or-none responsiveness to inflammatory stimuli (Lu et al., 2014). We had previously demonstrated that ASC acquires its physiological polymeric form when expressed in yeast (Cai et al., 2014).
We found that cells expressing ASC-mEos3.1 to low concentrations lacked AmFRET. However, at higher concentrations, a second population emerged with intense AmFRET (Fig. 1D). The two populations were discontinuous yet overlapped on the abscissa, resulting in a strongly bimodal distribution at intermediate concentrations. This discontinuity indicates the existence of discrete phases of the protein, and the overlap indicates that the transition from one phase to the other is not determined solely by concentration on the time scale of our experiment. The transition is therefore also subject to a kinetic barrier, which we attribute to nucleation. Cells expressing mEos3.1 without a fusion partner produced negligible AmFRET even at the highest concentrations measured -- approximately 200 μM (Fig. S1G).
To describe the observed persistence of the nucleation barrier with respect to concentration, we used a single parameter extracted from the data as follows. We gated the distribution into AmFRET-negative and AmFRET-positive cell populations, representing pre- and post-nucleation events, respectively. We fit the fraction of cells in the AmFRET-positive population to a Weibull distribution (Fig. 1D; see also Method Details and Table S1), a simple and purely phenomenological model that has been used to describe nucleation probability as a function of supersaturation (Sear, 2016). The dimensionless Weibull shape parameter describes the sharpness of the transition (Rinne, 2008). We therefore use its reciprocal, designated δ, to report the observed persistence of the nucleation barrier with respect to concentration. The minimum theoretical value of δ, corresponding to self-assembly without a detectable nucleation barrier, is zero. There is no maximum value.
To further validate that overlapping AmFRET results from a nucleation barrier, we tested two additional predictions. 1) If the AmFRET-positive state of ASC is indeed rate-limited by nucleation, then on average, it will occur only once per cell. Absent secondary processes like fragmentation, this must result in a single fluorescent punctum. An analysis of the imaging data revealed that most cells in the top population indeed contained a single intensely fluorescent punctum from which the FRET signal originated (Fig. S1F). Cells in the bottom population contained fully dispersed fluorescence. 2) The absence of cells with intermediate values of AmFRET indicates that the single nucleus grows so rapidly as to achieve steady state near instantaneously. Otherwise, we would observe cells in transition between the lower and upper populations. To evaluate, we recorded the expression level and distribution of ASC over time in multiple individual yeast cells. We found that fluorescence accumulated to high levels in a fully diffuse state. However, in a stochastic fashion for each cell, it then collapsed near- instantaneously into discrete puncta (Movie S1 and Fig. 1E). These kinetics and puncta morphology closely resemble ASC activation in human cells (Cheng et al., 2010). We conclude that DAmFRET accurately reported a kinetic barrier attributable to polymer nucleation.
Amyloid structure determines the persistence of the nucleation barrier with respect to concentration
The extent to which a protein’s structure changes upon assembly must contribute to the barrier to nucleating that assembly. Assemblies of different structure will therefore correspond to different AmFRET distributions.
To evaluate if δ indeed contains information about structure, we required a single protein that can nucleate into structurally distinct self-assembled forms. For this purpose, we chose the prion-determining region (PrD) of the archetypal yeast prion protein, Sup35. Sup35 PrD is unstructured as a monomer (Mukhopadhyay et al., 2007), but forms a spectrum of mutually exclusive amyloid isoforms whose ordered cores incorporate different lengths of the polypeptide backbone (Tanaka et al., 2004). The distribution of isoforms is governed by the prion form of another protein, Rnq1, whose [PIN+high], [PIN+medium], and [PIN+low] isoforms preferentially induce Sup35 amyloids with relatively short, medium, and long ordered cores, respectively (Bradley et al., 2002; Tanaka et al., 2004; Westergard and True, 2014). Sup35 PrD amyloids virtually never nucleate in cells that lack Rnq1 prions ([pin−]). Our hypothesis predicts that a) Sup35 PrD will produce bimodal distributions of cells with discrete populations corresponding to its non-prion and prion ([PSI+]) states; b) the distribution of cells between the two populations will differ between Rnq1 variants; and most specifically c) the δ of those distributions will increase from [PIN+high] to [PIN+medium] to [PIN+low], reflecting the relative amounts of structural order acquired by Sup35 PrD in the resulting amyloid isoforms.
We first verified that Sup35 PrD acquired a high AmFRET state in cells harboring prions of endogenous Sup35 ([PSI+]; Fig. 2A). We next asked if expression of Sup35 PrD in the absence of Sup35 prions produced bimodal DAmFRET, as anticipated for prion nucleation de novo. It did (Fig. 2B). To verify that these high AmFRET cells, specifically, contained prions, we employed an orthogonal reporter of endogenous Sup35 activity (Osherovich et al., 2004). We used fluorescence-activated cell sorting (FACS) to isolate AmFRET-positive and AmFRET-negative cells expressing the same amount of Sup35 PrD, and then plated them to media that repressed its expression. The resulting colonies from cells in the lower population contained fully active Sup35, whereas colonies from cells in the upper population contained partially inactivated Sup35 (Fig. 2C), demonstrating that the AmFRET-positive population contained independently nucleated self-perpetuating amyloid isoforms.
Figure 2. Amyloid structure determines the persistence of the nucleation barrier with respect to concentration.
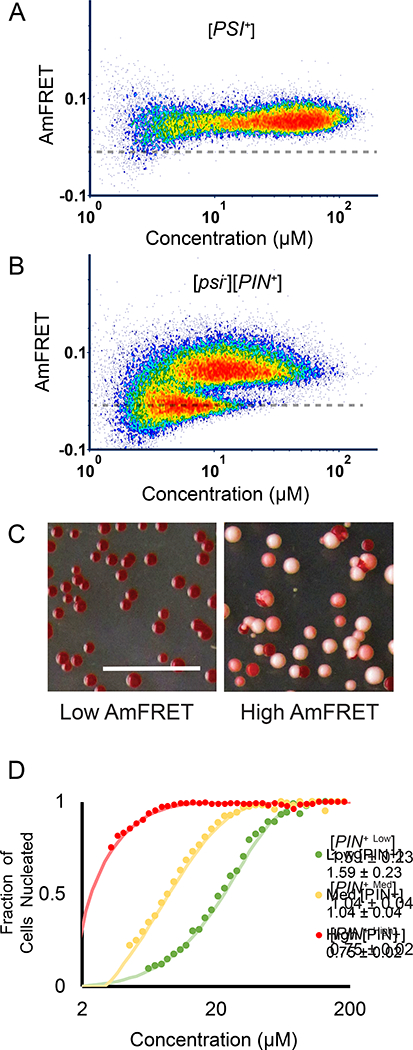
(A) DAmFRET plots of Sup35 PrD in cells with amyloids of endogenous Rnq1 ([PIN+]) and Sup35 ([PSI+]).
(B) Same as (A), but without Sup35 amyloids ([PSI−])
(C) Representative images of colonies of cells from Sup35 colony color assay. Left and right panels show colonies grown from cells sorted from the low or high AmFRET populations, respectively, as shown in figure 2B.
(D) Weibull fits of DAmFRET of Sup35 PrD in cells with different amyloid isoforms of endogenous Rnq1: [PIN+high], [PIN+medium], and [PIN+low]. The inset shows δ ± error. See also Fig. S2.
We then proceeded to acquire DAmFRET for Sup35 PrD in the presence of endogenous Rnq1 amyloid isoforms. Exactly as predicted, δ increased from [PIN+high] to [PIN+medium] to [PIN+low] (Fig. 2D, S2). [pin’] cells were entirely unable to populate the high AmFRET state, suggesting that Sup35 PrD sans conformational template supersaturates to a depth that exceeds the sensitivity of DAmFRET. We conclude that δ correlates with conformational ordering in amyloid isoforms.
Nucleation barriers govern prion behavior
What determines whether a protein can or cannot be a prion? Current analyses use biochemical, cytological, and phenotypic indicators of amyloid, puncta, or protein inactivation, respectively. All well-characterized prions form amyloids, but so do many non-prion proteins. We studied multiple proteins that share Sup35 PrD’s characteristic low complexity and “prion-like” enrichment for polar, uncharged residues. These included PrDs from multiple other yeast prion proteins: Ure2, Rnq1, Swi1, Mot3, and Cyc8, as well as the prion-like regions (PrL) of the yeast proteins Ngr1 and Sla1. The latter two had previously been determined using cytologic, biochemical, and genetic assays to form non-prion amyloid (Ngr1) or non-amyloid (Sla1) aggregates in yeast (Alberti et al., 2009; Sun et al., 2015). Direct examination of our imaging data revealed puncta within AmFRET-positive cells for all seven of these proteins (Fig. S3 A and B).
DAmFRET revealed that all of the amyloid-forming proteins exhibited bimodality (Fig. S3C), although with dramatically different δ values that recapitulated their known prion-forming tendencies (Fig. 3A). For example, the nucleation barrier for Cyc8 PrD was more resistant to concentration increases than that of Mot3 PrD and Rnq1; the latter two proteins spontaneously form prions much more frequently than the former (Holmes et al., 2013; Liebman and Chernoff, 2012; Patel et al., 2009).
Figure 3: Nucleation barriers govern prion behavior.
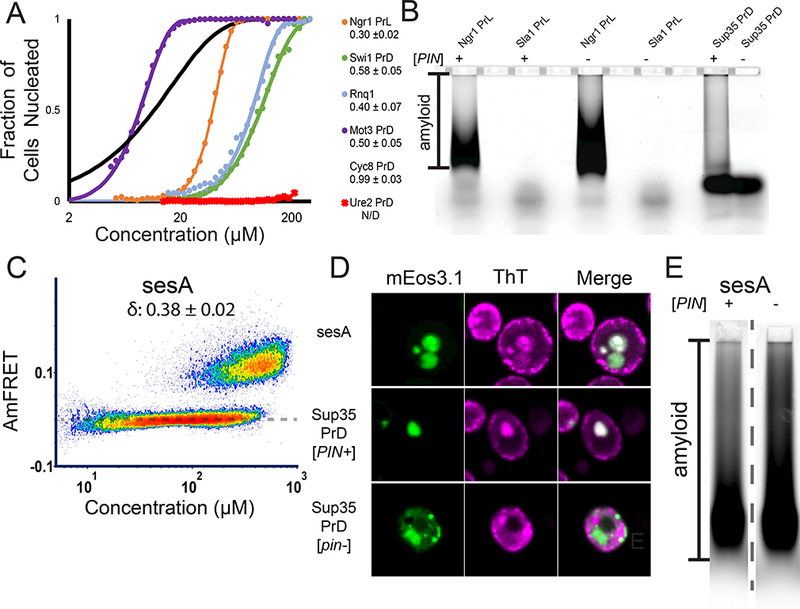
(A) Fits of DAmFRET of known amyloid-forming yeast polypeptides that exhibit bimodal distributions. The inset shows δ ± error. All fits are of [PIN+] cells, except for Rnq1. See also Fig. S3 A, B.
(B)SDD-AGE of Ngr1 PrL and Sla1 PrL in [PIN+] or [pin−] cells. Alternate lanes were intentionally left blank. See also Fig. S3C.
(C) DAmFRET of sesA, showing a bimodal distribution characteristic of prions.
(D) Representative images of ThT-stained cells expressing sesA, positive control Sup35 PrD in [PIN+] and negative control Sup35 PrD in [pin−].
(E) SDD-AGE of sesA in [PIN+] and [pin−] cells. The dashed line indicates the two adjacent lanesshown are spliced from different positions in the gel. See also Fig. S3D.
Sla1 PrL acquired AmFRET in an entirely concentration-dependent manner with a virtually nonexistent δ. That it lacked a detectable nucleation barrier suggests its assemblies are disordered. Finally, Ngr1 PrL had a smaller δ than all of the PrDs (Fig. 3A). Hence, the low prion propensity of Ngr1 PrL results not from an inability to form amyloids, but rather, an inability to not form amyloids when supersaturated. In other words, cells expressing it do not appreciably populate a “[prion−]” state. Finally, to validate our interpretations, we stained live cells with thioflavin T (ThT) (Biancalana and Koide, 2010); and separately subjected the lysates to Semi-Denaturing Detergent Agarose Gel Electrophoresis (SDD-AGE). Corroborating DAmFRET, cells expressing Ngr1 PrL contained ThT-positive foci and SDS- and sarkosyl-resistant polymers, whereas cells expressing Sla1 PrL contained ThT-negative foci and lacked detergent-resistant polymers (Fig. 3B and S3B).
A prion, thus, only exists with respect to a metastable, non-prion state of the same protein. Otherwise the defining activity of prions -- transmission -- could not occur. We therefore submit that δ, parameterized by DAmFRET, is presently the single most informative descriptor of prion behavior at the cellular level.
Having successfully distinguished known prion from non-prion phase behavior, we next used DAmFRET for de novo prion discovery. The cytoplasmically inherited σ element of the filamentous fungus, Nectria haematococca, has been implicated by genetic and bioinformatic evidence as a prion of the sesA protein (Daskalov et al., 2012; Graziani et al., 2004). This prediction has not yet been tested. We therefore characterized sesA by DAmFRET. As a control for prion behavior by the same functional class of fungal prion proteins, we included the PrD of HET-s and its hypomorphic mutant W287A (Daskalov et al., 2014). Yeast cells expressing sesA or the WT HET-s PrD robustly partitioned into overlapping low and high AmFRET populations, exactly as shown for other prions (Fig. 3C, S3D). In contrast, much fewer cells expressing W287A HET-s PrD populated a high AmFRET state. Investigating further, we found that sesA formed ThT-positive puncta and detergent-resistant assemblies, as did the control protein, Sup35 PrD, when expressed in [PIN+] cells but not in [pin−] cells (Fig. 3B, D and E). In total, these data confirm an inherent capability of sesA to drive mutually exclusive cellular states through nucleation-limited amyloid formation, strongly suggesting that it is the protein determinant of σ.
Nucleation barriers govern amyloid “cross-seeding”
Amyloids of one protein can increase amyloid formation by other proteins. Rnq1 prions, for example, enable the formation of Sup35 and Ure2 prions (Derkatch et al., 2001). The extent to which other prion proteins share this dependence, and its molecular underpinnings, remain unclear.
To clarify, we compared DAmFRET data for prion-like proteins in the presence ([PIN+]) and absence ([pin−]) of endogenous amyloid templates (Fig. S3A). Nucleation by Sup35 and Ure2 PrDs was undetectable in [pin−] cells, as expected. Swi1 PrD similarly depended on [PIN+], while Mot3 PrD exhibited a much less pronounced dependence, again as expected (Alberti et al., 2009). Exceptionally low δ values appeared to preclude any influence of [PIN+] on nucleation. The ability to be templated by [PIN+] was unique to prion-forming proteins, as the two non-prion forming proteins nucleated independently of this factor, regardless of whether they formed amyloid (Ngr1 PrL) or non-amyloid (Sla1 PrL) assemblies.
A large nucleation barrier allows the archetypal prion protein, Sup35 PrD, to partition into physiological mRNP condensates
The apparent absolute dependence of Sup35 PrD amyloid nucleation on [PIN+], a cellular factor that does not exist in most cells (Halfmann et al., 2012), suggests that the amyloid state of Sup35 is unlikely to be physiological.
Many low complexity sequences have been found to undergo liquid-liquid phase separation that compartmentalizes protein activities in the cell (reviewed in (Banani et al., 2017; Halfmann, 2016; Shin and Brangwynne, 2017). The molecular interactions in liquids are much weaker than those in amyloids; hence liquid-liquid phase separation generally only occurs at concentrations that are supersaturating with respect to amyloid formation (Halfmann, 2016; Vekilov, 2012). We reasoned therefore that Sup35’s endogenous existence at supersaturating concentrations (Tanaka et al., 2006) -- and concomitantly its ability to form prions -- implies a physiological propensity for liquid-liquid phase separation.
We noticed that [pin−] cells expressing Sup35 PrD to high concentrations exhibited slightly increased AmFRET versus cells expressing the fluorophore alone (Fig. 4A, S4A), which prompted us to take a closer look at the protein’s localization in the cells. We found that the AmFRET arose from small puncta in the cytosol. Some of these were larger than the resolution of our microscope (up to ~600 nm), allowing us to assess morphology (Fig. 4B-left). They were spherical (aspect ratio of 1.18 ± 0.02, n = 13). Amyloid puncta (in [PIN+] cells), in contrast, were highly aspherical (Fig. 4B-right).
Figure 4. A large nucleation barrier allows the archetypal prion protein, Sup35 PrD, to partition into physiological mRNP condensates.
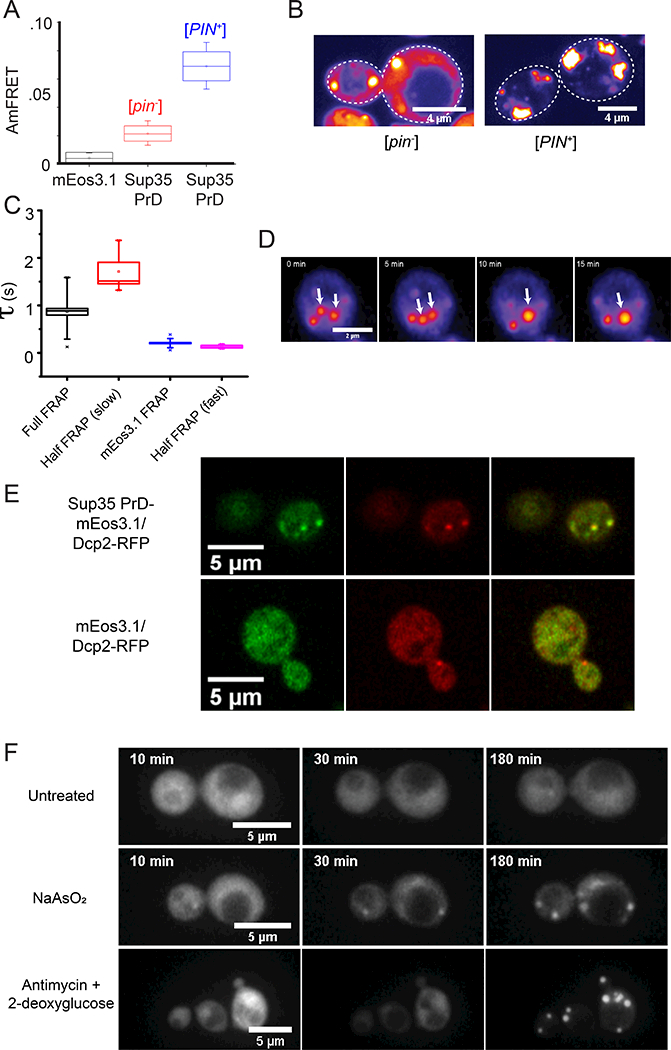
(A) Box-Whisker plot showing mean AmFRET of Sup35 PrD. The box is the SD of the mean, and the whiskers are the 5th and 95th percentiles of AmFRET values, for more than 2000 cells expressing between 80 and 200 μM of either unfused mEos3.1 (black) or Sup35 PrD in [pin−] (red) or [PIN+] cells (blue). See also Fig. S4A.
(B) Representative confocal images of Sup35 PrD puncta in [pin−] (left) or [PIN+] cells (right).
(C) Fluorescence recovery timescales of Sup35 PrD puncta in [pin−] cells as measured by FRAP. Error bars represent SD.
(D) Time-lapse microscopy showing coalescence of Sup35 PrD puncta. Single confocal slice of a [pin−] cell expressing Sup35 PrD, showing two puncta (white arrows from 0–5 min) coalesce into one larger punctum (single arrow from 10 min). See also Fig. S4B.
(E) Images of single confocal slices of cells co-expressing Sup35 PrD fused with mEos3.1 (and unfused mEos3.1 as control) and RFP-fused Dcp2 at 100X magnification.
(F) Montage of cells expressing Sup35 PrD showing the formation of liquid droplets upon treatment with NaAsO2 (middle row) or antimycin + 2-deoxyglucose (bottom), versus untreated cells (top). See also Movies S2–4.
We used half-FRAP measurements to probe the internal dynamics of the spherical puncta. The half-FRAP recovery curves fit to a two-component exponential, corresponding to recovery times of 0.275 ± 0.110 s and 1.710 ± 0.197 s for fast and slow components, comprising 9 ± 2 % and 28 ± 4 % of the recovery, respectively. The fast component approached that of cytosolic diffusion, 0.212 ± 0.008 s, as determined from cells expressing unfused mEos3.1. The slow component resembled that of whole punctum FRAP performed in the same cells, which yielded a recovery time of 0.864 ± 0.069 s. These data indicate that Sup35 PrD molecules diffuse almost as rapidly inside the puncta as they do in the bulk cytosol, but exchange relatively slowly across the interface between the two phases (Fig. 4C).
To further explore the nature of the Sup35 PrD puncta, we recorded their dynamics in living cells. The puncta were highly mobile. We observed two puncta within a cell coalescing into a larger punctum (Fig. 4D) whose fluorescence intensity exactly matched the sum of its precursor puncta (Fig. S4B). Note that the precursor puncta were significantly larger than the resolution of our microscope (diameters 410 nm and 500 nm). As a result, non-liquid contact between them would result in an elongated (aspherical) punctum. However, the coalesced punctum was instead spherical (aspect ratio 1.04, diameter = 490 nm). We conclude that Sup35 PrD partitions into liquid droplets when overexpressed in the absence of pre-existing Rnq1 and Sup35 amyloids.
Sup35’s PrD resembles that of LCSs that facilitate liquid-liquid phase separation by RNA binding proteins in the context of mRNP granules, such as P-bodies and stress granules. Full-length endogenous Sup35 localizes to these structures under heat stress (Grousl et al., 2013), and its PrD can substitute for the compositionally similar region of TIA-1 in targeting that protein to mammalian stress granules (Gilks et al., 2004). We therefore asked if Sup35 PrD droplets are, in fact, mRNP granules, by investigating their colocalization with a marker of both constitutive and stress-induced P-bodies: Dcp2 (Rao and Parker, 2017). We observed that Sup35 PrD-mEos3.1, but not unfused mEos3.1, localized to Dcp2-RFP puncta (Fig. 4E). This finding rationalizes the low, concentration-dependent AmFRET of Sup35 PrD condensates -- Sup35 PrD appears to be partitioning into endogenous condensates of other proteins, such that AmFRET becomes detectable only as it accumulates to high density within them.
To determine if Sup35 PrD phase behavior can be modulated by stress, we performed time-lapse microscopy on cells expressing Sup35 PrD-mEos3.1 exposed to 10 mM arsenite, a potent inducer of mRNP granules (Buchan et al., 2008). This treatment strongly promoted droplet formation (Fig. 4F, Movies S2 and S3). To ensure that this observation was representative of a population of cells, we also quantified the number of cells positive for Sup35 PrD droplets before and after arsenite treatment for 1 hour and found that 30% of the cells (22 out of 72) had droplets in the untreated, while 93% (69 out of 74) did upon arsenite treatment. We then asked if another mRNP granule-inducing stress -- acute energy depletion via cotreatment with 10 μΜ antimycin and 20 mM 2-deoxyglucose (Riback et al., 2017) -- produced the same effect. This condition, also, robustly induced Sup35 PrD droplets (Fig. 4F, Movie S4).
To determine if endogenous Sup35 likewise partitions into non-amyloid assemblies under stress, we imaged chromosomally GFP-tagged full-length endogenous Sup35 by fluorescence microscopy. Neither confocal microscopy nor super-resolution microscopy was able to detect higher-order assembly of Sup35, even under conditions of acute energy depletion or arsenite stress (not shown). Given recent indications that a drop in cytosol pH may broadly underlie stress-induced phase separation (Munder et al., 2016; Riback et al., 2017), including that of full-length Sup35 (Franzmann et al., 2018), we then repeated the experiments under cytosol-acidifying conditions (see Method Details). Still, no visible droplets formed. We reasoned that any assemblies that may exist must therefore be submicroscopic in size (<100 nm). To test for submicroscopic diffusing assemblies, we employed Fluorescence Correlation Spectroscopy (FCS). We found that when unstressed, Sup35 exists in two populations, one comprising rapidly- (τD ~ 0.5 ms) and the other slowly-diffusing (τD > 10 ms) species. Brightness analysis revealed that both populations contained an average of one Sup35-GFP molecule per diffusing particle (Fig. S4C). Given Sup35’s primary function in translation termination, these likely correspond to monomeric and ribosome-engaged molecules, respectively. When stressed by mild cytosol acidification, however, the average brightness of slow-diffusing particles increased two-fold, while the brightness of freely diffusing monomers remained unchanged (see also Fig. S4C). These data indicate that a fraction of Sup35 molecules redistribute into small multimeric species during stress. Likewise, microscopically visible mRNP granules have recently been determined to arise from the accumulation and coalescence of submicroscopic assemblies (Rao and Parker, 2017; Riback et al., 2017; Wheeler et al., 2016; Youn et al., 2018).
Sup35 PrD mutants illuminate nucleation mechanisms in vivo
To explore potential linkages between liquid and amyloid self-assemblies, we compared phase behaviors with and without amyloid templates for a range of Sup35 mutants that have been identified in the literature to modulate Sup35 prion formation.
Two double mutants of the Sup35 PrD, Y46K+Q47K and Q61K+Q62K, had previously been found to be incompatible with certain amyloid isoforms (Bondarev et al., 2013, 2015). We observed that, in [PIN+] cells, these mutants greatly increased δ relative to WT (Fig. 5A, S5A, Table S1). This effect appeared to result, at least in part, from a reduced affinity of the proteins for themselves, as evidenced by a reduction in liquid-droplet associated AmFRET when expressed in the absence of Rnq1 amyloids.
Figure 5. Sup35 PrD mutants illuminate nucleation mechanisms in vivo.
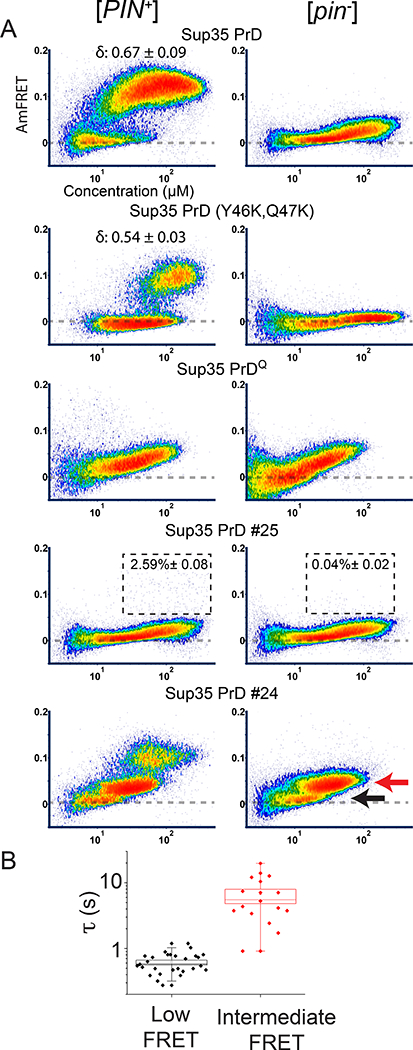
(A) DAmFRET plots of select mutants and scrambled sequence variants (of overall identical amino acid composition) of Sup35 PrD in [PIN+] and [pin−] cells. Boxes in the plots for #25 designate the region considered prion-positive, with the percentage of total cells indicated. See also Fig. S5A. The red and black arrows indicate the “intermediate” and “low” AmFRET populations, respectively, that were sorted for microscopy analyses.
(B) Quantification of fluorescence recovery times after half-puncta photobleaching for low (n = 28 cells) and intermediate AmFRET (n = 18 cells) states of [pin−] cells expressing Sup35 PrD #24. Boxes cover the SE, while the square inside the box shows the mean and the line shows the median. Whiskers delineate the 5th and 95th percentiles. See also Fig. S5 C, D.
We next investigated more extreme changes in sequence. The Sup35 PrD is highly enriched for both glutamine (Q) and asparagine (N) residues. Despite their chemical similarity, the two side chains are not interchangeable with respect to amyloid formation. Replacing all of Sup35 PrD’s Qs with Ns (PrDN) increased prion propensity, while the reciprocal change (replacing all Ns with Qs; PrDQ) eliminated it (Halfmann et al., 2011). As expected, Sup35 PrDN nucleated at lower concentrations than WT (below the sensitivity of DAmFRET; Fig. 5A, S5A).
The reciprocal mutant, PrDQ, produced an intermediate level of AmFRET that increased continuously with concentration (Fig. 5A). This distribution was not influenced by Rnq1 amyloids. Both features suggest non-nucleation-limited self-assembly, as shown above for Sla1 PrL (Fig. 3B, S3A, C). Indeed, ThT-staining and SDD-AGE confirmed an absence of amyloid-like ordered structure (Fig. S5C, D).
To determine if PrDQ could nevertheless be templated to an amyloid state, we repeated DAmFRET in cells containing pre-existing amyloids of endogenous Sup35. Amyloids of a particular isoform ([PSI+strong], but not of [PSI+weak]; Tanaka et al., 2006) increased the AmFRET of PrDQ (Fig. S5B), suggesting that the non-amyloid assemblies of PrDQ are merely kinetically stable with respect to amyloid, and therefore represent “off-pathway” aggregates.
We next analyzed a series of Sup35 PrD variants that contain an identical amino acid composition as the WT protein, but with the order of residues scrambled (Ross et al., 2005). All of the scrambles were previously found to form prions. However, the prions of one of them (#25), were mitotically unstable, a phenotype previously linked to increased thermodynamic stability (Tanaka et al., 2006). Given the dependence of the nucleation barrier on conformational ordering as demonstrated above, we predicted that #25 would exhibit a larger nucleation barrier than all of the other scrambled variants.
DAmFRET confirmed a very low nucleation frequency for #25 (approximately 2% of cells; Fig. 5A). Intriguingly, the protein’s acquisition of the low level of AmFRET attributable to condensation was unperturbed relative to WT, and persisted even in [PIN+] cells (Fig. 5A). This observation suggests that Rnq1 amyloids cross-seed other prion-like sequences through conformational templating, rather than increasing the affinity of the soluble proteins for themselves.
Two of the other scrambles, #21 and #26, populated low and high AmFRET states almost indistinguishably from WT, revealing comparable propensities for condensation and slightly decreased (#21) or increased (#26) propensities for amyloid nucleation (Fig. S5A).
The final analyzed scramble, #24, produced AmFRET distributions unlike any of the other Sup35 constructs. Cells that lacked pre-existing amyloid templates ([pin−]) partitioned into low and intermediate AmFRET populations (Fig. 5A). Cells that contained templates ([PIN+]) also partitioned into these populations, as well as a third population with a high AmFRET level indicative of the prion state.
We next used FACS to isolate low and intermediate AmFRET-containing cells, and characterized the state of #24 in each population using microscopy and FRAP. Rather than multiple small puncta with abundant diffuse fluorescence as we had observed for WT Sup35 PrD, both the low and intermediate AmFRET states of #24 corresponded to a single large punctum with virtually no diffuse fluorescence (Fig. S5C). The internal dynamics of the punctum differed dramatically between the two states: half punctum photobleached fluorescence recovered quickly in the low AmFRET state (albeit not as fast as for WT Sup35 PrD droplets), and very slowly in the intermediate AmFRET state (Fig. 5B). In neither population did the puncta stain robustly with ThT or contain detergent-resistant structure (Fig. S5C, D). Taken together these observations indicate that #24 partitions into a disordered condensate distinct from that of WT Sup35 PrD.
We speculate that the anomalous behavior of #24 could be attributed to an increased affinity of the protein for itself, resulting in larger, denser and more viscous puncta. The protein would be expected to have reduced miscibility with other components in the puncta (e.g. endogenous mRNP proteins). This could lead the protein to demix inside the puncta when expressed to very high levels, resulting in an even more viscous homogeneous phase (the intermediate AmFRET state). Such a multiphasic system has been documented within the liquid-like nucleoli of Xenopus oocytes (Feric et al., 2016).
To summarize, sequence changes to Sup35 PrD impacted amyloid nucleation in three distinct ways. 1) Y46K+Q47K and Q61K+Q62K reduced the affinity of soluble protein for itself, thereby reducing opportunities for productive conformational fluctuations. This is not surprising given the inhibitory effect of net charge on disordered protein self-solvation (Das and Pappu, 2013). 2) Consistent with lack of structure in dynamic condensates, scrambling the sequence of Sup35 PrD generally did not perturb the ability of soluble protein to interact with itself. It did, however, bias conformational fluctuations toward (#26) or away from (#21, #25) amyloid. 3) Finally, variants PrDQ and #24 interfered with nucleation by routing the protein into “off-pathway” kinetically trapped assemblies.
Nucleation barriers enable proteotoxic assemblies to accumulate
Despite their deep association with age-related degenerative disease, amyloids, themselves, are not overtly pathogenic. Rather, pathogenicity has been increasingly attributed to non-amyloid assemblies of the same proteins that are metastable with respect to amyloid (Knowles et al., 2014).
We noticed that Sup35 PrD #24 expressed to lower concentrations than the other variants (Fig. 5A), suggesting they may be poorly tolerated by the cells. We observed the same for a non-amyloid variant, PrDQ, that we previously showed to be proteotoxic (Halfmann et al., 2011). To test if #24 is likewise toxic, we plated serial dilutions of the cells to media that either induced or repressed ectopic protein expression. Variant #24, but none of the other scrambles, suppressed colony formation in [pin−] cells (Fig. 6A).
Figure 6. Nucleation barriers enable proteotoxic assemblies to accumulate.
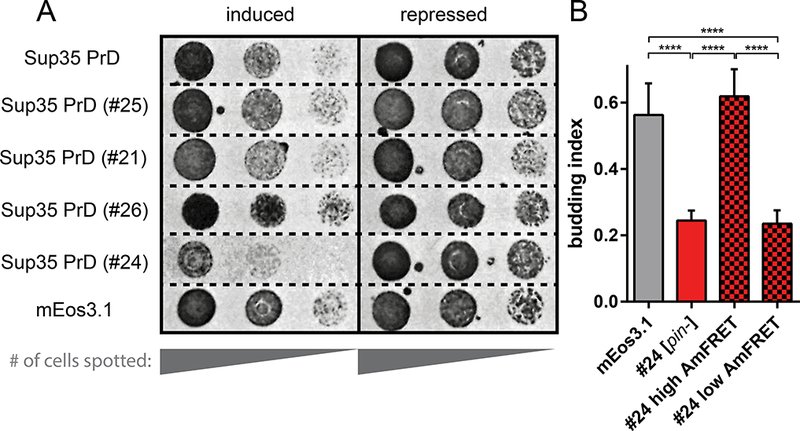
(A) [pin-] cells harboring plasmids encoding the indicated proteins spotted as five-fold serial dilutions onto media with either galactose (inducing) or glucose (repressing).
(B) Budding indices of cells expressing Sup35 PrD #24 or unfused mEos3.1 to the same intensity (5000 – 7000 AU). Solid red and checkered bars denote [pin-] and [PIN+] cells, respectively. The latter is divided into “high” (amyloid) and “low” (non-amyloid) AmFRET subpopulations. Shown are means of five experiments; error bars represent 95 % CI; ****, p<0.0001 (ANOVA).
Many amyloid-forming proteins are cytotoxic when expressed in cells, but mapping toxicity to specific phases of the proteins (i.e. amyloid, pre-amyloid oligomers, or non-amyloid condensates) demands single cell resolution of both protein state and cell health. We took advantage of the imaging capability of our flow cytometry setup to measure cell division, as a proxy for cell health, in populations of cells harboring different levels of AmFRET. We accordingly repeated the DAmFRET experiment in the absence of cell cycle arrest, and used the brightfield channel in imaging flow cytometry to determine budding indices. Variant #24 severely reduced the budding index (Fig. 6B). Remarkably, the effect was entirely specific to its non-amyloid assemblies: the high AmFRET population of cells that occurred exclusively in the presence of [PIN+] budded just as frequently as cells expressing unfused mEos3.1. Hence, the amyloids ameliorated toxicity by draining the cell of kinetically trapped assemblies.
DISCUSSION
We posited that exceptionally long timescales for diverse protein-driven phenomena result from kinetic barriers imposed by the nucleation of ordered self-assembly. We created a tool -- DAmFRET -- with the combination of features necessary to explore that hypothesis.
In short, DAmFRET employs a single fusion construct to produce a direct positive readout of protein self-assembly in each of thousands of individual cells. It has no restrictions on subcellular localization, solubility, or size of the assemblies, thereby mitigating false-negatives and false-positives. In contrast, existing high-throughput assays for protein aggregation, such as the recently developed yTRAP (Newby et al., 2017), use a negative readout, require restrictive subcellular localization, and/or necessitate expression from dual constructs. Most importantly, DAmFRET simultaneously reports total protein concentration, and thereby the concentration-dependence of self-assembly, in every single sample. This pivotal advantage allows for the detection and quantitation of nucleation barriers as bimodal dependencies ofself-assembly on concentration.
Because our experiments are performed in living cells, non-equilibrium processes plausibly contribute to DAmFRET measurements. The flux through translation, folding, post-translational modifications, and degradation may influence nucleation independently of the protein’s concentration at steady state. On the one hand, such effects will reduce the accuracy of our interpretations of nucleation with respect to concentration. On the other, that they can now be observed and interrogated using DAmFRET will open new avenues of inquiry into protein homeostasis mechanisms.
Applying DAmFRET to proteins of structurally diverse self-assemblies, we discovered that many are indeed kinetically limited by nucleation barriers. These included all of the prion-forming domains tested, but not compositionally similar domains from non-prion proteins. Moving forward, DAmFRET can complement measurements of cell-to-cell transmissibility post- nucleation, to provide a complete quantitative description of “prionness”.
Protein over-expression unmasks latent phase behavior
That disordered condensation lacks an appreciable nucleation barrier allows it to respond rapidly to small changes in thermodynamic parameters such as temperature, pH, and ligand concentrations. Does nature exploit this? The astonishing variety of cellular processes now known to be modulated by liquid-liquid phase separation indicates that indeed it does, and to great extent.
Phase boundaries can be crossed by moving along either axis of a phase diagram. We reasoned that by pushing protein concentrations well above endogenous levels, we can systematically cross phase boundaries that may, nevertheless, be physiological in other dimensions, such as pH (Fig. 7A). DAmFRET validated this idea for Sup35 PrD. The protein condensed into non-amyloid assemblies not only at high concentration during stress-free growth, but at lower concentrations under stress, which induces mRNP granules through cytosol acidification. The Sup35 assemblies colocalized with mRNP granules, suggesting that Sup35 partitions alongside other mRNA-associated proteins into physiological condensates of heterogeneous composition. Alberti and colleagues largely corroborate these findings (Franzmann et al., 2018): Sup35-GFP, when modestly overexpressed from a low copy number plasmid (Karim et al., 2013), formed liquid droplets during stress. These protected the essential enzymatic activity of Sup35 from inactivation by those stresses. We went a step further, and verified that endogenous Sup35 tagged with GFP also forms multimers during stress.
Figure 7. A conceptual framework to deconstruct nucleation barriers.

(A) Schematic intracellular protein phase diagram for Sup35, with concentration on x-axis and stress/acidity on y-axis (increasing from top to bottom). Blue shading also indicates concentration. The cell physiologically resides in the amyloid “A” regime, and yet endogenous Sup35 remains soluble over cellular timescales due to the large kinetic barrier to amyloid nucleation. Cells cross into the condensate “C” regime either upon exposure to stress (represented by travel downward) or upon experimental over-expression of Sup35 (horizontal travel).
(B) Schematic intracellular protein phase diagram that distinguish the dispersed “D”, condensate “C”, and amyloid “A” phases. The phase space for amyloid encompasses that of condensation resulting in absence of the latter at equilibrium. For clarity, coexisting phases are not illustrated.
(C) Energy landscape of phases as a function of the order parameters Density (on the x-axis) and Structural Order (on the y-axis) that distinguish the state of the protein within each phase. Contour lines describe free energy from low (blue) to high (red). Ridges between basins indicate nucleation barriers. In the absence of a pre-existing amyloid template in the cell, amyloid nucleation proceeds through metastable condensates, as illustrated by the arrow.
(D) Condensates can also be so stable as to increase the barrier to amyloid nucleation.
(E) Heterogeneous templates such as [PIN+] bias the conformational ensemble of dispersed species toward that of amyloid, leading to a reduced nucleation barrier for amyloid formation that enables nucleation without prior condensation.
Consequences of nucleation barriers
Disordered condensates tend to be metastable with respect to amyloid forms of the same protein. Therefore, polypeptides within condensates are typically (albeit not necessarily; see (Posey et al., 2018) supersaturated with respect to amyloid, such that the solubility line lies at a lower concentration than the liquid-liquid coexistence line (represented by the red and green curves, respectively, in Fig. 7A-B) on the phase diagram. Nucleation barriers therefore delay the inevitable progression of such condensates to more ordered, amyloid-like phases. The consequences may be physiological, or pathological, depending on how the activities of the protein differ between the phases.
“Prion-like” sequences (i.e. that resemble the canonical yeast prion proteins: Ure2, Sup35, and Rnq1) tend to be lengthy and replete with polar uncharged residues. These features do not promote amyloid thermodynamically (Knowles et al., 2014; Maurer-Stroh et al., 2010). Instead, they promote dynamic condensation by increasing low affinity polyvalency (Banani et al., 2017; Halfmann, 2016). Indeed, most prion-like sequences exhibit no detectable propensity to form amyloid (Alberti et al., 2009), and we found that randomly scrambling Sup35’s PrD reduced its fluidity -- either directly (#24) or by facilitating amyloid nucleation (#26). We strongly suspect that prion-like sequences evolve not to promote aggregation thermodynamically, but rather, to prevent aggregation kinetically. The consequence, at least for several such proteins, appears to be switch-like self-sustaining aggregation once the kinetic barrier is breached.
The single cell resolution of DAmFRET enabled us to query the relationship of specific phases to proteotoxicity. Specifically, we found that a variant of Sup35 PrD (#24) destabilized the supersaturated soluble state by allowing the protein to form viscous non-amyloid condensates. Remarkably, cells containing these condensates suffered a growth defect; and lowering the nucleation barrier to amyloid mitigated toxicity by draining the protein from those assemblies into the benign and more thermodynamically favored amyloid phase. The extent to which human amyloid-associated proteopathies likewise result from kinetically trapped non-amyloid assemblies remains to be tested.
Deconstructing nucleation barriers
Our findings suggest that nucleation barriers relate closely to the structure of self-assemblies. Disordered assemblies lacked observable nucleation barriers, whereas ordered assemblies -amyloids, amyloid-like beta solenoids (HET-s PrD; Daskalov et al., 2014), and death fold filaments (ASC) -- all exhibited nucleation barriers sufficient to enable deep supersaturation. As elaborated here, we believe this relationship follows directly from theory.
Nucleation barriers represent the combined improbability of fluctuations in each of the order parameters that distinguish the new phase from the old. For protein self-assemblies, these can be summarized as density and structural order (Fig. 7C). The dispersed phase “D” has low density and low structural order; the condensate “C” has high density and low structural order; and the ordered assembled phase (represented by amyloid) “A” has high density and high structural order. Transitioning from D to A involves a large increase in both density and structural order.
Hence, a rate-limiting barrier to amyloid nucleation may persist even at concentrations well above the liquid-liquid coexistence line shown in Fig. 7A. Consequently, the protein partitions into higher density condensates, which are separated from amyloid only by their absence of structural order. A structural fluctuation within such condensates then gives rise to amyloid (Fig. 7C). Non-amyloid condensates can also be stable enough that they are “off-pathway”, as for those of Sup35 PrD #24, when the nucleation barrier to “A” is greater from “C” than from “D” (Fig. 7D).
Our data suggest that structural fluctuations also broadly dominate the amyloid nucleation barrier in vivo. Sup35 PrD, a model amyloid-forming protein, formed visible droplets that -based on fluorescence intensity and size -- contain millimolar concentrations of monomer. This corresponds to at least ten thousand-fold supersaturation with respect to the concentration of monomer that remains dispersed in amyloid-containing cells (approximately 50 nM; Tanaka et al., 2006). Yet, even though it remained fully mobile within the droplets, the protein failed to acquire the thermodynamically favored amyloid state over experimental timescales.
Instead, our data revealed that amyloid nucleation by Sup35 as well as Ure2 and Swi1 PrDs depended virtually entirely on the existence of pre-formed amyloids of another protein. Those heterologous amyloids did not change the affinity of soluble prion-forming proteins for themselves, as they did not increase partitioning into pre-amyloid condensates (Fig. 5A and S3A). Likewise, [PIN+] had no effect on the disordered condensation of Sla1 PrL. Therefore, cross-seeding occurred by specifically increasing the probability of critical structural fluctuations without affecting density fluctuations, as illustrated in Fig. 6E by a shift in the dispersed phase “D” basin towards that of amyloid “A”. This shift manifest experimentally by a large, medium, and small δ for Sup35 PrD in the presence of low, medium, and high [PIN+], respectively. Our interpretation rationalizes the extraordinary sequence-dependence we observed for cross- seeding by [PIN+], which differed dramatically even among proteins with overtly similar amino acid compositions (Figs. 3, S3, 5 and S5).
Concluding remarks
Altogether, our data indicate that intracellular nucleation of disordered condensates occurs through a critical fluctuation in polypeptide density that occurs too readily to restrain selfassembly kinetically. Nucleation of ordered polymers, in contrast, occurs via fluctuations in both polypeptide density and structure. The simultaneous occurrence of critical fluctuations in both parameters appears to be sufficiently improbable as to prevent nucleation over cellular timescales. The improbability of acquiring that level of order, from disordered dispersed species, produces a nucleation barrier large enough for prion-free cells to entirely harbor soluble protein despite being supersaturated at endogenous concentrations. The switch-like physiological changes that emerge from nucleation-limited assembly are simply not possible with proteins acting individually. Nature has acted upon protein kinetics at the ensemble level.
To some extent, then, the material existence of a particular assembled structure may be irrelevant to its function. Testing this idea, its generality among nucleated self-assemblies, and its potential contribution to their time-dependent cellular activities, presents a fantastic challenge for the future. The method developed here provides ways to overcome this challenge.
STAR* Methods
Contact for Reagent and Resources Sharing
Further information and requests for resources and reagents should be directed to and will be fulfilled by the Lead Contact, Randal Halfmann (rhn@stowers.org).
Experimental Model and Subject Details
Yeast Culture
Yeast cells were grown at 30°C using standard culturing techniques in YPD (1% yeast extract, 2% glucose and 2% peptone), or synthetic dropout media (6.7g/L yeast nitrogen base, 2% glucose/ galactose, and amino acid concentrations followed as per https://sunrisescience.com/yeast-media-faq/.)
Method Details
Cloning procedures
A gateway destination vector, BB5b, was constructed by ligating a GeneArt String encoding a yeast codon-optimized 4x(EAAAR) linker and mEos3.1 between HindIII and XhoI in pAG426GAL-ccdB (14155). The URA3 promoter was truncated to increase plasmid copy number (Loison et al., 1989). A golden gate (Engler and Marillonnet, 2013) cloning-compatible vector, V08 was constructed from BB5b using gap repair to replace the Gateway cassette with inverted BsaI sites. V08 was then used to construct V12 by ligating a synthetic fragment encoding yeast codon-optimized mEos3.1–4x(EAAAR) followed by inverted Bsal sites between SpeI and Xhol. Finally, vector CA was constructed from V12 using gap repair to replace the inverted Bsal sites with the Gateway cassette.
Inserts available as pre-existing Gateway entry clones (Alberti et al., 2009; Cai et al., 2014; Douglas et al., 2008; Halfmann et al., 2011) were introduced into BB5b and CA using Gateway LR recombination. All other inserts were ordered as GeneArt Strings flanked by Type IIs restriction sites for ligation between self-excising Bsal sites in V08 and V12. All plasmids were verified by sequencing. Table S2 lists the plasmids and encoded polypeptide sequences for all fusion proteins characterized in this study.
Yeast genetic manipulations
Table S3 details all yeast strains used in this study. Yeast were transformed with a standard lithium-acetate protocol (Gietz et al., 1992). The primary DAmFRET strain, rhy1713, was constructed from Y7092 (Tong and Boone, 2007). PCR-based mutagenesis (Goldstein and McCusker, 1999) was used to replace CLN3 in its entirety with a purpose-built cassette that expresses WHI5 from the inducible GAL1 promoter. Strains rhy1851 and rhy1852 were constructed by passaging strains Y7092 and rhy1713, respectively, four times on YPD plates containing 3 mM GdHCI, a prion-curing agent (Ferreira et al., 2001). Toxicity and budding index analyses were performed in Y7092 and rhy1851.
GAL1 promoter-mediated overexpression of WHI5 in a cln3-knockout background potently arrests cells in G1 phase (Adames et al., 2015), thereby preventing nucleated protein assemblies from transmitting beyond the original cell, while enabling more accurate calculation of cell volume due to the spherical shape of the arrested cells. Growing the yeast in glucose-based medium enables the cells to proliferate, whereas switching them to galactose-medium induces arrest and simultaneous induction of fusion protein expression.
Preparing cells for DAmFRET
Standard yeast media and growth conditions were used. Single transformant colonies were inoculated to 200 μI of glucose-containing selection medium per well in a round bottom microplate, then incubated on a Heidolph Titramax vibrating platform shaker at 30°C, 1350 RPM overnight, to allow for the prevalence of a range of copy numbers of plasmid in the population and to obtain a turbid culture. Cells were then washed twice with sterile distilled water to remove residual glucose before being resuspended in 200 μI of galactose-containing induction medium and returned to the incubating shaker for approximately 16 hrs. Microplates were then illuminated with an OmniCure® S1000 fitted with a 320–500 nm (violet) filter and a beam collimator (Exfo), positioned 45 cm above the plate, for a duration of 25 min, which was found to produce the maximum acceptor fluorescence with minimal photobleaching of donor. Violet light induces cleavage in the mEos3.1 peptide backbone adjacent to the chromophore (Wiedenmann et al., 2004; Zhang et al., 2012), converting it from a green form (emission peak at 516 nm) to a red form (emission peak at 581 nm). The beam power at the plate was 11.25 mW/cm2, giving a total photon dose of −17000 mJ/cm2. Microplates were shaken at 800 RPM on a microplate shaker during photoconversion to prevent cell settling.
DAmFRET Data Collection
All the AmFRET data were acquired on an lmageStream®xMkII imaging cytometer (Amnis) at 60X magnification with low flow rate and high sensitivity using INSPIRE software. INSPIRE software directed the instrument to acquire as follows: channel 04 (brightfield in camera one), channel 10 (brightfield in camera two), channel 02 (donor fluorescence), channel 03 (sensitized emission FRET), channel 07 (blue fluorescence, a proxy for dead/dying cells as validated by staining with Sytox Far Red; see Fig. S1A) and channel 09 (acceptor fluorescence). Magnification at 60X provided a pixel size of 0.3 μm2. All samples were loaded from the microtiter plate using the lmageStream®xMkII autosampler. Channels 02 and 03 captured emission from 488 nm excitation, with 528/65 and 577/35 nm filters, respectively. Channel 07 captured emission from 405 nm excitation, with a 457/45 nm filter. Channel 09 captured emission from 561 nm excitation, using a 582/25 nm filter.
Brightfield-based gates were assigned in INSPIRE: first for focused events, determined by gradient root mean squared, and second for single cells, determined by area and aspect ratio (ratio of the lengths of the long and short axes through the cell). These focused, single-cell events were counted for donor and acceptor fluorescence positivity. For each sample, a minimum of 20,000 double positive events or maximum of between 5 and 10 minutes collection time were counted before proceeding to the next sample. Although only putative target events were counted, all unsaturated events were acquired and saved.
Compensation of the data collected was performed by using the built-in wizard of IDEAS 6.2 on single color controls - cells expressing non-photoconverted mEos3.1 and those with dsRed2 (as a proxy for the red form of mEos3.1).
DAmFRET Data Analysis
Data were processed using IDEAS 6.2 (Amnis) software and batched using FCS Express Plus 6.04.0015 software (De Novo). IDEAS yields standard parameters, such as integrated intensity of acquired channels, as well as user-derived features, such as AmFRET (FRET intensity/acceptor intensity). To measure cell area from brightfield, we created a feature for area calculated by the adaptive erode mask, with an adaptive erosion coefficient set at a threshold of 70%, which both visually aligns with the cell boundary and corresponded to mean cell area from a culture simultaneously measured by microscopy. All integrated intensity values reported or intensity derived features (e.g. cytosolic concentration) exclusively represent intensity within this brightfield mask.
AmFRET positive population fractions were determined by dividing cytometry histograms into 64 bins logarithmically spaced from 1 to 1000 micromolar. For each protein, the threshold for the AmFRET positive population was measured as the point halfway between the two population centers as determined by a multi-Gaussian fit of the AmFRET distribution. For strains where only the positive or negative population are observed, the threshold value was determined by a closely related protein showing both populations. For each bin, the fraction of cells in the AmFRET positive population was determined. Bins at the low and high extremes of concentration were excluded when their fractions deviated above and below, respectively, neighboring bins due to low event number and autofluorescence. These curves were then fit to a Weibull function of the following form, using non-linear least squares optimization via the Levenberg-Marquardt method (Bevington and Robinson, 2003):
where c is the concentration and EC50 is the concentration at which the AmFRET positive population is equal to 50%. The shape parameter or “Weibull slope”, 1/δ, describes the sharpness of the transition. We therefore use its reciprocal (δ) to report the observed persistence of the nucleation barrier with respect to concentration. A two-parameter Weibull function was previously used to phenomenologically describe nucleation as a function of supersaturation (Sear, 2016). Since we do not know the saturating concentrations of each self-assembly a priori, we included a third parameter, cmin, to allow Fpos to go to 0 as required for phase behavior as a function of raw concentration rather than degree of supersaturation. Errors were obtained by the Monte Carlo method, employing random noise added to the best-fit curve with a standard deviation equal to the fit residuals standard deviation. Hundred such randomized curves were fit to obtain standard errors in the fit parameters.
DAmFRET is highly analogous to isothermal metastable zone width (MZW) measurements used to describe the range of supersaturating concentrations under which crystallization can be induced. MZWs are determined empirically and the precise value depends on the rate of supersaturation (Asherie, 2004; Bhamidi et al., 2017). They can be used to approximate phase diagrams provided crystal nucleation occurs rapidly within disordered clusters (Asherie et al., 1996). Our cellular system does not offer the level of experimental control (for example, constant supersaturation rates in all vessels), or the level of precision in determining saturating concentrations, that would be required to confidently link DAmFRET with MZWs. Moreover, because amyloid nucleation (in contrast to crystallization of well-behaved globular proteins) can be rate-limited by conformational fluctuations even within condensates, the metastable zone (usually defined as the region between the liquidus and binodal) will have limited relevance to amyloid nucleation barriers (as elaborated in Discussion and Fig. 7).
Determining absolute protein concentration from fluorescence intensity
Molecular brightness of photoconverted mEos 3.1 was calibrated by ImageStream®x MkII measurement of mEos3.1 endogenously fused to Spc42, a protein in S. cerevisiae with about 1000 assembled molecules per cell (Bullitt et al., 1997), in order to relate instrumental intensity values to molecule number. Our calibration method is based on methods from fluorescence correlation spectroscopy (Shivaraju et al., 2012). Brightfield area measurements generated by the instrument permitted extrapolation from cell size and Spc42-derived molecular brightness to gross cellular concentration. Given that organelles occupy about 17% of haploid S. cerevisiae cell volume (Uchida et al., 2011), we corrected the calculation to reflect concentration from fluorescence intensity generated in the cytosol.
The method firstly consists of the measurement of unconverted mEos3.1 molecular brightness as defined by the peak intensity observed by a single mEos3.1 molecule using Spc42 as a reference standard. One attractive feature of the spindle pole body is that its size of ~150 nm (Bullitt et al., 1997) is significantly smaller than the resolution of the imaging cytometer. As a result, the observable spot on the imaging cytometer is the same size as would be expected from a single fluorescent molecule and its peak amplitude will be proportional to a single molecule brightness multiplied by the fluorophore copy number.
Cells expressing Spc42-mEos3.1 were acquired on the ImageStream at 40, 80, 160, and 400 mW 488 nm laser powers. The IDEAS software was utilized to filter for unbudded and live cells based on scatter plots of area vs. aspect ratio and fluorescence intensities in ch02 vs. ch07, respectively. Compensated images were exported as 16-bit tiff images for visualization and further analysis with a custom implementation of the Bio-Formats plugin for ImageJ. Spc42 spots were clearly resolved in approximately 10% of the cells. The cells without clearly resolvable spots could have been out of focus. The maximum intensity in each image was selected as the initial center point of the Gaussian function. Gaussian fitting for the maximum spot in each image was then accomplished with a custom grid search fitting algorithm in ImageJ available at http://research.stowers.org/imageiplugins. The plugin attempts to fit a Gaussian function centered at each 0.25-pixel increment within 2 pixels in either direction from the maximum and with standard deviations from 0.5 pixels to 4 pixels at 0.1 pixel increments. At each candidate grid point, the fit is performed with linear least squares to a Gaussian function as follows:
where xc and yc are the candidate centers of the actual spot, σ is the candidate spatial standard deviation. Linear least squares solves for the background intensity, b, and the peak amplitude, A at each candidate grid point. The point with the lowest χ2 value is chosen as the best fit.
After fitting, a 2D histogram of peak amplitude vs. standard deviation reveals two behaviors. At small standard deviations there is a downward trending shoulder showing decreasing amplitude with increasing standard deviation. This is expected behavior for particles at different focal planes of the microscope. At higher standard deviations, the amplitude does not depend on standard deviation and these spot sizes correspond to values much larger than the expected resolution of the image cytometer (> 1 μm). This seems to correspond to the ~90% of cells that did not show visible spots as mentioned above.
A histogram was made of peak amplitudes with standard deviations less than 1.1 pixels (widths less than 850 nm). We estimate the standard deviation of the smallest spots to be 0.9 pixels (width of 700 nm), so this allows for a narrow distribution of spot sizes around the minimum value. These histograms as a function of laser power are shown in Fig. S1E. This histogram was then fit to a one-dimensional Gaussian function, this time using traditional non-linear least squares to obtain the center of the peak amplitude distribution. At 40 mW, the Spc42 peaks become more difficult to resolve and the peak amplitude distribution appears bimodal. The higher amplitude peak follows the trend from the other laser powers and represents “real” Spc42 spots.
The relationship between Spc42 peak amplitude and laser power is not linear (Fig. S1E). In order to create a calibration curve for different laser powers, the center of the peak amplitude distribution as a function of laser power was fit to a simple exponential function as follows:
where P is the laser power, A is the peak amplitude, and Amax and x are fit variables. For our setup, Amax and x are 70.16 and 226.1, respectively. The brightness per mEos3.1 molecule is then obtained by simply dividing the Amax value by 1000 molecules. Our brightness per molecule for unconverted mEos3.1 is therefore 0.00594.
Now that we can derive the molecular brightness of green unconverted mEos3.1 at each laser power, we can use the integrated intensity from each cell to calculate the fluorophore concentration. Firstly, we use the measured area of each cell (from the Ideas software) in pixels to calculate the average intensity per pixel. From fluorescence correlation spectroscopy theory, we know that the average intensity is the product of the number of molecules in the focal volume multiplied by the molecular brightness of each molecule. In turn, the number of molecules per focal volume can be converted to concentration as follows:
Where Na is Avogadro’s number and Vfocus is the microscope focal volume. The latter can be somewhat difficult to determine because of the poorly defined z dimension of the imaging cytometer focus. If we measure the average peak intensity of sub-resolution beads at differing shifts of the objective from the center of the flow stream, we obtain an approximate focal volume profile (Fig. S1D) with a width of 4.2 pm. Therefore, we have chosen to treat the focal volume as a cylinder with radial gaussian profile of width 700 nm and a z extent of 4.2 pm, giving a focal volume of 2.7 pm3 or 2.7 fL.
The final piece is to calibrate the photoconversion efficiency. We have chosen to express our concentrations in unconverted mEos3.1 concentration units as measured in the green channel. As a result, we can measure the average ratio of the intensity of a photoconverted cell in the red channel to an unconverted cell in the green channel. That ratio allows us to convert photoconverted red intensity into unphotoconverted green intensity for every sample and subsequent concentration calibration. In addition, we assume that most of the proteins analyzed will be cytoplasmic. The ratio of cytoplasmic to total volume in a yeast cell has been estimated as 0.83 (Uchida et al., 2011).
To summarize, cytosolic concentration ( Ccytosol ) assessment contains three derivations.
Determine the relationship between laser power and photoconverted donor intensity of a 1000 molecule complex.
Find the conversion factor from integrated intensity to concentration given optic constraints (especially focal volume) of the instrument’s 60x objective.
Relate the photoconversion ratio of photoconverted green intensity to photoconverted red intensity of the mEos3.1-only control.
This last piece is crucial given that AmFRET signal accompanying mEos3.1 association is necessarily accompanied by loss of donor signal, whereas acceptor is constant and thus is an appropriate, AmFRET signal independent measure of fluorescent mEos3.1. We can simplify the derivation above to represent the average concentration in the cytoplasm of a cell as:
where Ired is the compensated cell intensity in the red channel and A is the cell area in μm2
Here, the multiplier, k, is as follows for 20 mW laser power:
Molecular Brightness Analysis
Fluorescence correlation spectroscopy was used to determine the molecular brightness and thus the extent of oligomerization of Sup35-EGFP under different conditions (Fig. S4B). Brightness analysis was performed in an analogous fashion to (Slaughter et al., 2013). Briefly, the amplitude of an FCS curve can be written in terms of the number of molecules per focal volume, N, and the molecular brightness, ε:
Here g is a shape factor accounting for the shape of the confocal focal volume. Its value is approximately 0.27 for most confocal microscopes (Slaughter et al., 2013) but given our desire for relative molecular brightness, it does not matter for this study. The average fluorescence intensity can be expressed as follows:
The measurement of the total FCS amplitude and average intensity does not provide enough information to measure more that the average brightness and number of molecules. However, the presence of multiple diffusion times affords the opportunity to measure two amplitude values:
Substituting in the previous equation, we can express this in terms of the fractional intensity of the fast diffusing component:
Rearranging we can get a “brightness” curve with amplitudes as follows:
This leaves us with three unknown components. If we assume that the fast component is monomeric (brightness equal to GFP monomer), we can easily solve for the fractional intensity and the slower component brightness.
Error bars in correlation amplitudes represent standard errors in the fitted parameters and were obtained by Monte Carlo analysis as with the DAmFRET population analysis (see above). Errors were propagated to brightness values using standard derivative formulas ignoring covariances between terms (Bevington and Robinson, 2003).
Confocal imaging, time-lapse, and FRAP Analysis
Confocal images were acquired on an Ultraview Vox Spinning Disc (Perkin Elmer). The green form of mEos3.1 was excited using a 488 nm laser through either an alpha Plan Apochromat 100× 1.46NA objective (Zeiss) or a Plan Apochromat 63× 1.4NA objective (Zeiss). Emission was collected with an EMCCD (Hamamatsu, C1900–23B) and was filtered with a 525–50 nm bandpass filter. Movies were acquired with cells trapped in a CellASIC Onix2 microfluidic device (Millipore) with either single confocal slices or z-stacks. The z step spacing for movies was set to between 0.3 and 1 pm. The time scale between images varied. FRAP was acquired on the same system in FRAP preview mode, with 5 pre-bleach images and an appropriate time-lapse and length for recovery (every 60 ms for 10 s for half and full FRAP of liquid droplets). Images were expanded with bilinear interpolation for optimal visualization.
For half FRAP analysis, each recovery curve was collected, then normalized to minimum and maximum. Then a group of at least 19 curves were averaged together and fit with a two- component exponential recovery function. Five replicates of this process yielded five sets of fit components that were then averaged together (n = 141 total) to yield the final results. For full FRAP, each curve was fit with a one component exponential recovery function. All fits were averaged together to yield the final results (n = 28). Monomer control FRAP was treated the same way as full FRAP (n = 70).
Sphericity analyses were limited to thresholded puncta with sizes > 350 nm. The aspect ratio is the ratio of the lengths of the long axis and short axis.
ThT localization assays were performed on an LSM 780 microscope in photon counting lambda mode with a 100x alpha Plan-Apochromat (NA = 1.46) objective. Excitation of ThT and mEos3.1 was achieved at 405 nm. Spectra for ThT and mEos3.1 were obtained empirically from the data and used to linearly unmix the images. Unmixed images were then smoothed with a 1.5-pixel standard deviation Gaussian blur, cropped, and the contrast was adjusted for optimal viewing of the signal in the punctate regions.
Sup35 colony color assay
Photoconverted yeast cells were sorted 750 events each from high and low AmFRET populations by a BD Influx Sorter each into 200μl of SD CSM. Subsequently, the media containing sorted cells were spread with glass beads onto 1/4 YPD plates; these plates enhance visualization of color effects subsequent to adenine deficiency for the Sup35-C red/white colony assay (Alberti et al., 2009). After growth at 30°C for 2–3 days, plates were moved to 4°C overnight to deepen the red coloration and photographed the following day.
FACS sorting of Sup35 PrD #24 expressing cells
Photoconverted yeast cells were sorted 500,000 events each from high and low AmFRET gates (using Sup35 PrD of [PINT] cells and unfused mEos3.1 cells as positive and negative readouts of AmFRET, respectively) in a BD Influx Sorter, each into 1 ml of SGal-Ura. The cells were then concentrated by centrifugation and used for half-FRAP immediately.
Semi-Denaturating Detergent Agarose Gel Electrophoresis (SDD-AGE)
SDD-AGE is a biochemical approach to detect polydisperse assemblies that resist denaturation in ionic detergents (Halfmann and Lindquist, 2008; Kryndushkin et al., 2003), a characteristic of amyloid that derives from its extensive hydrogen bonding network and exquisite side chain packing (Eisenberg and Sawaya, 2017). The SDD-AGE procedure was adapted from (Halfmann and Lindquist, 2008), with the following modifications. Cells were lysed by bead-beating with a 2010 Geno/Grinder®, 2% SDS or sarkosyl was used in the sample buffer, and mEos3.1-fused protein distributions were analyzed directly in the gel with GE Typhoon™ Imaging System. Images were then background subtracted using a 250-pixel rolling ball, cropped and contrast-adjusted.
Quantification and Statistical Analysis
Details of statistical tests used, and the analyses are all described in both - Method Details and in the relevant Figure Legends sections. GraphPad Prism v7.04 and Microsoft Excel 2016 were used to compute statistics.
Supplementary Material
Highlights.
Distributed Amphifluoric FRET (DAmFRET) quantifies nucleation in living cells
DAmFRET rapidly distinguishes prion-like from non-prion phase transitions
Sequence-intrinsic featuares determine concentration-dependence of nucleation barriers
Prion cross-seeding occurs by conformational templating; not by driving condensation
Acknowledgements
We thank Susan Liebman and Jonathan Weissman for variant [PIN+] and [PSI+] yeast strains, respectively; Eric Ross for scrambled Sup35 PrD cloning templates; Roy Parker for plasmid pRP1156; and Ammon Posey, Rohit Pappu, and Boris Rubinstein for insightful discussions. We thank Mark Miller and Chris Wood for assistance preparing illustrations, and Michelle Tan for assistance with molecular biology. This work was funded by NIH Director’s Early Independence Award DP5-OD009152, NIH grant P30 AG035982, and the Stowers Institute for Medical Research.
Footnotes
Author Contributions
Conceptualization, T.K., T.S.K., S.V., E.K., and R.H.; Methodology, T.K., T.S.K., S.V., E.K., and R.H.; Investigation, S.V., T.S.K., T.K., J.W., J.J.L., E.K., A.R.G.; Formal Analysis, T.S.K., S.V., J.J.L., T.K., J.W., E.K., A.B., J.R.U., and R.H.; Data Curation, M.C.; Visualization, T.S.K., J.J.L., and R.H., Writing - Original Draft, R.H.; Writing - Review & Editing, S.V., M.C., T.S.K., J.W., J.J.L., J.R.U. and R.H.; and Funding Acquisition, R.H.
Declaration of Interests
The authors declare no competing interests.
Publisher's Disclaimer: This is a PDF file of an unedited manuscript that has been accepted for publication. As a service to our customers we are providing this early version of the manuscript. The manuscript will undergo copyediting, typesetting, and review of the resulting proof before it is published in its final citable form. Please note that during the production process errors may be discovered which could affect the content, and all legal disclaimers that apply to the journal pertain.
References
- Adames NR, Schuck PL, Chen KC, Murali TM, Tyson JJ, and Peccoud J (2015). Experimental testing of a new integrated model of the budding yeast Start transition. Mol. Biol. Cell 26, 3966–3984. [DOI] [PMC free article] [PubMed] [Google Scholar]
- Alberti S, Halfmann R, King O, Kapila A, and Lindquist S (2009). A systematic survey identifies prions and illuminates sequence features of prionogenic proteins. Cell 137, 146–158. [DOI] [PMC free article] [PubMed] [Google Scholar]
- Arslan F, Hong JY, Kanneganti V, Park S-K, and Liebman SW (2015). Heterologous aggregates promote de novo prion appearance via more than one mechanism. PLoS Genet. 11, e1004814. [DOI] [PMC free article] [PubMed] [Google Scholar]
- Asherie N (2004). Protein crystallization and phase diagrams. Methods 34, 266–272. [DOI] [PubMed] [Google Scholar]
- Asherie N, Lomakin A, and Benedek GB (1996). Phase diagram of colloidal solutions. Phys. Rev. Lett 77, 4832–4835. [DOI] [PubMed] [Google Scholar]
- Banani SF, Lee HO, Hyman AA, and Rosen MK (2017). Biomolecular condensates: organizers of cellular biochemistry. Nat. Rev. Mol. Cell Biol 18, 285–298. [DOI] [PMC free article] [PubMed] [Google Scholar]
- Basiji D, and O’Gorman MRG (2015). Imaging flow cytometry. J. Immunol. Methods 423,1–2. [DOI] [PubMed] [Google Scholar]
- Bevington PR, and Robinson DK (2003). Data reduction and error analysis for the physical sciences (McGraw-Hill; ). [Google Scholar]
- Bhamidi V, Kenis PJA, and Zukoski CF (2017). Probability of nucleation in a metastable zone: induction supersaturation and implications. Cryst. Growth Des 17, 1132–1145. [Google Scholar]
- Biancalana M, and Koide S (2010). Molecular mechanism of Thioflavin-T binding to amyloid fibrils. Biochim. Biophys. Acta 1804, 1405–1412. [DOI] [PMC free article] [PubMed] [Google Scholar]
- Blakeley BD, Chapman AM, and McNaughton BR (2012). Split-superpositive GFP reassembly is a fast, efficient, and robust method for detecting protein-protein interactions in vivo. Mol. Biosyst 8, 2036–2040. [DOI] [PubMed] [Google Scholar]
- Bondarev SA, Shchepachev VV, Kajava AV, and Zhouravleva GA (2013). Effect of charged residues in the N-domain of Sup35 protein on prion [PSI+] stability and propagation. J. Biol. Chem 288, 28503–28513. [DOI] [PMC free article] [PubMed] [Google Scholar]
- Bondarev SA, Zhouravleva GA, Belousov MV, and Kajava AV (2015). Structure-based view on [PSI(+)] prion properties. Prion 9, 190–199. [DOI] [PMC free article] [PubMed] [Google Scholar]
- Bradley ME, Edskes HK, Hong JY, Wickner RB, and Liebman SW (2002). Interactions among prions and prion “strains” in yeast. Proc Natl Acad Sci USA 99 Suppl 4, 16392–16399. [DOI] [PMC free article] [PubMed] [Google Scholar]
- Buchan JR, Muhlrad D, and Parker R (2008). P bodies promote stress granule assembly in Saccharomyces cerevisiae. J. Cell Biol 183, 441–455. [DOI] [PMC free article] [PubMed] [Google Scholar]
- Bullitt E, Rout MP, Kilmartin JV, and Akey CW (1997). The yeast spindle pole body is assembled around a central crystal of Spc42p. Cell 89, 1077–1086. [DOI] [PubMed] [Google Scholar]
- Cabantous S, Nguyen HB, Pedelacq J-D, Koraichi F, Chaudhary A, Ganguly K, Lockard MA, Favre G, Terwilliger TC, and Waldo GS (2013). A new protein-protein interaction sensor based on tripartite split-GFP association. Sci. Rep. 3, 2854. [DOI] [PMC free article] [PubMed] [Google Scholar]
- Cai X, Chen J, Xu H, Liu S, Jiang Q-X, Halfmann R, and Chen ZJ (2014). Prion-like polymerization underlies signal transduction in antiviral immune defense and inflammasome activation. Cell 156, 1207–1222. [DOI] [PMC free article] [PubMed] [Google Scholar]
- Cheng J, Waite AL, Tkaczyk ER, Ke K, Richards N, Hunt AJ, and Gumucio DL (2010). Kinetic properties of ASC protein aggregation in epithelial cells. J. Cell. Physiol 222, 738–747. [DOI] [PMC free article] [PubMed] [Google Scholar]
- Das RK, and Pappu RV (2013). Conformations of intrinsically disordered proteins are influenced by linear sequence distributions of oppositely charged residues. Proc Natl Acad Sci USA 110, 13392–13397. [DOI] [PMC free article] [PubMed] [Google Scholar]
- Daskalov A, Paoletti M, Ness F, and Saupe SJ (2012). Genomic clustering and homology between HET-S and the NWD2 STAND protein in various fungal genomes. PLoS ONE 7, e34854. [DOI] [PMC free article] [PubMed] [Google Scholar]
- Daskalov A, Gantner M, Wälti MA, Schmidlin T, Chi CN, Wasmer C, Schutz A, Ceschin J, Clave C, Cescau S, et al. (2014). Contribution of specific residues of the β-solenoid fold to HET-s prion function, amyloid structure and stability. PLoS Pathog. 10, e1004158. [DOI] [PMC free article] [PubMed] [Google Scholar]
- Derkatch IL, Bradley ME, Hong JY, and Liebman SW (2001). Prions affect the appearance of other prions: the story of [PIN(+)]. Cell 106, 171–182. [DOI] [PubMed] [Google Scholar]
- Douglas PM, Treusch S, Ren H-Y, Halfmann R, Duennwald ML, Lindquist S, and Cyr DM (2008). Chaperone-dependent amyloid assembly protects cells from prion toxicity. Proc Natl Acad Sci USA 105, 7206–7211. [DOI] [PMC free article] [PubMed] [Google Scholar]
- Eisenberg DS, and Sawaya MR (2017). Structural studies of amyloid proteins at the molecular level. Annu. Rev. Biochem 86, 69–95. [DOI] [PubMed] [Google Scholar]
- Engler C, and Marillonnet S (2013). Combinatorial DNA assembly using Golden Gate cloning. Methods Mol. Biol 1073, 141–156. [DOI] [PubMed] [Google Scholar]
- Feric M, Vaidya N, Harmon TS, Mitrea DM, Zhu L, Richardson TM, Kriwacki RW, Pappu RV, and Brangwynne CP (2016). Coexisting liquid phases underlie nucleolar subcompartments. Cell 165, 1686–1697. [DOI] [PMC free article] [PubMed] [Google Scholar]
- Ferreira PC, Ness F, Edwards SR, Cox BS, and Tuite MF (2001). The elimination of the yeast [PSI+] prion by guanidine hydrochloride is the result of Hsp104 inactivation. Mol. Microbiol 40, 1357–1369. [DOI] [PubMed] [Google Scholar]
- Franzmann TM, Jahnel M, Pozniakovsky A, Mahamid J, Holehouse AS, Nuske E, Richter D, Baumeister W, Grill SW, Pappu RV, et al. (2018). Phase separation of a yeast prion protein promotes cellular fitness. Science. [DOI] [PubMed] [Google Scholar]
- Futcher AB, and Cox BS (1984). Copy number and the stability of 2-micron circle-based artificial plasmids of Saccharomyces cerevisiae. J. Bacteriol 157, 283–290. [DOI] [PMC free article] [PubMed] [Google Scholar]
- Gietz D, St Jean A, Woods RA, and Schiestl RH (1992). Improved method for high efficiency transformation of intact yeast cells. Nucleic Acids Res. 20, 1425. [DOI] [PMC free article] [PubMed] [Google Scholar]
- Gilks N, Kedersha N, Ayodele M, Shen L, Stoecklin G, Dember LM, and Anderson P (2004). Stress granule assembly is mediated by prion-like aggregation of TIA-1. Mol. Biol. Cell 15, 5383–5398. [DOI] [PMC free article] [PubMed] [Google Scholar]
- Glover JR, Kowal AS, Schirmer EC, Patino MM, Liu JJ, and Lindquist S (1997). Self-seeded fibers formed by Sup35, the protein determinant of [PSI+], a heritable prion-like factor of S. cerevisiae. Cell 89, 811–819. [DOI] [PubMed] [Google Scholar]
- Goldstein AL, and McCusker JH (1999). Three new dominant drug resistance cassettes for gene disruption in Saccharomyces cerevisiae. Yeast. [DOI] [PubMed] [Google Scholar]
- Graziani S, Silar P, and Daboussi M-J (2004). Bistability and hysteresis of the “Secteur” differentiation are controlled by a two-gene locus in Nectria haematococca. BMC Biol. 2, 18. [DOI] [PMC free article] [PubMed] [Google Scholar]
- Grassmann A, Wolf H, Hofmann J, Graham J, and Vorberg I (2013). Cellular aspects of prion replication in vitro. Viruses 5, 374–405. [DOI] [PMC free article] [PubMed] [Google Scholar]
- Grousl T, Ivanov P, Malcova I, Pompach P, Frydlova I, Slaba R, Senohrabkova L, Novakova L, and Hasek J (2013). Heat shock-induced accumulation of translation elongation and termination factors precedes assembly of stress granules in S. cerevisiae. PLoS ONE 8, e57083. [DOI] [PMC free article] [PubMed] [Google Scholar]
- Halfmann R (2016). A glass menagerie of low complexity sequences. Curr. Opin. Struct. Biol 38, 18–25. [DOI] [PMC free article] [PubMed] [Google Scholar]
- Halfmann R, and Lindquist S (2008). Screening for amyloid aggregation by Semi-Denaturing Detergent-Agarose Gel Electrophoresis. J. Vis. Exp. [DOI] [PMC free article] [PubMed] [Google Scholar]
- Halfmann R, Alberti S, Krishnan R, Lyle N, O’Donnell CW, King OD, Berger B, Pappu RV, and Lindquist S (2011). Opposing effects of glutamine and asparagine govern prion formation by intrinsically disordered proteins. Mol. Cell 43, 72–84. [DOI] [PMC free article] [PubMed] [Google Scholar]
- Halfmann R, Jarosz DF, Jones SK, Chang A, Lancaster AK, and Lindquist S (2012). Prions are a common mechanism for phenotypic inheritance in wild yeasts. Nature 482, 363–368. [DOI] [PMC free article] [PubMed] [Google Scholar]
- Holmes BB, Furman JL, Mahan TE, Yamasaki TR, Mirbaha H, Eades WC, Belaygorod L, Cairns NJ, Holtzman DM, and Diamond MI (2014). Proteopathic tau seeding predicts tauopathy in vivo. Proc Natl Acad Sci USA 111, E4376–85. [DOI] [PMC free article] [PubMed] [Google Scholar]
- Holmes DL, Lancaster AK, Lindquist S, and Halfmann R (2013). Heritable remodeling of yeast multicellularity by an environmentally responsive prion. Cell 153, 153–165. [DOI] [PMC free article] [PubMed] [Google Scholar]
- Ildefonso M, Revalor E, Punniam P, Salmon JB, Candoni N, and Veesler S (2012). [Google Scholar]
- Jares-Erijman EA, and Jovin TM (2003). FRET imaging. Nat. Biotechnol 21, 1387–1395. [DOI] [PubMed] [Google Scholar]
- Nucleation and polymorphism explored via an easy-to-use microfluidic tool. J. Cryst. Growth 342, 9–12. [Google Scholar]
- Kabani M, and Melki R (2015). Sup35p in Its Soluble and Prion States Is Packaged inside Extracellular Vesicles. MBio 6. [DOI] [PMC free article] [PubMed] [Google Scholar]
- Karim AS, Curran KA, and Alper HS (2013). Characterization of plasmid burden and copy number in Saccharomyces cerevisiae for optimization of metabolic engineering applications. FEMS Yeast Res. 13, 107–116. [DOI] [PMC free article] [PubMed] [Google Scholar]
- Kashchiev D (2015). Protein Polymerization into Fibrils from the Viewpoint of Nucleation Theory. Biophys. J 109, 2126–2136. [DOI] [PMC free article] [PubMed] [Google Scholar]
- King C-Y, and Diaz-Avalos R (2004). Protein-only transmission of three yeast prion strains. Nature 428, 319–323. [DOI] [PubMed] [Google Scholar]
- Knowles TPJ, Vendruscolo M, and Dobson CM (2014). The amyloid state and its association with protein misfolding diseases. Nat. Rev. Mol. Cell Biol 15, 384–396. [DOI] [PubMed] [Google Scholar]
- Kryndushkin DS, Alexandrov IM, Ter-Avanesyan MD, and Kushnirov VV (2003). Yeast [PSI+] prion aggregates are formed by small Sup35 polymers fragmented by Hsp104. J. Biol. Chem 278, 49636–49643. [DOI] [PubMed] [Google Scholar]
- Liebman SW, and Chernoff YO (2012). Prions in yeast. Genetics 191, 1041–1072. [DOI] [PMC free article] [PubMed] [Google Scholar]
- Loison G, Vidal A, Findeli A, Roitsch C, Balloul JM, and Lemoine Y (1989). High level of expression of a protective antigen of schistosomes in Saccharomyces cerevisiae. Yeast 5, 497–507. [DOI] [PubMed] [Google Scholar]
- Lu A, Magupalli VG, Ruan J, Yin Q, Atianand MK, Vos MR, Schroder GF, Fitzgerald KA, Wu H, and Egelman EH (2014). Unified polymerization mechanism for the assembly of ASC-dependent inflammasomes. Cell 156, 1193–1206. [DOI] [PMC free article] [PubMed] [Google Scholar]
- Maurer-Stroh S, Debulpaep M, Kuemmerer N, Lopez de la Paz M, Martins IC, Reumers J, Morris KL, Copland A, Serpell L, Serrano L, et al. (2010). Exploring the sequence determinants of amyloid structure using position-specific scoring matrices. Nat. Methods 7, 237–242. [DOI] [PubMed] [Google Scholar]
- Michaels TCT, Liu LX, Meisl G, and Knowles TPJ (2017). Physical principles of filamentous protein self-assembly kinetics. J. Phys. Condens. Matter 29, 153002. [DOI] [PubMed] [Google Scholar]
- Morell M, de Groot NS, Vendrell J, Aviles FX, and Ventura S (2011). Linking amyloid protein aggregation and yeast survival. Mol. Biosyst 7, 1121–1128. [DOI] [PubMed] [Google Scholar]
- Mukhopadhyay S, Krishnan R, Lemke EA, Lindquist S, and Deniz AA (2007). A natively unfolded yeast prion monomer adopts an ensemble of collapsed and rapidly fluctuating structures. Proc Natl Acad Sci USA 104, 2649–2654. [DOI] [PMC free article] [PubMed] [Google Scholar]
- Munder MC, Midtvedt D, Franzmann T, Nuske E, Otto O, Herbig M, Ulbricht E, Muller P, Taubenberger A, Maharana S, et al. (2016). A pH-driven transition of the cytoplasm from a fluid- to a solid-like state promotes entry into dormancy. Elife 5. [DOI] [PMC free article] [PubMed] [Google Scholar]
- Narayanaswamy R, Levy M, Tsechansky M, Stovall GM, O’Connell JD, Mirrielees J, Ellington AD, and Marcotte EM (2009). Widespread reorganization of metabolic enzymes into reversible assemblies upon nutrient starvation. Proc Natl Acad Sci USA 106, 10147–10152. [DOI] [PMC free article] [PubMed] [Google Scholar]
- Newby GA, Kiriakov S, Hallacli E, Kayatekin C, Tsvetkov P, Mancuso CP, Bonner JM, Hesse WR, Chakrabortee S, Manogaran AL, et al. (2017). A genetic tool to track protein aggregates and control prion inheritance. Cell 171, 966–979.e18. [DOI] [PMC free article] [PubMed] [Google Scholar]
- Noree C, Sato BK, Broyer RM, and Wilhelm JE (2010). Identification of novel filament-forming proteins in Saccharomyces cerevisiae and Drosophila melanogaster. J. Cell Biol 190, 541–551. [DOI] [PMC free article] [PubMed] [Google Scholar]
- Osherovich LZ, Cox BS, Tuite MF, and Weissman JS (2004). Dissection and design of yeast prions. PLoS Biol 2, E86. [DOI] [PMC free article] [PubMed] [Google Scholar]
- Patel BK, Gavin-Smyth J, and Liebman SW (2009). The yeast global transcriptional co-repressor protein Cyc8 can propagate as a prion. Nat. Cell Biol 11, 344–349. [DOI] [PMC free article] [PubMed] [Google Scholar]
- Pereira M, Tome D, Domingues AS, Varanda AS, Paulo C, Santos MAS, and Soares AR (2018). A fluorescence-based sensor assay that monitors general protein aggregation in human cells. Biotechnol. J [DOI] [PubMed] [Google Scholar]
- Peters B (2011). Supersaturation rates and schedules: Nucleation kinetics from isothermal metastable zone widths. J. Cryst. Growth 317, 79–83. [Google Scholar]
- Posey AE, Ruff KM, Harmon TS, Crick SL, Li A, Diamond MI, and Pappu RV (2018). Profilin reduces aggregation and phase separation of huntingtin N-terminal fragments by preferentially binding to soluble monomers and oligomers. J. Biol. Chem 293, 3734–3746. [DOI] [PMC free article] [PubMed] [Google Scholar]
- Prusiner SB (1982). Novel proteinaceous infectious particles cause scrapie. Science 216, 136–144. [DOI] [PubMed] [Google Scholar]
- Ramdzan YM, Polling S, Chia CPZ, Ng IHW, Ormsby AR, Croft NP, Purcell AW, Bogoyevitch MA, Ng DCH, Gleeson PA, et al. (2012). Tracking protein aggregation and mislocalization in cells with flow cytometry. Nat. Methods 9, 467–470. [DOI] [PubMed] [Google Scholar]
- Rao BS, and Parker R (2017). Numerous interactions act redundantly to assemble a tunable size of P bodies inSaccharomyces cerevisiae. Proc Natl Acad Sci USA 114, E9569–E9578. [DOI] [PMC free article] [PubMed] [Google Scholar]
- Riback JA, Katanski CD, Kear-Scott JL, Pilipenko EV, Rojek AE, Sosnick TR, and Drummond DA (2017). Stress-Triggered Phase Separation Is an Adaptive, Evolutionarily Tuned Response. Cell 168, 1028–1040.e19. [DOI] [PMC free article] [PubMed] [Google Scholar]
- Rinne H (2008). The weibull distribution: A handbook (Chapman and Hall/CRC; ). [Google Scholar]
- Ross ED, Edskes HK, Terry MJ, and Wickner RB (2005). Primary sequence independence for prion formation. Proc Natl Acad Sci USA 102, 12825–12830. [DOI] [PMC free article] [PubMed] [Google Scholar]
- Sear R (2016). What do crystals nucleate on? What is the microscopic mechanism? How can we model nucleation? MRS Bull. 41, 363–368. [Google Scholar]
- Serio TR, Cashikar AG, Kowal AS, Sawicki GJ, Moslehi JJ, Serpell L, Arnsdorf MF, and Lindquist SL (2000). Nucleated conformational conversion and the replication of conformational information by a prion determinant. Science 289, 1317–1321. [DOI] [PubMed] [Google Scholar]
- Shin Y, and Brangwynne CP (2017). Liquid phase condensation in cell physiology and disease. Science 357. [DOI] [PubMed] [Google Scholar]
- Shivaraju M, Unruh JR, Slaughter BD, Mattingly M, Berman J, and Gerton JL (2012). Cell-cycle-coupled structural oscillation of centromeric nucleosomes in yeast. Cell 150, 304–316. [DOI] [PMC free article] [PubMed] [Google Scholar]
- Shyu YJ, and Hu C-D (2008). Fluorescence complementation: an emerging tool for biological research. Trends Biotechnol. 26, 622–630. [DOI] [PubMed] [Google Scholar]
- Sivanathan V, and Hochschild A (2013). A bacterial export system for generating extracellular amyloid aggregates. Nat. Protoc 8, 1381–1390. [DOI] [PMC free article] [PubMed] [Google Scholar]
- Slaughter BD, Unruh JR, Das A, Smith SE, Rubinstein B, and Li R (2013). Non-uniform membrane diffusion enables steady-state cell polarization via vesicular trafficking. Nat. Commun 4, 1380. [DOI] [PMC free article] [PubMed] [Google Scholar]
- Sun Y, Leong NT, Wong T, and Drubin DG (2015). A Pan1/End3/Sla1 complex links Arp2/3-mediated actin assembly to sites of clathrin-mediated endocytosis. Mol. Biol. Cell 26, 3841–3856. [DOI] [PMC free article] [PubMed] [Google Scholar]
- Tanaka M, Chien P, Naber N, Cooke R, and Weissman JS (2004). Conformational variations in an infectious protein determine prion strain differences. Nature 428, 323–328. [DOI] [PubMed] [Google Scholar]
- Tanaka M, Collins SR, Toyama BH, and Weissman JS (2006). The physical basis of how prion conformations determine strain phenotypes. Nature 442, 585–589. [DOI] [PubMed] [Google Scholar]
- Tong AHY, and Boone C (2007). 16 High-Throughput Strain Construction and Systematic Synthetic Lethal Screening in In Yeast Gene Analysis - Second Edition, (Elsevier; ), pp. 369–707. [Google Scholar]
- Tycko R, and Wickner RB (2013). Molecular structures of amyloid and prion fibrils: consensus versus controversy. Acc. Chem. Res 46, 1487–1496. [DOI] [PMC free article] [PubMed] [Google Scholar]
- Uchida M, Sun Y, McDermott G, Knoechel C, Le Gros MA, Parkinson D, Drubin DG, and Larabell CA (2011). Quantitative analysis of yeast internal architecture using soft X-ray tomography. Yeast 28, 227–236. [DOI] [PMC free article] [PubMed] [Google Scholar]
- Vekilov PG (2012). Phase diagrams and kinetics of phase transitions in protein solutions. J. Phys. Condens. Matter 24, 193101. [DOI] [PubMed] [Google Scholar]
- Waldo GS, Standish BM, Berendzen J, and Terwilliger TC (1999). Rapid protein-folding assay using green fluorescent protein. Nat. Biotechnol 17, 691–695. [DOI] [PubMed] [Google Scholar]
- Westergard L, and True HL (2014). Extracellular environment modulates the formation and propagation of particular amyloid structures. Mol. Microbiol 92, 698–715. [DOI] [PMC free article] [PubMed] [Google Scholar]
- Wheeler JR, Matheny T, Jain S, Abrisch R, and Parker R (2016). Distinct stages in stress granule assembly and disassembly. Elife 5. [DOI] [PMC free article] [PubMed] [Google Scholar]
- Wiedenmann J, Ivanchenko S, Oswald F, Schmitt F, Rocker C, Salih A, Spindler K-D, and Nienhaus GU (2004). EosFP, a fluorescent marker protein with UV-inducible green-to-red fluorescence conversion. Proc Natl Acad Sci USA 101, 15905–15910. [DOI] [PMC free article] [PubMed] [Google Scholar]
- Wolf H, Barisas BG, Dietz K-J, and Seidel T (2013). Kaede for detection of protein oligomerization. Mol. Plant 6, 1453–1462. [DOI] [PubMed] [Google Scholar]
- Youn J-Y, Dunham WH, Hong SJ, Knight JDR, Bashkurov M, Chen GI, Bagci H, Rathod B, MacLeod G, Eng SWM, et al. (2018). High-Density Proximity Mapping Reveals the Subcellular Organization of mRNA-Associated Granules and Bodies. Mol. Cell 69, 517–532.e11. [DOI] [PubMed] [Google Scholar]
- Zhang M, Chang H, Zhang Y, Yu J, Wu L, Ji W, Chen J, Liu B, Lu J, Liu Y, et al. (2012). Rational design of true monomeric and bright photoactivatable fluorescent proteins. Nat. Methods 9, 727–729. [DOI] [PubMed] [Google Scholar]
- Zhao J, Nelson TJ, Vu Q, Truong T, and Stains CI (2016). Self-Assembling NanoLuc Luciferase Fragments as Probes for Protein Aggregation in Living Cells. ACS Chem. Biol. 11, 132–138. [DOI] [PMC free article] [PubMed] [Google Scholar]
Associated Data
This section collects any data citations, data availability statements, or supplementary materials included in this article.