

Abstract
Objectives
To explore whether the ability to recognize specific odorant items are differentially affected in aging versus Alzheimer’s disease (AD); To refine olfactory identification deficit (OID) as a biomarker of prodromal and early AD.
Design
Prospective multicenter cross-sectional study with a longitudinal arm
Setting
Outpatient memory diagnostic clinics in New York and Texas
Participants
Adults aged 65 and older with amnestic mild cognitive impairment (aMCI) and AD and healthy aging (HA) subjects in the comparison group.
Measurements
Participants completed the University of Pennsylvania Smell Identification Test (UPSIT) and neuropsychological testing. AD-associated odorants (AD-10) were selected based on a model of ordinal logistic regression. Age-associated odorants (Age-10) were identified using a linear model.
Results
For the 841 participants (234 HA, 192 aMCI, 415 AD), AD-10 was superior to Age-10 in separating HA and AD. AD-10 was associated with a more widespread cognitive deficit across multiple domains, in contrast to Age-10. The disease- and age-associated odorants clustered separately in age and AD. AD-10 predicted conversion from aMCI to AD.
Conclusions
Non-overlapping UPSIT items were identified that were individually associated with age and disease. Despite a modest predictive value of the AD-specific items for conversion to AD, the AD-specific items may be useful in enriching samples to better identify those at risk for AD. Further studies are needed with monomolecular and unilateral stimulation and orthogonal biomarker validation to further refine disease- and age-associated signals.
Keywords: Alzheimer’s disease, cognitive aging, mild cognitive impairment, olfactory identification, smell
Introduction
AD is the most common form of dementia leading to progressive cognitive decline. Due to its high prevalence, accessible and feasible screening and prognostic tools are needed. AD is a disease superimposed on normal aging; thus, biomarker development has been challenging in separating the disease and aging signals (1). Olfactory identification deficit (OID) is an attractive candidate, being cost effective and easy to administer without the need for specific training (2,3).
OID has been implicated in both AD and aging (4). AD-associated signals have been detected beyond the age association (5), despite the noise in the data from factors affecting the nasal passages (6). AD congruent pathological changes are present in the olfactory bulb and anterior olfactory nucleus (7). Prospective cohort studies have established that olfactory dysfunction infers a risk for development of cognitive impairment (8,9). In the presence of episodic memory impairment, OID predicts conversion from aMCI to AD (4,10,11).
Selective deficits in odor identification on the University of Pennsylvania Smell Identification Test (UPSIT) have been reported in AD (12, 13) and in PD (14-21). In the two AD studies, four UPSIT items (clove, strawberry, lemon and soap) overlap in the top 10 most sensitive odorant sets. The PD studies reported several different odorant items, with licorice and banana being most frequently reported as disease-specific markers. The PD studies used various odor identification tests, including UPSIT, 12-odor Brief Smell Test (BSIT) and 12-odor SniffinSticks test and studied populations in Great Britain, Australia and Germany. The comparison of these studies is challenging as the differences in the odorant items in the various tools and the response alternatives are sensitive to cultural and socioeconomic factors (22).
Refining OID as a biomarker for AD requires optimization of the separation of the aging and neurodegenerative signals. The aim of this study is to explore whether the ability to recognize specific odorant items are differentially affected in aging in contrast to Alzheimer’s disease.
Methods
Research Participants
A total of 889 (242 healthy aging subjects (HA), 204 MCI, 443 AD) participants were included in this multicenter study involving six study centers in New York (University at Buffalo) and Texas (Baylor College of Medicine, Houston; Texas Tech University Health Sciences Center, University of North Texas Health Science Center; University of Texas Southwestern Medical Center; University of Texas Health Science Center – San Antonio). Recruitment at each individual site ranged from 45–268 participants. Memory disorder participants were recruited through outpatient memory clinics while the comparison group was recruited through community advertisements. Thirty-four participants (6 HA, 8 MCI, 20 AD) were excluded due to missing demographic data. The diagnosis of aMCI was made using the Petersen Criteria (23). Probable Alzheimer’s disease was diagnosed based on the National Institute of Neurological and Communicative Disorders and Stroke-Alzheimer’s Disease and Related Disorders Association (NINCDS-ARDRA) criteria (24). Clinical diagnoses were confirmed by consensus among the clinical team at each study site. Additionally, data from each site were reviewed at the time of data entry to ensure appropriate diagnosis. Enrollment methodology has been previously described (12, 25). Exclusion criteria included MMSE at enrollment <16, Hachinski score >4 (26), clinical or imaging evidence of stroke, and participants with active cold or allergies, as these may be influence olfactory function. The comparison group consisted of non-demented participants meeting the following criteria: >65 years of age, normal performance on activities of daily living and Clinical Dementia Rating scale score of 0, as assessed by a surrogate. The comparison cohort also underwent neuropsychological testing (NPT) and were excluded if any measure had a Z score <−1.5.
Institutional review and participant consent
Institutional review boards at each study site reviewed and approved the study. Written informed consent was obtained from each research participant. As this study enrolled a vulnerable population, participants with an MMSE score <18 provided verbal assent following written consent by a legally authorized representative.
University of Pennsylvania Smell Identification Test
University of Pennsylvania Smell Identification Test (UPSIT; Sensonic International, Haddon Heights, NJ) was used to measure odorant identification performance at the time of enrollment, within 3 months of baseline NPT assessment (3). The UPSIT is a 40-item scratch and sniff odorant identification multiple choice test with forced selection. The UPSIT was administered by a study staff member who was blinded to clinical diagnosis.
Neuropsychological testing
Demographic information, including age, sex, race, ethnicity, history of smoking in pack-years and history of head trauma were collected. The following neuropsychological test domains were evaluated: global cognitive functioning/status (MMSE and Clinical Dementia Rating), attention (Digit Span and Trail-Making Test Part A), executive function (Trail-Making Test Part B), memory (Wechsler Memory Scale (WMS3 or –R), Logical Memory I story A and WMS3 or R Logical Memory II story A), language (Boston Naming Test and FAS Verbal Fluency), estimated premorbid IQ (North American Adult Reading Test), visuospatial memory (WMS-Visual Reproduction I and II), psychiatric (Geriatric Depression Scale), functional assessment (Lawton-Brody Activities of Daily Living, Physicians Self Maintenance Scale and Instrumental Activities of Daily Living) (27-35). Testing was administered by a board-certified neuropsychologist or by research staff under the supervision of a neuropsychologist. The personnel administering the NPT battery was blinded to UPSIT performance and clinical diagnosis.
ApoE genotyping
Genomic DNA was extracted from whole blood with the Puregene DNA isolation Kit (Qiagen). ApoE genotyping was performed using real-time on a BI 7900HT thermal cycler (Applied Biosystem, Inc). The custom TaqMan probes (Applied Biosystems, INC) were unique to single nucleotide polymorphism at nucleotide position 112(rs7412) and 158 (rs429358) of the ApoE gene, respectively. The combination of alleles at the 2 polymorphism determined the ApoE genotype.
Longitudinal arm
One hundred and sixteen participants with aMCI had follow-up with at least a 1-year post-baseline interval. Repeat NPT and clinical assessment was performed. Based on NPT performance, Petersen and NINCDS-ADRDA criteria and repeat consensus conference, clinical diagnoses were revised. Conversion from aMCI to AD was made if NINCDS-ADRDA criteria were met on follow-up (24) while backward conversion to “normal” status was made if a participant no longer met the criteria for aMCI (12).
Statistical Analysis
Demographic characteristics including age, MMSE and years of education were analyzed using an ANOVA with post hoc testing employing Fisher’s LSD test. Age at onset was analyzed with a two-sided student’s t-test. APOE4 allele frequency and sex were analyzed using a Chi square test. Statistical analyses were performed using the R project for statistical computing with specific codes written by a co-author (LY) (36).
Based on the 40-item UPSIT, Age-10 and AD-10 were established using regression models. This analysis used 10 odorant items for consistency with our previous study in which the spread and variance of 10 odorants achieved the statistical power to detect an association with relatively few test items. Furthermore, 10 odorants were selected to optimize time of administration (12). Since both AD and age are associated with OID, we developed two models to separate the age- and disease-associated signals. AD-10 was selected based on ordinal logistic regression models with response of three categories as covariates (HA, MCI, and AD), using each odorant item as predictor and age as covariate. The significance of the coefficient of each odorant item was used as the indicator of the effect of that item after controlling the age effect. Age-associated odorant items (Age-10) were identified using a linear model with diagnostic categories as covariate.
Stepwise selection based on Akaike information criterion (AIC) was used to select models that best fit the data. The relationship between the 40 UPSIT items was explored by polychoric correlation. Because the data offered two binary responses, i.e. whether an individual odorant was detected (yes/no), a tetrachoric correlation (a special case of the polychoric correlation) was used. Each of the 40 items in the UPSIT was grouped based on their agreement to these two factors.
The ability of AD-10 and Age-10 to differentiate between AD and HA was tested by nonparametric bootstrapping of the average difference of the scores between the AD and HA groups over the age spectrum, corresponding to the vertical separation of the two fitted lines We used nonparametic bootstrapping (with 50000 iterations) to obtain the estimate and confidence interval of the difference between the two fitted lines in age- and AD-related odorant items, as well as the difference of these differences for AD-10 and Age-10, in order to obtain more robust results. The use of standard Z-test based methods may not be optimal, because there maybe deviation from normality in our model due to the nature of our data. No correction was performed because the test was nonparametric. This method was selected to develop a more robust evaluation of the difference of the two fitted lines in age- and AD-related odorant items. We examined whether performance on Age-10 and AD-10 correlated with the neuropsychological endophenotype using linear regression models and age, sex, years of education and number of ApoE4 alleles as covariates. A Bonferroni correction by a factor of 12 was used to correct for multiple comparisons (12 NPT measures tested).
To measure the performance of AD-10 or Age-10 for predicting conversion to AD, we used an ordinal logistic regression (3 outcomes: aMCI change to HA, remain aMCI, and convert to AD) with age, gender and ApoE4 allele count as covariates. ROC/AUC was calculated for the clinically significant event (conversion to AD). Unit wise hazard ratio (HR) for conversion to AD was calculated based on a log rank test. Competing risk analysis was performed and Cumulative Incidence Function (CIF) was plotted to depict the probability of aMCI subjects reversing to HA or converting to AD over time. Furthermore, performance on the AD-10 and Age-10 was compared amongst the following groups: aMCI to HA (reversers), aMCI to AD (convertors) and participants who remained in the aMCI group at follow-up (no change) using a one-way ANOVA with a post hoc Fisher LSD test.
RESULTS
Demographic characteristics are presented in Table 1. APOE frequencies in each disease category were similar to previous reports and consistent with the diagnostic group expectations. Age and sex were not equally distributed between comparison and disease groups.
Table 1. Demographic Information.
Demographic information for participants (234 HA, 192 aMCI, 415 AD). Significant differences in age, Mini Mental Status Examination (MMSE), Years of Education, University of Pennsylvania Smell Identification Test (UPSIT), Age-10 and AD-10 smells were calculated using a one-way ANOVA with a post hoc Fisher LSD test. Significant difference in Age at Onset was calculated using a one-sided Student’s t-test. Sex and number of ApoE4 alleles were calculated using a Chi-square test.
| HA (n=234) | aMCI (n=192) | AD (n=415) | |
|---|---|---|---|
| Age, mean (SD) | 71.26 (8.05)a,b | 73.18 (9.05)c | 74.60 (8.54) |
| Age at Onset, mean (SD) | N/A | 66.92 (14.99) | 68.09 (12.38) |
| Years of Education, mean (SD) | 15.64 (3.40)a,b | 13.65 (5.49) | 14.05 (4.39) |
| MMSE, mean (SD) | 28.75 (3.52)a,b | 27.15 (3.51)c | 22.76 (4.25) |
| Sex, n(%) | |||
| Male | 84 (35.9)a,b | 104 (54.2) | 198 (47.7) |
| Female | 150 (64.1)a,b | 88 (45.8) | 217 (52.3) |
| ApoE4 Alleles, n (%) | |||
| 0 | 179 (76.8)a,b | 102 (54.8)c | 148 (36.0) |
| 1 | 51 (21.9)a,b | 69 (37.1)c | 195 (47.5) |
| 2 | 3 (1.3)a,b | 15 (8.1)c | 68 (16.5) |
| 40-item UPSIT, mean (SD) | 32.19 (5.36)a,b | 26.98 (8.00)c | 19.36 (9.12) |
| AD-10, mean (SD) | 8.40 (1.61)a,b | 6.80 (2.61)c | 4.81 (2.35) |
| Age-10, mean (SD) | 8.09 (1.72)a,b | 6.80 (2.34)c | 4.32 (2.33) |
= significant difference between HA and aMCI;
= significant difference between HA and AD;
= significant difference between aMCI and AD
Age: df= (2,838), HA vs. aMCI, p=0.027; HA vs. AD, p<0.001; aMCI vs. AD, p=0.036
Years of education: df= (2,788), HA vs. aMCI, p = 0.018, HA vs. AD, p<0.001
MMSE: df=(2,830), HA vs aMCI, p<0.001, HA vs. AD, p<0.001, aMCI vs. AD, p<0.001
Sex: df=2, p<0.001
ApoE4 Alleles: df=4, p<0.001
UPSIT: df = (2,838), HA vs aMCI, p<0.001, HA vs. AD, p<0.001, aMCI vs. AD, p<0.001
AD-10: df = (2,838), HA vs aMCI, p<0.001, HA vs. AD, p<0.001, aMCI vs. AD, p<0.001
Age-10: df = (2,838), HA vs aMCI, p<0.001, HA vs. AD, p<0.001, aMCI vs. AD, p<0.001
The regression analyses for age (covariate: disease) and for AD (covariate: age) identified distinct sets of odorant items with one overlap (Table 2). AD-10 was superior in differentiating between AD and HA corresponding to the vertical separation of the two fitted lines (nonparametric bootstrapping, p <0.001) (Figure 1). Examining the relationships between performance on AD-10 and Age-10 demonstrated that performance declines with increasing age on both subsets, with HAs performing better than participants with AD. An estimation of the difference in performance on the two subsets shows a mean difference of 3.93 (CI=3.61–4.24) and 3.02 (CI=2.71–3.33) for AD-10 and Age-10, respectively. The mean difference between these (difference of the difference) is 0.91 (CI=0.63–1.19), nonparametric bootstrapping p<0.001.
Table 2. Top 10 Scents for Disease and Age.
Top disease-associated smells (AD-10) and top age-associated smells (Age-10) were identified from the University of Pennsylvania Smell Identification Test (UPSIT). AD-10 smells were identified using an ordinal logistic regression, using age and smells (0/1 categorical) as covariates while Age-10 was identified using a linear regression models were built with diagnosis categories as covariate. Stepwise selection based on AIC was used to select models that best fit the data. P values are reported utilizing a bootstrapping method.
| AD-10 | Age-10 | ||
|---|---|---|---|
| Scent | p value | Scent | p value |
| s30 (watermelon) | >0.001 | s21 (lilac) | >0.001 |
| s37 (soap) | >0.001 | s1 (pizza) | >0.001 |
| s39 (rose) | >0.001 | s6 (mint) | >0.001 |
| s12 (fruit punch) | >0.001 | s15 (cinnamon) | >0.001 |
| s22 (turpentine) | >0.001 | s28 (orange) | >0.001 |
| s34 (pine) | >0.001 | s23 (peach) | >0.001 |
| s25 (dill pickle) | >0.001 | s11 (onion | >0.001 |
| s17 (strawberry) | >0.001 | s20 (ginger) | >0.001 |
| s35 (grape) | >0.001 | s2 (bubble gum) | >0.001 |
| s29 (wintergreen) | >0.001 | s30 (watermelon) | 0.208 |
Figure 1.
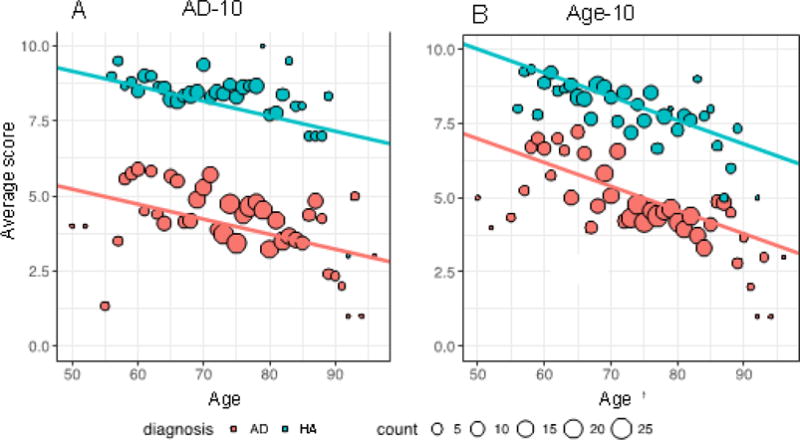
The average score on the disease-associated (AD-10) and age–associated (Age-10) subsets of the University of Pennsylvania Smell Identification Test (UPSIT) are plotted across age spectrum. Panel A shows AD-10; Panel B shows Age-10 scores in the context of the age spectrum. Alzheimer’s disease (AD) participants are shown in pink while HA are shown in blue. Dot size indicates the number of participants of each discrete age. Slope of the lines of best fit are: Panel A: −0.04 points/year; Panel B: −0.09 points/year.
In order to assess inter-site differences, we used a stratified ANOVA for testing whether there’s site difference in total UPSIT scores by different disease groups. Kruskal-Wallis tests were used, the p-values for AD, MCI and comparison groups are 0.171 (χ2 = 9.044, df=6), 0.056 (χ2 = 12.279, df=6), 0.064 (χ2 = 11.899, df=6), respectively. All the p-values are non-significant, indicating that there are no statistical differences among sites when scoring within each group.
Next, we studied the cognitive endophenotype associated with the AD-10 and Age-10 subsets. OID measured by AD-10 was associated with performance on the neuropsychological assessments across multiple cognitive domains (Boston Naming Test, Category fluency, Logical Memory 1, Logical Memory 2, Trail Making Tests A and B). Age-10 was associated with performance in a more restrictive pattern, sparing executive function (Boston Naming Test, Category Fluency, Logical Memory 1, Logical Memory 2) (Table 3).
Table 3. Correlation with Neuropsychological Test Performance.
Performance on neuropsychological testing was correlated with performance on the AD-10 and Age-10 using a linear regression test with age, sex, years of education and number of ApoE4 alleles added as covariates. A Bonferroni correction of 12 was used to correct for multiple comparisons. Statistically significant associations are noted by bold and italic font. Neuropsychological tests include Trail-Making Test A (TMT-A), Trail-Making Test B (TMT-B), FAS Verbal fluency letters (Let Fl), FAS Verbal fluency categories (Cat Fl), Boston Naming Test (BNT), WMS3 or –R Logical Memory I Story A (LM 1), WMS3 or –R Logical Memory II Story A (LM 2), WMS-Visual Reproduction I (VR 1), WMS-Visual Reproduction II (VR 2), maximum digit span forward (DSmF), maximum digit span backward (DSmB), North American Adult Reading Test (EstIQ).
| AD-10 | Age-10 | |||||||||
|---|---|---|---|---|---|---|---|---|---|---|
| Test | Degrees of Freedom | Estimate | Std Error | T | p | Degree s of Freedom | Estimate | Std Error | T | p |
| TMT-A | 722 | −1.593 | 0.463 | −3.438 | 0.012 | 722 | −1.079 | 0.472 | −2.288 | 0.264 |
| TMT-B | 637 | −4.381 | 1.35 | −3.246 | 0.012 | 637 | −3.125 | 1.344 | −2.326 | 0.240 |
| Let Fl | 739 | 0.404 | 0.211 | 1.915 | 0.672 | 739 | 0.285 | 0.213 | 1.339 | >0.9 |
| Cat Fl | 743 | 0.24 | 0.084 | 2.85 | 0.048 | 743 | 0.311 | 0.084 | 3.698 | <0.001 |
| BNT | 746 | 0.864 | 0.156 | 5.535 | <0.001 | 746 | 0.715 | 0.158 | 4.518 | <0.001 |
| LM 1 | 716 | 0.306 | 0.061 | 5.045 | <0.001 | 716 | 0.288 | 0.061 | 4.76 | <0.001 |
| LM 2 | 720 | 0.274 | 0.063 | 4.325 | <0.001 | 720 | 0.232 | 0.063 | 3.662 | <0.001 |
| VR 1 | 64 | 0.439 | 0.416 | 1.055 | >0.9 | 64 | 0.194 | 0.423 | 0.458 | >0.9 |
| VR 2 | 65 | 0.141 | 0.447 | 0.316 | >0.9 | 65 | −0.03 | 0.449 | −0.066 | >0.9 |
| DSm F | 747 | 0.007 | 0.021 | 0.35 | >0.9 | 747 | 0.025 | 0.021 | 1.19 | >0.9 |
| DSm B | 746 | 0.044 | 0.021 | 2.083 | 0.456 | 746 | 0.005 | 0.021 | 0.252 | >0.9 |
| EstIQ | 700 | 0.204 | 0.162 | 1.26 | >0.9 | 700 | 0.017 | 0.164 | 0.103 | >0.9 |
A tetrachoric correlation revealed that odorant items most highly associated with disease status were tightly clustered (s30, s37, s17, s39, s12, s29 and s35 (Figure 2)). In addition, four AD-associated odorant items were identified in four separate clusters suggesting independence of these items from each other.
Figure 2.
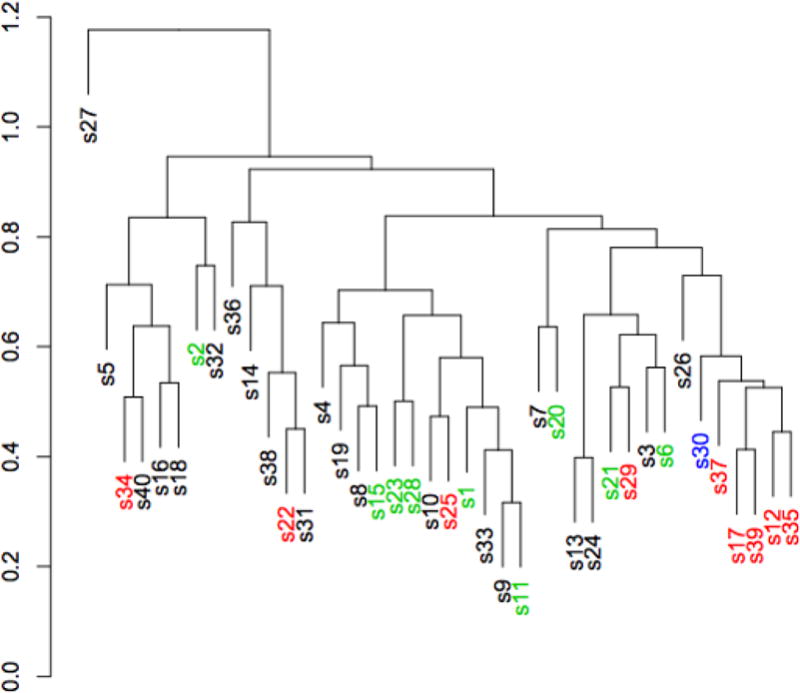
A tetrachoric correlation analysis of the University of Pennsylvania Smell Identification Test (UPSIT) was performed. Each of the 40 odorants is represented as the number it appears on the test preceded by the letter s, e.g. s1. Odorants written in red are disease-associated (AD-10) while those in green are age-associated (Age-10). The one odorant in blue is included on both lists.
The utility of Age-10 and AD-10 for predicting progression of disease was tested on the longitudinal study by ordinal logistic regression with three outcomes. Worse performance on AD-10 was predictive of conversion from aMCI to AD (OR=0.770, 95% CI=0.657–0.985, z= −3.318, df=109, p=0.0009), as was performance on the complete UPSIT (OR=0.932, 95% CI=0.885–0.978, z= −2.796, df=109, p=0.005). Performance on Age-10 was not predictive of conversion (OR=0.858 (95% CI=0.730–1.000, df=109, p=0.054). ApoE4 was included in the prediction models and OID was independent of ApoE4. There were significant differences between scores on AD-10 between the group that converted from aMCI to AD and the group that had no change in diagnosis as well as between the group that reversed back to HA and the group that converted. The mean time to follow-up was 831 days (SD=403 days), with a range of 231 to 1628 days to follow-up. The time to follow-up in the ‘no change’ group was longer than in the ‘reversers’ and ‘convertors’(Table 4). AD-10 predicted conversion from aMCI to AD (AUC=0.634) (Figure 4). Loss of 1 item on AD-10 conferred a HR of 1.18 (CI 1.05–1.32; Z=7.93, df=1, p=0.005) for conversion. The competing risk analysis showed a significant separation between AD and HA outcomes over time. (Figure 3).
Table 4. Prediction of Disease Progression in aMCI group.
Prediction of conversion from amnestic mild cognitive impairment (aMCI) to Alzheimer’s disease (AD) or reversion to healthy adults (HA). 116 aMCI participants were included in this longitudinal analysis. A one-way ANOVA with a post hoc Fisher LSD test was used.
| Conversion status | Reversers to HA | No change | Convertors to AD |
|---|---|---|---|
| N | 17 | 56 | 43 |
| Follow-up duration, days (SD) | 693 (403)a | 977 (408) | 697 (333) |
| AD-10, mean (SD) | 8.65 (1.17)b | 7.52 (2.42)c | 6.51 (2.75) |
| Age-10, mean (SD) | 8.24 (1.20)b | 7.43 (2.40) | 6.70 (2.59) |
= significant difference between ‘reversers’ and ‘no change’;
= significant difference between ‘reversers’ and ‘convertors’;
= significant difference between ‘no change’ and ‘convertors.’
Follow-up duration: df=2,113, F=7.827, p=0.001; AD-10: df=2,113, F=5.150, p=0.007; Age-10: df=2,113, F=2,856, p=0.062;
Post-hoc LSD:
Follow-up duration: Reversers vs no change, p=0.008; Reversers vs converters, p=0.969; Converters vs no change, p<0.001; AD-10: Reversers vs no change, p=0.094; Reversers vs converters, p=0.042; Converters vs no change, p=0.003
Age-10: Reversers vs no change, p=0.216; Reversers vs converters, p=0.127; Converters vs no change, p=0.024.
Figure 4.
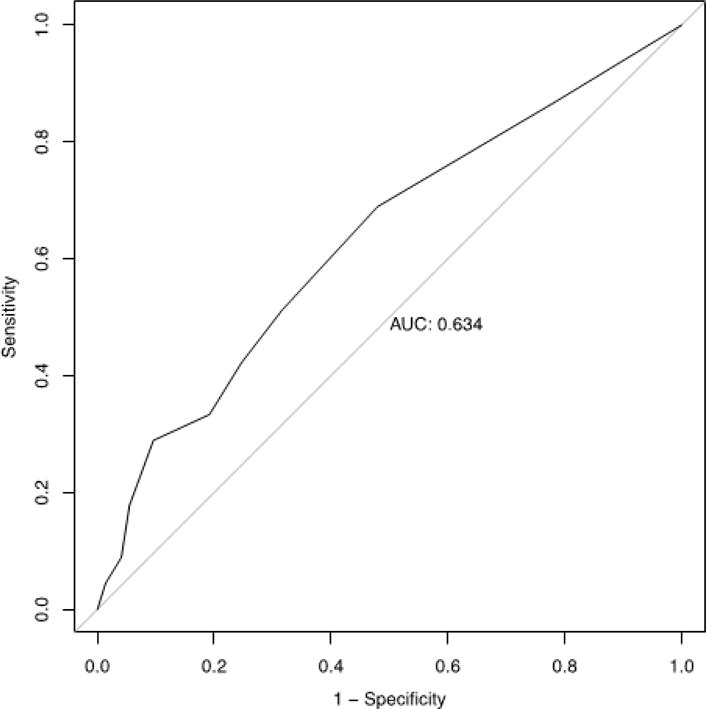
Receiver-operator curve is shown for disease-associated odorants (AD-10) performance by 116 amnestic mild cognitive impairment (aMCI) participants as a prediction of conversion to Alzheimer’s disease (AD) within 2 years. Area under the curve is 0.634.
Figure 3.
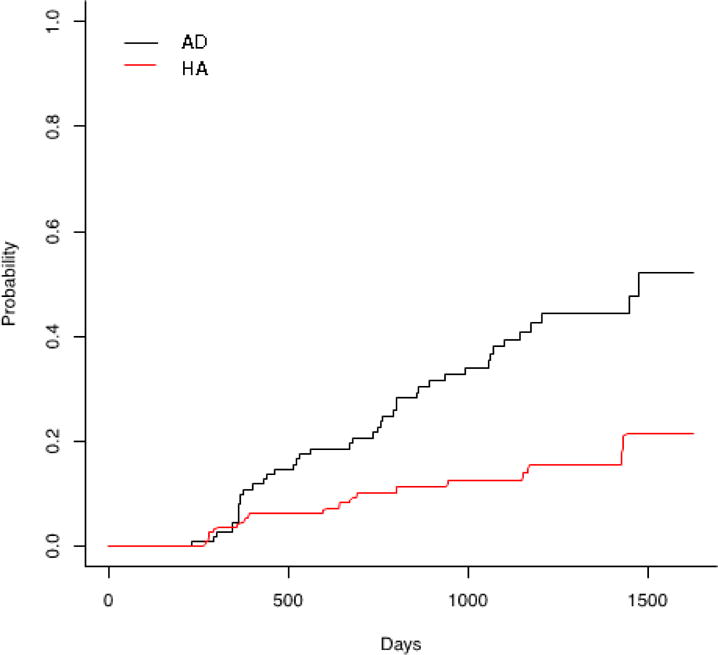
A competing risk analysis shows conversion of aMCI participants to AD or reversion to HA. Conversion to AD is noted by the black solid line, reversion to HA is noted by a red dashed line.
DISCUSSION
OID is an age-dependent phenomenon as evidenced by lower performance on the UPSIT in participants with more advanced age. AD-10 and Age-10 only overlapped on a single item. The diagnostic categories had parallel curves over the age spectrum; the AD subjects had worse OID compared to their age-matched peers. AD-10 outperformed Age-10 in separating AD from HA. While this could be interpreted as a result of the selection method and needs confirmation in independent dataset, the predictive value for conversion to AD in the longitudinal component independently validates these findings and suggests utility in an important clinical application. Briefly, 10-item subsets of UPSIT have previously been proposed however comparison to age-associated odorant items has not been reported. There was significant overlap between the 10-item subsets previously proposed (12, 13). One age-associated odorant item (s21) was present in the previously reported list published by Tabert, et al (13). Seven of the 10 items from our previous study were found to be most highly associated with AD (s12, s17, s22, s25, s34, s37 and s39), controlling for age. Of interest, none of the previously proposed disease-associated odorant items we reported were found to be highly associated with age, once the effects of disease were taken into account (12, 13).
We sought to further validate our findings by assessing how OID correlated with the cognitive endophenotype. The AD-10 was associated with a broader range of cognitive domains, including language, verbal memory and executive function after controlling for age, sex, years of education, number of ApoE4 alleles and diagnostic group. The Age-10 associated domains were more restricted and included language and logical memory. These findings suggest that AD-10 is correlated with a more advanced prodromal AD phenotype (multidomain aMCI) and this may contribute to the enrichment of conversion events in this group. We have previously shown that OID precedes the visual memory impairment in aMCI and is associated with right mesial temporal atrophy (37-40).
The tetrachoric correlation revealed that seven of the ten odorant items most highly associated with disease status were tightly clustered, particularly the following odorants: s30, s37, s17, s39, s12, s29 and s35 (Figure 1). The tight clustering raises the possibility of relatedness at one of the elements of the olfactory pathway, such as shared or overlapping ORs, or related pathophysiology in the neuroanatomical pathway for OID. These tightly clustered odorants are enriched for food items and are pleasant in nature, without significant mucosal irritation (6). Alternatively, odorant intensity may contribute to the specificity of the OID. Odor intensity depends on odorant concentration, valence and quality and is an active area of research (41). Deciphering the contribution of odorant intensity to OID in the multi-molecular odorant UPSIT would require the measurement of intensity of the test items which was not done in this study and would require specifically designed studies to address this question. Four additional AD-associated odorants were identified in four separate clusters in the tetrachoric correlation suggesting independence of these odorant items from each other.
One clinically relevant application of OID is its utility to enrich for prodromal AD and converters, thus increasing robustness of clinical trial designs. We contrasted Age-10 and AD-10 for their ability to predict progression of disease measured as conversion from aMCI to AD. Lower performance on AD-10 was predictive of conversion from aMCI to AD independent of ApoE4, as was the case for performance on the complete UPSIT. In contrast, performance on Age-10 was not predictive of conversion, however, the p value was close to significant. Scores on AD-10 were different in comparison to no change in diagnosis and converters to reversers. AD-10 predicted the clinically relevant event, conversion from aMCI to AD with a modest AUC. The competing risk analysis showed a significant separation between AD and HA outcomes over time. The length of follow-up was in fact longer in the unchanged group than in converters or reversers, thus observational bias is unlikely. This is of particular clinical significance in that utilization of these tests might be useful as a prognostic tool to stratify patients at higher risk of disease progression vs. those who are more stable. Furthermore, identification of patients with aMCI at higher risk to convert to AD could be used to increase the robustness of clinical trials of disease modifying therapies. The International Working Group recommends the use of the free and cued selective reminding test (FCSRT) to enrich for prodromal AD. The FCSRT is a neuropsychological measure that requires training and takes approximately 15 minutes to administer (42). In contrast, the 10-item OID takes 5 minutes to administer and does not require training. The relationship between these predictors is unclear and further studies are needed to evaluate whether they measure the same attributes of risk of conversion or whether they measure independent components.
Strengths of this study include large sample size from multiple study sites. Additionally, we were able to collect follow-up data on 116 of the 192 aMCI participants, which provided a large longitudinal arm to our primary cross-sectional analysis. We also had a robust set of supplementary clinical data including neuropsychological testing performance to potentially validate AD-10 and Age-10. Limitations include differences in mean age between diagnostic groups, although we controlled for this variability by adding age as a covariate into the models. Additionally, this analysis was limited to a cohort of English speaking North Americans. Results of these particular disease- and age-associated odorants may not be generalizable as we were unable to assess cultural differences in odor identification. Because olfactory dysfunction is a multifactorial process, relating not only to age and neurodegeneration secondary to AD, but also to numerous other organic causes, there is significant inherent noise in the data. A replication study, in an independent cohort, is necessary to validate these results and, in particular, further assess the predictive value of the Age-10 and AD-10 in conversion from aMCI to AD.
Deficits in odor identification in the context of AD are well established, however, one of the challenges in using on OID tool for screening for AD is the confounding age-related change in odorant sensation. Non-overlapping odorant items are associated with age and disease suggesting that odorant specific OID may reflect a distinct underlying mechanism. While applicability for screening requires further work, in the context of an amnestic disorder, it has an important role in predicting conversion to AD; thus, it may serve as a tool to enrich clinical trials for disease modifying therapy. Additional studies are needed to refine the OID with monomolecular stimulation, by measuring unilateral OID (43) and, validation with orthogonal biomarkers such as amyloid PET scan.
Highlights.
Screening for amnestic disorder must differentiate from changes associated with normal aging.
Using an odorant identification test, we identified specific odorants which failure to identify best predicts amnestic disorder vs. normal aging. The identified odorants were validated with performance on neuropsychological testing and prediction of conversion from amnestic mild cognitive impairment to Alzheimer’s disease.
Olfactory identification impairment was associated with poor performance in numerous cognitive domains and was predictive of progression of mild cognitive impairment.
Olfactory identification order can be utilized for risk stratification of progression from aMCI to AD and to enrich screening for clinical trials of potential disease modifying therapies.
Acknowledgments
Texas Alzheimer’s Research and Care Consortium List of Investigators: Investigators from the Texas Alzheimer’s Research and Care Consortium: Baylor College of Medicine: Valory Pavlik PhD, Paul Massman PhD, Eveleen Darby MA/MS, Monica Rodriguear MA, Aisha Khaleeq Ansari MD; Texas Tech University Health Sciences Center: John C. DeToledo MD, Hemachandra Reddy PhD, Henrick Wilms MD, PhD, Kim Johnson PhD, Victoria Perez; University of North Texas Health Science Center: Thomas Fairchild PhD, Janice Knebl DO, Sid E. O’Bryant PhD, James R. Hall PhD, Leigh Johnson PhD, Robert C. Barber PhD, Douglas Mains DrPH, Lisa Alvarez; University of Texas Southwestern Medical Center: Munro Cullum PhD, Roger Rosenberg MD, Benjamin Williams MD, PhD, Mary Quiceno MD, Joan Reisch PhD, Linda S. Hynan PhD, Ryan Huebinger PhD, Janet Smith, Trung Nguyen MD, PhD; University of Texas Health Science Center – San Antonio: Donald Royall MD, Raymond Palmer PhD, Marsha Polk; Texas A&M University Health Science Center: Alan Stevens PhD, Marcia Ory PhD/MPH; University of Texas at Austin/Dell Medical School: David Paydarfar MD, John Bertelson MD, Martin Woon PhD, Gayle Ayres DO; Alyssa Aguirre LCSW; University of North Carolina: Kirk C. Wilhelmsen MD, PhD, Jeffrey L. Tilson PhD.
Funding Support:
RHB Benedict has acted as a consultant or scientific advisory board member for Bayer, Biogen Idec, Actelion, and Novartis. He receives royalties from Psychological Assessment Resources, Inc. He has received financial support for research activities from Shire Pharmaceuticals, Accorda and Biogen Idec.
K. Szigeti serves as Associate Editor for Journal of Alzheimer’s Disease and on the editorial board of BBA Clinical; serves as Director, Alzheimer’s Disease and Memory Disorders Center, University at Buffalo (20% effort); and receives/has received research support from NIH/NIA, Alzheimer Association, Community Foundation of Greater Buffalo Edward A. and Stephanie E. Fial Fund, and Western New York Stem Cell Grant.
Sources of support:
Partially supported by NIH/NIA K23 AG036852 (K.S.)
Footnotes
Publisher's Disclaimer: This is a PDF file of an unedited manuscript that has been accepted for publication. As a service to our customers we are providing this early version of the manuscript. The manuscript will undergo copyediting, typesetting, and review of the resulting proof before it is published in its final citable form. Please note that during the production process errors may be discovered which could affect the content, and all legal disclaimers that apply to the journal pertain.
Previous Presentation:
Woodward, MR, Hafeez, M, Hayyat, U, Ahmed, A, Hagemeier, J, Yan, L, Qi, Q, Benedict, RHB, Zivadinov, R, Szigeti, K. Characterization of olfactory identification deficit in aging vs. Alzheimer’s disease. American Association for Geriatric Psychiatry Meeting Poster Session, Washington, DC, March 2016.
Conflicts of Interest:
M. Woodward has no interests to disclose.
M. Hafeez has no interests to disclose.
Q. Qi has no interests to disclose.
A. Riaz has no interests to disclose.
L. Yan has no interests to disclose.
Contributors:
Dr. Woodward – Study concept and design, analysis and interpretation of data, writing of manuscript
Dr. Hafeez – Collection of data, analysis, writing of manuscript
Ms. Qi – Analysis of data
Dr. Riaz– Collection of data, analysis, writing of manuscript
Dr. Benedict- Study concept and design, analysis and interpretation
Dr. Yan - Study concept and design, analysis of data
Dr. Szigeti - Study concept and design, analysis and interpretation of data, writing of manuscript, supervision of study
References
- 1.Sun GH, Raji AC, Maceachern MP, Burke JF. Olfactory identification testing as a predictor of the development of Alzheimer’s dementia: a systematic review. Laryngoscope. 2012 Jul;122(7):1455–1462. doi: 10.1002/lary.23365. [DOI] [PubMed] [Google Scholar]
- 2.Doty RL. Office procedures for quantificative assessment of olfactory function. Am J Rhinol. 2007 Jul-Aug;21(4):460–473. doi: 10.2500/ajr.2007.21.3043. [DOI] [PubMed] [Google Scholar]
- 3.Doty RL, Shaman P, Dann M. Development of the University of Pennsylvania Smell Identification Test: a standardized microencapsulated test of olfactory function. Physiol Behav. 1984;32:489–502. doi: 10.1016/0031-9384(84)90269-5. [DOI] [PubMed] [Google Scholar]
- 4.Peters JM, Hummel T, Kratzsch T, Lotsch J, Skarke C, Frolich L. Olfactory function in mild cognitive impairment and Alzheimer’s disease: an investigation using psychophysical and electrophysiological techniques. Am J Psychiatry. 2003;160:1995–2002. doi: 10.1176/appi.ajp.160.11.1995. [DOI] [PubMed] [Google Scholar]
- 5.Rahayel S, Frasnelli J, Joubert S. The effect of Alzheimer’s disease and Parkinson’s disease on olfaction: a meta-analysis. Behav Brain Res. 2012 May 16;23(1):60–74. doi: 10.1016/j.bbr.2012.02.047. [DOI] [PubMed] [Google Scholar]
- 6.Doty RL. The olfactory system and its disorders. Semin Neurol. 2009;29:74–81. doi: 10.1055/s-0028-1124025. [DOI] [PubMed] [Google Scholar]
- 7.Ohm TG, Braak H. Olfactory bulb changes in Alzheimer’s disease. Acta Neuropathol. 1987;73:365–369. doi: 10.1007/BF00688261. [DOI] [PubMed] [Google Scholar]
- 8.Graves AB, Bowen JD, Rajaram L, et al. Impaired olfaction as a marker for cognitive decline: interaction with apolipoprotein E epsilon4 status. Neurology. 1999;53:1480–1487. doi: 10.1212/wnl.53.7.1480. [DOI] [PubMed] [Google Scholar]
- 9.Schubert CR, Carmichael LL, Murphy C, Klein BE, Klein R, Cruickshanks KJ. Olfaction and the 5-year incidence of cognitive impairment in an epidemiological study of older adults. J Am Geriatr Soc. 2008;56:1517–1521. doi: 10.1111/j.1532-5415.2008.01826.x. [DOI] [PMC free article] [PubMed] [Google Scholar]
- 10.Devanand DP, Michaels-Marston KS, Liu X, et al. Olfactory deficits in patients with mild cognitive impairment predict Alzheimer’s disease at follow-up. Am J Psychiatry. 2000;157:1399–1405. doi: 10.1176/appi.ajp.157.9.1399. [DOI] [PubMed] [Google Scholar]
- 11.Devanand DP, Lee S, Manly J, et al. Olfactory deficits predict cognitive decline and Alzheimer dementia in an urban community. Neurology. 2015;84:182–189. doi: 10.1212/WNL.0000000000001132. [DOI] [PMC free article] [PubMed] [Google Scholar]
- 12.Woodward MR, Amrutkar CV, Shah HC, et al. Validation of olfactory deficit as a biomarker of Alzheimer disease. Neurology: Clinical Practice. 2017;7:5–14. doi: 10.1212/CPJ.0000000000000293. [DOI] [PMC free article] [PubMed] [Google Scholar]
- 13.Tabert MH, Liu X, Doty RL, et al. A 10-item smell identification scale related to risk for Alzheimer’s disease. Ann Neurol. 2005;58:155–160. doi: 10.1002/ana.20533. [DOI] [PubMed] [Google Scholar]
- 14.Bohnen NI, Gedela S, Kuwabara H, et al. Selective hyposmia and nigrostriatal dopaminergic denervation in Parkinson’s disease. J Neurol. 2007;254:84–90. doi: 10.1007/s00415-006-0284-y. [DOI] [PubMed] [Google Scholar]
- 15.Bohnen NI, Gedela S, Herath P, Constantine GM. Association with hippocampal dopamine activity. Neurosci Lett. 2008;447:12–16. doi: 10.1016/j.neulet.2008.09.070. [DOI] [PMC free article] [PubMed] [Google Scholar]
- 16.Hawkes CH, Shephard BC. Selective anosmia in Parkinson’s disease? Lancet. 1993;341:435–436. [PubMed] [Google Scholar]
- 17.Silveira-Moriyama L, Williams D, Katzenschlager R. Smell testing in Parkinson’s disease in a UK population. Mov Disord. 2005;20:S139. [Google Scholar]
- 18.Double KL, Rowe DB, Hayes M, et al. Identifying the pattern of olfactory deficits in Parkinson disease using the brief smell identification test. Arch Neurol. 2003;60:545–549. doi: 10.1001/archneur.60.4.545. [DOI] [PubMed] [Google Scholar]
- 19.Daum RF, Sekinger B, Kobal G, Lang CJ. Riechprufung mit “sniffin’ sticks” zur klinischen Diagnostic des Morbus Parkinson. Nervenarzt. 2000;71:643–650. doi: 10.1007/s001150050640. [DOI] [PubMed] [Google Scholar]
- 20.Doty RL, Deems DA, Stellar S. Olfactory dysfunction in parkinsonism: a general deficit unrelated to neurologic signs, disease stage, or disease duration. Neurology. 1988;38:1237–1244. doi: 10.1212/wnl.38.8.1237. [DOI] [PubMed] [Google Scholar]
- 21.Boesveldt S, Verbaan D, Knol DL, Visser M, van Rooden SM, van Hilten JJ, et al. A comparative study of odor identification and odor discrimination deficits in Parkinson’s disease. Mov Disord. 2008;23:1984–1990. doi: 10.1002/mds.22155. [DOI] [PubMed] [Google Scholar]
- 22.Doty RL, Marcus A, Lee WW. Development of the 12-item Cross-Cultural Smell Identification Test. Laryngoscope. 1996;106(3)(Pt 1):353–6. doi: 10.1097/00005537-199603000-00021. [DOI] [PubMed] [Google Scholar]
- 23.Petersen RC, Smith GE, Waring SC, Ivnik RJ, Tangalos EG, Kokmen E. Mild cognitive impairment: clinical characterization and outcome. Arch Neurol. 1999;56:303–308. doi: 10.1001/archneur.56.3.303. [DOI] [PubMed] [Google Scholar]
- 24.Blacker D, Albert MS, Bassett SS, Go RC, Harrell LE, Folstein MF. Reliability and validity of NINCDS-ADRDA criteria for Alzheimer’s disease. The National Institute of Mental Health Genetics Initiative. Arch Neurol. 1994;51:1198–1204. doi: 10.1001/archneur.1994.00540240042014. [DOI] [PubMed] [Google Scholar]
- 25.O’Bryant SE, Waring SC, Cullum CM, et al. Staging dementia using Clinical Dementia Rating Scale Sum of Boxes scores: a Texas Alzheimer’s research consortium study. Arch Neurol. 2008;65:1091–1095. doi: 10.1001/archneur.65.8.1091. [DOI] [PMC free article] [PubMed] [Google Scholar]
- 26.Larson DB, Lyons JS, Bareta JC, Burns BJ, Blazer DG, Goldstrom ID. The construct validity of the ischemic score of Hachinski for the detection of dementias. J Neuropsychiatry Clin Neurosci. 1989;1:181–187. doi: 10.1176/jnp.1.2.181. [DOI] [PubMed] [Google Scholar]
- 27.Benton AL, Sivan AB, Hamsher K, Varney NR, Spreen O. Contributions to Neuropsychological Assessment. 2nd. Oxford University Press; 1994. [Google Scholar]
- 28.Folstein MF, Folstein SE, McHugh PR. “Mini-mental state”. A practical method for grading the cognitive state of patients for the clinician. J Psychiatr Res. 1975;12:189–198. doi: 10.1016/0022-3956(75)90026-6. [DOI] [PubMed] [Google Scholar]
- 29.Kaplan EF, Goodglass H, Weintraub S. The Boston Naming Test: Lea & Febiger. 1983 [Google Scholar]
- 30.Lawton MP, Brody EM. Assessment of older people: self-maintaining and instrumental activities of daily living. Gerontologist. 1969;9:179–186. [PubMed] [Google Scholar]
- 31.Morris JC. The Clinical Dementia Rating (CDR): current version and scoring rules. Neurology. 1993;43:2412–2414. doi: 10.1212/wnl.43.11.2412-a. [DOI] [PubMed] [Google Scholar]
- 32.Reitan RM. The relation of the trail making test to organic brain damage. J Consult Psychol. 1955;19:393–394. doi: 10.1037/h0044509. [DOI] [PubMed] [Google Scholar]
- 33.Spreen OS. E: A compendium of neuropsychological tests: Administration, norms, and commentary. 2nd. Oxford University Press; 1998. [Google Scholar]
- 34.Wechsler D. Wechsler Memory Scale - Third Edition (MWS-III) administration and scoring manual: The Psychological Corporation. 1997 [Google Scholar]
- 35.Yesavage JA. Geriatric Depression Scale. Psychopharmacol Bull. 1988;24:709–711. [PubMed] [Google Scholar]
- 36.R Core Team. R: A language and environment for statistical computing. R Foundation for Statistical Computing; Vienna, Austria: 2016. https://www.R-project.org/ [Google Scholar]; Haaland KY, Price L, Larue A. What does the WMS-III tell us about memory changes with normal aging? J Int Neuropsychol Soc. 2003;9:89–96. doi: 10.1017/s1355617703910101. [DOI] [PubMed] [Google Scholar]
- 37.Harada CN, Natelson Love MC, Triebel KL. Normal cognitive aging. Clin Geriatr Med. 2013;29:737–752. doi: 10.1016/j.cger.2013.07.002. [DOI] [PMC free article] [PubMed] [Google Scholar]
- 38.Price L, Said K, Haaland KY. Age-associated memory impairment of Logical Memory and Visual Reproduction. J Clin Exp Neuropsychol. 2004;26:531–538. doi: 10.1080/13803390490496678. [DOI] [PubMed] [Google Scholar]
- 39.Hagemeier J, Woodward MR, Rafique UA, et al. Odor identification deficit in mild cognitive impairment and Alzheimer’s disease is associated with hippocampal and deep gray matter atrophy. Psychiatry Res. 2016 Sep 30;255:87–93. doi: 10.1016/j.pscychresns.2016.08.003. [DOI] [PubMed] [Google Scholar]
- 40.Mainland JD, Lundström JN, Reisert J, Lowe G. From molecule to mind: an integrative perspective on odor intensity. Trends Neurosci. 2014;37:443–454. doi: 10.1016/j.tins.2014.05.005. [DOI] [PMC free article] [PubMed] [Google Scholar]
- 41.Lemos R, Simoes MR, Santiago B, Santana I. The free and cued selective reminding test: validation for mild cognitive impairment and Alzheimer’s disease. J Neuropsychol. 2015 Sep;9(2):242–257. doi: 10.1111/jnp.12048. [DOI] [PubMed] [Google Scholar]
- 42.Huart C, Rombaux P, Gerard T, et al. Unirhinal Olfactory Testing for the Diagnostic Workup of Mild Cognitive Impairment. J Alzheimers Dis. 2015;47:253–270. doi: 10.3233/JAD-141494. [DOI] [PubMed] [Google Scholar]