

Summary
The diversity of cell types and regulatory states in the brain, and how these change during aging, remains largely unknown. We present a single-cell transcriptome atlas of the entire adult Drosophila melanogaster brain sampled across its lifespan. Cell clustering identified 87 initial cell clusters that are further subclustered and validated by targeted cell-sorting. Our data show high granularity and identify a wide range of cell types. Gene network analyses using SCENIC revealed regulatory heterogeneity linked to energy consumption. During aging, RNA content declines exponentially without affecting neuronal identity in old brains. This single-cell brain atlas covers nearly all cells in the normal brain and provides the tools to study cellular diversity alongside other Drosophila and mammalian single-cell datasets in our unique single-cell analysis platform: SCope (http://scope.aertslab.org). These results, together with SCope, allow comprehensive exploration of all transcriptional states of an entire aging brain.
Keywords: single-cell RNA-seq, Drosophila, brain, neuronal subtypes, gene regulatory networks, aging, oxidative phosphorylation, mitochondria, single-cell bioinformatics
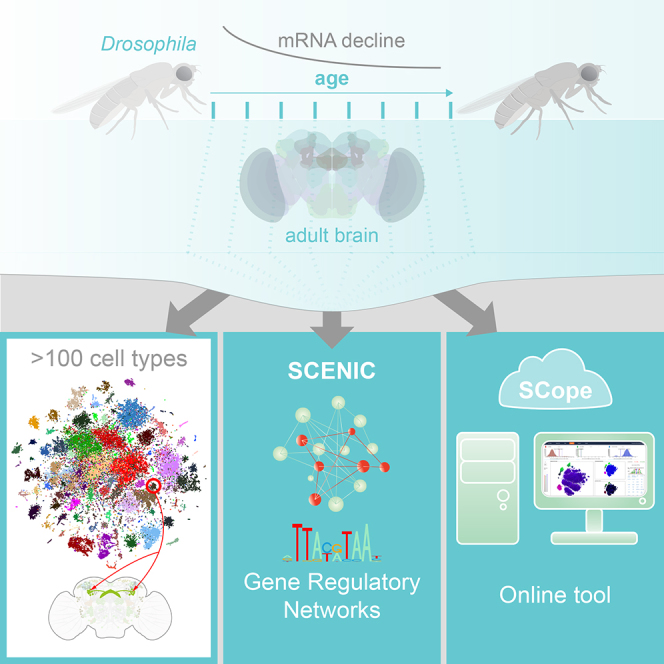
Graphical Abstract
Highlights
-
•
A single-cell atlas of the adult fly brain during aging
-
•
Network inference reveals regulatory states related to oxidative phosphorylation
-
•
Cell identity is retained during aging despite exponential decline of gene expression
-
•
SCope: An online tool to explore and compare single-cell datasets across species
A single-cell atlas of adult fly brains identifies the ensemble of neuronal and glial cell types and their dynamic changes during aging.
Introduction
Brain function depends on a complex network of specialized neuronal and glial cell types. Single-cell technologies allow mapping of this diverse cellular landscape, and single-cell RNA sequencing (scRNA-seq) performed on developing mouse and zebrafish brains (Han et al., 2018, Raj et al., 2018) and on parts of the adult fly brain (Croset et al., 2018, Konstantinides et al., 2018) have already revealed unique cell types. However, a compendium of all cell types in a complete adult brain during the lifespan of an animal has not yet been reported.
The Drosophila brain is ideal to build an atlas of cell types of a complex functioning brain because it encodes an extensive array of intricate behaviors (Owald et al., 2015) while only consisting of approximately 100,000 cells, of which 85%–90% are neurons (Kremer et al., 2017). Hundreds of neuronal types have been functionally characterized based on the morphology of their projections, their connectivity with other neurons, or their role in controlling behavior (Robie et al., 2017). However, the molecular underpinnings of these cell types, such as the active gene regulatory networks and genes expressed in each cell type, have been less studied. It is an open question as to what extent neurons that build circuits with different spatial complexities, connections, and behavioral functions are controlled by different regulatory programs or whether they act as neutral building blocks in a circuit, committed to canonical neuronal communication. Beyond the transcriptomes that underlie individual cell types, it is unknown whether brain-wide “regulatory states” exist that may be shared across multiple neuronal subtypes. Furthermore, during the lifetime of an animal, cell types and regulatory states may change, and the timing of normal and pathological loss of cell identity remains poorly described. Thus, comprehensive, unbiased brain-wide single-cell sequencing is expected to facilitate understanding of the cellular and regulatory basis of a brain and to provide insights on the gradual loss of fitness and cognition in aging (Tulving and Craik, 2005, Wyss-Coray, 2016).
Here, we built a comprehensive atlas of cell types in the entire adult Drosophila brain, yielding nearly 1× “cell-coverage.” We also developed a Drosophila database for SCENIC (Aibar et al., 2017), allowing us to map the gene regulatory networks underlying neuronal and glial types in the fly brain. In addition, we map brain-wide cell-state changes that occur during aging. Finally, we use machine-learning methods to accurately predict the age of a cell based on its gene expression profile. We make this resource of 157,000 single-cell transcriptional profiles of two Drosophila strains available in a new single-cell visualization tool, called SCope, alongside other Drosophila and mammalian single-cell atlases (http://scope.aertslab.org).
Results
Single-Cell RNA-Seq of the Adult Brain Identifies Discrete Cell Types
We applied scRNA-seq using droplet microfluidics (10x Chromium) on dissociated adult brains from animals precisely aged to eight different time points (Figure S1G; Table S1). To take genetic diversity between domesticated D. melanogaster strains into account, we dissected brains from two different lab strains. Using stringent filtering, 56,902 (57K) high-quality cells were retained from 26 runs (∼29K cells for DGRP-551 and ∼28K cells for w1118) (Figures S1D–S1F). We also created a larger dataset of 157K cells based on lenient cell filtering, combined with cells from three additional DGRP-551 runs that were performed with an alternative dissociation protocol (Figures S1A–S1C). We achieved a median sequencing depth of 53,553 sequence reads per cell, with median sequence saturation rate of 81.5%. The total number of genes detected across all cells was 12,436 protein-coding genes and 2,164 non-coding RNAs. The median number of genes per cell ranges between 1,308 (0 days) and 810 (50 days). The 57K filtered cells were clustered using Seurat (Satija et al., 2015), leading to 87–151 cell clusters, depending on the clustering resolution. We provide all clustering information, and markers for each cluster, through an online resource called SCope. In SCope, both the 57K and 157K datasets are available. In the remainder of this article, we used the 57K dataset with 87 initial clusters (Table S2). These cells were subsequently visualized by generating t-distributed stochastic neighbor embedding (t-SNE) plots (van der Maaten and Hinton, 2008) (Figure 1A; location of each cluster on the t-SNE can be found in Data S1).
Figure S1.

Comparison of Two Different Filtering Cutoffs, Related to Figure 1
(A–C) SCENIC t-SNEs of the 157K dataset (lenient filtering) colored by (A) VAChT indicating cholinergic neurons in blue, VGlut indicating glutamatergic neurons in green and Gad1 indicating GABAergic neurons in red, (B) elav indicating neurons in green and repo indicating glia in red, (C) lncRNA:noe indicating neurons in green and lncRNA:CR34335 indicating glia in red.
(D–F) SCENIC t-SNEs of the 57K dataset (stringent filtering), with aforementioned colors.
(G) Plots per 10x Chromium run indicating the cumulative fraction of UMIs, red dots indicate Cell Ranger cutoffs used for the 57K dataset (note that additional filtering by Scater was applied after the Cell Ranger cutoff), blue dots indicate our less stringent cutoffs used for the 157K dataset
Figure 1.

Diversity of the Cell Types Identified by Single-Cell RNA-Seq of the Adult Brain
(A) Annotated cell types on the Seurat t-SNE of 57K cells. AST, astrocyte-like glia; CHI, chiasm glia; CTX, cortex glia; DCN, dorsal cluster neurons; DOP, dopaminergic neurons; ENS, ensheathing glia; HE, hemocytes; IPC, insulin-producing cells; KC, Kenyon cells; OCTY, octopaminergic-tyraminergic neurons; PEP, peptidergic neurons; PR, photoreceptors; PRN, perineurial glia; SER, serotonergic; SUB, subperineurial glia; SUR, surface glia; MBON, mushroom body output neurons.
(B) Cells colored by expression of SerT (red), Tdc2 (green), and ple (blue) show SER, OCTY, and DOP clusters, respectively.
(C) Cells colored by expression of ey (red) and prt (green) show MB KC clusters.
(D) Cells colored by expression of alrm (red), wrapper (green), and Hml (blue) show AST, CTX, and HE clusters, respectively.
(E) For a subset of the annotated cell types from the central brain and the optic lobe, cellular localizations (pink) and projections (green) are illustrated. Representative genes from Seurat markers are listed (see Table S3 for the full list); TFs are shown in bold. Only one neuron per cell type is illustrated for the optic lobe cells to show the morphology.
(F) Expression levels for selected marker genes (shown by arrowheads and dashed lines) for several clusters.
(G) Heatmap shows the mapping of publicly available bulk RNA-seq data on the clusters from Seurat analysis. The source datasets are color coded (yellow, Crocker et al., 2016; red, Abruzzi et al., 2017; purple, Tan et al., 2015; orange, Li et al., 2017; blue, Konstantinides et al., 2018; green, Pankova and Borst; 2016; light blue, DeSalvo et al., 2014).
See also Figures S1 and S2 and Tables S1, S2, and S3.
We connected cell clusters to known cell types using two approaches that rely on the markers identified in the single-cell clusters (Table S3). In the first approach, we compared the identified markers for each cell cluster with previously published marker genes for known cell types. We find 24,802 cells (43.6%) that are cholinergic (VAChT), 13,296 (23.4%) glutamatergic (VGlut), and 6,177 (10.8%) GABAergic neurons (Gad1). A smaller subset of monoaminergic neurons all express the vesicular transporter-encoding gene Vmat and can be further subdivided into serotonergic (SerT), octopaminergic/tyraminergic (Tdc2), and dopaminergic (ple) neurons (Figure 1B).
We also distinguished photoreceptors (ninaC, trp, and trpl) (Bernardo-Garcia et al., 2016, Goto et al., 2003, Montell and Rubin, 1988) and multiple non-neuronal cell types based on previously published marker genes, including hemocytes (Hml) (Figure 1D). Using known markers, we identified glial subtypes such as astrocytes (alrm), cortex glia (wrapper) (Figure 1D), and surface glia (Indy) including perineurial (Vmat) and subperineurial glia (moody) (Bainton et al., 2005, Stork et al., 2012). Glia in general show high relative expression of lncRNA:CR34335, while neurons have high relative expression of lncRNA:noe (Figures S1E and S1F). In total, ∼3,600 (6.4%) glial cells are detected in the 57K dataset, compared to ∼19,000 in the 157K dataset (12.1%) (Figures S1B and S1C).
We also used known brain regions (neuropils) to identify cell types (Ito et al., 2013) (Figure 1E). The mushroom body (MB) is the center of learning and memory in flies and is comprised of Kenyon cells (KCs), expressing ey and prt (Figure 1C). Among the KCs, we could identify three clusters representing the different MB lobes by a combination of markers, namely the α/β lobe (sNPF), α′/β′ lobe (trio), and γ lobe (sNPF, trio) (Awasaki et al., 2000, Johard et al., 2008) (Figure 1F). We also identified DAT as a specific marker for the α′/β′ neurons (Figures S3G and S3H). Other groups of neurons that are identified are ∼350 Poxn-expressing cells of the protocerebral dorsal cluster and the neurons of the deutocerebral ventral cluster (Boll and Noll, 2002, Minocha et al., 2017). Additionally, expression of tup, otp, C15, and hth (Komiyama and Luo, 2007, Li et al., 2017) revealed a separate cluster for antero-dorsal and lateral olfactory projection neurons of the antennal lobe (adPNs and lPNs, respectively).
Figure S3.

Bias Analysis of the Clusters and Kenyon Cell Subclusters, Related to Figure 2
(A) Bar plots showing UMI counts across the annotated and unannotated clusters at resolution 2.
(B–F) Stacked bar plots showing biases across the Seurat clusters at resolution 2 for (B) sex (C) age (D) genotype (E) DGRP-551 replicates (F) w1118 replicates.
(G and H) Groups are normalized for the number of cells (nCells) they contain. t-SNEs (left) and heatmaps (right) showing subclustering of the cells annotated as KCs consisting of the main clusters 8 (γ KC), 22 (α/β KC), and 28 (α’/β’ KC) (G) at resolution 0.2, which results in 4 clusters and (H) at resolution 2 which results in 16 clusters. Clusters were annotated by the expression of marker genes.
(I) Stacked bar plots showing biases across the subclusters at resolution 0.2 (left) and 2 (right) for sex, age, genotype, and replicates. The groups are normalized for number of cells. Contribution of the cells from the main Seurat clusters 8, 22, and 28 is consistent with the cluster annotations. Resolution 0.2 doesn’t provide more information about subtypes of KCs and higher resolutions result in biased clustering toward the parameters shown.
In addition to the central brain, our annotation strategy allowed us to identify multiple optic lobe cell types. For example, Mi1 neurons were identified by the expression of hth and bsh (Hasegawa et al., 2011), while T1 neurons are the only neuronal type to express Eaat1 (Hamanaka and Meinertzhagen, 2010). We identified the GABAergic Pm1, Pm2, and Pm3 neurons by a combination of markers. All Pm neurons share expression of Lim3, while Vsx1 is only expressed by Pm3, and svp is expressed by both Pm1 and Pm2 (Erclik et al., 2017) (Figure 1F). Moreover, using the expression of eya, hth, and Lim1, we were able to identify separate clusters for the two types of lamina wide-field (Lawf) neurons: Lawf1 (eya and hth) and Lawf2 (eya, hth, and Lim1) (Chen et al., 2016). Finally, by using the histamine receptor ort, we identified the optic lobe cell types that receive input from the R7–R8 photoreceptors. Two clusters co-express VGlut and ort, which could be linked to Tm5c and Dm8, but a division between the two could not be made (Karuppudurai et al., 2014, Melnattur et al., 2014).
In a second approach, we compared gene expression in our single-cell clusters with previously published transcriptomes of Drosophila brain subpopulations. We fitted a regression model on pseudo-bulk data derived from our cluster marker genes, where a high weight in the model shows a high similarity between the cluster and the public data. This strategy enabled the identification of unique single-cell clusters, as shown in Figure 1G. We confirmed the previously labeled cell clusters for the KC subtypes; the olfactory projection neurons (OPNs); and the Mi1, T1, Dm8/Tm5c, and Pm neurons of the optic lobes; we also annotated several new clusters, including L1-5, T2/T3, T4/T5, Tm1/TmY8, Tm9, TmY14, and MB output neurons as well as ensheathing and chiasm glia (Figure 1G).
These efforts led to the direct annotation of 37 cell types. Most neuronal cell types with known marker gene expression could be mapped to defined single-cell clusters with few exceptions, such as the dorsal cluster neurons (DCNs), that express ato and acj6 (Hassan et al., 2000). These cells only map to a single cluster when we increase the Seurat clustering resolution from 2.0 to 8.0. Around 80 DCNs are expected in a single brain (Srahna et al., 2006), and we detect 98. Using this higher resolution, we are also able to identify the fructose-sensing neurons that co-express Gr43a and Crz (Miyamoto and Amrein, 2014). Large unannotated clusters remain at the center of our t-SNE. These cells express cholinergic, GABAergic, and glutamatergic markers but do not present outspoken gene signatures (even though their UMI [unique molecular identifer] counts are not lower than some of the more specialized cell types, suggesting that they are high-quality cells; see Figure S3A). We could nevertheless separate these large clusters by the transcription factors (TFs) D and disco. One possibility is that these cells represent “generic” neurons that serve as building blocks in circuits, specialized by neurotransmitter type, not necessarily by further sub-functionalization.
We investigated the sensitivity of our scRNA-seq by comparing the combined scRNA-seq data of all cells with bulk RNA-seq of entire brains (Figure S2A). We find a high correlation (r2 = 0.918) between the expression of genes in both datasets (Figures S2B and S2E). There are several genes not detected in the single-cell data, but these are genes that are also low in abundance in the bulk RNA-seq (Figures S2C–S2H). Next, we investigated biases to sex, genetic strain, and age of cells (Figures S3B–S3F). This revealed that all clusters except one (cluster 23) show high reproducibility between male and female brains, between genetic backgrounds, across ages, and between technical replicates. Taken together, we conclude that our single-cell dataset of the entire fly brain is of high quality. We identified 87 clusters, for which annotations and sets of specific marker genes can be explored in SCope.
Figure S2.

Correlation between Single-Cell RNA-Seq and Bulk RNA-Seq Data of Adult Fly Brains, Related to Figure 1
(A) Sample to sample correlations of single-cell replicates (sum of cells) and bulk data.
(B) Gene correlation between bulk and single-cell samples.
(C) MA plot of all bulk and single-cell data. Green box highlights lowly expressed genes significantly expressed in bulk samples.
(D) Boxplot showing median gene expression for significantly changing genes (padj ≤ 0.05, log2FC > = 2.0) between bulk and single-cell samples.
(E) Gene correlation between nuclei and single-cell samples.
(F) MA plot of all nuclei and single-cell data. Green box highlights lowly expressed, genes significantly expressed in bulk samples.
(G) Boxplot showing median gene expression for significantly changing genes (padj ≤ 0.05, log2FC > = 2.0) between nuclei and single-cell samples.
(H) Table of the top and bottom 10 genes differentially expressed between bulk/nuclei and single-cell samples.
Identification of Rare Cell Types by Targeted Cell Sorting and Subclustering
To start identifying unlabeled cell clusters and map these to specific neuronal populations, known Gal4 lines can be used to express GFP in specific populations of cells, allowing them to be FAC (fluorescence-activated cell) sorted and profiled by scRNA-seq, as previously shown for the OPNs (Li et al., 2017). We used this approach to test whether a particularly small neuronal population of only ∼9 neurons per hemisphere is present in our dataset (Figure 2A). These neurons are a subset of the dorsal fan-shaped body neurons (dFB) and are genetically targeted using R23E10-Gal4 (Figure 2A). We applied CEL-Seq2 on 22 FAC-sorted cells and two variants of SMART-Seq2 on 45 (standard protocol) and 34 (adapted protocol) cells. As expected, these three approaches detect significantly more transcripts per cell as compared to the cells in our atlas: CEL-Seq2 detects a median of 1,682 genes per cell and the two SMART-Seq2 approaches detect 2,195–4,735 transcripts per cell.
Figure 2.

Subclustering Reveals Presence of Rare Cell Types
(A) Expression pattern of R23E10-Gal4 highlighting the dFBs in the adult brain. Scale bar, 50 μm.
(B) Heatmap showing the mapping of FAC-sorted scRNA-seq on the Seurat clusters.
(C) t-SNE showing seven subclusters within cluster 61.
(D) Heatmap showing the mapping of FAC-sorted scRNA-seq on these subclusters.
(E) t-SNE showing five subclusters within the lamina cluster.
(F) Heatmap showing the mapping of the RNA-seq data of the lamina monopolar cells from Tan et al. (2015) on the lamina subclusters.
(G) t-SNE showing ICIM clustering of SMART-Seq2 data from Li et al. (2017). Clusters are colored by co-expression of selected genes.
(H) t-SNE showing ICIM subclustering of the OPN cluster. Clusters are colored by co-expression of selected genes.
(I) t-SNE showing the subclustering of dopaminergic neurons, revealing the presence of the PAM cluster by expression of Fer2.
(J) t-SNE showing the separation of octopaminergic and tyraminergic neurons in cluster 64 by expression of Tbh.
(K) Subclusters of neurons colored by co-expression of neuropeptides.
(L) Table comparing the number of cells present in our dataset with the estimated numbers from literature.
Using the regression model detailed above, we identified cluster 61 as the single best match for each of the three scRNA-seq techniques (Figure 2B). Immunofluorescence of the R23E10-Gal4-labeled cells identified around 18 neurons (Figure 2A), whereas cluster 61 contains 232 cells. We therefore hypothesized that cluster 61 may contain all dFB neurons, including other dFB types not marked by R23E10-Gal4. Indeed, when we subclustered cluster 61 using Seurat, we identified seven subclusters, of which one single subcluster specifically matched with the majority (66%) of the R23E10-Gal4-marked single cells (Figures 2C and 2D). This indicates that our whole brain dataset can be subclustered to high granularity and that rare cell types are represented.
These results prompted us to investigate whether other Seurat clusters also consisted of multiple neuronal subtypes. As indicated above, the L1–L5 neuron bulk transcriptomes mapped to cluster 20. To investigate whether we could discriminate between these cell types, we subclustered cluster 20, allowing us to identify five subclusters. Based on known markers, we identified two lamina monopolar cell types L1 (VGlut) (Kolodziejczyk et al., 2008) and L4/L5 (bsh) (Hasegawa et al., 2013) (Figure 2E). In addition, the regression model was able to map L2 and L3 to separate subclusters (Figure 2F). Previously two groups of OPNs could be identified using scRNA-seq, adPNs, and lPNs (Figure 2G) (Li et al., 2017). Utilizing the same strategy, we subclustered our 543 OPN cells and were able to identify all the subclusters reported by Li et al. (Figure 2H).
We next performed subclustering of the dopaminergic neurons, known to form eight clusters in the adult Drosophila central brain. Using Fer2 as a marker, we were able to distinguish a cluster of protocerebral anterior-medial dopaminergic cells (Figure 2I). Similarly, a cluster of Tdc2-positive cells could be subclustered into two subclusters, representing the octopaminergic (Tbh positive) and tyraminergic (Tbh negative) neurons (Figure 2J).
Another rare cell type in the brain are the peptidergic neurons. We identified one major cell cluster containing peptidergic cells, but since some other cell types also express neuropeptides, we selected all cells containing at least 100 UMIs for any gene encoding a neuropeptide and re-clustered the resulting 1,269 cells. This allowed us to identify multiple specific peptidergic neurons such as the CCAP and gustatory Hug neurons from the subesophageal ganglion (Figure 2K). We also identified a cluster expressing Ilp2, Ilp3, and Ilp5, which are markers for the insulin-producing cells (IPCs), as well as another cluster with Pdf-expressing cells, which contain all but one neuron of the lateral ventral neurons (LNvs), an important clock-neuron subtype (Allada and Chung, 2010) (Figure 2K).
While we were able to produce subclusters for several neuronal types, we also attempted to produce subclusters of KCs that produce the three MB lobes. The subclustering indicated that the cells separate based on technical factors such as age and sex, and thus potential subtypes of the different lobes could not be found (Figures S3G–S3I). This indicates that within each lobe, the cells are transcriptionally very similar. Overall, we identified most neuronal subtypes in the brain, with cell numbers in each neuronal subtype corresponding to estimates reported in literature (Figure 2L).
Mapping Cell-Type-Specific Regulatory Networks Using SCENIC
Next, we asked whether the identified cell types are also characterized by specific gene regulatory networks and the activities of TF combinations. We therefore developed a Drosophila SCENIC (Aibar et al., 2017) database and applied SCENIC to our data. SCENIC identified 150 TFs (out of 708) with their recognition motif significantly enriched in their co-expressed gene sets (Table S4). Cell clustering using these gene networks, rather than gene expression alone, resulted in a different t-SNE projection compared to Seurat (Figure 3A), although several TFs for which regulons are found are also marker genes in Seurat clusters (Figure S4C). In addition to cell-type-specific networks, the overall pattern of the t-SNE suggests that large groups of neurons have shared regulatory states. Particularly, along the y axis of the t-SNE, cells are clustered by their neurotransmitter type, each of which has unique combinations of TFs predicted to regulate their identity (e.g., acj6 and ap for cholinergic, fkh and svp for glutamergic, and croc and Lim3 for GABAergic neurons) (Figure 3A).
Figure 3.

Gene Regulatory Networks Underlie Neuronal and Glial Cell Types
(A) Seurat- and SCENIC-based t-SNEs showing the organization of Seurat clusters and the three main neurotransmitter types.
(B) The C15 regulon, active in the olfactory projection neurons with the expression of four target genes as inset. Otp and Hth were added as co-regulatory factors because their motif is also enriched in the C15 regulon, through an analysis with iRegulon (Janky et al., 2014). See also Figure S4.
(C) Various combinations of regulon activities highlighting the variety of cells with active gene regulatory networks.
(D) All 150 regulons and the normalized expression score (NES) associated with their highest-scoring motif. Regulons for TFs with known brain phenotypes are indicated in red. Several relevant regulons have been indicated, with their highest-scoring motif shown.
(E) DNA footprint of the Onecut binding-site predictions, using ATAC-seq. ATAC-seq signal of the best Onecut site near genes of the Onecut regulon (blue); the best Onecut sites near randomly selected genes (orange). In Figure S4A, we also compare this with background Tn5 insertions.
Figure S4.

Validation of the Predicted Gene Regulatory Networks, Related to Figure 3
(A) Comparison of the Onecut transcription factor DNA footprint against the Tn5 transposase sequence bias.
(B) The Dimmed regulon, active in peptidergic neurons and expression of dimm and several of its predicted target genes in these cells.
(C) Heatmap of transcription factors found as markers of clusters by Seurat (values are row zscores, only markers with p < 1e-150 are shown). TFs with regulons found by SCENIC are indicated by a yellow bar, those found by Seurat only are marked by a blue bar.
Of all Seurat clusters, 50 form separate cell clusters in the SCENIC t-SNE, suggesting that these cell types have the most specific TF networks (Figure 3A; Data S1). For example, glial cells are separated from neurons due to glial-specific activity of the Repo and Pnt networks (Klaes et al., 1994, Xiong et al., 1994). SCENIC also identified a TF network defining OPNs under the control of C15, Hth, and Otp (Figure 3B). Among the predicted C15 target genes are otp and kn, consistent with subclustering of the OPN (Figure 3B). Also, multiple optic lobe clusters have specific TF networks, such as the Mi1 neurons under the control of Bsh (Hasegawa et al., 2011, Hasegawa et al., 2013). In peptidergic neurons, we identified a prominent network regulated by Dimmed (Hadžić et al., 2015) (Figures 3C and S4B).
Although one purpose of this resource is to make the SCENIC regulons available for further exploration through SCope, we provide initial validation for several predicted networks. First, we used gene ontology (GO) enrichment analysis of all regulons. This confirmed, that the Dimm regulon with 111 predicted target genes are significantly enriched for the GO term “neuropeptide signaling pathway” (GO:0007218; FDR [false discovery rate]: 1.60 × 10⁻⁹), with strong target gene co-expression of 7B2, ITP, Ms, Mip, and others (Figure S4B). Second, we compared the predicted TFs with published phenotypes in the brain (Figure 3D), highlighting TFs whose loss of function cause neuronal phenotypes, such as C15. Finally, we performed bulk assay for transposase-accessible chromatin sequencing (ATAC-seq) of the brain to validate the predicted binding sites of TFs with broad activity across many neuronal types. The strongest pan-neuronal network was identified for Onecut. We checked whether predicted Onecut binding sites reside in open chromatin in the genome. Across four replicates, our data identified Onecut sites to be strongly enriched for ATAC-seq signal (Figure 3E). Interestingly, this analysis identified a significant DNA footprint precisely overlapping the predicted Onecut motif (Figure 3E). We confirmed that this signal was specific, and not due to background Tn5 specificity, by comparing high-scoring Onecut motif instances near random genes (Figures 3E and S4A). Together, the SCENIC results provide a wide variety of regulatory predictions, many of which match with neuronal subtypes, and they can be explored through SCope.
Regulatory States in the Central Brain Are Predictive for the Levels of Oxidative Phosphorylation
We further investigated the SCENIC t-SNE by exploring the principal-component analysis (PCA) of the regulon activity matrix. The first principal component (36% explained variance) represents the neuron-glia axis with high loadings for Repo and Pnt networks. The second principal component (13%) is driven by the regulon of Dati (Schinaman et al., 2014) and to a lesser extent by additional regulons of CG9650, Pdp1, and Scro (Figure 4A). When we ran SCENIC searching for repressive regulons, we identified additional Dati and Prospero (Pros) regulons along this principal component (Figure S5A). These networks form a gradient along the x axis of the t-SNE (Figures 4B–4D and S5B). Among the predicted target genes of Pros and Dati (Figure S5A), and expressed in distinct patterns along the SCENIC t-SNE, are nearly all previously identified “master regulators” of neuroblast development, including Imp, chinmo, br, ab, Syp, mamo, ct, and Eip93F (Zhu et al., 2006, Maurange et al., 2008, Syed et al., 2017). The enriched motif in the Dati regulons is a peculiar AAAAAA motif also shared by other co-expressed factors including FoxP, jim, and hb (Figure S5C). Thus, cell clustering based on inferred gene regulatory networks groups neurons primarily according to their combinatorial expression of key neuro-developmental factors.
Figure 4.

SCENIC Uncovers a Neuronal Axis Guided by Oxidative Phosphorylation
(A) Loadings for the top two principal components for each regulon.
(B–D) SCENIC t-SNE showing expression of neuroblast “master regulators.”
(E) Immunostaining of Pros and Imp-GFP showing a very strong disjoint expression of both factors, in agreement with the t-SNE.
(F) Division of the t-SNE into three main parts based on expression of dati and Imp: central brain A (dati high), central brain B (dati low, Imp positive), and optic lobe (dati low). Glia were grouped separately, as were neurons that did not meet any of these thresholds.
(G) GO analysis of differential expression between the three main neuronal groups reveals metabolic terms related to oxidative phosphorylation to be downregulated in central brain A.
(H) Number of mitochondrial reads in each neuronal group showing an enrichment in central brain B and optic lobe.
(I) SCENIC t-SNE showing non-overlapping expression of the Dati regulon (green) and a regulon enriched for oxidative phosphorylation (red). Motifs for both regulon are shown, where the OxPhos-enriched motif is the same as previously described in literature.
(J) Boxplot showing the OxPhos expression measured by AUCell for all Seurat clusters. Clusters are colored by which compartment they are part of.
(K) MitoTimer measurements on the R23E10-Gal4 dFBs, showing newly synthesized mitochondrial proteins in green and matured mitochondrial protein in red.
(L) Percentage of newly synthesized mitochondrial proteins for six neuronal populations, colored by central brain compartment. Error bars show 95% confidence interval. Scale bars, 50 μm in half-brain images, 5 μm in zoom-ins.
See also Figure S5.
Figure S5.

Dati and Prospero Regulatory Networks and Glycolysis Levels among the Clusters, Related to Figure 4
(A) Predicted network for Dati and Prospero target genes.
(B) Expression of predicted target genes positively and negatively correlated with Dati.
(C) Dati, Jim, Hb and Rn share the same binding motif and are positively correlated with each other, suggesting some form of redundancy in the network.
(D) Glycolysis activity for each Seurat cluster. Clusters are colored by main cell group.
To validate these predicted distinct neuronal states in the adult brain, we chose Pros and Imp as markers and profiled their protein expression in the brain using immunofluorescence (Figure 4E). This labeling confirmed that about half of the cells in the central brain are Pros positive, while the other half are Imp positive, and there is undetectable expression of either Pros or Imp in the optic lobes. Based on the SCENIC regulons, and the highly specific expression of master regulators, we can divide all neurons in the brain into three categories: central brain A (Dati and Pros), central brain B (Imp), and optic lobe (Scro) (Figure 4F).
To explore whether this subdivision reflects a functional difference, we assessed the differential gene expression profile between the three neuronal groups, followed by GO enrichment analysis. This revealed a highly significant upregulation of genes involved in ATP metabolism and oxidative phosphorylation (OxPhos) (padj < 1.00 × 10−40) in the optic lobes and central brain B, compared to central brain A (Figure 4G). This difference is recapitulated by a significantly higher number of mitochondrial reads in central brain B (Figure 4H). Furthermore, the upregulated genes in central brain B are significantly enriched for an ATF-like motif TTAcgTAA, previously reported as the “OxPhos motif” (Porcelli et al., 2007) (Figure 4I). Assessing the expression of glycolysis-related genes revealed upregulation of these genes in glia and optic lobe cells (Figure S5D).
To further investigate OxPhos gene expression levels, we scored each Seurat cluster with an independent set of curated OxPhos genes (Porcelli et al., 2007) (Figure 4J). We confirmed that glial clusters are the lowest in OxPhos gene expression levels, and we also observe this in single-cell datasets of human brains (Figure S6A). MB neurons are overall low in OxPhos gene expression, with the α′/β′ KCs slightly higher than the other two lobes. The dFB neurons that we identified above (Seurat cluster 61) display very high OxPhos gene expression.
Figure S6.

Comparison of OxPhos Levels and Main Cell Types between Fly and Human/Mouse, Related to Figures 4 and 7
(A) Oxidative phosphorylation gene set on human brain cells (Lake et al., 2018). The boxplot shows the AUC scores of the OxPhos gene set per cell type (same approach as Figure 4J). The t-SNEs on the right show the pathway AUC, and regulons with enrichment of the pathway. For each regulon, the AUC (red) and TF expression (orange) are shown.
(B) Comparison of human and fly cell types: The heatmap shows the percentage of human cells from each cell type in which the fly cluster signature (e.g., cluster markers) are selected as “active” with AUCell.
(C) Expression of mouse glia/neuron markers on the fly cells.
These differences in OxPhos gene expression may correlate with variations in mitochondrial activity and turnover. To test this in vivo, we turned to the mitoTimer assay (Ferree et al., 2013). We compared the ratio of newly synthesized and mature mitochondrial proteins in KCs, PDF neurons, R23E10-Gal4 dFB neurons, and GH146-targeted OPNs (Figures 4K and 4L). The analysis confirmed that R23E10-Gal4 dFB neurons have a significantly higher mitochondrial turnover than KCs and that among the KCs, the α′/β′ are higher in mitochondrial turnover than the other two MB lobes, in agreement with their levels of OxPhos gene expression. The PDF neurons show intermediate OxPhos gene expression levels from the scRNA-seq data and also show intermediate mitochondrial turnover in vivo (Figure 4L).
Together, these data indicate that neurons in the central brain show differential regulatory networks of TFs (e.g., pros, dati, mamo, hb, chinmo, pdm3) and RNA-binding proteins (Imp, Syp) and that specific combinations of these TFs are predictive for the levels of expression of genes involved in oxidative phosphorylation.
Aging Affects Transcriptional Output, Mitochondrial Turnover, and Cell Size
We found very few age-related biases in the cell-type clustering of Seurat and SCENIC when using normalized data (to the total UMI count of a given cell). When we investigated the raw read counts, we found an exponential decline in the number of UMIs and the number of genes expressed during aging (R2 = 0.907 for DGRP-551 and 0.840 for w1118) (Figure 5A) in agreement with prior observations (Tahoe et al., 2004). This effect can be observed in all neuronal and glial cell types (Figures S7A and S7B). The decline of total RNA does not appear to affect cellular identity, as illustrated by the consistent cell-type clustering in both young and old brains (Figure 5B) and the fact that aging is rarely (except in glial cells) the major correlate to Destiny-derived diffusion components (Angerer et al., 2016) (Figure S7C). However, while all cell types are retained in old brains, there is a slight change in cell composition of old brains, as shown by a relative increase of glia, reminiscent of human brain aging (Soreq et al., 2017) (Figure 5B).
Figure 5.

Aged Cells Have Reduced Transcriptional Output but Retain Identity
(A) The number of UMIs and genes show an exponential decline over aging for both DGRP-551 and w1118.
(B) t-SNE of young and old cells, showing the stability of cell types manifested by the presence of each cluster in both t-SNEs. Cluster 23 (gap in the middle of old t-SNE) is likely an artifact because it occurs only in one replicate of young flies (Figures S3B–S3F). Pie plots show a change in composition, with a slight increase in relative amount of glia (5% to 11%).
(C) Correlation of each gene with age. Most genes decline with age, especially those involved in oxidative phosphorylation, while ribosomal genes involved in translation are more protected.
(D) Change in OxPhos activity, as measured by AUCell, for the three neuronal groups defined above.
See also Figures S4 and S7.
Figure S7.

Effects of Aging through Several Cell Types and Machine-Learning-Based Age Prediction, Related to Figures 5 and 6
(A) Scatterplot showing the ratio of the number of UMIs of old cells versus young cells against the time constant derived from the exponential decline model. Colors are a measure for the goodness of fit (R2).
(B) Decline in number of UMIs for the peptidergic neurons.
(C) Diffusion maps of the diffusion components mostly correlated with age for the mushroom body and dopaminergic neurons. Separation by age is mostly driven by the number UMIs.
(D) Boxplots showing a decline in synthesis of mitochondrial proteins (new), with only a slight increase in old proteins (mature).
(E) Performance of the Random Forest Regressor age prediction for the different Seurat clusters and distinct major groups. Possible confounding variables are shown. The diffusion component most correlated with age is shown; when no specification is made, DC1 is the major correlate.
Next, to assess whether all genes were equally affected by this decline, we calculated the correlation of each gene with age and found a subset of genes that show only a marginal decline in gene expression levels (Figure 5C). These genes are strongly enriched for genes related to the ribosome. A single gene, namely stubarista (sta), encoding a ribosomal subunit protein, is upregulated during aging. In contrast, genes that decline faster than average are strongly enriched for those involved in oxidative phosphorylation. Above, oxidative phosphorylation was used to demarcate the brain into three sub-compartments. Therefore, we checked whether the decline in oxidative phosphorylation was caused by the aging of one of these groups; however, all groups show a similar decline of oxidative phosphorylation, suggesting a general effect on aging (Figure 5D).
To validate the strong decline in OxPhos gene expression levels during aging, we again used the in vivo mitoTimer assay, comparing young (3 days) versus old (45 days) brains. We found a significant decrease in mitochondrial turnover in old brains across cell types (Figures 6A and 6B). Since these experiments were performed on non-fixed brains, this allowed us to simultaneously compare the size of neurons between young and old brains. Cell size decreases during aging (Figure 6C), in agreement with the decline in mRNA content.
Figure 6.

Age Affects Mitochondrial Turnover and Cell Size and Can Be Accurately Predicted by the Transcriptome
(A) MitoTimer for the dFBs (R23E10-Gal4), showing mitochondrial renewal over aging. Scale bars, 100 μm, 10 μm.
(B) Bar plot showing a significant (t test, p < 0.0001) decline in synthesis of mitochondrial proteins. Error bars show SEM.
(C) Boxplot showing a significant (t test, p < 0.0001) reduction in cell size for all measured neuronal types.
(D) Random Forest Regressor prediction score for each Seurat cluster (age predict). The score is independent of number of UMIs, OxPhos activity, or correlation of diffusion components with age and seems to only correlate with the R2 value of the exponential fit.
(E) Predictions of the Random Forest Model trained on all cells. Six features were found to be most influential.
(F) Expression of the six most important features over time, displaying different patterns.
See also Figure S7.
To test whether cellular age can be predicted from our data, we trained a Random Forest regression model (see STAR Methods). When applied to each Seurat cluster, we found that the accuracy of age prediction varies between cell types and is concordant with the overall correlation of gene expression (indicated by the correlation with a Destiny diffusion component) (Figures 6D and S7E). Interestingly, mt:lrRNA, was found consistently as the most important feature to predict cellular age. Applying and testing this model to all cells yielded very accurate age predictions (Figure 6E). The most informative genes include mt:lrRNA, Hsromega, TM4SF, and sta, which all show different aging dynamics (Figure 6F).
In conclusion, aging affects mRNA abundance; however, cell identity remains intact. Genes involved in oxidative phosphorylation and mitochondrial turnover decline most rapidly, and mitochondrial translation-related genes are accurate predictors of cellular age.
SCope: Cloud-Based Exploration of Single-Cell Atlases
The single-cell atlas of the Drosophila brain, as presented here, is available through a user-friendly online application called SCope (http://scope.aertslab.org). SCope can also be easily installed on a local computer, server, or cloud-based infrastructure using a Singularity container (Kurtzer et al., 2017). SCope utilizes data stored in a loom format (https://github.com/linnarsson-lab/loompy), a HDF5-based data file that contains a raw or normalized gene expression matrix for a dataset with t-SNE coordinates but can contain extra annotation and features from different analyses and tools, such as Seurat clusters and SCENIC regulons (Figure 7A). Several single-cell datasets are already provided in SCope, including this study, the Drosophila optic lobe (Konstantinides et al., 2018), OPNs (Li et al., 2017) and embryo (Karaiskos et al., 2017), the mouse brain cells (Zeisel et al., 2015) and hypothalamus (Chen et al., 2017), and the human brain cells (Lake et al., 2018). In addition, users can also upload their own .loom files.
Figure 7.

Overview of the Data Format Used and Features of SCope
(A) A schematic of the data and analyses stored inside the loom files used by SCope. SCope can be accessed at http://scope.aertslab.org, by being installed on a local machine or server, or through use of a Singularity container usable on cloud-computing platforms.
(B) On overview of some of the exploration and comparison options available in SCope.
See also Figure S6.
Data can be visualized as colored projections onto different embeddings or co-ordinates (such as PCA/t-SNE/DC). Different analyses are available such as simultaneous display of up to three genes, with optional log and CPM normalizations, simultaneous exploration of up to three SCENIC regulons including manual thresholding, and visualization of TF expression levels. Datasets can be compared within dataset; between annotations such as genotype, replicate, or age; and between dataset, including cross-species plotting of orthologous genes (Figures 7B and S6). Finally, gene sets can be provided that are scored with AUCell (Aibar et al., 2017) to visualize which cells are enriched for the gene set. In sum, SCope provides comprehensive access and allows exploration of gene expression and gene regulatory analyses from large-scale single-cell datasets in a fast, easy-to-use interface.
Discussion
In this work, we report a comprehensive single-cell compendium of an entire intact adult brain during aging. Single-cell sequencing technology is revolutionizing the identification of cell types and of shared regulatory states. Brain research benefits enormously from the emergence of single-cell technologies, as the complex structure makes it difficult to decipher genome-wide transcriptome data using bulk techniques. We identify numerous cellular subclusters and state changes, each defined either by gene expression markers, gene signatures, transcription factor expression, or regulons. This work will facilitate future work on the fly brain and serve as a resource to understand cell-type identity.
Our work overcame a number of technical hurdles such as the small size of the fly neurons and the lower RNA content in aged animals. Despite these hurdles, we have shown that our dataset includes single-cell transcriptomes for nearly all cell types in the fly brain. Indeed, we were able to map transcriptome data of specific FAC-sorted cells to specific clusters in our whole brain dataset. Further subclustering of the primary clusters typically led to the identification of additional known cell types, such as the R23E10-Gal4 dFB neurons, suggesting that hundreds of neural subtypes exist (231–1,190 subclusters depending on the resolution parameter). Nevertheless, not all clusters have an outspoken identity, such as the relatively large clusters of “generic” neurons in the center of our Seurat t-SNE (Figure 1).
By sequencing the transcriptome of individual cells, we can now measure the output of the regulatory system without the loss of information caused by the signal averaging from bulk technologies. We recently showed that transcription factor subnetworks that are active in specific cell types can be predicted by combining scRNA-seq with the cis-regulatory sequence information contained within the enhancers of regulated genes (Aibar et al., 2017). Here, we developed SCENIC for the Drosophila genome, and by applying it to our data, we identified regulatory variability among neurons along several different axes, such as presynaptic specialization, neuronal subtypes, and combinations of neuronal master regulators such as Imp, pros, dati, mamo, and br (Maurange et al., 2008, Liu et al., 2015, Syed et al., 2017).
What emerged from the contrast between pros/dati-positive and Imp-positive neurons are highly significant differences in expression of genes involved in metabolic pathways related to oxidative phosphorylation, suggesting more active mitochondria in Imp-positive neurons, throughout the entire central brain. Given that markers of these central brain neurons, such as pros, dati, mamo, and Imp, are expressed in temporal windows during neuronal birth (Maurange et al., 2008, Li et al., 2013), one possibility may be that neurons are endowed with a particular metabolic potential when they are born. Such a regulatory state could then influence how neuronal networks are constructed during development and how they function during life, but more work is needed to explore this possibility.
Our work is, to our knowledge, the first to examine the aging process at single-cell level in the brain. Aging has long been associated with epigenomic changes (O’Sullivan and Karlseder, 2012) and increased transcriptional heterogeneity (Martinez-Jimenez et al., 2017). However, it remains unclear whether there is an aging mechanism common to all cell types. Unsupervised clustering and trajectory analysis of neuronal transcriptomes do not reveal a strong age component. Instead, neuronal subtypes cluster together across all ages, indicating that cell fate is robustly maintained in aging cells. We furthermore conclude that aging mechanisms are cell-type specific, since glial cells, but not neurons, show a clear aging trajectory in their transcriptional profile. In addition, an exponential decline in gene expression correlates with neuronal shrinking. Only ribosomal genes withstand this decline, while genes encoding OxPhos components decline most rapidly. Ribosomal genes are controlled by a special type of core promoter, the TCT promoter (Parry et al., 2010), which may explain why ribosomal gene expression is uniquely regulated during aging. Since the exact mechanism of mRNA decline remains to be identified, our work may provide interesting starting points to start unraveling this mechanism.
Single-cell datasets are being generated at a rapid pace, across different species (Regev et al., 2017). New software enabling the easy exploration and comparison of these data will be essential to make these atlases available to the wider scientific community, allowing researchers to investigate cell types, identify markers relevant to their own research, and compare features across datasets and across species. SCope provides a platform to easily and rapidly explore large-scale single-cell datasets without the need for the researcher to acquire and analyze raw data. In addition, leveraging a standardized file format, new datasets and analyses can easily be investigated using SCope, and the provided containers make it easy for groups and institutions to deploy this platform using their own servers or cloud-computing solutions.
STAR★Methods
Key Resources Table
| REAGENT or RESOURCE | SOURCE | IDENTIFIER |
|---|---|---|
| Antibodies | ||
| Mouse monoclonal anti-Prospero (1:20 dilution) | Developmental Studies Hybridoma Bank | Cat# MR1A; RRID: AB_528440 |
| Rat monoclonal anti-elav (1:100 dilution) | Developmental Studies Hybridoma Bank | Cat# 7E8A10; RRID: AB_528218 |
| Mouse monoclonal anti-Pdf (1:50 dilution) | Developmental Studies Hybridoma Bank | Cat# PDF C7; RRID: AB_760350, AB_2315084 |
| Mouse monoclonal anti-Bruchpilot (1:50 dilution) | Developmental Studies Hybridoma Bank | Cat# nc82; RRID: AB_2314866 |
| Rabbit polyclonal anti-GFP (1:1000 dilution) | Life Technologies | Cat# A-6455; RRID: AB_221570 |
| Donkey polyclonal anti-rabbit Alexa Fluor 488 (1:1000 dilution) | Life Technologies | Cat# A-21206; RRID: AB_2535792 |
| Donkey polyclonal anti-mouse Alexa Fluor 555 (1:1000 dilution) | Life Technologies | Cat# A-31570; RRID: AB_2536180 |
| Goat polyclonal anti-rat Alexa Fluor 647 (1:1000 dilution) | Life Technologies | Cat# A-21247; RRID: AB_141778 |
| Critical Commercial Assays | ||
| Acridine Orange/Propidium Iodide Stain | Logos Bio | Cat# F23001 |
| Chromium Single Cell 3′ Library & Gel Bead Kit v2 | 10x Genomics | Cat# PN-120237 |
| Chromium Single Cell A Chip Kit | 10x Genomics | Cat# PN-120236 |
| Chromium i7 Multiplex Kit | 10x Genomics | Cat# PN-120262 |
| Nuclei Isolation Kit: Nuclei EZ Prep | Sigma | Cat# NUC101-1KT |
| Nextera DNA Library prep kit | Illumina | Cat# FC-121-1030 |
| RNAqueous-Micro Total RNA Isolation Kit | ThermoFisher | Cat# AM1931 |
| Dynabeads mRNA Purification Kit | ThermoFisher | Cat# 61006 |
| TruSeq Stranded mRNA Library Prep | Ilumina | Cat# 20020595 |
| MEGAscript T7 Transcription Kit | ThermoFisher | Cat# AM1333 |
| Deposited Data | ||
| Raw and analyzed data | This paper | GEO: GSE107451 |
| Lamina/Photoreceptor RNA-seq | Tan et al., 2015 | GEO: GSE68235 |
| T4/T5 Neuron RNA-seq | Pankova and Borst, 2016 | GEO: GSE77198 |
| α/β/γ Kenyon Cells and Mushroom Body output neurons RNA-seq | Crocker et al., 2016 | GEO: GSE74989 |
| Clock Neuron RNA-seq | Abruzzi et al., 2017 | GEO: GSE77451 |
| Surface Glia Microarray | DeSalvo et al., 2014 | GEO: GSE45344 |
| Olfactory Projection Neuron scRNA-seq | Li et al., 2017 | GEO: GSE100058 |
| Optic lobe scRNA-seq | Konstantinides et al., 2018 | GEO: GSE103771 |
| Experimental Models: Organisms/Strains | ||
| D. melanogaster: DGRP-551 | Bloomington Drosophila Stock Center | BDSC: 55026; FlyBase: FBsn0000297 |
| D. melanogaster: w[1118] | Bloomington Drosophila Stock Center | BDSC: 3605; FlyBase: FBal0018186 |
| D. melanogaster: R32E10-Gal4: w[1118]; P{y[+t7.7] w[+mC] = GMR23E10-GAL4}attP2 | Bloomington Drosophila Stock Center | BDSC: 49302; FlyBase: FBti0133973 |
| D. melanogaster: Imp-GFP: y[1]w[∗] Mi{PT-GFSTF.2}Imp[MI05901-GFSTF.2] | Bloomington Drosophila Stock Center | BDSC: 60237; FlyBase: FBti0178481 |
| D. melanogaster: OK371-Gal4: w[1118]; P{w[+mW.hs] = GawB}VGlut[OK371] | Bloomington Drosophila Stock Center | BDSC: 26160; FlyBase: FBti0076967 |
| D. melanogaster: AMMC-A1-Gal4: w[∗]; P{w[+mW.hs] = GawB}c767 | Bloomington Drosophila Stock Center | BDSC: 30848; FlyBase: FBti0072281 |
| D. melanogaster: GH146-Gal4: y[1] w[1118]; P{w[+mW.hs] = GawB}GH146 | Bloomington Drosophila Stock Center | BDSC: 30026; FlyBase: FBti0016783 |
| D. melanogaster: pros-GFP: w[1118]; PBac{y[+mDint2]w[+mC] = pros-GFP.FPTB}VK00037 | Bloomington Drosophila Stock Center | BDSC: 66463; FlyBase: FBti0150306 |
| D. melanogaster: pdf-Gal4: y[1] w[∗]; P{w[+mC] = Pdf-GAL4.P2.4}2 | Bloomington Drosophila Stock Center | BDSC: 6900; FlyBase: FBti0027914 |
| D. melanogaster: UAS-CD8::GFP: y[1] w[∗]; P{w[+mC] = UAS-mCD8::GFP.L}LL5, P{UAS-mCD8::GFP.L}2 | Bloomington Drosophila Stock Center | BDSC: 5137; FlyBase: FBti0180511 |
| D. melanogaster: UAS-mitoTimer: w[1118]; P{w[+mC] = UAS-MitoTimer}3 | Bloomington Drosophila Stock Center | BDSC: 57323; FlyBase: FBti0161163 |
| Oligonucleotides | ||
| Sequencing primers – See Table S5 | Various | N/A |
| Software and Algorithms | ||
| Fiji | Schindelin et al., 2012 | https://fiji.sc/; RRID: SCR_002285 |
| bcl2fastq | Illumina | https://support.illumina.com/sequencing/sequencing_software/bcl2fastq-conversion-software.html; RRID: SCR_015058 |
| Cell Ranger | 10x Genomics | https://support.10xgenomics.com/single-cell-gene-expression/software/downloads/latest |
| scater | McCarthy et al., 2017 | https://bioconductor.org/packages/release/bioc/html/scater.html; RRID: SCR_015954 |
| Seurat | Satija et al., 2015 | https://satijalab.org/seurat/; RRID: SCR_007322 |
| SCENIC/AUCell | Aibar et al., 2017 | https://aertslab.org/#scenic |
| NNLS Regression | Stanescu et al., 2017 | N/A |
| Random Forest Regression – Scikit-learn | Pedregosa et al., 2011 | http://scikit-learn.org/stable/; RRID: SCR_002577 |
| Destiny | Angerer et al., 2016 | http://bioconductor.org/packages/release/bioc/html/destiny.html |
| clusterProfiler | Yu et al., 2012 | https://bioconductor.org/packages/release/bioc/html/clusterProfiler.html |
| GOPlot | Walter et al., 2015 | http://wencke.github.io/ |
| DESeq2 | Love et al., 2014 | https://bioconductor.org/packages/release/bioc/html/DESeq2.html; RRID: SCR_015687 |
| GOrilla | Eden et al., 2009 | http://cbl-gorilla.cs.technion.ac.il/; RRID: SCR_006848 |
| Ea-utils (fastq-mcf.) | Aronesty, 2011 | https://github.com/ExpressionAnalysis/ea-utils; RRID: SCR_005553 |
| STAR | Dobin et al., 2013 | https://github.com/alexdobin/STAR; RRID: SCR_015899 |
| pysam | Li et al., 2009 | https://github.com/pysam-developers/pysam; RRID: SCR_002105 |
| SciPy | Jones et al., 2001 | https://www.scipy.org/index.html; RRID: SCR_008058 |
| Singularity | Kurtzer et al., 2017 | https://singularity.lbl.gov/index.html |
| Loompy | Linnarsson Lab | https://github.com/linnarsson-lab/loompy |
| SCopeLoomR | This Paper | https://github.com/aertslab.org/SCopeLoomR |
| SCopeLoomPy | This Paper | https://github.com/aertslab.org/SCopeLoomPy |
| SCope Source Code | This Paper | https://github.com/aertslab.org/SCope |
| Other | ||
| RcisTarget/SCENIC Drosophila Database | This Paper | https://aertslab.org/#scenic |
| SCope Resource Website | This Paper | http://scope.aertslab.org |
Contact for Reagent and Resource Sharing
Further information and requests for resources and reagents should be directed to and will be fulfilled by the Lead Contact, Stein Aerts (stein.aerts@kuleuven.vib.be).
Experimental Model and Subject Details
Fly Stocks
All flies were raised on a yeast based medium and kept at 25°C on a 12h/12h day/night light cycle. During aging experiments, 20 females and 10 males were placed in each vial and flies were transferred to new vials every 4 days. Adult flies were used at ages 0, 1, 3, 6, 9, 15, 30 and 50 days old.
Please see the Key Resources Table for the Drosophila lines used in this study.
Method Details
Brain dissociation into single cells
Forty D. melanogaster adult brains (20 females and 20 males) were dissected and transferred to a tube containing 100 μl ice cold DPBS solution. After centrifugation at 800 xg for 5 min, the supernatant was replaced by 50 μL of dispase (3 mg/mL, Sigma-Aldrich_D4818-2mg) and 75 μl collagenase I (100 mg/mL, Invitrogen_17100-017), a shorter variant of the dissociation included 125 μL trypsin-EDTA (0.05%, Invitrogen_25300054). Brains were dissociated at 25°C in a Thermoshaker (Grant Bio PCMT) for 2h at 25°C, 500 rpm or 15 min at 25°C, 1,000 rpm for the short dissociation. The enzymatic reaction was reinforced by pipette mixing every 15 min or 5 min for the short dissociation. Cells were washed with 1,000 μl ice cold DPBS solution and resuspended in 400 μl DPBS 0.01% BSA (for Drop-seq experiments) or DPBS 0.04% BSA (for 10x experiments) for 30-40 brains. Cell suspensions were passed through a 10 μM pluriStrainer (ImTec Diagnostics_435001050). Cell viability and concentration were assessed by the LUNA-FL Dual Fluorescence Cell Counter.
10x Genomics
Single-cell libraries were generated using the GemCode Single-Cell Instrument and Single Cell 3′ Library & Gel Bead Kit v2 and Chip Kit (10x Genomics) according to the manufacturer’s protocol. Briefly, fly brain single cells were suspended in 0.04% BSA–PBS. About 8,700 cells were added to each channel with a targeted cell recovery estimate of 5,000 cells. After generation of nanoliter-scale Gel bead-in-EMulsions (GEMs), GEMs were reverse transcribed in a C1000 Touch Thermal Cycler (Bio Rad) programed at 53°C for 45 min, 85°C for 5 min, and hold at 4°C. After reverse transcription, single-cell droplets were broken and the single-strand cDNA was isolated and cleaned with Cleanup Mix containing DynaBeads (Thermo Fisher Scientific). cDNA was then amplified with a C1000 Touch Thermal Cycler programed at 98°C for 3 min, 12 cycles of (98°C for 15 s, 67°C for 20 s, 72°C for 1 min), 72°C for 1 min, and held at 4°C twice. Subsequently, the amplified cDNA was fragmented, end-repaired, A-tailed and index adaptor ligated, with SPRIselect Reagent Kit (Beckman Coulter) with cleanup in between steps. Post-ligation product was amplified with a C1000 Touch Thermal Cycler programed at 98°C for 45 s, 14 cycles of (98°C for 20 s, 54°C for 30 s, 72°C for 20 s), 72°C for 1 min, and hold at 4°C. The sequencing-ready library was cleaned up with SPRIselect beads.
Immunofluorescence
For immunofluorescence, brains were dissected and transferred to a tube containing 100 μl ice cold DPBS solution. After centrifugation at 800 xg for 5 min, the supernatant was replaced by 4% Formaldehyde in PBT 0.3% (DBPS + 0.3% Triton X-100 (Sigma)) and incubated at room temperature with rotation for 15 min. Brains were washed with PBT 0.3% three times, rotating for 10 min at room temperature each time and then blocked in Pax-DG (10 g BSA (Sigma), 3g Deoxycholate Acid (Sigma), 3ml Triton X-100 (Sigma), 50ml Normal Goat Serum (MP Biomedicals), 100ml 10X PBS, 850ml H2O) for 2 hours at room temperature with rotation. Primary antibody mixes were created in Pax-DG (dilutions detailed in the Key Resources Table) and brains were incubated in these mixes overnight at 4°C with rotation. The next day, brains were washed with PBT 0.3% three times, rotating for 10 min at room temperature each time and then stained with secondary antibody mixes in Pax-DG (dilutions detailed in the Key Resources Table) for 2 hours at room temperature with rotation. Brains were washed with PBT 0.3% three times, rotating for 10 min at room temperature each time and mounted in Mowiol mounting medium (Sigma). Imaging was performed using the Leica TCS SP5 and Nikon Spinning Disk confocal microscopes.
Whole brain ATAC-seq
Two brains (one male, one female) were dissected and transferred to a tube containing 100 μl ice cold DPBS solution. After centrifugation at 800 xg for 5 min, the supernatant was replaced with 50 μL ice cold ATAC-seq lysis buffer (10 mM Tris-HCl, 10mM NaCl, 3mM MgCl2, 0.1% IGEPAL CA-630) and the brains were mixed harshly by pipetting. Lysed brains were then centrifuged at 800 xg for 10 min and the supernatant was discarded and replaced with 50 μl ATAC-seq reaction mix (2.5 μl Nextera Tn5 (Illumina), 25μl Nextera TD Buffer (Illumina), 22.5 μl H2O) and incubated at 37°C for 30 min. Transposed DNA was purified using a QIAGEN MinElute purification column and amplified for 5 cycles (10 μl purified DNA, 25 μl NEBNext High Fidelity PCR Master Mix (NEB), 2.5 μl Nextera compatible FWD primer (Table S5), 2.5 μl Nextera compatible REV primer (Table S5), 10 μl H2O) with the following PCR conditions: 72°C for 5 min, 98°C for 30 s, followed by 5 cycles of at 98°C for 10 s, 63°C for 30 s and 72°C for 1 min. After 5 cycles, qPCR was performed on 5 μl of the PCR mix (5 μl PCR Mix, 10 μl 2x SYBR Green I MasterMix (Roche), 2 μl Nextera compatible FWD primer, 2 μl Nextera compatible REV primer, 1 μl H2O – split across two wells) for 40 cycles. For each sample, the number of cycles at which ¼ the maximum qPCR fluorescent intensity was achieved was noted. The remaining 45 μl PCR was further cycled as described for this number of cycles. Final libraries were purified using a QIAGEN MinElute column and then a 1.2x AMPure XP bead cleanup (Beckman Coulter) using manufacturers recommendation.
Nuclei Prep
Nuclei were isolated by using the EZ nuclei isolation kit (Sigma). Briefly, 40 Drosophila adult brains (20 females and 20 males) were dissected in ice cold PBS and transferred to a Dounce homogenizer containing 2 mL of ice-cold Nuclei EZ lysis buffer and incubated on ice for 5 min. The tissue was disrupted by 25 strokes with the loose pestle, incubated on ice for 10 min and disrupted by 40 strokes with the tight pestle. Nuclei were collected by centrifugation at 500 xg for 5 min at 4°C, washed with 4 mL of ice-cold Nuclei EZ lysis buffer and incubated on ice for 5 min. After centrifugation, the nuclei preps were washed again in 4 mL of Nuclei Suspension Buffer (NSB; consisting of 1x PBS, 0.01% BSA and 0.1% RNase inhibitor (Clontech, 2313A)) and filtered through a 35 μm cell strainer (Corning, Cat# 352235). After centrifugation, supernatant was removed and isolated nuclei were lysed using 200 μl of lysis buffer for RNA extraction.
Bulk RNA-seq
Twenty to thirty adult brains were dissected in PBS and total RNA was extracted according to the RNAqueous micro protocol (Ambion), using 200 μl lysis buffer. Two different methods were applied to prepare RNA-seq libraries.
For the Tn5-mediated, unstranded RNA-seq library prep, mRNA was enriched using the Dynabeads mRNA purification kit (Invitrogen). To make cDNA, 1 μl of oligo(dT) primers (500ng/μl; Ambion) and 1 μl of 10 mM dNTP (Promega) was added to 10 μl of polyA-selected mRNA; incubated at 65°C for 5 min and placed on ice. First-strand cDNA synthesis was performed by adding 4μl of first strand buffer (Invitrogen), 2 μl of 100 mM DTT (Invitrogen) and 2 μl of Superscript II (Invitrogen) and incubating the mix at 42°C for 50 min, then 70°C for 15 min. The second strand of cDNA was filled in by adding 35 μl of water, 15 μl of 5x second strand buffer (Invitrogen), 1.5 μl of 10 mM dNTP, 0.5 μl of 10 U/μl E Coli DNA ligase (Bioke), 2 μl of 10 U/μl E Coli DNA polymerase I (Bioke), 1 μl of 2 U/μl E Coli RNaseH and then incubating at 16°C for 2 hours. The cDNA was purified on a MinElute column (QIAGEN) and eluted in 15 μl EB buffer. To incorporate sequencing adapters, we combined the purified cDNA with 4 μl of Nextera TD buffer (Illumina) and 1 μl of Nextera Tn5 enzyme (Illumina) on ice and incubated at 55°C for 5 min. The tagmented cDNA was purified again on a MinElute column and eluted in 20 μl EB buffer. To PCR amplify the fragments, we added 25 μl of NEBnext PCR master mix (Bioke), 5 μl of Nextera primer mix and incubated at 72°C for 5 min, then at 98°C for 30 s, followed by 15 cycles of 98°C for 10 s, 63°C for 30 s and 72°C for 3 min. We purified the PCR amplicons with 55 μl AMPure beads (Analis).
The stranded RNA-seq libraries were prepared according to the Illumina Truseq stranded mRNA sample preparation guide.
SMART-Seq2
Cells were directly sorted into the 96 wells plate containing 4 μl lysis buffer mix (2 μl lysis buffer, 1 μl 10mM biotinylated Oligo-dT30VN and 1 μl dNTP mix). After vortexing and centrifugation, samples were incubated at 72°C for 3 min and put on ice. Reverse transcription was carried out by adding 5.7 μl of RT mix: 100U SuperScript II RT (Invitrogen), 10U RNase Inhibitor (Invitrogen), SSII buffer (Invitrogen), 5 mM DTT, 1M Betaine, 6 mM MgCl2, 1uM TSO-LNA (QIAGEN) and nuclease free water. The RT was carried out on a thermo-block: 42°C for 90 min; 11 cycles of (50°C for 2 min; 42°C for 2 min); 70°C for 90 min. After the template switching RT, the individual cell libraries were subjected to IS PCR with 12.5 μl of KAPA HiFi HotStart Ready Mix (2X; Roche), 10 mM biotinylated IS PCR primer (IDT) and nuclease free water. 26 cycles of following IS-PCR program was used for library amplification: 98°C for 90 min; 11 cycles of (50°C for 2 min; 42°C for 2 min); 70°C for 90 min; 26 cycles of (98°C for 20 s; 67°C for 15 s; 72°C for 6 min); 72°C for 5 min. Individual cell libraries were purified using Ampure XP beads (Beckman Coulter) using manufacturers recommendation. The libraries were eluted in 17.5 μl of EB buffer. Quality checks and library quantifications were performed on few samples using BioAnalyzer (Agilent) and Qbit (Thermo). Tagmentation reaction was performed based on the manufacturers protocol, with the following modifications: The tagmentation mix of the library was prepared with 2.5 μl of Nextera TD buffer (Illumina), 1.25 μl of cDNA (0.2 ng/μl, based on the average concentration of the libraries) and 1.25 μl of Nextera Tn5 Transposase (Illumina). Tagmentation was carried out at 55°C for 5 min and immediately the Tn5 was inactivated using NT buffer (Illumina). For the final enrichment PCR, the following was added to the individual libraries: 1.25 μl of individual barcoded sequencing adaptors and 3.75 μl of Nextera PCR master mix (Illumina). The following program was used for the enrichment PCR: 72°C for 3 min; 95°C for 30 s; 15 cycles of (95°C for 10 s; 55°C for 30 s; 72°C for 30 s); 72°C for 5 min. Final purification of enriched libraries was performed using Ampure XP beads (0.6x) as per manufacturers recommendations. Additional quality assessment was performed using BioAnalyzer and Qubit. Final libraries had a size distribution of 300-900 bps.
Adapted SMART-Seq2
Cells were sorted into 2.5 μl RLT Plus lysis buffer (QIAGEN) and supplemented with a 1:1,000M dilution of ERCC spike-in mixture A (Life Technologies). Polyadenylated mRNA was captured by adding 10 μl of biotinylated Oligo-dT30VN primer conjugated to streptavidin-coupled magnetic beads (Dynabeads, Life Technologies) and collected to the side of the well using a magnet. The supernatant was removed and the beads were washed four times in a wash buffer (50 mM Tris-HCl, pH 8.3, 75 mM KCl, 3 mM MgCl2, 10 mM DTT, 0.5% Tween 20, 0,05x SUPERasin (Life Technologies)). Subsequently 5 μl of Reverse Transcription mastermix (10 U/μl SuperScript II reverse transcriptase (Life Technologies), 0.5 U/μl SUPERasin, 1x Superscript II First-Strand Buffer (Life Technologies), 5mM DTT (Life Technologies), 1M betaine (Sigma), 6mM MgCl2 (Life Technologies), 1μM Template-Switching Oligo, 1 mM dNTP mix (Thermo Scientific)) was added to the dried beads and incubated for 60 min at 42°C, 30 min at 50°C and 10 min at 60°C on a Thermomixer with mixing. Finally, PCR mastermix (1x KAPA HiFi HotStart ReadyMix and 0,1μM IS PCR primer) was added and thermal cycled for 3 min at 98°C, 24 cycles of 98°C for 15 s, 67°C for 20 s and 72°C for 6 min and finally 72°C for 5 min. Amplified cDNA was cleaned using a 0.8x ratio of CleanPCR beads (NAClean) and eluted in 25 μl EB elution buffer. Tagmentation and library prep was performed as mentioned above (SMART-Seq2)
CEL-Seq2
Cells were sorted into wells containing 1.2 μl primer mix (0.2 μl barcoded primer (IDT), 0.1 μl 10mM dNTPs (Life Technologies), 0.9 μl H2O). After sorting, plates were spun and stored at −80°C. RNA was annealed by incubating 5 min at 65°C. RT mix (0.4 μl Superscript II First-Strand Buffer (Life Technologies), 0.2 μl 0.1 M DTT (Life Technologies), 0.1 μl RNaseOUT (Life Technologies), 0.1 μl SuperScript II reverse transcriptase (Life Technologies)) was added and incubated at 42°C for 1 hour and then 70°C for 10 min. Plates were allowed to cool to < 16°C and 10 μl Second strand synthesis mix was then added (H2O 7 μl, 2.31 μL Superscript II First-Strand Buffer (Life Technologies), 0.23 μL 10mM dNTPs (Life Technologies), 0.08 μl DNA Ligase (Life Technologies), 0.3 μL E. coli DNA Polymerase (Life Technologies), 0.08 μL RNaseH (Life Technologies)) and incubated at 16°C for 2 hours. Samples with unique barcodes were pooled and cDNA was cleaned using a 1.2x ratio of AMPureXP beads (Beckman Coulter) and beads were resuspended in 6.4 μl H2O. IVT mix was added (1.6 μl d(A/C/G/T)TPs, 1.6 μl T7 Buffer, 1.6 μl T7 enzyme (Ambion), and incubated overnight at 37°C. ExoSAP, 6 μl (Agilent) was added and incubated at 37°C for 15 min. RNA was then fragmented by adding 5.5 μl fragmentation buffer (200mM Tris-acetate (Sigma), pH 8.1, 500 mM KOAc (Sigma), 150 mM MgOAc (Sigma)). Ampure beads were removed and RNA was cleaned using RNAclean XP beads (Beckman Coulter) at 1.8x ratio and eluted in 7 μl H2O. Libraries were prepped by first performing RT (2 μl Superscript II First-Strand Buffer (Life Technologies), 1 μl 0.1M DTT (Life Technologies), 0.5 μl RNaseOUT (Life Technologies), 0.5 μl SuperScript II reverse transcriptase (Life Technologies)) and incubating at 25°C for 10 min and 42°C for 1 hour. Finally, PCR mastermix (25 μl NEBNext Mastermix (NEB), 11 μl H2O and 2 μl P5 Nextera primer) was added and thermal cycled for 30 s at 98°C, 11 cycles of 98°C for 10 s, 60°C for 30 s and 72°C for 30 s and finally 72°C for 10 min. Amplified cDNA was cleaned using a 0.8x ratio of AMPureXP beads and eluted in 25 μl EB H2O.
MitoTimer and cell size
Flies were homozygous (GH146-Gal4) or heterozygous (all other) for the Gal4 driver and UAS-mitoTimer (Laker et al., 2014). They were raised in mixed populations of ∼20 flies at 25°C in 12h/12h day/night light cycle conditions, and flies of different ages were assayed the same day side by side. The brains were dissected in ice-cold PBS and imaged immediately (without fixation), using a Nikon widefield microscope equipped with a 20x/0.75NA water immersion objective and GFP and dsRed emission filters. The acquisition settings were kept the same for all brains of one genotype, and the same exposure times were used for both channels. For each defined fluorescent soma (or lobe region for the mushroom body/OK107-Gal4), size and average red and green fluorescence were determined using Fiji (Schindelin et al., 2012). Background was subtracted from fluorescent values, and the ratio of green and red fluorescent mitoTimer was calculated for each soma (value green/(value red + value green)∗100). To compare single channel intensities per cell, values were normalized to the cell’s size. For display, all images across one genotype and fluorescence color are scaled equally. Mushroom body beta prime lobes were not analyzed, as they could not be distinguished unambiguously.
High-throughput sequencing
Before sequencing, the fragment size of every library was analyzed on a Bioanalyzer high sensitivity chip. The libraries were diluted to 2 nM and quantified by qPCR using primers against p5-p7 sequence. All 10x libraries were sequenced on HiSeq4000 and NextSeq500 instruments (Illumina) with following sequencing parameters: 26 bp read 1 – 8 bp index 1 (i7) – 88 bp read 2. All CEL-Seq2 libraries were sequenced on a NextSeq instrument (Illumina). Custom primers for index read 1 and read 2 were added to the Illumina sequencing primers. The following sequencing parameters were used: 51 bp read 1 – 6 bp index 1 (i7) – 8 bp index 2 (i5) – 26 bp read 2. SMART-Seq2 libraries were sequenced on the HiSeq4000, the following sequencing parameters were used: 51 bp read 1 – 8 bp index 1 (i7) – 8 bp index 2 (i5).
Quantification and Statistical Analysis
Raw Datasets
The 10x fly brain samples were each processed (alignment, barcode assignment and UMI counting) with Cell Ranger (version 2.0.0) count pipeline. The Cell Ranger reference index was built upon the 3rd 2017 FlyBase release (D. melanogaster r6.16) (Gramates et al., 2017). Median saturation was calculated as the median of the Sequencing Saturation metric reported by the CellRanger software.
10x Data Preprocessing
All samples but the ones with short dissociation protocol (SDP) were selected to build the high-quality datasets. The –recovered-cells parameter was specified for each Cell Ranger run with the number of cells that we expected to recover for each individual single-library (Table S1). Therefore, the number of cells in each sample was estimated by the Cell Ranger cell detection algorithm. The final raw DGRP-551 dataset was built by aggregating all the DGRP-551 samples using Cell Ranger aggregation pipeline without applying any Cell Ranger normalization method. The final raw w1118 dataset was built in the same way as the DGRP-551 dataset. Final dimensions of the raw DGRP-551 and w1118 datasets are 17,473 by 32,277, and 17,473 genes by 31,951 cells, respectively.
A large dataset of 157,390 cells (all samples in Table S1) was generated using a custom method to select the cells, less stringent than the one from Cell Ranger (Figure S1G). A common technique to discriminate cell-associated barcodes and the barcodes associated with empty partitions is to plot the cumulative fraction of reads/UMIs for all barcodes and look at its “knee.” The true cell barcodes would be assigned to the barcodes below the cut-off defined by the location of the knee. A new method was used to detect this “knee.” This method is based on the 10x publicly available dataset 1:1 mixture of fresh frozen human (HEK293T) and mouse (NIH 3T3) cells. The total UMIs associated to each raw barcode was computed per species and this was used to plot the cumulative fraction of UMIs plot for all barcodes. Each barcode is considered as a mixed cell if less than 95% of the UMIs are not associated to one of the 2 species. With this, the cumulative fraction of mixed cells was computed. This number is almost flat for first top barcodes but then starts to grow linearly. A linear model was fitted through the linear part of the cumulative fraction of mixed cells (25,000th to 50,000th barcode). The fitted model intersected the x axis at ∼12,419 which is very close to the expected number of cells (12k). A spline was fitted to the cumulative fraction of UMIs in order to find the tangent at this intercept. The angle of the tangent was then used as cut-off for each single-library dataset to discriminate the true cell barcodes from the empty partitions.
Cell Ranger uses a cell detection algorithm to discriminate true cell barcodes from empty partitions. To clean the data further, quality control and filtering based on scater (McCarthy et al., 2017) applied on each dataset. Genes not expressed in any cells were removed, leaving 13,991 genes for the DGRP-551 dataset and 13,581 for the w1118 dataset. Then, a principal component analysis (PCA) based on quality metrics (calculated by the scater R-package was performed for each cell. If the cell’s metrics deviated more than 5 absolute deviations from the median, the cell was flagged as an outlier. The number of cells passing the quality controls are 29,137 and 27,765 respectively for DGRP-551 and w1118. Finally, low-abundance genes, defined as those with an average count below a filter threshold of 0.001 were removed. Dimensions of the final preprocessed DGRP-551 and w1118 datasets are 9,461 genes by 29,137 cells, and 9,349 genes by 27,765 cells, respectively.
SMART-Seq2 and CEL-Seq2 Data Processing
Reads were first cleaned for adapters using fastq-mcf. (Aronesty, 2011) and a list of sequencing primers. Multiplexed CEL-Seq2 cells were demultiplexed with custom scripts utilizing pysam (Li et al., 2009). Cleaned reads were then mapped to the 3rd 2017 FlyBase release (D. melanogaster r6.16) genome using STAR with default parameters. Reads were counted per gene using featureCounts. For data analysis, only cells with a total number of reads higher than 10,000 (CEL-Seq2) or 20,000 (SMART-Seq2) were used.
ATAC-seq Data Processing
ATAC-seq reads were first cleaned for adapters using fastq-mcf. (Aronesty, 2011) and a list of sequencing primers. Cleaned reads were then mapped to the 3rd 2017 FlyBase release (D. melanogaster r6.16) genome using STAR with the following additional options:–alignIntronMax 1–alignIntronMin 2. Peaks were called on mapped reads using macs2 (Feng et al., 2011) with the following additional options:–nomodel–call-summits. Aggregation plots were produced using in-house scripts available at: https://github.com/aertslab/ATAC-seq-analysis.
RNA-seq Data Processing
RNA-seq reads were first cleaned for adapters using fastq-mcf. (Aronesty, 2011) and a list of sequencing primers. Cleaned reads were then mapped to the 3rd 2017 FlyBase release (D. melanogaster r6.16) genome using STAR with default parameters. Reads were counted per gene using featureCounts (Liao et al., 2014). Differential analysis was performed using DESeq2 (Love et al., 2014).
Seurat
The Seurat pipeline was executed on a combined dataset of DGRP-551 and w1118 (Satija et al., 2015). First, cells were selected from the preprocessed files of each genotype and a matrix was constructed with all genes. Then the scater R-package was used to select genes as previously described. This matrix was then used as input for Seurat. Next, the data were log-normalized with a scale factor of 104. The latent variables, defined as the number of UMI and the percentage of mitochondrial reads per cell, were regressed out using a negative binomial model. For further downstream analysis, the most variable genes (937) were selected using FindVariableGenes (Seurat R package) with default parameters. The graph-based method from Seurat was used to cluster cells. The PCA was selected as dimensional reduction technique to use in construction of Shared Nearest-Neighbor (SNN) graph. In order to select the number of PCs as input into the clustering algorithm, we performed a cross-validation step which lead us to select the first 82 PCs. These 82 PCs were then used in an SSN clustering, with different settings for the resolution parameter, between 2.0 and 8.0, leading to 87-151 clusters. We identified markers specific to each cluster and calculated differential expression, using the default parameters and the bimod model (McDavid et al., 2013). A t-SNE clustering was performed on the scaled matrix (with most variable genes only) to obtain a two-dimensional representation of the cell states. Finally, perplexity value of 30 and 82 PCs were picked for the final Seurat t-SNE.
SCENIC fly database
SCENIC was run as described in (Aibar et al., 2017). For this study, we created the motif databases that allow to use RcisTarget and SCENIC on Drosophila (dm6, gene names from FlyBase version FB2016_05). We scored the 20,003 motifs (Position Weight Matrices) in v8 of the i-cisTarget (Imrichová et al., 2015) database on the regulatory regions up to 5KB upstream of each gene and within its introns. The gene-motif rankings were then built taking the best-scoring region for each motif and gene. These databases are made available for download to use with RcisTarget.
SCENIC on DGRP-551 dataset
SCENIC was applied on the DGRP-551 dataset after removing genes that were not present in our dm6 motifs ranking database. The input UMI count matrix was normalized (CPM) and log-transformed using edgeR (Robinson et al., 2010) with prior of 1. Targets genes that did not show a positive correlation based on the GENIE3 (Huynh-Thu et al., 2010) co-expression algorithm (> 0.03) in each TF-module were filtered out. After removing TF-modules having less than 20 genes, SCENIC found 3,064 TF-modules. A cis-regulatory motif analysis on each of the TF-modules with RcisTarget revealed 150 regulons (each with at least 10 targets genes). The top 1 percentile of the number of detected genes per cell was used to calculate the AUCell enrichment of each regulon in each cell. We performed a t-SNE clustering on the regulon AUC matrix to obtain a two-dimensional representation of the cell states.
Regulons which showed negative correlation (< 0.03) of their target genes with the corresponding TF were also assessed in the same way as for the “positively correlated regulons.” This way, we found 13 additional regulons.
SCENIC on w1118 dataset
The w1118 dataset was used to validate the regulons obtained from the DGRP-551 dataset. Specifically, all the filtered w1118 cells were scored through AUCell (Aibar et al., 2017) on the DGRP-551 regulons. A t-SNE clustering was then applied similarly as for DGRP-551 dataset.
SCENIC on DGRP-551 and w1118 high quality dataset
All 56,902 cells originating from the two preprocessed datasets (DGRP-551 and w1118) were rescored on the regulons found in the DGRP-551 dataset using AUCell. The two-dimensional representation of the cell states for the combined dataset were computed using the t-SNE clustering algorithm on the regulon AUC matrix. A perplexity value of 60 and a number of PCs of 25 were selected for the SCENIC t-SNE. This same method was applied for the large dataset (less stringent filtering) containing 157,390 cells.
SCENIC on DGRP-551 and w1118 large dataset
Since GENIE3 does not scale well with the number of cells, GRNBoost2 (https://github.com/tmoerman/arboreto) was applied as alternative in the SCENIC pipeline to infer gene regulatory networks from expression data. The same parameters in the pipeline were used as for the DGRP-551 dataset except that we lowered the minimum number of required genes of a regulon.
NNLS regression
Cluster-to-bulk mapping was performed through a non-negative least-squares regression model (NNLS), as previously described by (Stanescu et al., 2017). NNLS is a constrained version of least-squares regression where the coefficients are forced to be positive. The regression model was fit using gene signatures derived from Seurat as features. Before fitting, all datasets were scaled to CPM using the common genes, independent of previously applied normalization techniques. A higher weight in the model can be interpreted as a higher similarity between the cluster and the bulk RNA-seq. The calculations were performed using the SciPy (Jones et al., 2001) package in Python.
Iterative Clustering for Identifying Markers
Iterative clustering for identifying markers (ICIM) was performed through the code available on Github (https://github.com/felixhorns/FlyPN). The same genes found for the SMART-Seq2 data were used in the subclustering of the OPNs from cluster 27.
Age prediction using machine learning
Age prediction was performed using a random forest regression model (max_depth = 3, n_estimators = 8) with 5 fold cross validation as implemented in scikit-learn (Pedregosa et al., 2011). Per gene decline with age was assessed by calculating the Pearson correlation of gene expression with age.
Diffusion maps
Diffusion components were calculated on CPM normalized UMI matrices for each Seurat cluster using the Destiny package (R) (Angerer et al., 2016). Next, the Pearson correlation with number of UMIs and age was calculated.
Mitochondrial oxidative phosphorylation and glycolysis enrichment
The mitochondrial oxidative phosphorylation (OxPhos) and glycolysis gene sets were extracted from (Jang et al., 2016) and from (Kanehisa and Goto, 2000) respectively. Cell enrichment for these gene sets were performed with AUCell (Aibar et al., 2017) using default parameters.
Among the neurons, we defined 3 more groups along the x axis of the SCENIC t-SNE (Figure 4E) based on regulon AUC and gene expression values. The cells that have a Dati regulon AUC value strictly above 0.3 are defined as “Central Brain A” (left group). Second, “Central Brain B” is defined as the group of cells that have at least 2 UMIs in Imp expression and that are not part of “Central Brain A” group of cells. Lastly, we classified cells as “Optic Lobe” if they have a Dati regulon AUC value strictly less than 0.15 and are not part of “Central Brain B” group.
The assignment of each Seurat cluster to the three groups mentioned above was first done in an automated way i.e., the cluster was assigned to the group which has the highest normalized number of cells in that group. The assignments were then manually curated.
Next, the Seurat package was chosen to perform differential gene expression (bimod model) on one hand between Central Brain A and Central Brain and on the other hand between Central Brain A and Optic Lobe. The two resulting gene sets were filtered by p value (p value < 0.05) and log fold change (logFC > 0.2). Then, GO term enrichment was done on both sets using clusterProfiler (Yu et al., 2012) with default parameters and the results were visualized with GOplot (Walter et al., 2015).
Mitochondrial reads cell proportion
The mitochondrial reads proportion across cells were calculated based on the mitochondrial genes. The UMI were summed over all mitochondrial genes and then normalized using DESeq2 (Love et al., 2014) across Central Brain A/Central Brain B and Optic Lobe groups.
Gene Ontology enrichment analysis
GO term enrichment was performed using GOrilla (Eden et al., 2009).
Exponential decline
The median value for the number of UMIs and the number of genes was calculated for each replicate and the following model was fit: , with x the age in days and y the number of UMIs/genes. The time constant was calculated as and is a measure of the speed of the decline. The ratio was calculated by grouping young (< 6 days) and old (> 9 days) flies, taking the median per age, followed by taking the mean over the different ages. Next, the old values were divided by the young values to calculate the old/young ratio.
Loom File Generation
Python (SCopeLoomPy) and R (ScopeLoomR) packages were created and used to generate SCope compatible loom files.
Data and Software Availability
SCope is available online at http://scope.aertslab.org, and the code is released as open source code on Github. The scRNA-seq data has been deposited in GEO under accession code GEO: GSE107451. SCENIC for Drosophila is available at http://scenic.aertslab.org.
Acknowledgments
This work is funded by The Research Foundation - Flanders (FWO; grants G.0640.13 and G.0791.14 to S. Aerts), Special Research Fund (BOF) KU Leuven (grants PF/10/016 and OT/13/103 to S. Aerts), an “Opening the Future” grant to P.V., and a Methusalem Grant (3M140280) of the Flemish Government and ERC consolidator grants to P.V. (646671 RobustSynapses) and S. Aerts (724226 cis-CONTROL). S. Aibar is supported by a PDM Postdoctoral Fellowship from the KU Leuven (PDM/16/188). K.D. is supported by a PhD fellowship from the agency for Innovation by Science and Technology (IWT, 141509). J.J. is supported by a PhD fellowship of The Research Foundation – Flanders (FWO, 1199518N). U.P. is supported by a fellowship from the Deutsche Forschungsgemeinschaft (DFG, 808066). 10x Chromium was made available through VIB Tech Watch Funding. The Nikon Spinning Disk microscope was funded by a CLME grant to the VIB BioImaging Core. Imaging and single-cell analyses were supported by the light microscopy and single-cell expertise units at the VIB-KU Leuven Center for Brain and Disease Research. Computing was performed at the Vlaams Supercomputer Center (VSC). The funders had no role in study design, data collection and analysis, decision to publish, or preparation of the manuscript. The authors thank Fernando Casares, Bassem Hassan, Dietmar Schmucker, Pierre Vanderhaeghen, Joris De Wit, and Sara De Sa Cesariny Calafate for helpful discussions and for reviewing the manuscript and Kerri Heritage for her help in editing and reviewing the manuscript.
Author Contributions
Conceptualization, K.D., J.J., P.V., and S. Aerts; Software, K.D., M.D.W., Ł.K., S. Aibar, and G.H.; Validation, K.D., D.K., U.P., S. Aibar, S.M., and V.C.; Formal Analysis, K.D., J.J., D.K., U.P., S. Aibar, M.D.W., C.B.G.-B., K.I.S., T.M., S.G., M.F., S.P., and S. Aerts; Investigation, K.D., J.J., D.K., U.P., S.M., and V.C.; Resources, B.V., T.V., J.L., S.L., N.K., and P.V.; Data Curation, K.D. and M.D.W.; Writing – Original Draft, K.D., J.J., D.K., U.P., S. Aibar, M.D.W., S.M., V.C., C.B.G.-B., K.I.S., B.T., S.L., P.V., and S. Aerts; Writing – Review & Editing, K.D., J.J., D.K., U.P., S. Aibar, M.D.W., S.M., V.C., C.B.G.-B., K.I.S., S.L., P.V., and S. Aerts; Visualization, K.D., J.J., D.K., U.P., S. Aibar, and M.D.W.; Supervision, K.D. and S. Aerts; Project Administration, K.D. and S. Aerts; Funding Acquisition, K.D., J.J., P.V., and S. Aerts.
Declaration of Interests
The authors declare no competing interests.
Published: June 14, 2018
Footnotes
Supplemental Information includes seven figures, five tables, and one dataset and can be found with this article online at https://doi.org/10.1016/j.cell.2018.05.057.
Supporting Citations
The following references appear in the Supplemental Information: Bou Dib et al., 2014, Brogiolo et al., 2001, Carlsson et al., 2010, Couch et al., 2004, Diesner et al., 2018, Doherty et al., 2009, Goto et al., 2001, Klarsfeld et al., 2004, Komiyama et al., 2003, Kunst et al., 2014, Luan et al., 2006, Medioni et al., 2014, Melcher and Pankratz, 2005, Min et al., 2016, Park et al., 2000, Park et al., 2008, Rulifson et al., 2002, Spindler et al., 2009.
Supplemental Information
References
- Abruzzi K.C., Zadina A., Luo W., Wiyanto E., Rahman R., Guo F., Shafer O., Rosbash M. RNA-seq analysis of Drosophila clock and non-clock neurons reveals neuron-specific cycling and novel candidate neuropeptides. PLoS Genet. 2017;13:e1006613. doi: 10.1371/journal.pgen.1006613. [DOI] [PMC free article] [PubMed] [Google Scholar]
- Aibar S., González-Blas C.B., Moerman T., Huynh-Thu V.A., Imrichova H., Hulselmans G., Rambow F., Marine J.-C., Geurts P., Aerts J. SCENIC: single-cell regulatory network inference and clustering. Nat. Methods. 2017;14:1083–1086. doi: 10.1038/nmeth.4463. [DOI] [PMC free article] [PubMed] [Google Scholar]
- Allada R., Chung B.Y. Circadian organization of behavior and physiology in Drosophila. Annu. Rev. Physiol. 2010;72:605–624. doi: 10.1146/annurev-physiol-021909-135815. [DOI] [PMC free article] [PubMed] [Google Scholar]
- Angerer P., Haghverdi L., Büttner M., Theis F.J., Marr C., Buettner F. destiny: diffusion maps for large-scale single-cell data in R. Bioinformatics. 2016;32:1241–1243. doi: 10.1093/bioinformatics/btv715. [DOI] [PubMed] [Google Scholar]
- Aronesty E. Expression Analysis; Durham, NC: 2011. ea-utils: Command-line tools for processing biological sequencing data. [Google Scholar]
- Awasaki T., Saito M., Sone M., Suzuki E., Sakai R., Ito K., Hama C. The Drosophila trio plays an essential role in patterning of axons by regulating their directional extension. Neuron. 2000;26:119–131. doi: 10.1016/s0896-6273(00)81143-5. [DOI] [PubMed] [Google Scholar]
- Bainton R.J., Tsai L.T.-Y., Schwabe T., DeSalvo M., Gaul U., Heberlein U. moody encodes two GPCRs that regulate cocaine behaviors and blood-brain barrier permeability in Drosophila. Cell. 2005;123:145–156. doi: 10.1016/j.cell.2005.07.029. [DOI] [PubMed] [Google Scholar]
- Bernardo-Garcia F.J., Fritsch C., Sprecher S.G. The transcription factor Glass links eye field specification with photoreceptor differentiation in Drosophila. Development. 2016;143:1413–1423. doi: 10.1242/dev.128801. [DOI] [PubMed] [Google Scholar]
- Boll W., Noll M. The Drosophila Pox neuro gene: control of male courtship behavior and fertility as revealed by a complete dissection of all enhancers. Development. 2002;129:5667–5681. doi: 10.1242/dev.00157. [DOI] [PubMed] [Google Scholar]
- Bou Dib P., Gnägi B., Daly F., Sabado V., Tas D., Glauser D.A., Meister P., Nagoshi E. A conserved role for p48 homologs in protecting dopaminergic neurons from oxidative stress. PLoS Genet. 2014;10:e1004718. doi: 10.1371/journal.pgen.1004718. [DOI] [PMC free article] [PubMed] [Google Scholar]
- Brogiolo W., Stocker H., Ikeya T., Rintelen F., Fernandez R., Hafen E. An evolutionarily conserved function of the Drosophila insulin receptor and insulin-like peptides in growth control. Curr. Biol. 2001;11:213–221. doi: 10.1016/s0960-9822(01)00068-9. [DOI] [PubMed] [Google Scholar]
- Carlsson M.A., Diesner M., Schachtner J., Nässel D.R. Multiple neuropeptides in the Drosophila antennal lobe suggest complex modulatory circuits. J. Comp. Neurol. 2010;518:3359–3380. doi: 10.1002/cne.22405. [DOI] [PubMed] [Google Scholar]
- Chen R., Wu X., Jiang L., Zhang Y. Single-cell RNA-seq reveals hypothalamic cell diversity. Cell Rep. 2017;18:3227–3241. doi: 10.1016/j.celrep.2017.03.004. [DOI] [PMC free article] [PubMed] [Google Scholar]
- Chen Z., Del Valle Rodriguez A., Li X., Erclik T., Fernandes V.M., Desplan C. A unique class of neural progenitors in the Drosophila optic lobe generates both migrating neurons and glia. Cell Rep. 2016;15:774–786. doi: 10.1016/j.celrep.2016.03.061. [DOI] [PMC free article] [PubMed] [Google Scholar]
- Couch J.A., Chen J., Rieff H.I., Uri E.M., Condron B.G. robo2 and robo3 interact with eagle to regulate serotonergic neuron differentiation. Development. 2004;131:997–1006. doi: 10.1242/dev.00962. [DOI] [PubMed] [Google Scholar]
- Crocker A., Guan X.-J., Murphy C.T., Murthy M. Cell-type-specific transcriptome analysis in the Drosophila mushroom body reveals memory-related changes in gene expression. Cell Rep. 2016;15:1580–1596. doi: 10.1016/j.celrep.2016.04.046. [DOI] [PMC free article] [PubMed] [Google Scholar]
- Croset V., Treiber C.D., Waddell S. Cellular diversity in the Drosophila midbrain revealed by single-cell transcriptomics. eLife. 2018;7:e34550. doi: 10.7554/eLife.34550. [DOI] [PMC free article] [PubMed] [Google Scholar]
- DeSalvo M.K., Hindle S.J., Rusan Z.M., Orng S., Eddison M., Halliwill K., Bainton R.J. The Drosophila surface glia transcriptome: evolutionary conserved blood-brain barrier processes. Front. Neurosci. 2014;8:346. doi: 10.3389/fnins.2014.00346. [DOI] [PMC free article] [PubMed] [Google Scholar]
- Diesner M., Predel R., Neupert S. Neuropeptide mapping of dimmed cells of adult Drosophila brain. J. Am. Soc. Mass Spectrom. 2018;29:890–902. doi: 10.1007/s13361-017-1870-1. [DOI] [PubMed] [Google Scholar]
- Doherty J., Logan M.A., Taşdemir O.E., Freeman M.R. Ensheathing glia function as phagocytes in the adult Drosophila brain. J. Neurosci. 2009;29:4768–4781. doi: 10.1523/JNEUROSCI.5951-08.2009. [DOI] [PMC free article] [PubMed] [Google Scholar]
- Dobin A., Davis C.A., Schlesinger F., Drenkow J., Zaleski C., Jha S., Batut P., Chaisson M., Gingeras T.R. STAR: ultrafast universal TNA-seq aligner. Bioinformatics. 2013;29:15–21. doi: 10.1093/bioinformatics/bts635. [DOI] [PMC free article] [PubMed] [Google Scholar]
- Eden E., Navon R., Steinfeld I., Lipson D., Yakhini Z. GOrilla: a tool for discovery and visualization of enriched GO terms in ranked gene lists. BMC Bioinformatics. 2009;10:48. doi: 10.1186/1471-2105-10-48. [DOI] [PMC free article] [PubMed] [Google Scholar]
- Erclik T., Li X., Courgeon M., Bertet C., Chen Z., Baumert R., Ng J., Koo C., Arain U., Behnia R. Integration of temporal and spatial patterning generates neural diversity. Nature. 2017;541:365–370. doi: 10.1038/nature20794. [DOI] [PMC free article] [PubMed] [Google Scholar]
- Feng J., Liu T., Zhang Y. Using MACS to Identify Peaks from ChIP-Seq Data. Curr Protoc Bioinformatics. 2011 doi: 10.1002/0471250953.bi0214s34. [DOI] [PMC free article] [PubMed] [Google Scholar]
- Ferree A.W., Trudeau K., Zik E., Benador I.Y., Twig G., Gottlieb R.A., Shirihai O.S. MitoTimer probe reveals the impact of autophagy, fusion, and motility on subcellular distribution of young and old mitochondrial protein and on relative mitochondrial protein age. Autophagy. 2013;9:1887–1896. doi: 10.4161/auto.26503. [DOI] [PMC free article] [PubMed] [Google Scholar]
- Goto A., Kadowaki T., Kitagawa Y. Drosophila hemolectin gene is expressed in embryonic and larval hemocytes and its knock down causes bleeding defects. Dev. Biol. 2003;264:582–591. doi: 10.1016/j.ydbio.2003.06.001. [DOI] [PubMed] [Google Scholar]
- Goto A., Kumagai T., Kumagai C., Hirose J., Narita H., Mori H., Kadowaki T., Beck K., Kitagawa Y. A Drosophila haemocyte-specific protein, hemolectin, similar to human von Willebrand factor. Biochem J. 2001;359:99–108. doi: 10.1042/0264-6021:3590099. [DOI] [PMC free article] [PubMed] [Google Scholar]
- Gramates L.S., Marygold S.J., Santos G.D., Urbano J.-M., Antonazzo G., Matthews B.B., Rey A.J., Tabone C.J., Crosby M.A., Emmert D.B., the FlyBase Consortium FlyBase at 25: looking to the future. Nucleic Acids Res. 2017;45(D1):D663–D671. doi: 10.1093/nar/gkw1016. [DOI] [PMC free article] [PubMed] [Google Scholar]
- Hadžić T., Park D., Abruzzi K.C., Yang L., Trigg J.S., Rohs R., Rosbash M., Taghert P.H. Genome-wide features of neuroendocrine regulation in Drosophila by the basic helix-loop-helix transcription factor DIMMED. Nucleic Acids Res. 2015;43:2199–2215. doi: 10.1093/nar/gku1377. [DOI] [PMC free article] [PubMed] [Google Scholar]
- Hamanaka Y., Meinertzhagen I.A. Immunocytochemical localization of synaptic proteins to photoreceptor synapses of Drosophila melanogaster. J. Comp. Neurol. 2010;518:1133–1155. doi: 10.1002/cne.22268. [DOI] [PMC free article] [PubMed] [Google Scholar]
- Han X., Wang R., Zhou Y., Fei L., Sun H., Lai S., Saadatpour A., Zhou Z., Chen H., Ye F. Mapping the Mouse Cell Atlas by Microwell-Seq. Cell. 2018;172:1091–1107.e17. doi: 10.1016/j.cell.2018.02.001. [DOI] [PubMed] [Google Scholar]
- Hasegawa E., Kitada Y., Kaido M., Takayama R., Awasaki T., Tabata T., Sato M. Concentric zones, cell migration and neuronal circuits in the Drosophila visual center. Development. 2011;138:983–993. doi: 10.1242/dev.058370. [DOI] [PubMed] [Google Scholar]
- Hasegawa E., Kaido M., Takayama R., Sato M. Brain-specific-homeobox is required for the specification of neuronal types in the Drosophila optic lobe. Dev. Biol. 2013;377:90–99. doi: 10.1016/j.ydbio.2013.02.012. [DOI] [PubMed] [Google Scholar]
- Hassan B.A., Bermingham N.A., He Y., Sun Y., Jan Y.N., Zoghbi H.Y., Bellen H.J. atonal regulates neurite arborization but does not act as a proneural gene in the Drosophila brain. Neuron. 2000;25:549–561. doi: 10.1016/s0896-6273(00)81059-4. [DOI] [PubMed] [Google Scholar]
- Huynh-Thu V.A., Irrthum A., Wehenkel L., Geurts P. Inferring regulatory networks from expression data using tree-based methods. PLoS ONE. 2010;5:e12776. doi: 10.1371/journal.pone.0012776. [DOI] [PMC free article] [PubMed] [Google Scholar]
- Imrichová H., Hulselmans G., Atak Z.K., Potier D., Aerts S. i-cisTarget 2015 update: generalized cis-regulatory enrichment analysis in human, mouse and fly. Nucleic Acids Res. 2015;43:W57–W64. doi: 10.1093/nar/gkv395. [DOI] [PMC free article] [PubMed] [Google Scholar]
- Ito M., Masuda N., Shinomiya K., Endo K., Ito K. Systematic analysis of neural projections reveals clonal composition of the Drosophila brain. Curr. Biol. 2013;23:644–655. doi: 10.1016/j.cub.2013.03.015. [DOI] [PubMed] [Google Scholar]
- Jang S., Nelson J.C., Bend E.G., Rodríguez-Laureano L., Tueros F.G., Cartagenova L., Underwood K., Jorgensen E.M., Colón-Ramos D.A. Glycolytic enzymes localize to synapses under energy stress to support synaptic function. Neuron. 2016;90:278–291. doi: 10.1016/j.neuron.2016.03.011. [DOI] [PMC free article] [PubMed] [Google Scholar]
- Janky R., Verfaillie A., Imrichová H., Van de Sande B., Standaert L., Christiaens V., Hulselmans G., Herten K., Naval Sanchez M., Potier D. iRegulon: from a gene list to a gene regulatory network using large motif and track collections. PLoS Comput. Biol. 2014;10:e1003731. doi: 10.1371/journal.pcbi.1003731. [DOI] [PMC free article] [PubMed] [Google Scholar]
- Johard H.A.D., Enell L.E., Gustafsson E., Trifilieff P., Veenstra J.A., Nässel D.R. Intrinsic neurons of Drosophila mushroom bodies express short neuropeptide F: relations to extrinsic neurons expressing different neurotransmitters. J. Comp. Neurol. 2008;507:1479–1496. doi: 10.1002/cne.21636. [DOI] [PubMed] [Google Scholar]
- Jones, E., Oliphant, T., and Peterson, P. (2001). SciPy: Open source scientific tools for Python. http://www.scipy.org/.
- Kanehisa M., Goto S. KEGG: kyoto encyclopedia of genes and genomes. Nucleic Acids Res. 2000;28:27–30. doi: 10.1093/nar/28.1.27. [DOI] [PMC free article] [PubMed] [Google Scholar]
- Karaiskos N., Wahle P., Alles J., Boltengagen A., Ayoub S., Kipar C., Kocks C., Rajewsky N., Zinzen R.P. The Drosophila embryo at single-cell transcriptome resolution. Science. 2017;358:194–199. doi: 10.1126/science.aan3235. [DOI] [PubMed] [Google Scholar]
- Karuppudurai T., Lin T.-Y., Ting C.-Y., Pursley R., Melnattur K.V., Diao F., White B.H., Macpherson L.J., Gallio M., Pohida T., Lee C.H. A hard-wired glutamatergic circuit pools and relays UV signals to mediate spectral preference in Drosophila. Neuron. 2014;81:603–615. doi: 10.1016/j.neuron.2013.12.010. [DOI] [PMC free article] [PubMed] [Google Scholar]
- Klaes A., Menne T., Stollewerk A., Scholz H., Klämbt C. The Ets transcription factors encoded by the Drosophila gene pointed direct glial cell differentiation in the embryonic CNS. Cell. 1994;78:149–160. doi: 10.1016/0092-8674(94)90581-9. [DOI] [PubMed] [Google Scholar]
- Klarsfeld A., Malpel S., Michard-Vanhée C., Picot M., Chélot E., Rouyer F. Novel features of cryptochrome-mediated photoreception in the brain circadian clock of Drosophila. J. Neurosci. 2004;24:1468–1477. doi: 10.1523/JNEUROSCI.3661-03.2004. [DOI] [PMC free article] [PubMed] [Google Scholar]
- Kolodziejczyk A., Sun X., Meinertzhagen I.A., Nässel D.R. Glutamate, GABA and acetylcholine signaling components in the lamina of the Drosophila visual system. PLoS ONE. 2008;3:e2110. doi: 10.1371/journal.pone.0002110. [DOI] [PMC free article] [PubMed] [Google Scholar]
- Komiyama T., Luo L. Intrinsic control of precise dendritic targeting by an ensemble of transcription factors. Curr. Biol. 2007;17:278–285. doi: 10.1016/j.cub.2006.11.067. [DOI] [PubMed] [Google Scholar]
- Komiyama T., Johnson W.A., Luo L., Jefferis G.S.X.E. From lineage to wiring specificity. POU domain transcription factors control precise connections of Drosophila olfactory projection neurons. Cell. 2003;112:157–167. doi: 10.1016/s0092-8674(03)00030-8. [DOI] [PubMed] [Google Scholar]
- Konstantinides N., Kapuralin K., Fadil C., Barboza L., Satija R., Desplan C. Phenotypic convergence: distinct transcription factors regulate common terminal features. Cell. 2018;173 doi: 10.1016/j.cell.2018.05.021. [DOI] [PMC free article] [PubMed] [Google Scholar]
- Kremer M.C., Jung C., Batelli S., Rubin G.M., Gaul U. The glia of the adult Drosophila nervous system. Glia. 2017;65:606–638. doi: 10.1002/glia.23115. [DOI] [PMC free article] [PubMed] [Google Scholar]
- Kunst M., Hughes M.E., Raccuglia D., Felix M., Li M., Barnett G., Duah J., Nitabach M.N. Calcitonin gene-related peptide neurons mediate sleep-specific circadian output in Drosophila. Curr. Biol. 2014;24:2652–2664. doi: 10.1016/j.cub.2014.09.077. [DOI] [PMC free article] [PubMed] [Google Scholar]
- Kurtzer G.M., Sochat V., Bauer M.W. Singularity: Scientific containers for mobility of compute. PLoS ONE. 2017;12:e0177459. doi: 10.1371/journal.pone.0177459. [DOI] [PMC free article] [PubMed] [Google Scholar]
- Lake B.B., Chen S., Sos B.C., Fan J., Kaeser G.E., Yung Y.C., Duong T.E., Gao D., Chun J., Kharchenko P.V., Zhang K. Integrative single-cell analysis of transcriptional and epigenetic states in the human adult brain. Nat. Biotechnol. 2018;36:70–80. doi: 10.1038/nbt.4038. [DOI] [PMC free article] [PubMed] [Google Scholar]
- Laker R.C., Xu P., Ryall K.A., Sujkowski A., Kenwood B.M., Chain K.H., Zhang M., Royal M.A., Hoehn K.L., Driscoll M. A novel MitoTimer reporter gene for mitochondrial content, structure, stress, and damage in vivo. J. Biol. Chem. 2014;289:12005–12015. doi: 10.1074/jbc.M113.530527. [DOI] [PMC free article] [PubMed] [Google Scholar]
- Li H., Handsaker B., Wysoker A., Fennell T., Ruan J., Homer N., Marth G., Abecasis G., Durbin R., 1000 Genome Project Data Processing Subgroup The sequence alignment/map format and SAMtools. Bioinformatics. 2009;25:2078–2079. doi: 10.1093/bioinformatics/btp352. [DOI] [PMC free article] [PubMed] [Google Scholar]
- Li H., Horns F., Wu B., Xie Q., Li J., Li T., Luginbuhl D.J., Quake S.R., Luo L. Classifying Drosophila olfactory projection neuron subtypes by single-cell RNA sequencing. Cell. 2017;171:1206–1220.e22. doi: 10.1016/j.cell.2017.10.019. [DOI] [PMC free article] [PubMed] [Google Scholar]
- Li X., Erclik T., Bertet C., Chen Z., Voutev R., Venkatesh S., Morante J., Celik A., Desplan C. Temporal patterning of Drosophila medulla neuroblasts controls neural fates. Nature. 2013;498:456–462. doi: 10.1038/nature12319. [DOI] [PMC free article] [PubMed] [Google Scholar]
- Liao Y., Smyth G.K., Shi W. featureCounts: an efficient general purpose program for assigning sequence reads to genomic features. Bioinformatics. 2014;30:923–930. doi: 10.1093/bioinformatics/btt656. [DOI] [PubMed] [Google Scholar]
- Liu Z., Yang C.-P., Sugino K., Fu C.-C., Liu L.-Y., Yao X., Lee L.P., Lee T. Opposing intrinsic temporal gradients guide neural stem cell production of varied neuronal fates. Science. 2015;350:317–320. doi: 10.1126/science.aad1886. [DOI] [PubMed] [Google Scholar]
- Love M.I., Huber W., Anders S. Moderated estimation of fold change and dispersion for RNA-seq data with DESeq2. Genome Biol. 2014;15:550. doi: 10.1186/s13059-014-0550-8. [DOI] [PMC free article] [PubMed] [Google Scholar]
- Luan H., Lemon W.C., Peabody N.C., Pohl J.B., Zelensky P.K., Wang D., Nitabach M.N., Holmes T.C., White B.H. Functional dissection of a neuronal network required for cuticle tanning and wing expansion in Drosophila. J. Neurosci. 2006;26:573–584. doi: 10.1523/JNEUROSCI.3916-05.2006. [DOI] [PMC free article] [PubMed] [Google Scholar]
- van der Maaten L., Hinton G. Visualizing data using t-SNE. J. Mach. Learn. Res. 2008;9:2579–2605. [Google Scholar]
- Martinez-Jimenez C.P., Eling N., Chen H.-C., Vallejos C.A., Kolodziejczyk A.A., Connor F., Stojic L., Rayner T.F., Stubbington M.J.T., Teichmann S.A. Aging increases cell-to-cell transcriptional variability upon immune stimulation. Science. 2017;355:1433–1436. doi: 10.1126/science.aah4115. [DOI] [PMC free article] [PubMed] [Google Scholar]
- Maurange C., Cheng L., Gould A.P. Temporal transcription factors and their targets schedule the end of neural proliferation in Drosophila. Cell. 2008;133:891–902. doi: 10.1016/j.cell.2008.03.034. [DOI] [PubMed] [Google Scholar]
- McCarthy D.J., Campbell K.R., Lun A.T.L., Wills Q.F. Scater: pre-processing, quality control, normalization and visualization of single-cell RNA-seq data in R. Bioinformatics. 2017;33:1179–1186. doi: 10.1093/bioinformatics/btw777. [DOI] [PMC free article] [PubMed] [Google Scholar]
- McDavid A., Finak G., Chattopadyay P.K., Dominguez M., Lamoreaux L., Ma S.S., Roederer M., Gottardo R. Data exploration, quality control and testing in single-cell qPCR-based gene expression experiments. Bioinformatics. 2013;29:461–467. doi: 10.1093/bioinformatics/bts714. [DOI] [PMC free article] [PubMed] [Google Scholar]
- Medioni C., Ramialison M., Ephrussi A., Besse F. Imp promotes axonal remodeling by regulating profilin mRNA during brain development. Curr. Biol. 2014;24:793–800. doi: 10.1016/j.cub.2014.02.038. [DOI] [PubMed] [Google Scholar]
- Melcher C., Pankratz M.J. Candidate gustatory interneurons modulating feeding behavior in the Drosophila brain. PLoS Biol. 2005;3:e305. doi: 10.1371/journal.pbio.0030305. [DOI] [PMC free article] [PubMed] [Google Scholar]
- Melnattur K.V., Pursley R., Lin T.-Y., Ting C.-Y., Smith P.D., Pohida T., Lee C.-H. Multiple redundant medulla projection neurons mediate color vision in Drosophila. J. Neurogenet. 2014;28:374–388. doi: 10.3109/01677063.2014.891590. [DOI] [PMC free article] [PubMed] [Google Scholar]
- Min S., Chae H.-S., Jang Y.-H., Choi S., Lee S., Jeong Y.T., Jones W.D., Moon S.J., Kim Y.-J., Chung J. Identification of a peptidergic pathway critical to satiety responses in Drosophila. Curr. Biol. 2016;26:814–820. doi: 10.1016/j.cub.2016.01.029. [DOI] [PubMed] [Google Scholar]
- Minocha S., Boll W., Noll M. Crucial roles of Pox neuro in the developing ellipsoid body and antennal lobes of the Drosophila brain. PLoS ONE. 2017;12:e0176002. doi: 10.1371/journal.pone.0176002. [DOI] [PMC free article] [PubMed] [Google Scholar]
- Miyamoto T., Amrein H. Diverse roles for the Drosophila fructose sensor Gr43a. Fly (Austin) 2014;8:19–25. doi: 10.4161/fly.27241. [DOI] [PMC free article] [PubMed] [Google Scholar]
- Montell C., Rubin G.M. The Drosophila ninaC locus encodes two photoreceptor cell specific proteins with domains homologous to protein kinases and the myosin heavy chain head. Cell. 1988;52:757–772. doi: 10.1016/0092-8674(88)90413-8. [DOI] [PubMed] [Google Scholar]
- O’Sullivan R.J., Karlseder J. The great unravelling: chromatin as a modulator of the aging process. Trends Biochem. Sci. 2012;37:466–476. doi: 10.1016/j.tibs.2012.08.001. [DOI] [PMC free article] [PubMed] [Google Scholar]
- Owald D., Lin S., Waddell S. Light, heat, action: neural control of fruit fly behaviour. Philos. Trans. R. Soc. Lond. B Biol. Sci. 2015;370:20140211. doi: 10.1098/rstb.2014.0211. [DOI] [PMC free article] [PubMed] [Google Scholar]
- Pankova K., Borst A. RNA-seq transcriptome analysis of direction-selective T4/T5 neurons in Drosophila. PLoS ONE. 2016;11:e0163986. doi: 10.1371/journal.pone.0163986. [DOI] [PMC free article] [PubMed] [Google Scholar]
- Park D., Veenstra J.A., Park J.H., Taghert P.H. Mapping peptidergic cells in Drosophila: where DIMM fits in. PLoS ONE. 2008;3:e1896. doi: 10.1371/journal.pone.0001896. [DOI] [PMC free article] [PubMed] [Google Scholar]
- Park J.H., Helfrich-Förster C., Lee G., Liu L., Rosbash M., Hall J.C. Differential regulation of circadian pacemaker output by separate clock genes in Drosophila. Proc. Natl. Acad. Sci. USA. 2000;97:3608–3613. doi: 10.1073/pnas.070036197. [DOI] [PMC free article] [PubMed] [Google Scholar]
- Parry T.J., Theisen J.W.M., Hsu J.-Y., Wang Y.-L., Corcoran D.L., Eustice M., Ohler U., Kadonaga J.T. The TCT motif, a key component of an RNA polymerase II transcription system for the translational machinery. Genes Dev. 2010;24:2013–2018. doi: 10.1101/gad.1951110. [DOI] [PMC free article] [PubMed] [Google Scholar]
- Pedregosa F., Varoquaux G., Gramfort A., Michel V., Thirion B., Grisel O., Blondel M., Prettenhofer P., Weiss R., Dubourg V. Scikit-learn: machine learning in Python. J. Mach. Learn. Res. 2011;12:2825–2830. [Google Scholar]
- Porcelli D., Barsanti P., Pesole G., Caggese C. The nuclear OXPHOS genes in insecta: a common evolutionary origin, a common cis-regulatory motif, a common destiny for gene duplicates. BMC Evol. Biol. 2007;7:215. doi: 10.1186/1471-2148-7-215. [DOI] [PMC free article] [PubMed] [Google Scholar]
- Raj B., Wagner D.E., McKenna A., Pandey S., Klein A.M., Shendure J., Gagnon J.A., Schier A.F. Simultaneous single-cell profiling of lineages and cell types in the vertebrate brain. Nat. Biotechnol. 2018;36:442–450. doi: 10.1038/nbt.4103. [DOI] [PMC free article] [PubMed] [Google Scholar]
- Regev A., Teichmann S.A., Lander E.S., Amit I., Benoist C., Birney E., Bodenmiller B., Campbell P., Carninci P., Clatworthy M., Human Cell Atlas Meeting Participants The human cell atlas. eLife. 2017;6:e27041. doi: 10.7554/eLife.27041. [DOI] [PMC free article] [PubMed] [Google Scholar]
- Robie A.A., Hirokawa J., Edwards A.W., Umayam L.A., Lee A., Phillips M.L., Card G.M., Korff W., Rubin G.M., Simpson J.H. Mapping the neural substrates of behavior. Cell. 2017;170:393–406.e28. doi: 10.1016/j.cell.2017.06.032. [DOI] [PubMed] [Google Scholar]
- Robinson M.D., McCarthy D.J., Smyth G.K. edgeR: a Bioconductor package for differential expression analysis of digital gene expression data. Bioinformatics. 2010;26:139–140. doi: 10.1093/bioinformatics/btp616. [DOI] [PMC free article] [PubMed] [Google Scholar]
- Rulifson E.J., Kim S.K., Nusse R. Ablation of insulin-producing neurons in flies: growth and diabetic phenotypes. Science. 2002;296:1118–1120. doi: 10.1126/science.1070058. [DOI] [PubMed] [Google Scholar]
- Satija R., Farrell J.A., Gennert D., Schier A.F., Regev A. Spatial reconstruction of single-cell gene expression data. Nat. Biotechnol. 2015;33:495–502. doi: 10.1038/nbt.3192. [DOI] [PMC free article] [PubMed] [Google Scholar]
- Schinaman J.M., Giesey R.L., Mizutani C.M., Lukacsovich T., Sousa-Neves R. The KRÜPPEL-like transcription factor DATILÓGRAFO is required in specific cholinergic neurons for sexual receptivity in Drosophila females. PLoS Biol. 2014;12:e1001964. doi: 10.1371/journal.pbio.1001964. [DOI] [PMC free article] [PubMed] [Google Scholar]
- Schindelin J., Arganda-Carreras I., Frise E., Kaynig V., Longair M., Pietzsch T., Preibisch S., Rueden C., Saalfeld S., Schmid B. Fiji: an open-source platform for biological-image analysis. Nat. Methods. 2012;9:676–682. doi: 10.1038/nmeth.2019. [DOI] [PMC free article] [PubMed] [Google Scholar]
- Soreq L., Rose J., Soreq E., Hardy J., Trabzuni D., Cookson M.R., Smith C., Ryten M., Patani R., Ule J., UK Brain Expression Consortium. North American Brain Expression Consortium Major shifts in glial regional identity are a transcriptional hallmark of human brain aging. Cell Rep. 2017;18:557–570. doi: 10.1016/j.celrep.2016.12.011. [DOI] [PMC free article] [PubMed] [Google Scholar]
- Spindler S.R., Ortiz I., Fung S., Takashima S., Hartenstein V. Drosophila cortex and neuropile glia influence secondary axon tract growth, pathfinding, and fasciculation in the developing larval brain. Dev Biol. 2009;334:355–368. doi: 10.1016/j.ydbio.2009.07.035. [DOI] [PMC free article] [PubMed] [Google Scholar]
- Srahna M., Leyssen M., Choi C.M., Fradkin L.G., Noordermeer J.N., Hassan B.A. A signaling network for patterning of neuronal connectivity in the Drosophila brain. PLoS Biol. 2006;4:e348. doi: 10.1371/journal.pbio.0040348. [DOI] [PMC free article] [PubMed] [Google Scholar]
- Stanescu D.E., Yu R., Won K.-J., Stoffers D.A. Single cell transcriptomic profiling of mouse pancreatic progenitors. Physiol. Genomics. 2017;49:105–114. doi: 10.1152/physiolgenomics.00114.2016. [DOI] [PMC free article] [PubMed] [Google Scholar]
- Stork T., Bernardos R., Freeman M.R. Analysis of glial cell development and function in Drosophila. Cold Spring Harb. Protoc. 2012;2012:1–17. doi: 10.1101/pdb.top067587. [DOI] [PMC free article] [PubMed] [Google Scholar]
- Syed M.H., Mark B., Doe C.Q. Steroid hormone induction of temporal gene expression in Drosophila brain neuroblasts generates neuronal and glial diversity. eLife. 2017;6:e26287. doi: 10.7554/eLife.26287. [DOI] [PMC free article] [PubMed] [Google Scholar]
- Tahoe N.M., Mokhtarzadeh A., Curtsinger J.W. Age-related RNA decline in adult Drosophila melanogaster. J Gerontol A Biol Sci Med Sci. 2004;59:B896–B901. doi: 10.1093/gerona/59.9.b896. [DOI] [PubMed] [Google Scholar]
- Tan L., Zhang K.X., Pecot M.Y., Nagarkar-Jaiswal S., Lee P.-T., Takemura S.-Y., McEwen J.M., Nern A., Xu S., Tadros W. Ig superfamily ligand and receptor pairs expressed in synaptic partners in Drosophila. Cell. 2015;163:1756–1769. doi: 10.1016/j.cell.2015.11.021. [DOI] [PMC free article] [PubMed] [Google Scholar]
- Tulving E., Craik F.I.M. Oxford University Press; Oxford, New York: 2005. The Oxford Handbook of Memory. [Google Scholar]
- Walter W., Sánchez-Cabo F., Ricote M. GOplot: an R package for visually combining expression data with functional analysis. Bioinformatics. 2015;31:2912–2914. doi: 10.1093/bioinformatics/btv300. [DOI] [PubMed] [Google Scholar]
- Wyss-Coray T. Ageing, neurodegeneration and brain rejuvenation. Nature. 2016;539:180–186. doi: 10.1038/nature20411. [DOI] [PMC free article] [PubMed] [Google Scholar]
- Xiong W.C., Okano H., Patel N.H., Blendy J.A., Montell C. repo encodes a glial-specific homeo domain protein required in the Drosophila nervous system. Genes Dev. 1994;8:981–994. doi: 10.1101/gad.8.8.981. [DOI] [PubMed] [Google Scholar]
- Yu G., Wang L.-G., Han Y., He Q.-Y. clusterProfiler: an R package for comparing biological themes among gene clusters. OMICS. 2012;16:284–287. doi: 10.1089/omi.2011.0118. [DOI] [PMC free article] [PubMed] [Google Scholar]
- Zeisel A., Muñoz-Manchado A.B., Codeluppi S., Lönnerberg P., La Manno G., Juréus A., Marques S., Munguba H., He L., Betsholtz C. Brain structure. Cell types in the mouse cortex and hippocampus revealed by single-cell RNA-seq. Science. 2015;347:1138–1142. doi: 10.1126/science.aaa1934. [DOI] [PubMed] [Google Scholar]
- Zhu S., Lin S., Kao C.-F., Awasaki T., Chiang A.-S., Lee T. Gradients of the Drosophila Chinmo BTB-zinc finger protein govern neuronal temporal identity. Cell. 2006;127:409–422. doi: 10.1016/j.cell.2006.08.045. [DOI] [PubMed] [Google Scholar]
Associated Data
This section collects any data citations, data availability statements, or supplementary materials included in this article.