

Abstract
Background and Purpose
Intravenous glycyrrhizin, having anti‐inflammatory and hepatoprotective properties, is incorporated into the management of liver diseases in China. This investigation was designed to elucidate the molecular mechanism underlying hepatobiliary excretion of glycyrrhizin and to investigate its potential for drug–drug interactions on organic anion‐transporting polypeptide (OATP)1B.
Experimental Approach
Human transporters mediating hepatobiliary excretion of glycyrrhizin were characterized at the cellular and vesicular levels and compared with rat hepatic transporters. The role of Oatp1b2 in glycyrrhizin's elimination and pharmacokinetics was evaluated in rats using the inhibitor rifampin. A physiologically based pharmacokinetic (PBPK) model for glycyrrhizin, incorporating transporter‐mediated hepatobiliary excretion, was established and applied to predict potential drug–drug interactions related to glycyrrhizin in humans.
Key Results
Hepatobiliary excretion of glycyrrhizin involved human OATP1B1/1B3 (Oatp1b2 in rats)‐mediated hepatic uptake from blood and human multidrug resistance‐associated protein (MRP)2/breast cancer resistance protein (ABCP)/bile salt export pump (BSEP)/multidrug resistance protein 1 (Mrp2/Abcp/Bsep in rats)‐mediated hepatic efflux into bile. In rats, rifampin impaired hepatic uptake of glycyrrhizin significantly increasing its systemic exposure. Glomerular‐filtration‐based renal excretion of glycyrrhizin was slow due to extensive protein binding in plasma. Quantitative analysis using the PBPK model demonstrated that OATP1B1/1B3 have critical roles in the pharmacokinetics of glycyrrhizin, which is highly likely to be a victim of drug–drug interactions when co‐administered with potent dual inhibitors of these transporters.
Conclusions and Implications
Transporter‐mediated hepatobiliary excretion governs glycyrrhizin's elimination and pharmacokinetics. Understanding glycyrrhizin's potential drug–drug interactions on OATP1B1/1B3 should enhance the therapeutic outcome of glycyrrhizin‐containing drug combinations on liver diseases.
Abbreviations
- ABC
ATP‐binding cassette
- ABCP/Abcp
breast cancer resistance protein
- BSEP/Bsep
bile salt export pump
- C5 min
concentration at 5 min after dosing
- CLB
hepatobiliary excretory clearance
- CLint
intrinsic clearance
- CLR
renal excretory clearance
- CLtot,p
total plasma clearance
- Cum.Ae
cumulative amount excreted
- E217βG
oestradiol 17β‐d‐glucuronide
- fe‐B
fraction of dose excreted into bile
- fe‐U
fraction of dose excreted into urine
- fu‐plasma
unbound fraction in plasma
- Ki
inhibition constant
- MATE/Mate
multidrug and toxin extrusion protein
- MDR
multidrug resistance protein
- MRP/Mrp
multidrug resistance‐associated protein
- NTCP/Ntcp
Na+/taurocholate cotransporting polypeptide
- OAT/Oat
organic anion transporter
- OATP/Oatp
organic anion‐transporting polypeptide
- OCT/Oct
organic cation transporter
- Octn
carnitine/organic cation transporter
- PBPK
physiologically based pharmacokinetic
- SLC
solute carrier
- Vmax
maximum transport velocity
- VSS
distribution volume at steady state
Introduction
http://www.guidetopharmacology.org/GRAC/LigandDisplayForward?ligandId=4688 is an oleanane‐type triterpene saponin present in the dried rhizomes and roots of several medicinal Glycyrrhiza species (liquorice; family Leguminosae). Glycyrrhizin has anti‐inflammatory and hepatoprotective properties (Asl and Hosseinzadeh, 2008; Li et al., 2014). This saponin was found to be an inhibitor of high‐mobility group box 1 protein, which mediates the response to infection, injury and inflammation (Mollica et al., 2007; Ogiku et al., 2011). Glycyrrhizin, formulated for i.v. administration (SNMC, i.e., Stronger Neo‐Minophagen C), was first approved in Japan for treatment of patients with chronic hepatitis. Long‐term glycyrrhizin therapy was reported to suppress alanine aminotransferase (ALT) and to prevent progression towards liver cirrhosis and hepatocellular carcinoma in patients with chronic hepatitis (Arase et al., 1997; Zhang et al., 2000; van Rossum et al., 2001a; Orlent et al., 2006; Ikeda, 2007). Persistent normalization of ALT in patients with chronic hepatitis appears to be a key prognostic factor for a reduction in long‐term complications, regardless of the presence of viral markers in the serum (Kasahara et al., 1998; Mathurin et al., 1998). In China, a series of clinical studies have established a major role for glycyrrhizin in anti‐inflammation and hepatoprotection in patients with liver diseases, including chronic viral hepatitis, drug‐induced liver injury, alcoholic and non‐alcoholic steatohepatitis, autoimmune and biliary diseases, liver cirrhosis,and hepatocellular carcinoma (Expert Committee for Prevention and Management of Liver Inflammation, Chinese Society of Infectious Diseases, 2014; Expert Committee on Clinical Application of Glycyrrhizin Preparation in the Treatment of Liver Diseases, 2016).
Despite the preceding salutary effects, high and continuous doses of i.v. glycyrrhizin preparations, as specified on the patient information leaflets, possibly induce pseudoaldosteronism. Glycyrrhizin and its deglycosylated metabolite glycyrrhetic acid (produced by the action of colonic microflora) inhibit 11β‐hydroxysteroid dehydrogenase 2 (11β‐HSD2), which catalyses the inactivation of endogenous cortisol into cortisone (Isbrucker and Burdock, 2006). In addition, glycyrrhetic acid 3‐O‐glucuronide, a minor hepatic deglycosylated metabolite of glycyrrhizin, was found to inhibit 11β‐HSD2 as well and to be an in vitro substrate of renal http://www.guidetopharmacology.org/GRAC/ObjectDisplayForward?objectId=1025&familyId=198&familyType=TRANSPORTER, http://www.guidetopharmacology.org/GRAC/ObjectDisplayForward?objectId=1027&familyId=198&familyType=TRANSPORTER and organic anion‐transporting polypeptide http://www.guidetopharmacology.org/GRAC/FamilyDisplayForward?familyId=238#1227 (Makino et al., 2012). It is worth mentioning that in vivo exposure to glycyrrhizin is dependent on its route of administration (Yu et al., 2012). After p.o. administration of glycyrrhizin, its major circulating form is glycyrrhetic acid, rather than the poorly absorbed parent compound. However, i.v. administration yields unchanged glycyrrhizin as the major circulating form. Unchanged glycyrrhizin is eliminated mainly via hepatobiliary excretion, while renal excretion and metabolism play minor roles. This investigation was designed to elucidate the molecular mechanism underlying the hepatobiliary excretion of glycyrrhizin and the impact of impaired hepatobiliary excretion on its pharmacokinetics. The important finding is that extensively impaired hepatic uptake, by dual inhibition of http://www.guidetopharmacology.org/GRAC/FamilyDisplayForward?familyId=238 and http://www.guidetopharmacology.org/GRAC/FamilyDisplayForward?familyId=238, can significantly increase systemic exposure to glycyrrhizin. Given the broad range of dual inhibitors of OATP1B1/1B3 in clinical use (Karlgren et al., 2012), the potential of glycyrrhizin to be a victim of drug–drug interactions on these transporters is high, and such interactions may alter the safety profile of this saponin.
Methods
Cellular transport assays
Cell cultures and transport of glycyrrhizin with transiently transfected HEK‐293 cells were performed as described previously (Jia et al., 2015; Jiang et al., 2015). Differential uptake of glycyrrhizin between the transfected cells (TC) and mock cells (MC) was defined as a net transport ratio (TransportTC/TransportMC); a net transport ratio > 3 suggested a positive result in this laboratory based on previous validation on positive and negative control compounds. For identification of transporters mediating the cellular uptake of glycyrrhizin, the incubation time was 10 min. Before being used in this study, the TCs were validated functionally using the positive substrate oestradiol 17β‐d‐glucuronide (E217βG) (for human OATP1B1, human OATP1B3, rat Oatp1a1 and rat Oatp1b2), ohttp://www.guidetopharmacology.org/GRAC/LigandDisplayForward?ligandId=4749 (for human OATP2B1), http://www.guidetopharmacology.org/GRAC/LigandDisplayForward?ligandId=1884 (for human http://www.guidetopharmacology.org/GRAC/FamilyDisplayForward?familyId=198#1026 and rat Oat2), http://www.guidetopharmacology.org/GRAC/LigandDisplayForward?ligandId=2343 [for human organic cation transporter (http://www.guidetopharmacology.org/GRAC/FamilyDisplayForward?familyId=196#1019, human http://www.guidetopharmacology.org/GRAC/FamilyDisplayForward?familyId=196#1021, human multidrug and toxin extrusion protein (http://www.guidetopharmacology.org/GRAC/FamilyDisplayForward?familyId=236#1216, rat Oct1, rat Oct3, rat carnitine/organic cation transporter (http://www.guidetopharmacology.org/GRAC/FamilyDisplayForward?familyId=197#1023 and rat Mate1] and http://www.guidetopharmacology.org/GRAC/LigandDisplayForward?ligandId=4547 [for human Na+/taurocholate cotransporting polypeptide (http://www.guidetopharmacology.org/GRAC/FamilyDisplayForward?familyId=182#959) and rat Ntcp]. These substrates exhibited net transport ratios of 11–132. The kinetics of cellular uptakes of glycyrrhizin mediated by human OATP1B1, human OATP1B3 and rat Oatp1b2 were assessed with respect to the K M, maximum velocity (V max) and intrinsic clearance (CLint). The assessment was performed under linear uptake conditions by incubation for 5 min, and the concentrations of glycyrrhizin in the incubation medium were 0.045–100, 3.1–200 and 3.1–200 μM for OATP1B1, OATP1B3 and Oatp1b2 respectively. The inhibitory effect of http://www.guidetopharmacology.org/GRAC/LigandDisplayForward?ligandId=2765 on the activity of OATP1B1, OATP1B3 or Oatp1b2 that mediated cellular uptake of glycyrrhizin was measured in terms of inhibition constant (K i). The test concentrations of rifampin and glycyrrhizin were 0–2 and 3.13–100 μM, respectively, for both OATP1B1 and OATP1B3; such concentrations for Oatp1b2 were 0–8 and 6.25–200 μM respectively. The inhibitory effects of glycyrrhizin on OATP1B1‐, OATP1B3‐ or Oatp1b2‐mediated cellular uptake of E217βG were also measured in terms of K i. The test concentrations of glycyrrhizin and those of E217βG for OATP1B1 were 0–60 and 1.56–100 μM, respectively; such concentrations were 0–16 and 9.38–300 μM, respectively, for OATP1B3 and 0–300 and 1.56–100 μM, respectively, for Oatp1b2. In addition, the effect of a1 h preincubation in the presence of glycyrrhizin (in the absence of the substrate E217βG) on glycyrrhizin's inhibition of OATP1B1 and OATP1B3 was assessed by comparing the IC50 values with the respective values after such preincubation in the absence of glycyrrhizin. The test concentrations of glycyrrhizin and E217βG were 0–250 and 10 μM respectively. Unbound fractions in the incubation samples (f u‐incubation) containing MCs were measured for glycyrrhizin at 10 and 100 μM and for rifampin at 0.1 and 10 μM, using the method by Posada et al. (2015). No binding was observed during incubation.
Vesicular transport assays
Membrane vesicles expressing one of the following transporters: human http://www.guidetopharmacology.org/GRAC/ObjectDisplayForward?objectId=780&familyId=153&familyType=TRANSPORTER, human http://www.guidetopharmacology.org/GRAC/FamilyDisplayForward?familyId=153, human http://www.guidetopharmacology.org/GRAC/ObjectDisplayForward?objectId=782&familyId=153&familyType=TRANSPORTER, human http://www.guidetopharmacology.org/GRAC/ObjectDisplayForward?objectId=792), human bile salt export pump (BSEP), human http://www.guidetopharmacology.org/GRAC/ObjectDisplayForward?objectId=768&familyId=152&familyType=TRANSPORTER, rat http://www.guidetopharmacology.org/GRAC/ObjectDisplayForward?objectId=780&familyId=153&familyType=TRANSPORTER, rat http://www.guidetopharmacology.org/GRAC/ObjectDisplayForward?objectId=782&familyId=153&familyType=TRANSPORTER, rat http://www.guidetopharmacology.org/GRAC/ObjectDisplayForward?objectId=792, rat Bsep, rat Mdr1a and rat Mdr1b, were used to assess the uptake of glycyrrhizin using a rapid filtration method (Jia et al., 2015; Jiang et al., 2015). Differential transport of glycyrrhizin between ATP‐containing vesicles and AMP‐containing vesicles was defined as a net transport ratio (TransportATP/TransportAMP); a net transport ratio > 3 suggested a positive result in this laboratory. For identification of transporters mediating vesicular transport of glycyrrhizin, the incubation time was 10 min. Before being used, the membrane vesicles were functionally validated using E217βG (for MRP2, MRP3, MRP4, Mrp2 and Mrp4), http://www.guidetopharmacology.org/GRAC/LigandDisplayForward?ligandId=4815 (for ABCP and Abcp), taurocholic acid (for BSEP and Bsep) and verapamil (for MDR1). These substrates exhibited net transport ratios of 4–21. In addition, the functions of Mdr1a and Mdr1b were verified with verapamil using ATPase assays according to the manufacturer's protocols, and the ratios of vesicular transport in the absence of sodium vanadate to that in the presence of sodium vanadate were 4.3 and 3.6 respectively. The kinetics of vesicular transports of glycyrrhizin as mediated by human and rat ATP‐binding cassette (ABC) transporters were also assessed with respect to K M, V max and CLint. The assessment was conducted under linear uptake conditions by incubation for 5 min, and the test concentrations of glycyrrhizin were 3.13–200 μM. Inhibitory effects of rifampin on the activity of MRP2, ABCP, BSEP, MDR1, Mrp2, Abcp or Bsep that mediated vesicular transport of glycyrrhizin (50 μM) were measured in terms of IC50; the test concentrations of rifampin were 0–600 μM. Unbound fractions in incubated (f u‐incubation) control vesicles of GenoMembrane were measured for glycyrrhizin at 20 and 200 μM after incubation for 5 min. No binding was observed during incubation.
Rat pharmacokinetic studies
Care and use of rats were in compliance with the Guidance for Ethical Treatment of Laboratory Animals (The Ministry of Science and Technology of China, 2006; http://www.most.gov.cn/fggw/zfwj/zfwj2006/200609/t20060930_54389.htm). All rat studies were implemented according to protocols that were reviewed and approved by the Institutional Animal Care and Use Committee at Shanghai Institute of Materia Medica (Shanghai, China). Animal studies are reported in compliance with the ARRIVE guidelines (Kilkenny et al., 2010; McGrath and Lilley, 2015). Male Sprague–Dawley rats (0.23–0.28 kg) were obtained from Sino‐British SIPPR/BK Laboratory Animal Co., Ltd. (Shanghai, China). Rats were maintained under specific‐pathogen‐free conditions in a unidirectional airflow room at 20–24°C and relative humidity of 30–70% with a 12 h light/dark cycle. Rats were given filtered tap water and commercial rat chow ad libitum and allowed to acclimatize to the facilities and environment for 3 days before use. Rats received in‐house femoral artery cannulation for blood sampling or bile duct cannulation for bile sampling, as described previously (Chen et al., 2013).
Three rat pharmacokinetic studies were performed to characterize the effects of rifampin treatment on plasma pharmacokinetics, hepatobiliary excretion and renal excretion of glycyrrhizin. For each study, rats were randomly assigned to two groups (three or six rats each), and each group received an i.v. bolus dose of glycyrrhizin at 2.6 mg·kg−1 (a dose that provided systemic exposure to glycyrrhizin in rats comparable with that in human subjects). One group was treated with repeat dose of i.v. rifampin (20 mg·kg−1; at 0, 3 and 6 h), whereas the other group (of control rats) was treated with saline [0.9% NaCl injection; China Food and Drug Administration (FDA) drug ratification number, GuoYaoZhunZi‐H12020025]. In the first rat study, serial blood samples (60 μL) were collected into heparin‐treated tubes at 0, 5, 15 and 30 min and 1, 2, 4, 7 and 12 h after dosing with glycyrrhizin. The plasma fractions were prepared by centrifugation. In the second rat study, bile samples were collected and weighed between 0–1, 1–2, 2–4, 4–6, 6–12 and 12–24 h after dosing with glycyrrhizin. A sodium taurocholate solution (14.3 mM; pH 7.4) was infused (1.0 mL·h−1) into the duodenum during bile collection. In the third rat study, urine samples were collected and weighed between 0–6, 6–10 and 10–24 h after dosing with glycyrrhizin. The rats were housed singly in metabolic cages, and the collection tubes containing their urine samples were frozen at −15°C during sample collection. Each rat study was repeated twice.
In addition to the preceding rat studies, the tissue distribution of glycyrrhizin was also determined in rats that were randomly assigned to two groups, and each group received an i.v. bolus dose of glycyrrhizin at 2.6 mg·kg−1. One group was treated with single dose of i.v. rifampin (20 mg·kg−1), whereas the other group (of control rats) was treated with the saline. The rats (under isoflurane anaesthesia) were killed by bleeding from the abdominal aorta at 0, 0.083, 1, 2 and 4 h after dosing (five rats per point time) followed by perfusion with 15 mL of saline through the super vena cava. The kidneys, liver, heart, lungs, spleen, brain, adipose, muscle and skin were excised, rinsed in ice‐cold saline, blotted, weighed and homogenized in fivefold (w:w) ice‐cold saline. All the rat samples were stored at −70°C until analysis.
Determination of plasma protein binding
An equilibrium dialysis method was used to assess the unbound fraction of glycyrrhizin in fresh rat plasma (f u‐plasma) with or without rifampin (40 μM) (Guo et al., 2006). Glycyrrhizin was added to blank plasma, and the resulting plasma samples (final concentration, 50 μM) were used for equilibrium dialysis for 24 h at 37°C, using Sepctra/Por 2 RC dialysis membranes (MW cut‐off, 12–14 kDa; Rancho Dominguez, CA, USA) and PBS (pH 7.4) as dialysate. After dialysis, 100 μL of both the plasma and the dialysate were sampled and precipitated with methanol (300 and 100 μL, respectively) and centrifuged for LC‐MS/MS‐based analysis. The f u‐plasma value was calculated by dividing the concentration of glycyrrhizin in the dialysate by the corresponding concentration in the plasma.
LC/MS‐based bioanalytical assays
Validated bioanalytical assays were used to measure glycyrrhizin and its deglycosylated metabolites glycyrrhetic acid 3‐O‐glucuronide and glycyrrhetic acid in various biomatrices from in vitro studies (for glycyrrhizin only) and rat studies. Analyses were performed on a TSQ Vantage mass spectrometer (Thermo Fisher, San Jose, CA, USA) interfaced via a HESI source with an Agilent 1290 infinity LC system (Waldbronn, Germany). The chromatographic separation was achieved on a 5 μm Agilent Eclipse Plus C18 column (50 mm × 2.1 mm i.d.; Santa Clara, CA, USA). The mobile phases, which consisted of solvent A (water/methanol, 99:1, v·v−1, containing 1 mM ammonium formate and 100 μM lithium acetate) and solvent B (water/methanol, 1:99, v·v−1, containing 1 mM ammonium formate and 100 μM lithium acetate), were delivered at 0.3 mL·min−1. A 6 min gradient elution method was used as follows: 0–2.5 min, at 10–100% solvent B; 2.5–4.5 min, at 100% solvent B; and 4.5–6 min, at 10% solvent B. The MS measurement was performed in the positive ion mode with precursor–product ion pairs for selected reaction monitoring of glycyrrhizin, glycyrrhetic acid 3‐O‐glucuronide and glycyrrhetic acid at m/z 829 → 477, 653 → 477 and 471 → 317 respectively. Matrix‐matched calibration curves for quantification of glycyrrhizin (4.1–10 000 nM) were constructed using weighted (1/X) linear regression of the peak area (Y) against the corresponding nominal analyte concentration (X, nM). The sample preparation was performed using methanol‐based protein precipitation and centrifugation; the supernatant was analysed by LC/MS. Assay validation was carried out according to the US FDA guidance on bioanalytical validation (2013) to prove that the bioanalytical assays were reliable for the intended application.
Measurement of E217βG, oestrone 3‐sulfate, PGF2α, tetraethylammonium, methotrexate, taurocholic acid, verapamil and rifampin was achieved using the LC/MS‐based methods described previously (Jia et al., 2015; Jiang et al., 2015).
Kinetics and data analyses
GraFit (version 5.0; Erithacus Software, Surrey, UK) was used to estimate the K M, V max, K i and IC50 values by non‐linear regression analysis of initial transport rates as a function of substrate concentration. K M and V max values of glycyrrhizin were calculated using the following equation:
| (1) |
where V is the initial transport of glycyrrhizin in TCs (pmol·min−1·mg−1 protein), V max is the maximal transport rate (pmol·min−1·mg−1 protein), S is the concentration of glycyrrhizin (μM) and P dif is the clearance of glycyrrhizin via passive diffusion in MCs and is 0.05 μL·min−1·mg−1 protein. K i values were calculated using the following equation:
| (2) |
where v is the difference in the transport of substrate in TCs and MCs (pmol·min−1·mg−1 protein) and I is the concentration of inhibitor (μM). IC50 values were calculated using the following equation:
| (3) |
where Control% is net transport measured in the presence of inhibitor at various concentrations as a percentage of that in the absence of inhibitor and sf is a slope factor.
Human plasma concentrations of glycyrrhizin over time, reported by Yamamura et al. (1992), were digitized from the published figures using Digit (version 1.04; Simulations Plus, Lancaster, CA, USA). Such plasma concentrations over time for rats were obtained from this investigation. Human and rat plasma pharmacokinetic parameters were estimated by noncompartmental analysis using Kinetica (version 5.0; Thermo Scientific, Philadelphia, PA, USA). The total clearance (CLtot,p) of plasma glycyrrhizin from the systemic circulation was predominantly the sum of the hepatobiliary excretory clearance (CLB) and renal excretory clearance (CLR). CLB of glycyrrhizin in rats was calculated using the following equation:
| (4) |
where Cum.A e‐B,0–24 h(unchanged glycyrrhizin) is the cumulative amount of unchanged glycyrrhizin excreted into bile and AUC0–12 h is the area under plasma concentration–time curve of unchanged glycyrrhizin up to 12 h after dosing. In addition, CLR of glycyrrhizin was calculated using the following equation:
| (5) |
where Cum.A e‐U,0–24 h(unchanged glycyrrhizin) is the cumulative amount of unchanged glycyrrhizin excreted into urine. All data are expressed as the mean ± SD. Statistical analysis was performed using SPSS Statistics Software (version 19.0; IBM, Chicago, IL, USA). A value of P < 0.05 was considered to be the minimum level of statistical significance. The data and statistical analysis comply with the recommendations on experimental design and analysis in pharmacology (Curtis et al., 2018).
Prediction of alteration in exposure level of glycyrrhizin in humans with impaired OATP1B using PBPK model
The physiologically based pharmacokinetic (PBPK) modelling strategy consisted of four steps. (i) Molecular mechanism for hepatobiliary excretion of glycyrrhizin was elucidated via cellular and vesicular transport studies. (ii) Using GastroPlus (version 9.0; Simulations Plus), a PBPK model for i.v. glycyrrhizin was initially constructed using pharmacokinetic and physicochemical data of the compound measured in this investigation and supplemented with default physiological parameters of humans and rats provided in the software. (iii) This glycyrrhizin model was optimized against the compound's in vivo data, that is, rat plasma concentration–time and hepatic concentration–time profiles measured in this investigation and human plasma concentration–time profiles reported by Yamamura et al. (1992), who gave Japanese volunteers a 12 min i.v. infusion of glycyrrhizin (SNMC) at 40–120 mg per person. (iv) A PBPK model for i.v. rifampin was used to help verify the glycyrrhizin model with respect to influence of Oatp1b2‐mediated hepatobiliary excretion on rat systemic and hepatic exposure to glycyrrhizin. This rifampin model was modified from a default model for rifampin provided in GastroPlus by matching the compound's rat plasma concentration–time profile measured in this investigation. Dynamic simulation was then performed in a GastroPlus DDI module to predict retrospectively the rifampin‐glycyrrhizin interaction in rats using the established glycyrrhizin and rifampin models, incorporating rifampin's K i (against glycyrrhizin for Oatp1b2) and f u,incubation. All the input pharmacokinetic and related physicochemical data for glycyrrhizin and rifampin are summarized in Tables S1 and S2, respectively, in Supporting Information Appendix S1. The observed and model‐predicted pharmacokinetic parameters for i.v. rifampin in rats are shown in Table S3 in Supporting Information Appendix S1, while the associated plasma concentrations over time are shown in Figure S1 in Supporting Information Appendix S2.
A GastroPlus PEAR Physiology module was used with the typical human subject being a 35‐year‐old Japanese male weighing 50 kg and the rat with a body weight of 0.25 kg. All tissues were set to a permeability rate‐limited mode for glycyrrhizin and perfusion rate‐limited mode for rifampin, except for the liver, which was set to a permeability rate‐limited mode for rifampin in order to meet the software's computational requirement. The initial SpecPStc (permeability–surface area product per cell volume) value for glycyrrhizin (2.0 × 10⁻⁴ mL·s−1·mL−1) was estimated from its P dif (0.05 μL·min−1·mg−1 protein) in MCs, and this value was fitted against the in vivo data as necessary to best match the shapes of observed plasma concentration–time profiles of glycyrrhizin in humans and rats. The SpecPStc value of rifampin was fitted against its measured rat plasma concentration‐time profile. Total PStc values of glycyrrhizin and rifampin for an individual tissue were calculated from their respective SpecPStc of the species and associated total cell volumes in the tissue (default in GastroPlus). In vitro–in vivo empirical scaling factors (named RAF in GastroPlus) for the translation of active transport intrinsic clearance to in vivo clearance were initially set to one in GastroPlus as a space holder for hepatic OATP1B1, OATP1B3, MRP2, Oatp1b2 and Mrp2. In this investigation, they were estimated using a ‘top‐down’ approach by fitting to the observed glycyrrhizin's human and rat plasma concentration–time profiles and rat liver concentration–time profile, along with fixing the rest of the parameters. The renal clearance of glycyrrhizin was estimated as the product of f u‐plasma and GFR, and so was that of rifampin. The f u‐incubation values of glycyrrhizin and rifampin were set to 1.0.
The assumptions for the glycyrrhizin model were the following: (i) glycyrrhizin is predominantly eliminated via hepatobiliary excretion after i.v. dosing in humans but not metabolized; (ii) the slow rate of membrane permeation of glycyrrhizin in mock cells is representative of the compound's passive permeability in hepatocytes and other tissue cells (Figure S2 in Supporting Information Appendix S2); (iii) OATP1B1 and OATP1B3 contribute, based on their in vitro K M and V max values, to the hepatic uptake of glycyrrhizin from blood in humans; (iv) the hepatic efflux of glycyrrhizin into bile is governed only by human MRP2 and rat Mrp2; (v) expressions of OATP1B1, OATP1B3 and MRP2 in the human liver and those of Oatp1b2 and Mrp2 in the rat liver are all set as 1; and (vi) MRP3/MRP4 and Mrp4 are not considered as contributors to the hepatobiliary excretion of glycyrrhizin as they are sinusoidal efflux transporters. For the simulation of the rifampin–glycyrrhizin interaction in rats, the assumptions were as follows: (i) the interaction occurs on Oatp1b2 in the sinusoidal membrane of hepatocytes; (ii) rifampin inhibits Oatp1b2 activity in rats in a competitive manner; (iii) rifampin metabolites do not interact with Oatp1b2 in rats; and (iv) rifampin does not affect the activity of Mrp2 or Mrp4 in rats.
Finally, changes in human systemic and hepatic exposure to glycyrrhizin by 0, 10, 20, 30, 40, 50, 60, 70, 80, 90 and 100% impairment of OATP1B1/1B3‐mediated hepatic uptake were prospectively predicted using the optimized PBPK model for glycyrrhizin by changing its K M for the two transporters. The assumption, used as a worst‐case estimate, was that the inhibition of OATP1B1/1B3 was constant over time.
Materials
The reference standards glycyrrhizin, glycyrrhetic acid and rifampin were obtained from the National Institutes for Food and Drug Control (Beijing, China), and their purity exceeded 98%. Glycyrrhetic acid 3‐O‐glucuronide was obtained from YuanYe Biotechnology (Shanghai, China). E217βG, oestrone 3‐sulfate, PGF2α, tetraethylammonium, methotrexate, taurocholic acid, verapamil and ATP (disodium salt hydrate) were purchased from Sigma‐Aldrich (St. Louis, MO, USA). Diammonium glycyrrhizinate injection (Ganlixin) was a sterile, non‐pyrogenic formulation for i.v. administration; it was manufactured by Chia Tai TianQing Pharmaceutical Group Co., Ltd. (Lianyungang, Jiangsu Province, China; with a China FDA drug ratification number of GuoYaoZhunZi‐H10940190; composition: 10 mL contains 50 mg diammonium glycyrrhizinate in sodium chloride solution for injection). The rifampin used for the rat study was in a lyophilized solid state, available as a sterile, non‐pyrogenic formulation for i.v. injection, and was manufactured by Huapont Pharmaceutical (Chongqing, China; with a China FDA drug ratification number of GuoYaoZhunZi‐H20041320). All other chemicals and reagents were obtained from Sinopharm Chemical Reagent Co., Ltd. (Shanghai, China).
HEK‐293 cells were obtained from the American Type Culture Collection (Manassas, VA, USA). Full open reading frames of cDNA for human OATP1B1, human OATP1B3, human OATP2B1, human OAT2, human OCT1, human OCT3, human MATE1, human NTCP, rat Oatp1a1, rat Oatp1b2, rat Oat2, rat Oct1, rat Oct3, rat Octn2, rat Mate1 and rat Ntcp were synthesized and subcloned into pcDNA 3.1(+) expression vectors by Invitrogen Life Technologies (Shanghai, China). Prior to the study, all expression plasmids were sequence verified according to their GeneBank accession numbers (human OATP1B1, NM_006446; human OATP1B3, NM_019844; human OATP2B1, NM_007256; human OAT2, NM_006672; human OCT1, NM_003057; human OCT3, NM_021977; human MATE1, NM_018242; human NTCP, NM_003049; rat Oatp1a1, NM_017111; rat Oatp1b2, NM_031650; rat Oat2, NM_053537; rat Oct1, NM_012697; rat Oct3, NM_019230; rat Octn2, NM_019269; rat Mate1, NM_001014118; and rat Ntcp, NM_017047). Inside‐out membrane vesicles (5 mg protein·mL−1; prepared from insect cells expressing human MRP2, human MRP3, human MRP4, human ABCP, human BSEP, human MDR1, rat Mrp2, rat Mrp4, rat Abcp or rat Bsep) and control vesicles (negative control for ABC transporter vesicle products) were obtained from GenoMembrane (Kanazawa, Japan). In addition, membrane vesicle suspensions that expressed rat Mdr1a or rat Mdr1b were obtained from BD Gentest (Woburn, MA, USA).
Nomenclature of targets and ligands
Key protein targets and ligands in this article are hyperlinked to corresponding entries in http://www.guidetopharmacology.org, the common portal for data from the IUPHAR/BPS Guide to PHARMACOLOGY (Harding et al., 2018), and are permanently archived in the Concise Guide to PHARMACOLOGY 2017/18 (Alexander et al., 2017).
Results
In vitro transport of glycyrrhizin by human hepatic transporters
Glycyrrhizin was found to be a substrate of OATP1B1 and OATP1B3, rather than that of other human hepatic uptake solute carrier (SLC) transporters (OATP2B1, OAT2, OCT1, OCT3 and NTCP) (Table 1). OATP1B1 and OATP1B3 exhibited comparable affinity for glycyrrhizin (Figure 1); Table 2 summarizes the K M, V max and CLint values. OATP1B1 appears to have two binding sites as indicated by its K M values for oestrone‐3‐sulfate 0.1–0.2 and 15–312 μM (Tamai et al., 2001; Noe et al., 2007; Gui and Hagenbuch, 2009). The OATP1B1‐mediated cellular uptake of glycyrrhizin followed monophasic kinetic behaviour (Figure 1; the Eadie–Hofstee plot), suggesting that this saponin only bound to one of the two binding sites. The cellular uptakes of glycyrrhizin mediated by these human SLC transporters were competitively inhibited by rifampin (Figure 2) with K i values shown in Table 2. In addition, glycyrrhizin was also a substrate of the human hepatic canalicular efflux ABC transporters MRP2, ABCP, BSEP and MDR1 and the sinusoidal efflux ABC transporters MRP3 and MRP4 (Table 1). MRP2 exhibited a substantially greater in vitro CLint value of glycyrrhizin than ABCP, BSEP and MDR1 (Table 2 and Figure 3). The transports of glycyrrhizin by these human ABC transporters were minimally inhibited by rifampin with IC50 > 100 μM (Figure S3 in Supporting Information Appendix S2). Unlike these ABC transporters, the human hepatic efflux SLC transporter MATE1 exhibited no transport activity towards glycyrrhizin (Table 1). In addition, glycyrrhizin inhibited cellular uptake of E217βG by OATP1B1 and OATP1B3 in a concentration‐dependent manner (Figure 4) with K i values shown in Table 2; the inhibitory effects were not significantly enhanced by 1 h preincubation with glycyrrhizin (Figure S4 in Supporting Information Appendix S2). Collectively, a two‐step molecular mechanism is proposed for the hepatobiliary excretion of glycyrrhizin in humans: (i) uptake from blood across the sinusoidal membrane into hepatocytes by OATP1B1 and OATP1B3 and (ii) efflux from the hepatocytes across the canalicular membrane into bile by MRP2 with ABCP, BSEP and MDR1 also playing a role. Human MRP3 and MRP4, residing on the sinusoidal membrane, pump anionic drugs and bile acids from hepatocytes into blood (Pfeifer et al., 2014). Like hepatocyte hopping of glucuronized bilirubin (Iusuf et al., 2012), multiple rounds of less efficient efflux into the blood by these sinusoidal efflux transporters and reuptake into the hepatocytes by OATP1B1/1B3 may occur for glycyrrhizin, contributing to efficient biliary excretion of this saponin.
Table 1.
Net transport ratios for in vitro transport of glycyrrhizin mediated by various human and rat hepatic transporters
| Transporter | Net transport ratio | |
|---|---|---|
| Positive substrate (10 μM) | Glycyrrhizin (20 μM) | |
| Human hepatic sinusoidal uptake SLC transporters | ||
| OATP1B1 | 47.9 ± 5.1 (E217βG) | 6.4 ± 1.1 |
| OATP1B3 | 12.1 ± 2.1 (E217βG) | 6.7 ± 0.9 |
| OATP2B1 | 20.9 ± 2.6 (oestrone 3‐sulfate) | 1.6 ± 0.3 |
| OAT2 | 131.9 ± 36.5 (PGF2α) | 0.9 ± 0.1 |
| OCT1 | 65.1 ± 4.4 (tetraethylammonium) | 1.3 ± 1.1 |
| OCT3 | 54.7 ± 3.2 (tetraethylammonium) | 1.9 ± 0.5 |
| NTCP | 78.1 ± 2.6 (taurocholic acid) | 1.2 ± 0.2 |
| Human hepatic sinusoidal efflux ABC transporters | ||
| MRP3 | 5.0 ± 0.3 (E217βG) | 5.0 ± 0.4 |
| MRP4 | 4.3 ± 0.5 (E217βG) | 6.1 ± 0.5 |
| Human hepatic canalicular efflux ABC transporters | ||
| MRP2 | 7.2 ± 0.3 (E217βG) | 29.1 ± 2.1 |
| ABCP | 4.0 ± 0.2 (methotrexate) | 20.1 ± 1.5 |
| BSEP | 4.0 ± 1.2 (taurocholic acid) | 23.0 ± 1.2 |
| MDR1 | 4.7 ± 0.3 (verapamil) | 7.4 ± 1.2 |
| Human hepatic canalicular efflux SLC transporter | ||
| MATE1 | 18.8 ± 2.6 (tetraethylammonium) | 0.8 ± 0.3 |
| Rat hepatic sinusoidal uptake SLC transporters | ||
| Oatp1a1 | 17.9 ± 1.5 (E217βG) | 1.3 ± 0.2 |
| Oatp1b2 | 15.4 ± 2.2 (E217βG) | 12.2 ± 0.6 |
| Oat2 | 100.5 ± 19.4 (PGF2α) | 1.3 ± 0.4 |
| Oct1 | 82.8 ± 3.1 (tetraethylammonium) | 1.1 ± 0.6 |
| Oct3 | 98.9 ± 4.1 (tetraethylammonium) | 0.9 ± 0.3 |
| Octn2 | 34.7 ± 0.9 (tetraethylammonium) | 0.7 ± 0.0 |
| Ntcp | 22.8 ± 1.9 (taurocholic acid) | 1.1 ± 0.2 |
| Rat hepatic sinusoidal efflux ABC transporter | ||
| Mrp4 | 4.6 ± 0.7 (E217βG) | 6.1 ± 0.3 |
| Rat hepatic canalicular efflux ABC transporters | ||
| Mrp2 | 4.0 ± 0.3 (E217βG) | 6.1 ± 0.3 |
| Abcp | 20.5 ± 2.6 (methotrexate) | 7.1 ± 0.5 |
| Bsep | 5.1 ± 0.4 (taurocholic acid) | 4.9 ± 0.4 |
| Mdr1a | 4.3 ± 0.7 (verapamil) | 1.9 ± 0.1 |
| Mdr1b | 3.6 ± 0.8 (verapamil) | 1.3 ± 0.2 |
| Rat hepatic canalicular efflux SLC transporter | ||
| Mate1 | 11.1 ± 0.8 (tetraethylammonium) | 1.0 ± 0.1 |
For assessment of cellular uptake mediated by SLC transporters, differential uptake rates between the TCs and the MCs were defined as a net transport ratio (TransportTC/TransportMC ratio), and a net transport ratio > 3 suggested a positive result. For assessment of vesicular transport mediated by ABC transporters, a positive result for an ATP‐dependent transport was defined as a net transport rate ratio (TransportATP/TransportAMP ratio) > 3. Values represent the means ± SDs (n = 3).
Figure 1.
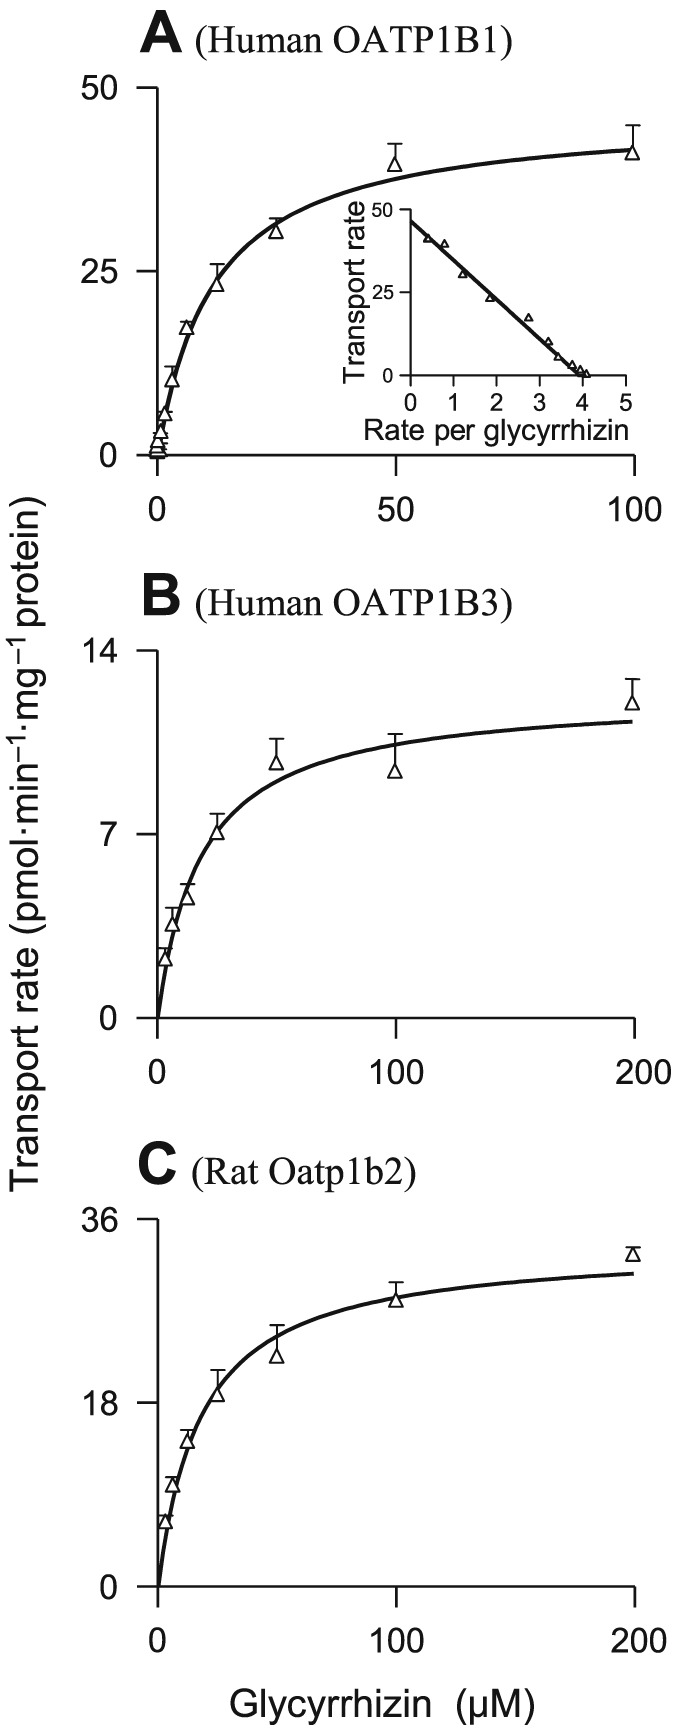
Representative kinetic plots of transport versus substrate concentration for cellular uptake of glycyrrhizin mediated by human OATP1B1 (A), human OATP1B3 (B) and rat Oatp1b2 (C). The K M and V max values are shown in Table 2, and they represent the means ± SDs from two independent experiments where each was performed in triplicate (total n = 6). The glycyrrhizin concentrations were 0.045–100, 3.1–200 and 3.1–200 μM for OATP1B1, OATP1B3 and Oatp1b2 respectively.
Table 2.
Kinetic parameters for transports of glycyrrhizin by human and rat hepatic transporters
| Transporter | K M (μM) | V max (pmol·min−1·mg−1 protein) | CLint (μL·min−1·mg−1 protein) | K i or IC50 of rifampin (substrate, glycyrrhizin) (μM) | K i of glycyrrhizin (substrate, E217βG) (μM) |
|---|---|---|---|---|---|
| Human transporters | |||||
| OATP1B1 | 21.7 ± 3.0 | 16.6 ± 0.8 | 0.76 | 0.22 ± 0.09 (K i) | 14.8 ± 1.3 |
| OATP1B3 | 18.4 ± 3.0 | 12.4 ± 0.6 | 0.68 | 0.34 ± 0.03 (K i) | 7.7 ± 0.6 |
| MRP2 | 12.3 ± 1.7 | 96.3 ± 3.1 | 7.82 | 144 ± 6 (IC50) | ― |
| ABCP | 45.4 ± 23.5 | 9.7 ± 1.9 | 0.21 | 461 ± 35 (IC50) | ― |
| BSEP | 102.1 ± 42.4 | 34.1 ± 14.1 | 0.33 | 176 ± 17 (IC50) | ― |
| MDR1 | 23.9 ± 12.1 | 26.0 ± 4.1 | 1.09 | 279 ± 17 (IC50) | ― |
| MRP3 | 17.9 ± 3.1 | 121 ± 6.2 | 6.76 | 108 ± 12 (IC50) | ― |
| MRP4 | 21.9 ± 7.3 | 80.2 ± 8.4 | 3.66 | 119 ± 25 (IC50) | ― |
| Rat transporters | |||||
| Oatp1b2 | 18.2 ± 2.3 | 35.6 ± 1.2 | 1.95 | 0.72 ± 0.05 (K i) | 40.1 ± 3.2 |
| Mrp2 | 17.2 ± 8.0 | 25.6 ± 3.2 | 1.49 | 94 ± 7 (IC50) | ― |
| Abcp | 86.4 ± 25.1 | 46.6 ± 6.2 | 0.54 | 335 ± 16 (IC50) | ― |
| Bsep | 47.6 ± 18.2 | 38.6 ± 9.3 | 0.81 | 180 ± 12 (IC50) | ― |
| Mrp4 | 7.0 ± 1.6 | 63.2 ± 3.4 | 9.02 | 171 ± 22 (IC50) | ― |
Values represent the means ± SDs [n = 3, except for the values for transports of glycyrrhizin mediated by human OATP1B1, OATP1B3 and rat Oatp1b2, which were from two independent experiments where each was performed in triplicate (total n = 6)].
Figure 2.
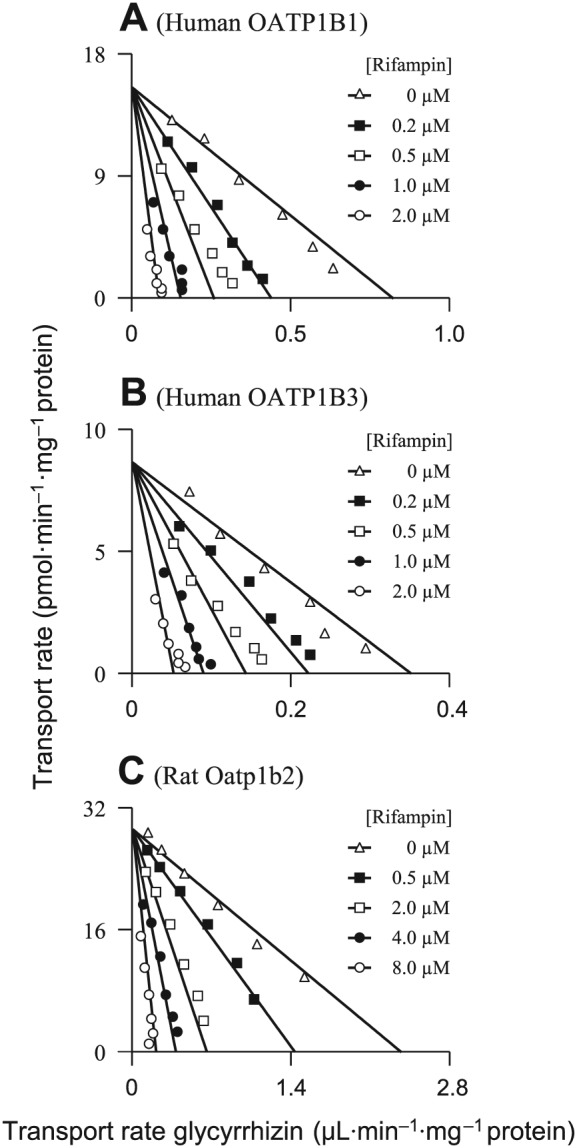
Representative Eadie–Hofstee plots of rifampin inhibition of cellular uptake of glycyrrhizin mediated by human OATP1B1 (A), human OATP1B3 (B) and rat Oatp1b2 (C). The K i values are shown in Table 2, and they represent the means ± SDs (n = 3). The concentrations of the substrate glycyrrhizin were 3.13–100, 3.13–100 and 6.25–200 μM for OATP1B1, OATP1B3 and Oatp1b2 respectively. The concentrations of the inhibitor rifampin are shown in the plots.
Figure 3.
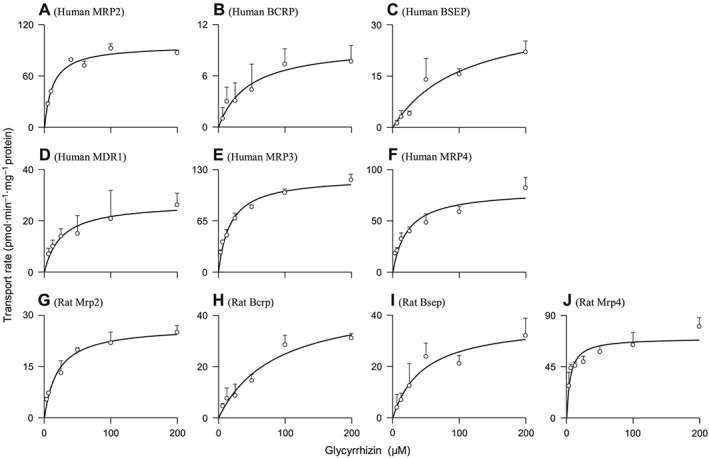
Representative kinetic plots of transport versus substrate concentration for vesicular transport of glycyrrhizin mediated by human MRP2 (A), human ABCP (BCRP) (B), human BSEP (C), human MDR1 (D), human MRP3 (E), human MRP4 (F), rat Mrp2 (G), rat Abcp (Bcrp) (H), rat Bsep (I) and rat Mrp4 (J). The K M and V max values are shown in Table 2, and they represent the means ± SDs (n = 3). The glycyrrhizin concentrations were 3.13–200 μM for all the transporters tested.
Figure 4.
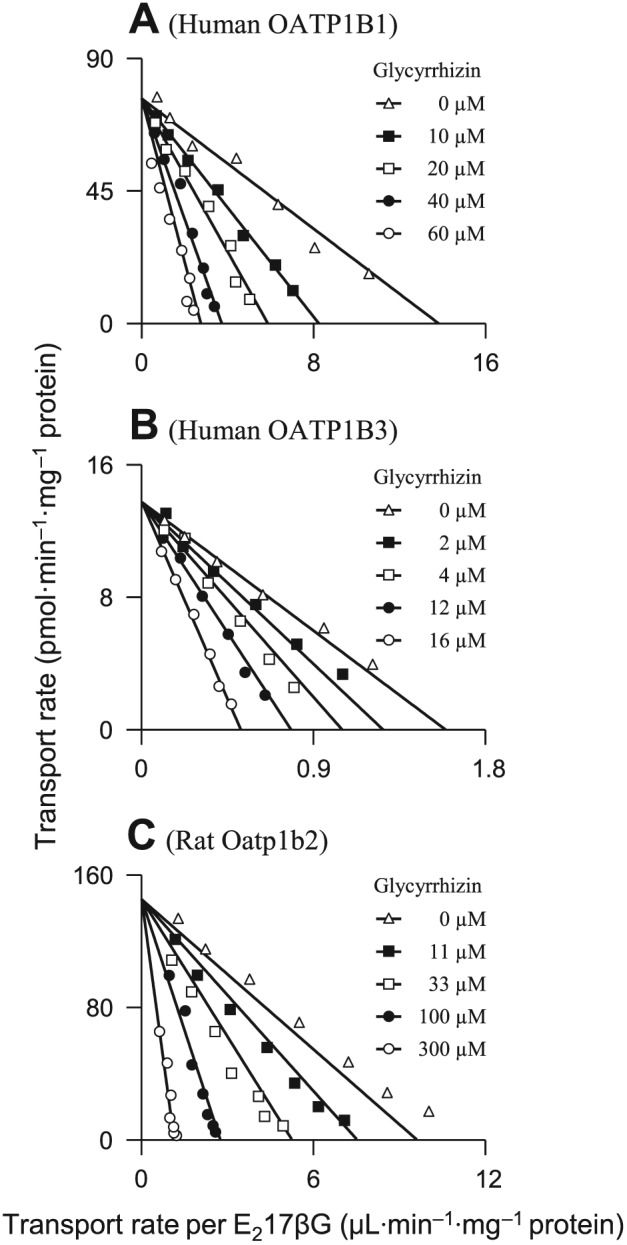
Representative Eadie–Hofstee plots of glycyrrhizin inhibition of the cellular uptake of E217βG mediated by human OATP1B1 (A), human OATP1B3 (B) and rat Oatp1b2 (C). The K i values are shown in Table 2, and they represent the means ± SDs (n = 3). The concentrations of the substrate E217βG were 1.56–100, 9.38–300 and 1.56–100 μM for OATP1B1, OATP1B3 and Oatp1b2 respectively. The concentrations of the inhibitor glycyrrhizin are shown in the plots.
In vitro transport of glycyrrhizin by rat hepatic transporters
Rat hepatic uptake SLC transporter Oatp1b2 is the closest ortholog of both human hepatic OATP1B1 and OATP1B3. As shown in Table 1, Oatp1b2 exhibited transport activity for glycyrrhizin, while other rat hepatic uptake SLC transporters (Oatp1a1, Oat2, Oct1, Oct3, Octn2 and Ntcp) did not exhibit such transport activity. Rat Oatp1b2 exhibited affinity for glycyrrhizin similar to human OATP1B1 and OATP1B3 (Table 2 and Figure 1). The Oatp1b2‐mediated cellular uptake of glycyrrhizin was competitively inhibited by rifampin (Figure 2) with a K i shown in Table 2. Like the preceding human hepatic ABC transporters, the rat hepatic canalicular efflux ABC transporters Mrp2, Abcp and Bsep and the sinusoidal efflux ABC transporter Mrp4 transported glycyrrhizin (Table 1). Mrp2 exhibited a substantially greater in vitro CLint value of glycyrrhizin than Abcp and Bsep (Table 2 and Figure 3). Rifampin weakly inhibited vesicular uptakes of glycyrrhizin mediated by these rat ABC transporters (IC50 > 100 μM), except for Mrp2 (94 μM). The rat hepatic efflux SLC transporter Mate1 exhibited no transport activity (Table 1). Similar to that in humans, a two‐step molecular mechanism is proposed for hepatobiliary excretion of glycyrrhizin in rats, that is, uptake from blood into hepatocytes by rat Oatp1b2 and efflux from the hepatocytes into bile by rat Mrp2 with Abcp and Bsep playing a minor role. The role of rat Mrp4 in the excretion is probably similar to that of human MRP3/MRP4.
Rat pharmacokinetics of i.v. glycyrrhizin altered by rifampin inhibition of hepatic Oatp1b2
To characterize the impact of hepatic uptake on pharmacokinetics of glycyrrhizin, rats were treated with rifampin, a potent inhibitor of rat Oatp1b2 (Jiang et al., 2015). Figure 5A and B shows plasma concentrations of glycyrrhizin over time after an i.v. bolus dose of glycyrrhizin in control (rifampin untreated) rats and in rifampin‐treated rats; Tables 3 and 4 summarize the pharmacokinetic data of glycyrrhizin. The rifampin treatment resulted in significantly slowed biliary excretion and, in turn, systemic clearance of glycyrrhizin. This was indicated by the CLB and CLtot,p values of glycyrrhizin in rifampin‐treated rats, which were only 22.7 and 27.1% of those in control rats (P < 0.05 for both). The plasma AUC0–12 h of glycyrrhizin in rifampin‐treated rats was 3.7‐fold higher than that in control rats, and the terminal t 1/2 was 3.0‐fold longer (P < 0.05 for both). In addition to these increased plasma AUC0–12 h and t 1/2, the rifampin treatment resulted in increased renal exposure to glycyrrhizin, that is, 5.5‐fold and 6.7‐fold increases for AUC0–12 h and t 1/2 respectively (P < 0.05 for both). In the liver, the rifampin treatment resulted in decreased initial concentrations of glycyrrhizin after dosing (Figure 5C and D), but the compound's liver AUC0–4 h did not alter significantly (P > 0.05). Liver t 1/2 of glycyrrhizin in rifampin‐treated rats was 3.87‐fold greater than those in control rats (P < 0.05).
Figure 5.
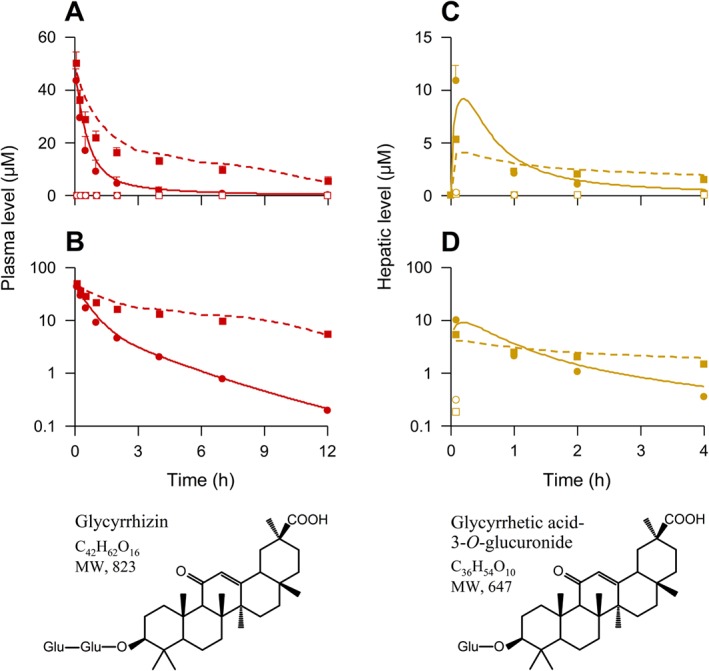
Observed plasma and liver concentration–time profiles of glycyrrhizin (red and brown solid dots, respectively) and glycyrrhetic acid 3‐O‐glucuronide (red and brown open dots, respectively) after an i.v. bolus dose of the saponin at 2.6 mg·kg−1 in control (rifampin untreated) rats (circular dots) and rifampin‐treated rats (square dots) and the compounds' chemical structures. The plasma data (also shown in Table 3) represent means ± SDs from three independent experiments where each rat group was performed in triplicate for the first and third experiments and in sextuplicate for the second experiment (total n = 12). Also, the hepatic data (also shown in Table 4) represent means ± SDs (n = 5). Lines denote PBPK model simulations of plasma (A and B; red lines) and liver (C and D; brown lines) concentration–time profiles of glycyrrhizin in control rats (solid lines) and rifampin‐treated rats (dashed lines). The predicted C 5 min‐liver and AUC0–4 h‐liver of glycyrrhizin in control rats were 8.1 μM and 9.7 μM·h respectively, while those in rifampin‐treated rats were 4.0 μM and 10.5 μM·h respectively. Related pharmacokinetic data of rifampin after i.v. administration at 20 mg·kg−1 in rats are shown in our earlier publication (supporting information appendix S4) by Jiang et al. (2015). Glu, glucuronosyl.
Table 3.
Observed and model‐predicted plasma pharmacokinetic parameters of glycyrrhizin in rats and humans after i.v. administration of the saponin
| Pharmacokinetic parameter | Observed | Model‐predicted (accuracy) |
|---|---|---|
| Pharmacokinetics of glycyrrhizin in control (rifampin untreated) rats that received an i.v. bolus dose at 2.6 mg·kg−1 | ||
| C 5 min (μM) | 44.6 ± 3.9 | 42.7 (95.7%) |
| AUC0–12 h (μM·h) | 41.3 ± 10.4 | 48.1 (116.1%) |
| AUC0‐∞ (μM·h) | 43.1 ± 12.0 | 48.8 (113.2%) |
| t 1/2 (h) | 2.1 ± 0.5 | 2.2 (104.8%) |
| CLtot,p (mL·h−1·kg−1) | 76.4 ± 22.7 | 66.5 (87.0%) |
| CV SS (mL·kg−1) | 133.2 ± 16.1 | 129.4 (97.1%) |
| Pharmacokinetics of glycyrrhizin in rifampin‐treated rats that received an i.v. bolus dose at 2.6 mg·kg−1 | ||
| C 5 min (μM) | 50.4 ± 4.4a | 46.9 (93.1%) |
| AUC0–12 h (μM·h) | 151.8 ± 14.8a | 184.7 (121.7%) |
| AUC0‐∞ (μM·h) | 199.8 ± 40.1a | 222.9 (111.6%) |
| t 1/2 (h) | 6.3 ± 1.3a | 4.9 (77.8%) |
| CLtot,p (mL·h−1·kg−1) | 20.7 ± 3.4a | 17.3 (83.6%) |
| V SS (mL·kg−1) | 129.6 ± 22.8 | 92.2 (71.4%) |
| Pharmacokinetics of glycyrrhizin in human subjects who received a 12 min i.v. infusion at 40 mg per person | ||
| C 17 min (μM) | 12.4 ± 1.5 | 12.2 (98.4%) |
| AUC0–12.2 h (μM·h) | 30.9 ± 4.4 | 38.9 (125.9%) |
| AUC0‐∞ (μM·h) | 36.4 ± 7.2 | 40.4 (111.0%) |
| t 1/2 (h) | 3.6 ± 0.4 | 2.90 (93.2%) |
| CLtot,p (mL·h−1·kg−1) | 18.4 ± 4.0 | 24.8 (100.8%) |
| V SS (mL·kg−1) | 66.2 ± 3.7 | 85.8 (77.2%) |
| Pharmacokinetics of glycyrrhizin in human subjects who received a 12 min i.v. infusion at 80 mg per person | ||
| C 17 min (μM) | 32.2 ± 5.8 | 24.9 (77.3%) |
| AUC0–12.2 h (μM·h) | 76.4 ± 3.1 | 78.8 (103.1%) |
| AUC0‐∞ (μM·h) | 81.8 ± 3.8 | 81.1 (99.1%) |
| t 1/2 (h) | 3.6 ± 0.3 | 2.89 (79.3%) |
| CLtot,p (mL·h−1·kg−1) | 18.2 ± 1.9 | 23.6 (120.4%) |
| V SS (mL·kg−1) | 74.3 ± 13.8 | 84.7 (113.8%) |
| Pharmacokinetics of glycyrrhizin in human subjects who received a 12 min i.v. infusion at 120 mg per person | ||
| C 17 min (μM) | 47.4 ± 3.4 | 37.3 (78.7%) |
| AUC0–12.2 h (μM·h) | 113.2 ± 16.1 | 118 (104.4%) |
| AUC0‐∞ (μM·h) | 119.1 ± 17.7 | 122.4 (102.8%) |
| t 1/2 (h) | 3.1 ± 0.0 | 2.89 (92.6%) |
| CLtot,p (mL·h−1·kg−1) | 19.4 ± 1.0 | 23.7 (115.6%) |
| V SS (mL·kg−1) | 70.8 ± 9.6 | 84.6 (119.5%) |
| Predicted pharmacokinetics of glycyrrhizin in humans with 50% impairment of OATP1B; 12 min infusion at 120 mg per person | ||
| C 17 min (μM) | ― | 38.3 |
| AUC0–12.2 h (μM·h) | ― | 187.3 |
| AUC0‐∞ (μM·h) | ― | 217.8 |
| t 1/2 (h) | ― | 4.55 |
| CLtot,p (mL·h−1·kg−1) | ― | 15.6 |
| Predicted pharmacokinetics of glycyrrhizin in humans with 90% impairment of OATP1B; 12 min infusion at 120 mg per person | ||
| C 17 min (μM) | ― | 39.2 |
| AUC0–12.2 h (μM·h) | ― | 309.1 |
| AUC0‐∞ (μM·h) | ― | 578.5 |
| t 1/2 (h) | ― | 11.6 |
| CLtot,p (mL·h−1·kg−1) | ― | 9.4 |
C 17 min, concentration at 17 min after starting an infusion of glycyrrhizin. The observed human plasma concentrations of glycyrrhizin over time were digitized, using Digit (version 1.04; Simulations Plus), from the published figures (Yamamura et al., 1992). Pharmacokinetic parameters for observed and simulated concentration–time profiles were estimated by noncompartmental analysis using Kinetica (version 5.0; Thermo Scientific). The rat data represent means ± SDs from three independent experiments where each rat group was performed in triplicate for the first and third experiments and in sextuplicate for the second experiment (total n = 12). The human data represent means ± SDs (n = 3).
P < 0.05 (vs. the respective observed values in control rats).
Table 4.
Additional pharmacokinetic parameters of glycyrrhizin in control (rifampin untreated) and rifampin‐treated rats after an i.v. bolus dose of the saponin at 2.6 mg·kg−1
| Pharmacokinetic parameter | Glycyrrhizin (in rifampin‐untreated rats) | Glycyrrhizin (in rifampin‐treated rats) |
|---|---|---|
| Plasma protein binding to glycyrrhizin | ||
| f u‐plasma | 0.008 ± 0.001 | 0.008 ± 0.001 |
| Hepatobiliary excretion of glycyrrhizin | ||
| Cum.A e‐B,0–24 h(unchanged glycyrrhizin) (μmol·kg−1) | 2.97 ± 0.31 | 2.40 ± 0.33a |
| f e‐B(unchanged glycyrrhizin) (%) | 92.4 ± 7.4 | 73.5 ± 7.5a |
| Cum.A e‐B,0–24 h(glycyrrhetic acid 3‐O‐glucuronide) (μmol·kg−1) | 0.02 ± 0.01 | 0.16 ± 0.03a |
| Cum.A e‐U,0–24 h(glycyrrhetic acid 3‐O‐glucuronide) (μmol·kg−1) | Not detected | Not detected |
| f e‐B (%) | 93.3 ± 9.0 | 78.4 ± 6.8 |
| CLB (mL·h−1·kg−1) | 72.8 ± 7.3 | 16.5 ± 1.4a |
| Renal excretion of glycyrrhizin | ||
| Cum.A e‐U,0–24 h(unchanged glycyrrhizin) (μmol·kg−1) | 0.06 ± 0.03 | 0.50 ± 0.07a |
| f e‐U(unchanged glycyrrhizin) (%) | 3.1 ± 0.8 | 16.1 ± 2.1a |
| CLR (mL·h−1·kg−1) | 1.8 ± 0.6 | 3.1 ± 0.6a |
| Tissue distribution of glycyrrhizin | ||
| C 5 min‐plasma (μM) | 14.7 ± 4.1 | 17.9 ± 1.5 |
| AUC0–4 h‐plasma (μM·h) | 15.7 ± 3.0 | 51.1 ± 1.8a |
| C 5 min‐kidney (μM) | 2.12 ± 0.28 | 5.31 ± 0.40a |
| AUC0–4 h‐kidney (μM·h) | 2.71 ± 0.47 | 14.9 ± 1.9a |
| t 1/2‐kidney (h) | 0.93 ± 0.53 | 6.04 ± 0.76a |
| K P‐kidney | 0.17 ± 0.04 | 0.29 ± 0.04 |
| C 5 min‐liver (μM) | 10.8 ± 1.5 | 5.27 ± 0.15a |
| AUC0–4 h‐liver (μM·h) | 7.46 ± 0.95 | 8.97 ± 0.70 |
| t 1/2‐liver (h) | 1.00 ± 0.61 | 3.87 ± 1.34a |
| K P‐liver | 0.47 ± 0.12 | 0.17 ± 0.01 |
K P, tissue/plasma partition coefficient. The data for hepatobiliary and renal excretion of glycyrrhizin represent means ± SDs from three independent experiments where each rat group was performed in triplicate (total n = 9). The data for tissue distribution of glycyrrhizin represent means ± SDs (n = 5).
P < 0.05 (vs. the respective values in control rats).
Unlike the preceding pharmacokinetic data, the V SS and f u‐plasma of glycyrrhizin were not altered by the rifampin treatment (P > 0.05 for both). For glycyrrhizin in rats, the sum of CLB and CLR accounted for 97.6% of CLtot,p. Due to its extensive protein binding in plasma, renal excretion played a minor role in systemic clearance of glycyrrhizin, demonstrating the CLR accounting for only 2.4% of CLtot,p in control rats. Consistently, renal excretion of glycyrrhizin appeared to be based on glomerular filtration; this is indicated by CLR/(GFR × f u‐plasma) ratios, which were 1.24 and 0.72 in the rifampin‐treated and control rats respectively. The rifampin treatment did not substantially alter CLR of glycyrrhizin (Table 3), although the value in rifampin‐treated rats was significantly greater, in terms of statistics, than that in control rats (P < 0.05). After i.v. dosing glycyrrhizin in rats, a minor deglycosylated metabolite, glycyrrhetic acid 3‐O‐glucuronide, was detected in plasma and bile samples but not in urine samples. The plasma AUC0–12 h of glycyrrhetic acid 3‐O‐glucuronide was only 0.6% of that of unchanged glycyrrhizin; its Cum.A e‐B,0–24 h accounted for only 0.9% of the i.v. dose of glycyrrhizin. This deglycosylation can take place in the liver (Akao et al., 1991) and requires Oatp1b2‐mediated hepatic uptake of glycyrrhizin (with a slow rate of membrane permeation) from blood into hepatocytes. Therefore, this deglycosylation in rats limitedly contributed to the CLtot,p of glycyrrhizin; it took place after hepatic uptake of glycyrrhizin. Other metabolites, including glycyrrhetic acid, were not or negligibly detected in the rat samples using methods by Kostiainen et al. (2003) and Anari et al. (2004). Collectively, the significantly altered pharmacokinetic profile of glycyrrhizin in rats was mainly attributed to rifampin‐induced impairment of its hepatic uptake, suggesting glycyrrhizin could be a victim of hepatic drug–drug interactions on Oatp1b2 in rats. Together with the kidney and liver distribution data, other tissue distribution data for glycyrrhizin in control rats, shown in Table S4 in Supporting Information Appendix S1, were used in the following PBPK modelling.
Predicted changes in systemic exposure to i.v. dosed glycyrrhizin in humans with impaired OATP1B1/1B3 activities
A PBPK model for p.o. administered glycyrrhizin was first developed by Ploeger et al. (2000a,b) and later by Xu et al. (2014). Because the route of administration has a great impact on the pharmacokinetic profile of glycyrrhizin and because the molecular mechanism underlying hepatobiliary excretion of this saponin was not well understood during the development of these previous models, a new PBPK model for i.v. glycyrrhizin, incorporating transporter‐mediated hepatobiliary excretion, was built in this investigation. Parameter sensitivity analyses (PSAs) were performed for model verification. A PSA plot, shown in Figure S5 in Supporting Information Appendix S2, depicts relationships of expression of Oatp1b2 and Mrp2 in the rat liver to plasma AUC0–12 h of glycyrrhizin. As results of the PSA, the Oatp1b2 expression had a high potential to influence the glycyrrhizin AUC0–12 h, while the Mrp2 expression had a low potential to influence the glycyrrhizin AUC0–12 h. As shown in Figure 2, the newly developed model adequately captured rat plasma and hepatic concentration–time profiles of glycyrrhizin in rifampin‐treated and rifampin‐untreated rats. Table 3 summarizes the model‐predicted rat plasma t 1/2, AUC0–12 h and CLtot,p values of glycyrrhizin; all of them were within a pre‐specified criteria (≤ 30%) for acceptable model performance.
This model was then extrapolated to humans after taking into account the system‐dependent parameters based on human physiology. As shown in Figure 6 and Table 4, simulated human plasma concentrations of glycyrrhizin were also in line with the reported concentrations in Japanese subjects given a 12 min i.v. infusion of glycyrrhizin at 40, 80 and 120 mg per person. Finally, the PBPK model was used to predict changes in systemic and hepatic exposure to glycyrrhizin in humans with impaired OATP1B1/1B3 activities. As shown in Figure 6C–G, plasma AUC0‐∞ and t 1/2 of glycyrrhizin in humans significantly increased when OATP1B1/1B3 activities were impaired substantially, whereas its plasma C max limitedly increased. The increase in AUC0‐∞ and t 1/2 depended on extent of the impairment. When such impairment was <50%, the AUC0‐∞ and t 1/2 only increased by 1.0–1.6 times and to 2.9–4.6 h respectively. However, when the impairment was 80–100%, the AUC0‐∞ increased by 3.3–8.0 times and the t 1/2 increased from 2.9 to 8.2–20.2 h. In addition, the prolonged circulation of glycyrrhizin caused by drug–drug interactions is likely to result in significant systemic accumulation (accumulative factors, 1.2–1.8 for the 80–100% impairment) during multiple dosing, that is, further increased AUC0‐∞ and also increased C max. Meanwhile, hepatic C max of glycyrrhizin was significantly decreased by impairing OATP1B1/1B3 activities, but its hepatic AUC0‐∞ and t 1/2 increased (Figure 6H–J). Table 3 summarizes comparative human plasma pharmacokinetic data of glycyrrhizin when hepatic OATP1B1/1B3 activities were 50 and 90% impaired. The quantitative analysis, accomplished using this newly developed PBPK model, highlights the need for a clinical drug–drug interaction study to investigate therapeutic relevance of dual inhibition of OATP1B1/1B3 to glycyrrhizin‐including combination drug therapies of liver diseases.
Figure 6.
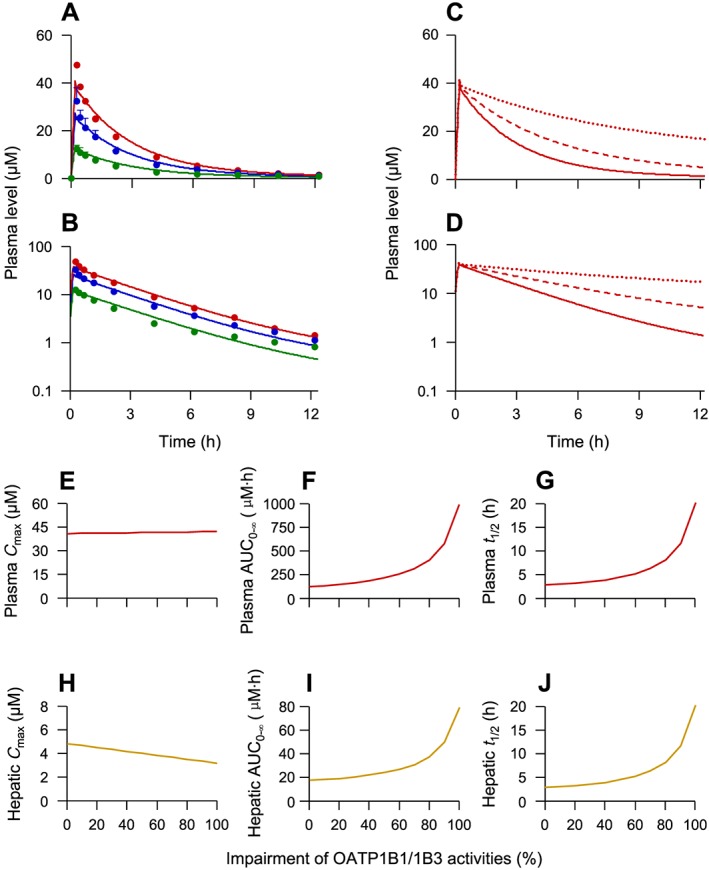
Observed (dots) and retrospectively predicted plasma concentrations (lines) of glycyrrhizin over time after a 12 min i.v. infusion of glycyrrhizin at 40 (in green), 80 (in blue) and 120 (in red) mg per person in human subjects (A and B) and prospectively predicted plasma concentration–time profiles of glycyrrhizin after a 12 min i.v. infusion of glycyrrhizin at 120 mg per person in humans with 0% (solid red lines), 50% (dashed red lines) and 90% (dotted red lines) impairment of OATP1B1/1B3 (C and D). (E–G) Prospectively predicted plasma C max, AUC0‐∞ and t 1/2 of glycyrrhizin (red lines) after a 12 min i.v. infusion of glycyrrhizin at 120 mg per person in humans with hepatic OATP1B1/1B3 activities impaired to different extents. (H–J) The associated prospectively predicted hepatic data (brown lines). These changes in systemic and hepatic exposure to glycyrrhizin were predicted using the PBPK model (Table S1 in Supporting Information Appendix S1) by changing the compound's K M for the two transporters. The assumption, used as a worst‐case estimate, was that the inhibition of OATP1B1/1B3 was constant over time. It is worth mentioning that sustaining the impairment of OATP1B1/1B3 activities by the inhibitory perpetrator depends on the perpetrator's inhibitory potency and pharmacokinetics (the unbound level of systemic exposure and terminal t 1/2). The observed glycyrrhizin data were digitalized from a publication by Yamamura et al. (1992) with permission of Elsevier and APhA and represent means ± SDs (n = 3).
Discussion
Inflammation in the liver precedes and promotes the progression towards liver cirrhosis and hepatocellular carcinoma. In China, glycyrrhizin has been incorporated into the management of liver diseases due to its additional value of anti‐inflammation and hepatoprotection when combined with cause‐specific treatments (Expert Committee for Prevention and Management of Liver Inflammation, Chinese Society of Infectious Diseases, 2014; Expert Committee on Clinical Application of Glycyrrhizin Preparation in the Treatment of Liver Diseases, 2016). Given that glycyrrhizin is commonly comedicated in patients with liver diseases and other comorbidities, it is necessary to have a good understanding of its potential for therapeutic interactions with coadministered drugs. This will help to ensure pharmacokinetic compatibility for the success of glycyrrhizin‐including multidrug treatment of liver diseases. Glycyrrhizin‐related potential drug–drug interactions were recently reviewed (Feng et al., 2015; Zhang et al., 2015; Wu et al., 2016). The reported interactions involved glycyrrhizin as an inducer of cytochrome P450 3A4 (CYP3A4) in human subjects given p.o. glycyrrhizin (Tu et al., 2010a,b) and to inhibit OATP1B1 (K i, 16 μM; substrate, estrone 3‐sulfate) and OATP1B3 (13 μM; bromosulfophthalein) (Ismair et al., 2003). After p.o. administration, unchanged glycyrrhizin is slowly absorbed from the gastrointestinal tract and converted by the colonic microflora into the deglycosylated metabolite glycyrrhetic acid, which can be absorbed (Yu et al., 2012). It remains unknown which form of glycyrrhizin, unchanged or metabolized, was responsible for the preceding induction of human CYP3A4 after p.o. dosing glycyrrhizin. The K i values of glycyrrhizin for OATP1B1 and OATP1B3 by Ismair et al. (2003) were similar to our data (Table 1). However, at the clinically relevant doses (Yamamura et al., 1992), i.v. glycyrrhizin has low propensity to act as an inhibitory perpetrator in OATP1B‐mediated drug–drug interactions. Extensive protein binding (99%) in plasma (Yu et al., 2012) makes plasma concentrations of unbound glycyrrhizin too low (0.12–0.47 μM) to inhibit these hepatic transporters meaningfully. This is indicated by drug–drug interaction indices (unbound C max/K i), which are 0.008–0.03 for OATP1B1 and 0.009–0.04 for OATP1B3.
Unlike these previous reports stating that glycyrrhizin may act as perpetrator in drug–drug interactions, we report here a high likelihood for this saponin to be a victim of hepatic drug–drug interactions when coadministered with potent dual inhibitors of OATP1B1/1B3. These human OATP1B transporters were found to play a key role in hepatobiliary excretion of glycyrrhizin by mediating the compound's uptake from blood; no other hepatic transporters exhibited such a hepatic uptake activity. Similar to these OATP1B transporters in humans, Oatp1b2 played a key role in hepatobiliary excretion of glycyrrhizin in rats and was exclusively responsible for the compound's hepatic uptake from blood. In rats given i.v. glycyrrhizin, hepatobiliary excretion was the predominant elimination route of glycyrrhizin, based on its f e‐B (92.4%) and f e‐U (3.1%) and those of the metabolite glycyrrhetic acid 3‐O‐glucuronide (0.9 and 0%, respectively). The metabolite glycyrrhetic acid was negligibly detected in rat plasma, bile and urine samples. The rat studies involving rifampin treatment demonstrated that impairment of Oatp1b2‐mediated hepatic uptake resulted in significantly increased systemic and renal exposure to glycyrrhizin, suggesting this saponin could be a victim of hepatic drug–drug interactions on the transporter. In humans given i.v. glycyrrhizin, unchanged glycyrrhizin is the predominant circulating form (limitedly excreted into urine), while the circulating metabolite glycyrrhetic acid 3‐O‐glucuronide or glycyrrhetic acid was not detected (Yamamura et al., 1992). PBPK model‐based prediction suggested that impairment of OATP1B1/1B3‐mediated hepatic uptake could result in significantly decreased CLtot,p of and increased systemic exposure to glycyrrhizin in humans. OATP1B1 and OATP1B3 display a large inhibitor overlap, which is in agreement with the high (80%) amino acid sequence homology between the two transporters (Karlgren et al., 2012; Menon et al., 2015). There are many dual inhibitors of OATP1B1/1B3 in clinical use, including some direct‐acting antiviral agents (DAAs) in hepatitis C virus infection treatment (Karlgren et al., 2012; Furihata et al., 2014; Talavera Pons et al., 2017). Clinical drug–drug interaction study by Zha et al. (2015) indicated that coadministration of the p.o. DAAs ombitasvir/paritaprevir/ritonavir with i.v. glycyrrhizin in healthy Japanese subjects led to increased plasma AUC0–24 h of glycyrrhizin by 49%, compared with glycyrrhizin alone, albeit these investigators did not investigate the interaction mechanisms. Meanwhile, this coadministration did not cause any significant change in levels of systemic exposure to the DAAs. Paritaprevir and ritonavir are dual inhibitors of human OATP1B1 (IC50, 0.03 and 0.5 μM, respectively) and OATP1B3 (0.02 and 0.6 μM, respectively) and also dual substrates of these transporters (Shebley et al., 2017; Talavera Pons et al., 2017). Patient information leaflets of i.v. glycyrrhizin products specify that high and continuous doses of i.v. glycyrrhizin preparations could induce pseudoaldosteronism. As reported by van Rossum et al. (2001b), who gave i.v. SNMC (label dose, 80–200 mg glycyrrhizin day−1) at different dosage regimens to patients with chronic hepatitis C, significantly higher systolic BP and lower level of aldosterone were observed in the subjects following a 4 week treatment of 6 × 200 mg glycyrrhizin week−1 than just before the treatment but not in those receiving 4 week treatment of 3 × 240 or 3 × 0 mg glycyrrhizin week−1. This, together with the pharmacokinetics of i.v. glycyrrhizin (Figure 6), suggests that pseudoaldosteronism can result from increased AUC0‐∞ of glycyrrhizin. It is worth mentioning that unchanged glycyrrhizin is the predominant circulating form for i.v. glycyrrhizin in humans. Although glycyrrhetic acid 3‐O‐glucuronide and glycyrrhetic acid exhibited 11β‐HSD2 inhibition potency about seven times stronger than glycyrrhizin's (Makino et al., 2012), these metabolites were negligibly detected in human plasma and urine after i.v. dosing glycyrrhizin (Yamamura et al., 1992). Therefore, level of systemic exposure to and hepatobiliary excretion of unchanged glycyrrhizin are crucial factors governing i.v. glycyrrhizin‐induced pseudoaldosteronism. Collectively, i.v. glycyrrhizin has a high likelihood to be a victim of drug–drug interactions in patients co‐treated with potent dual inhibitors of OATP1B1/1B3, particularly some DAAs in treatment of hepatitis C virus infection.
To prevent such drug–glycyrrhizin interactions, plasma concentrations of both glycyrrhizin and coadministered dual inhibitors of OATP1B1/1B3 should be monitored and their dosages optimized accordingly; these will ensure maximum therapeutic benefit. For dual substrates of OATP1B1 and OATP1B3, these two transporters normally can compensate for the lack of each other. Therefore, coadministration with a selective inhibitor of OATP1B1 (such as saquinavir, amprenavir, atorvastatin, lapatinib and trametinib) or OATP1B3 (such as ginsenosides of protopanaxadiol type and gliquidone) may not result in significant changes in level of systemic exposure to glycyrrhizin (Karlgren et al., 2012; De Bruyn et al., 2013; Jiang et al., 2015; Kotsampasakou et al., 2015). Because the disease state is also an important regulating factor of these OATP1B transporters (Talal et al., 2017), a clinical drug–drug interaction study for i.v. glycyrrhizin in patients with liver diseases is planned, and the study design will be guided using an enhanced PBPK model that will incorporate the pathological features. In addition, genetic factor should also be considered. Genetics has been reported to be a major determinant of expression of the human hepatic uptake transporter OATP1B1, but such information is limited for OATP1B3 (Roth et al., 2012; Nies et al., 2013; Yoshida et al., 2013).
OATP1B transporters are responsible for the hepatic uptake of many drugs and naturally occurring compounds; impairment of OATP1B‐mediated hepatic uptake is the mechanism of many therapeutic drug–drug interactions (Yoshida et al., 2013). In summary, hepatobiliary excretion of glycyrrhizin in humans involves mainly OATP1B1/1B3‐mediated uptake from blood into hepatocytes and MRP2/ABCP/BSEP/MDR1‐mediated efflux from the hepatocytes into bile. The OATP1B1/1B3‐mediated hepatic uptake governs systemic clearance of and systemic exposure to glycyrrhizin. Given that there are many dual OATP1B1/1B3 inhibitors in clinical use (Table S5 in Supporting Information Appendix S1) and that substantial impairment of OATP1B1/1B3 activities can result in a significantly increased plasma AUC0‐∞ of glycyrrhizin and a prolonged t 1/2 (likely to result in significant systemic accumulation during multiple dosing), caution needs to be exercised in the use of glycyrrhizin, due to its high likelihood to be a victim of drug–drug interactions. This investigation provides information to help ensure pharmacokinetic compatibility for the success of glycyrrhizin‐including combination drug therapies for liver diseases. Besides their roles in hepatobiliary excretion and in potential drug–drug interactions, the OATP1B transporters also help the circulating glycyrrhizin, despite its extensive protein binding in plasma and slow rate of membrane permeation, to access to its hepatic targets to exert its anti‐inflammatory and hepatoprotective effects. Like glycyrrhizin, many other saponins are also pharmacologically active, and are believed to be responsible for the therapeutic actions of Chinese herbal medicines. This investigation gives new insights into the disposition of saponins and their interactions with transporters, as well as their potential for drug–drug interactions.
Author contributions
C.Li, W.J., O.E.O., J.D. and C.Lu. participated in the research design and wrote or contributed to the writing of the manuscript. C.Li, W.J., J.D. and C.Lu. performed the data analysis. J.D., W.J., R.J., F.D., F.X., J.L., O.E.O., J.Y. and F.W. conducted the experiments.
Conflict of interest
The authors declare no conflicts of interest.
Declaration of transparency and scientific rigour
This http://onlinelibrary.wiley.com/doi/10.1111/bph.13405/abstract acknowledges that this paper adheres to the principles for transparent reporting and scientific rigour of preclinical research recommended by funding agencies, publishers and other organisations engaged with supporting research.
Supporting information
Table S1 Inputs used in GastroPlus‐based physiologically based pharmacokinetic (PBPK) modeling for i.v. glycyrrhizin
Table S2 Input used in GastroPlus‐based PBPK modeling for i.v. rifampin in rats
Table S3 Observed and PBPK model‐predicted plasma pharmacokinetics of rifampinin rats after an i.v. bolus dose at 10 and 20 mg·kg−1.The observed values were calculated from the rat plasma concentrations of rifampin over time reported by this laboratory (Jiang et al., 2015). The PBPK model for i.v. rifampin was developed in this investigation (Table S2 in Supporting Information Appendix S1).
Table S4 Tissue distribution of glycyrrhizin in rifampin‐untreated rats after an i.v. bolus dose at 2.6 mg·kg−1
Table S5 Predicted increase of glycyrryhizin's area under concentration‐time curve (AUC) in presence of inhibitors of OATP1B1/1B3
Figure S1 Observed (dots) and retrospectively predicted plasma concentrations (lines) of rifampin over time after an i.v. bolus dose of rifampin at 10 (in blue) and 20 (in red) mg·kg−1 in rats. The observed concentrations of rifampin (solid circles), representing means and standard deviations, are obtained from the rat data reported by Jiang et al.(2015). The PBPK model for i.v. rifampin was developed in this investigation (Table S2 in Supporting Information Appendix S1). Panels A and B are arithmetic and semilogarithmic plots, respectively.
Figure S2 Transport of glycyrrhizin (A) and rifampin (B) in HEK‐293 mock cells and rat Oatp1b2‐, human OATP1B1‐ and human OATP1B3‐expressing HEK‐293 cells. The transport values represent the means ± SDs (n = 3).
Figure S3 Representative IC50 plots of rifampin inhibition of human MRP2‐ (A), human ABCP‐ (B), human BSEP‐ (C), human MDR1‐ (D), human MRP3‐ (E), human MRP4‐ (F), rat Mrp2‐ (G), rat Abcp‐ (H), rat Bsep‐ (I) and rat Mrp4‐mediated vesicular transport of glycyrrhizin (J). The IC50 values are shown in Table 2, and they represent the means ± SDs (n = 3). The concentration of the substrate glycyrrhizin was 50 μM for all the test transporters. The concentrations of the inhibitor rifampin were 0–600 μM for all the test transporters.
Figure S4 IC50 plots of glycyrrhizin inhibition of human OATP1B1‐ (A) and human OATP1B3‐mediated cellular uptake of E217βG (B) after 1‐h preincubation with glycyrrhizin in the absence of the substrate E217βG (solid dots) and after such preincubation without glycyrrhizin (open dots). The IC50 values represent the means ± SDs (n = 3). The concentrations of glycyrrhizin were 0–250 μM and the concentration of E217βG was 10 μM.
Figure S5 Parameter sensitivity analysis (PSA) plot for relationship of expression of Oatp1b2 and Mrp2 in the rat liver to plasma AUC0‐12 h of glycyrrhizin.
Acknowledgements
This work was funded by grants from the National Science & Technology Major Project of China ‘Key New Drug Creation and Manufacturing Program’ (2009ZX09304‐002 and 2017ZX09301012‐006), the National Science Foundation of China for Distinguished Young Scholars (30925044) and the National Natural Science Foundation of China (81603380).
Dong, J. , Olaleye, O. E. , Jiang, R. , Li, J. , Lu, C. , Du, F. , Xu, F. , Yang, J. , Wang, F. , Jia, W. , and Li, C. (2018) Glycyrrhizin has a high likelihood to be a victim of drug–drug interactions mediated by hepatic organic anion‐transporting polypeptide 1B1/1B3. British Journal of Pharmacology, 175: 3486–3503. 10.1111/bph.14393.
Contributor Information
Weiwei Jia, Email: weiweijia@simm.ac.cn.
Chuan Li, Email: chli@simm.ac.cn.
References
- Akao T, Akao T, Hattori M, Kanaoka M, Yamamoto K, Namba T et al (1991). Hydrolysis of glycyrrhizin to 18β‐glycyrrhetyl monoglucuronide by lysosomal β‐d‐glucuronidase of animal livers. Biochem Pharmacol 41: 1025–1029. [DOI] [PubMed] [Google Scholar]
- Alexander SPH, Kelly E, Marrion NV, Peters JA, Faccenda E, Harding SD et al (2017). The Concise Guide to PHARMACOLOGY 2017/18: Transporters. Br J Pharmacol 174: S360–S446. [DOI] [PMC free article] [PubMed] [Google Scholar]
- Anari MR, Sanchez RI, Bakhtiar R, Franklin RB, Baillie TA (2004). Integration of knowledge‐based metabolic predictions with liquid chromatography data‐dependent tandem mass spectrometry for drug metabolism studies: application to studies on the biotransformation of indinavir. Anal Chem 76: 823–832. [DOI] [PubMed] [Google Scholar]
- Arase Y, Ikeda K, Murashima N, Chayama K, Tsubota A, Koida I et al (1997). The long term efficacy of glycyrrhizin in chronic hepatitis C patients. Cancer 79: 1494–1500. [DOI] [PubMed] [Google Scholar]
- Asl MN, Hosseinzadeh H (2008). Review of pharmacological effects of Glycyrrhiza sp. and its bioactive compounds. Phytother Res 22: 709–724. [DOI] [PMC free article] [PubMed] [Google Scholar]
- Chen F, Li L, Xu F, Sun Y, Du F‐F, Ma X‐T et al (2013). Systemic and cerebral exposure to and pharmacokinetics of flavonols and terpene lactones after dosing standardized Ginkgo biloba leaf extracts to rats via different routes of administration. Br J Pharmacol 170: 440–457. [DOI] [PMC free article] [PubMed] [Google Scholar]
- Curtis MJ, Alexander S, Cirino G, Docherty JR, George CH, Giembycz MA et al (2018). Experimental design and analysis and their reporting II: updated and simplified guidance for authors and peer reviewers. Br J Pharmacol 175: 987–993. [DOI] [PMC free article] [PubMed] [Google Scholar]
- De Bruyn T, van Westen GJ, Ijzerman AP, Stieger B, de Witte P, Augustijns PF et al (2013). Structure‐based identification of OATP1B1/3 inhibitors. Mol Pharmacol 83: 1257–1267. [DOI] [PubMed] [Google Scholar]
- Expert Committee for Prevention and Management of Liver Inflammation, Chinese Society of Infectious Diseases (2014). Consensus statement by the expert committee for prevention and management of liver inflammation in China. Chin J Hepatol 22: 94–103. [Google Scholar]
- Expert Committee on Clinical Application of Glycyrrhizin Preparation in the Treatment of Liver Diseases (2016). Expert consensus on clinical application of glycyrrhizin preparation in the treatment of liver diseases. J Clin Hepatol 32: 844–852. [Google Scholar]
- Feng X‐C, Ding L‐Q, Qiu F (2015). Potential drug interactions associated with glycyrrhizin and glycyrrhetinic acid. Drug Metab Rev 47: 229–238. [DOI] [PubMed] [Google Scholar]
- Furihata T, Matsumoto S, Fu Z‐G, Tsubota A, Sun Y‐C, Matsumoto S et al (2014). Different interaction profiles of direct‐acting anti‐hepatitis C virus agents with human organic anion transporting polypeptides. Antimicrob Agents Chemother 58: 4555–4564. [DOI] [PMC free article] [PubMed] [Google Scholar]
- Guo B, Li C, Wang G‐J, Chen L‐S (2006). Rapid and direct measurement of free concentrations of highly protein‐bound fluoxetine and its metabolite norfluoxetine in plasma. Rapid Commun Mass Spectrom 20: 39–47. [DOI] [PubMed] [Google Scholar]
- Gui C, Hagenbuch B (2009). Role of transmembrane domain 10 for the function of organic anion transporting polypeptide 1B1. Protein Sci 18: 2298–2306. [DOI] [PMC free article] [PubMed] [Google Scholar]
- Harding SD, Sharman JL, Faccenda E, Southan C, Pawson AJ, Ireland S et al (2018). The IUPHAR/BPS Guide to PHARMACOLOGY in 2018: updates and expansion to encompass the new guide to IMMUNOPHARMACOLOGY. Nucl Acids Res 46: D1091–D1106. [DOI] [PMC free article] [PubMed] [Google Scholar]
- Ikeda K (2007). Glycyrrhizin injection therapy prevents hepatocellular carcinogenesis in patients with interferon‐resistant active chronic hepatitis C. Hepatol Res 37 (Suppl 2): S287–S293. [DOI] [PubMed] [Google Scholar]
- Isbrucker RA, Burdock GA (2006). Risk and safety assessment on the consumption of licorice root (Glycyrrhiza sp.), its extract and powder as a food ingredient, with emphasis on the pharmacology and toxicology of glycyrrhizin. Regul Toxicol Pharmacol 46: 167–192. [DOI] [PubMed] [Google Scholar]
- Ismair MG, Stanca C, Ha HR, Renner EL, Meier PJ, Kullak‐Ublick GA (2003). Interactions of glycyrrhizin with organic anion transporting polypeptides of rat and human liver. Hepatol Res 26: 343–347. [DOI] [PubMed] [Google Scholar]
- Iusuf D, van de Steeg E, Schinkel AH (2012). Hepatocyte hopping of OATP1B substrates contributes to efficient hepatic detoxification. Clin Pharmacol Ther 92: 559–562. [DOI] [PubMed] [Google Scholar]
- Jia W‐W, Du F‐F, Liu X‐W, Jiang R‐R, Xu F, Yang J‐L et al (2015). Renal tubular secretion of tanshinol: molecular mechanisms, impact on its systemic exposure, and propensity for dose‐related nephrotoxicity and for renal herb–drug interactions. Drug Metab Dispos 43: 669–678. [DOI] [PubMed] [Google Scholar]
- Jiang R‐R, Dong J‐J, Li X‐X, Du F‐F, Jia W‐W, Xu F et al (2015). Molecular mechanisms governing different pharmacokinetics of ginsenosides and potential for ginsenoside‐perpetrated herb–drug interactions on OATP1B3. Br J Pharmacol 172: 1059–1073. [DOI] [PMC free article] [PubMed] [Google Scholar]
- Karlgren M, Vildhede A, Norinder U, Wisniewski JR, Kimoto E, Lai Y et al (2012). Classification of inhibitors of hepatic organic anion transporting polypeptides (OATPs): influence of protein expression on drug–drug interactions. J Med Chem 55: 4740–4763. [DOI] [PMC free article] [PubMed] [Google Scholar]
- Kasahara A, Hayashi N, Mochizuki K, Takayanagi M, Yoshioka K, Kakumu S et al (1998). Risk factors for hepatocellular carcinoma and its incidence after interferon treatment in patients with chronic hepatitis C. Hepatology 27: 1394–1402. [DOI] [PubMed] [Google Scholar]
- Kilkenny C, Browne W, Cuthill IC, Emerson M, Altman DG (2010). Animal research: reporting in vivo experiments: the ARRIVE guidelines. Br J Pharmacol 160: 1577–1579. [DOI] [PMC free article] [PubMed] [Google Scholar]
- Kostiainen R, Kotiaho T, Kuuranne T, Auriola S (2003). Liquid chromatography/atmospheric pressure ionization–mass spectrometry in drug metabolism studies. J Mass Spectrom 38: 357–372. [DOI] [PubMed] [Google Scholar]
- Kotsampasakou E, Brenner S, Jäger W, Ecker GF (2015). Identification of novel inhibitors of organic anion transporting polypeptides 1B1 and 1B3 (OATP1B1 and OATP1B3) using a consensus vote of six classification models. Mol Pharm 12: 4395–4404. [DOI] [PMC free article] [PubMed] [Google Scholar]
- Li J‐Y, Cao H‐Y, Liu P, Cheng G‐H, Sun M‐Y (2014). Glycyrrhizic acid in the treatment of liver diseases: literature review. Biomed Res Int 2014: 872139. [DOI] [PMC free article] [PubMed] [Google Scholar]
- Makino T, Okajima K, Uebayashi R, Ohtake N, Inoue K, Mizukami H (2012). 3‐Monoglucuronyl‐glycyrrhretinic acid is a substrate of organic anion transporters expressed in tubular epithelial cells and plays important roles in licorice‐induced pseudoaldosteronism by inhibiting 11β‐hydroxysteroid dehydrogenase 2. J Pharmacol Exp Ther 342: 297–304. [DOI] [PubMed] [Google Scholar]
- Mathurin P, Moussalli J, Cadranel JF, Thibault V, Charlotte F, Dumouchel P et al (1998). Slow progression rate of fibrosis in hepatitis C virus patients with persistently normal alanine transaminase activity. Hepatology 27: 868–872. [DOI] [PubMed] [Google Scholar]
- McGrath JC, Lilley E (2015). Implementing guidelines on reporting research using animals (ARRIVE etc.): new requirements for publication in BJP. Br J Pharmacol 172: 3189–3193. [DOI] [PMC free article] [PubMed] [Google Scholar]
- Menon RM, Badri PS, Wang T, Polepally AR, Zha J, Khatri A et al (2015). Drug–drug interaction profile of the all‐oral anti‐hepatitis C virus regimen of paritaprevir/ritonavir, ombitasvir, and dasabuvir. J Hepatol 63: 20–29. [DOI] [PubMed] [Google Scholar]
- Mollica L, De Marchis F, Spitaleri A, Dallacosta C, Pennacchini D, Zamai M et al (2007). Glycyrrhizin binds to high‐mobility group box 1 protein and inhibits its cytokine activities. Chem Biol 14: 431–441. [DOI] [PubMed] [Google Scholar]
- Nies AT, Niemi M, Burk O, Winter S, Zanger UM, Stieger B et al (2013). Genetics is a major determinant of expression of the human hepatic uptake transporter OATP1B1, but not of OATP1B3 and OATP2B1. Genome Med 5: 1. [DOI] [PMC free article] [PubMed] [Google Scholar]
- Noe J, Portmann R, Brun ME, Funk C (2007). Substrate‐dependent drug–drug interactions between gemfibrozil, fluvastatin and other organic anion‐transporting peptide (OATP) substrates on OATP1B1, OATP2B1, and OATP1B3. Drug Metab Dispos 35: 1308–1314. [DOI] [PubMed] [Google Scholar]
- Ogiku M, Kono H, Hara M, Tsuchiya M, Fujii H (2011). Glycyrrhizin prevents liver injury by inhibition of high‐mobility group box 1 production by Kupffer cells after ischemia–reperfusion in rats. J Pharmacol Exp Ther 339: 93–98. [DOI] [PubMed] [Google Scholar]
- Orlent H, Hansen BE, Willems M, Brouwer JT, Huber R, Kullak‐Ublick GA et al (2006). Biochemical and histological effects of 26 weeks of glycyrrhizin treatment in chronic hepatitis C: a randomized phase II trial. J Hepatol 45: 539–546. [DOI] [PubMed] [Google Scholar]
- Pfeifer ND, Hardwick RN, Brouwer KLR (2014). Role of hepatic efflux transporters in regulating systemic and hepatocyte exposure to xenobiotics. Annu Rev Pharmacol Toxicol 54: 509–535. [DOI] [PubMed] [Google Scholar]
- Ploeger B, Mensinga T, Sips A, Meulenbelt J, DeJongh J (2000a). A human physiologically‐based model for glycyrrhzic acid, a compound subject to presystemic metabolism and enterohepatic cycling. Pharm Res 17: 1516–1525. [DOI] [PubMed] [Google Scholar]
- Ploeger BA, Meulenbelt J, DeJongh J (2000b). Physiologically based pharmacokinetic modeling of glycyrrhizic acid, a compound subject to presystemic metabolism and enterohepatic cycling. Toxicol Appl Pharmacol 162: 177–188. [DOI] [PubMed] [Google Scholar]
- Posada MM, Bacon JA, Schneck KB, Tirona RG, Kim RB, Higgins JW et al (2015). Prediction of renal transporter mediated drug–drug interactions for pemetrexed using physiologically based pharmacokinetic modeling. Drug Metab Dispos 43: 325–334. [DOI] [PubMed] [Google Scholar]
- Roth M, Obaidat A, Hagenbuch B (2012). OATPs, OATs and OCTs: the organic anion and cation transporters of the SLCO and SLC22A gene superfamilies. Br J Pharmacol 165: 1260–1287. [DOI] [PMC free article] [PubMed] [Google Scholar]
- Shebley M, Liu J, Kavetskaia O, Sydor J, de Morais SM, Fischer V et al (2017). Mechanisms and predictions of drug–drug interactions of the hepatitis C virus three direct‐acting antiviral regimen: paritaprevir/ritonavir, ombitasvir, and dasabuvir. Drug Metab Dispos 45: 755–764. [DOI] [PubMed] [Google Scholar]
- Talal AH, Venuto CS, Younis I (2017). Assessment of hepatic impairment and implications for pharmacokinetics of substance use treatment. Clin Pharmacol Drug Dev 6: 206–212. [DOI] [PMC free article] [PubMed] [Google Scholar]
- Talavera Pons S, Boyer A, Lamblin G, Chennell P, Chatenet FT, Nicolas C et al (2017). Managing drug–drug interactions with new direct‐acting antiviral agents in chronic hepatitis C. Br J Clin Pharmacol 83: 269–293. [DOI] [PMC free article] [PubMed] [Google Scholar]
- Tamai I, Nozawa T, Koshida M, Nezu J, Sai Y, Tsuji A (2001). Functional characterization of human organic anion transporting polypeptide B (OATP‐B) in comparison with liver‐specific OATP‐C. Pharm Res 18: 1262–1269. [DOI] [PubMed] [Google Scholar]
- Tu J‐H, He Y‐J, Chen Y, Fan L, Zhang W, Tan Z‐R et al (2010a). Effect of glycyrrhizin on the activity of CYP3A enzyme in humans. Eur J Clin Pharmacol 66: 805–810. [DOI] [PubMed] [Google Scholar]
- Tu J‐H, Hu D‐L, Dai L‐L, Sun Y, Fan L, Zhang M et al (2010b). Effect of glycyrrhizin on CYP2C19 and CYP3A4 activity in healthy volunteers with different CYP2C19 genotypes. Xenobiotica 40: 393–399. [DOI] [PubMed] [Google Scholar]
- van Rossum TG, Vulto AG, Hop WC, Schalm SW (2001a). Glycyrrhizin‐induced reduction of ALT in European patients with chronic hepatitis C. Am J Gastroenterol 96: 2432–2437. [DOI] [PubMed] [Google Scholar]
- van Rossum TG, de Jong FH, Hop WC, Boomsma F, Schalm SW (2001b). ‘Pseudo‐aldosteronism’ induced by intravenous glycyrrhizin treatment of chronic hepatitis C patients. J Gastroenterol Hepatol 16: 789–795. [DOI] [PubMed] [Google Scholar]
- Wu X, Ma J, Ye Y, Lin G (2016). Transporter modulation by Chinese herbal medicines and its mediated pharmacokinetic herb–drug interactions. J Chromatogr B 1026: 236–253. [DOI] [PubMed] [Google Scholar]
- Xu R‐J, Liu X‐Q, Yang J (2014). A semi‐physiologically based pharmacokinetic pharmacodynamic model for glycyrrhizin‐induced pseudoaldosteronism and prediction of the dose limit causing hypokalemia in a virtual elderly population. PLoS One 9: e114049. [DOI] [PMC free article] [PubMed] [Google Scholar]
- Yamamura Y, Kawakami J, Santa T, Kotaki H, Uchino K, Sawada Y et al (1992). Pharmacokinetic profile of glycyrrhizin in healthy volunteers by a new high‐performance liquid chromatographic method. J Pharm Sci 81: 1042–1046. [DOI] [PubMed] [Google Scholar]
- Yoshida K, Maeda K, Sugiyama Y (2013). Hepatic and intestinal drug transporters: prediction of pharmacokinetic effects caused by drug–drug interactions and genetic polymorphisms. Annu Rev Pharmacol Toxicol 53: 581–612. [DOI] [PubMed] [Google Scholar]
- Yu K, Chen F, Li C (2012). Absorption, disposition, and pharmacokinetics of saponins from Chinese medicinal herbs: what do we know and what do we need to know more? Curr Drug Metab 13: 577–598. [DOI] [PubMed] [Google Scholar]
- Zha J, Badri PS, Ding B, Uchiyama N, Alves K, Rodrigues‐Jr L et al (2015). Drug interactions between hepatoprotective agents ursodeoxycholic acid or glycyrrhizin and ombitasvir/paritaprevir/ritonavir in healthy Japanese subjects. Clin Ther 37: 2560–2571. [DOI] [PubMed] [Google Scholar]
- Zhang A‐J, Li Q‐S, He X, Si D‐Y, Liu C‐X (2015). Interactions between transporters and herbal medicines/drugs: a focus on hepatoprotective compounds. Curr Drug Metab 16: 911–918. [DOI] [PubMed] [Google Scholar]
- Zhang L‐X, Cui Z‐Y, Wang B‐E (2000). Therapeutic effects of Stronger Neo‐Minophagen C (SNMC) in patients with chronic liver disease. Hepatol Res 16: 145–154. [Google Scholar]
Associated Data
This section collects any data citations, data availability statements, or supplementary materials included in this article.
Supplementary Materials
Table S1 Inputs used in GastroPlus‐based physiologically based pharmacokinetic (PBPK) modeling for i.v. glycyrrhizin
Table S2 Input used in GastroPlus‐based PBPK modeling for i.v. rifampin in rats
Table S3 Observed and PBPK model‐predicted plasma pharmacokinetics of rifampinin rats after an i.v. bolus dose at 10 and 20 mg·kg−1.The observed values were calculated from the rat plasma concentrations of rifampin over time reported by this laboratory (Jiang et al., 2015). The PBPK model for i.v. rifampin was developed in this investigation (Table S2 in Supporting Information Appendix S1).
Table S4 Tissue distribution of glycyrrhizin in rifampin‐untreated rats after an i.v. bolus dose at 2.6 mg·kg−1
Table S5 Predicted increase of glycyrryhizin's area under concentration‐time curve (AUC) in presence of inhibitors of OATP1B1/1B3
Figure S1 Observed (dots) and retrospectively predicted plasma concentrations (lines) of rifampin over time after an i.v. bolus dose of rifampin at 10 (in blue) and 20 (in red) mg·kg−1 in rats. The observed concentrations of rifampin (solid circles), representing means and standard deviations, are obtained from the rat data reported by Jiang et al.(2015). The PBPK model for i.v. rifampin was developed in this investigation (Table S2 in Supporting Information Appendix S1). Panels A and B are arithmetic and semilogarithmic plots, respectively.
Figure S2 Transport of glycyrrhizin (A) and rifampin (B) in HEK‐293 mock cells and rat Oatp1b2‐, human OATP1B1‐ and human OATP1B3‐expressing HEK‐293 cells. The transport values represent the means ± SDs (n = 3).
Figure S3 Representative IC50 plots of rifampin inhibition of human MRP2‐ (A), human ABCP‐ (B), human BSEP‐ (C), human MDR1‐ (D), human MRP3‐ (E), human MRP4‐ (F), rat Mrp2‐ (G), rat Abcp‐ (H), rat Bsep‐ (I) and rat Mrp4‐mediated vesicular transport of glycyrrhizin (J). The IC50 values are shown in Table 2, and they represent the means ± SDs (n = 3). The concentration of the substrate glycyrrhizin was 50 μM for all the test transporters. The concentrations of the inhibitor rifampin were 0–600 μM for all the test transporters.
Figure S4 IC50 plots of glycyrrhizin inhibition of human OATP1B1‐ (A) and human OATP1B3‐mediated cellular uptake of E217βG (B) after 1‐h preincubation with glycyrrhizin in the absence of the substrate E217βG (solid dots) and after such preincubation without glycyrrhizin (open dots). The IC50 values represent the means ± SDs (n = 3). The concentrations of glycyrrhizin were 0–250 μM and the concentration of E217βG was 10 μM.
Figure S5 Parameter sensitivity analysis (PSA) plot for relationship of expression of Oatp1b2 and Mrp2 in the rat liver to plasma AUC0‐12 h of glycyrrhizin.