Abstract
Background and Purpose
Beta cell apoptosis is a major feature of type 1 diabetes, and pro‐inflammatory cytokines are key drivers of the deterioration of beta cell mass through induction of apoptosis. Mitochondrial stress plays a critical role in mediating apoptosis by releasing cytochrome C into the cytoplasm, directly activating caspase‐9 and its downstream signalling cascade. We aimed to identify new compounds that protect beta cells from cytokine‐induced activation of the intrinsic (mitochondrial) pathway of apoptosis.
Experimental Approach
Diabetogenic media, composed of IL‐1β, IFN‐γ and high glucose, were used to induce mitochondrial stress in rat insulin‐producing INS1E cells, and a high‐content image‐based screen of small molecule modulators of Casp9 pathway was performed.
Key Results
A novel small molecule, ATV399, was identified from a high‐content image‐based screen for compounds that inhibit cleaved caspase‐9 activation and subsequent beta cell apoptosis induced by a combination of IL‐1β, IFN‐γ and high glucose, which together mimic the pathogenic diabetic milieu. Through medicinal chemistry optimization, potency was markedly improved (6–30 fold), with reduced inhibitory effects on CYP3A4. Improved analogues, such as CAT639, improved beta cell viability and insulin secretion in cytokine‐treated rat insulin‐producing INS1E cells and primary dispersed islet cells. Mechanistically, CAT639 reduced the production of NO by allosterically inhibiting dimerization of inducible NOS (iNOS) without affecting its mRNA levels.
Conclusion and Implications
Taken together, these studies demonstrate a successful phenotypic screening campaign resulting in identification of an inhibitor of iNOS dimerization that protects beta cell viability and function through modulation of mitochondrial stress induced by cytokines.
Abbreviations
- ATF
activating transcription factor
- BiP
binding immunoglobulin protein
- CHOP
C/EBP‐homologous protein
- ER
endoplasmic reticulum
- GSIS
glucose‐stimulated insulin secretion
- HCA
high‐content analysis
- HTRF
Homogeneous Time Resolved Fluorescence
- iNOS
inducible NOS
- RT‐qPCR
real‐time quantitative PCR
- SAR
structure–activity relationship
- sXBP1
spliced X‐box binding protein 1
- UPR
unfolded protein response
Introduction
Type 1 diabetes is ultimately caused by cellular stress, which activates apoptosis (programmed cell death) of beta cells and results in a progressive reduction in beta cell mass and a deficiency in insulin. Pro‐inflammatory cytokines, such as http://www.guidetopharmacology.org/GRAC/LigandDisplayForward?ligandId=4974 and http://www.guidetopharmacology.org/GRAC/LigandDisplayForward?ligandId=4968, induce dysfunction of the mitochondrial membrane potential (Barbu et al., 2002; Papaccio et al., 2005), leading to mitochondrial stress and beta cell death (Gurzov and Eizirik, 2011). Mitochondria play crucial functions in aerobic eukaryotic cells, such as ATP production, cellular differentiation, proliferation and apoptosis (Green and Reed, 1998). During apoptotic signalling, mitochondria release the pro‐apoptotic signal cytochrome C to the cytosol and form an apoptosome complex with apoptotic protease activating factor 1 and pro‐caspase‐9 to induce production of cleaved, activated http://www.guidetopharmacology.org/GRAC/ObjectDisplayForward?objectId=1625 (Apaf‐1; Li et al., 1997; Renatus et al., 2001; Pop et al., 2006), which then activates caspase‐3/7 and triggers apoptosis (Gurzov and Eizirik, 2011).
Current diabetes therapies mostly focus on relieving symptoms, such as insulin replacement, decreasing hepatic glucose production and increasing peripheral glucose uptake. Drugs preventing beta cell apoptosis and preserving beta cell function represent a novel therapeutic approach for type 1 diabetes. Recently, small molecules targeting Na+ or Ca2+ ion channels, http://www.guidetopharmacology.org/GRAC/FamilyDisplayForward?familyId=848s and http://www.guidetopharmacology.org/GRAC/ObjectDisplayForward?objectId=2030, were shown to prevent beta cell apoptosis with variable effects and a high risk of side effects due to broad target inhibition (Yang et al., 2014; Lundh et al., 2013). The http://www.guidetopharmacology.org/GRAC/LigandDisplayForward?ligandId=5878 was found to increase insulin sensitivity in patients with type 1 diabetes in clinical trials (Cavelti‐Weder et al., 2012; Sloan‐Lancaster et al., 2013; Larsen et al., 2007; van Asseldonk et al., 2015; Rissanen et al., 2012). Herein, we describe a high‐content image‐based phenotypic screen and the discovery of a small molecule (ATV399) that inhibits caspase‐9 and caspase‐3/7 activation induced by cytokines in rat cultured insulin‐producing INS1E cells. Medicinal chemistry optimization generated analogues CAT639 and CBD504 with improved potency. Mechanistic studies showed that this series of compounds improve beta cell viability and insulin secretion in rat insulin‐producing INS1E cells and primary rat dispersed islet cells by inhibiting the dimerization of http://www.guidetopharmacology.org/GRAC/ObjectDisplayForward?objectId=1250) and reducing the production of http://www.guidetopharmacology.org/GRAC/LigandDisplayForward?ligandId=2509.
Methods
High throughput screening protocol
Primary screen
Rat insulin‐producing INS1E cells that were maintained in growth medium (RPMI 1640 medium) containing 1× antibiotics, 1× HEPES, 1 mM sodium pyruvate, 1× Glutamax, 1× MEM NEAA, 1 mM β–mecaptoethanol and 10% FBS (Thermo Fisher, Waltham, MA) were detached using trypsin. After the removal of excess trypsin by gentle centrifugation (1000× g for 5 min), the cells were resuspended in growth medium at a density of 250 cells·μL−1; 40 μL of this solution was then dispensed to each well of 384‐well clear bottom plates (Corning Inc., Corning, NY), which were pre‐spotted with 20 nL of compound (5 μM final concentration of 50 μL total volume). The plates were incubated for 24 h in an incubator at 37°C with constant supply of 5% CO2 and 95% humidity. After the incubation period, each well was supplemented with 10 μL of growth medium containing cytokines and glucose (25 ng·mL−1 INF‐γ, 2.5 ng·mL−1 IL‐1β and 33 mM glucose final concentration). Plates were put back into the incubator for an additional 24 h. Cells were then fixed and permeabilized using paraformaldehyde (PFA; 5% final concentration; 10 min) and triton‐X100 (1% final concentration; 10 min) respectively. Medium containing PFA and Triton‐X100 was replaced with blocking buffer that contains 2.5% goat serum (Sigma Aldrich, St. Louis, MO) and 2% BSA (Sigma Aldrich, St. Louis, MO) in PBS. The plates were incubated at room temperature for 30 min, and blocking buffer was then replaced with 25 μL of primary antibody (220× diluted from the manufacturer stock solution) solution that contained 2% BSA in PBS. With gentle shaking, primary antibody was incubated with the cells for 1 h. The cells were washed 2× with 50 μL PBS solution that contained 2% Tween‐20 (PBST). The cells were then incubated with 25 μL of secondary antibody (1000× diluted from the manufacturer's stock solution) solution that contained 1 μg·mL−1 Hoechst 33 342 and 2% BSA in PBS for 1 h. Finally, the cell was washed 2× with 50 μL PBST solution and was stored at 4°C in 50 μL per well PBS until it was imaged using a Cell Insight CX5 high‐content imager (Thermo Fisher, Waltham, MA).
Counter screen
Like the primary screen, compounds were pre‐spotted in 20 nL of DMSO, and rat insulin‐producing INS1E cells (10 000 cells.40 μL‐1 per well of 384‐well white solid bottom plate; Corning) were incubated in an incubator at 37°C with a constant supply of 5% CO2 and 95% humidity for 24 h. After the incubation, the plates were taken out and each well was supplemented with 10 μL of growth medium containing cytokines and glucose (25 ng·mL−1 INF‐γ, 2.5 ng·mL−1 IL‐1β and 33 mM glucose final concentration). Plates were put back into the incubator for an additional 24 h. Quantification of cleaved caspase‐3/7, caspase‐9 and cell viability was done by addition of 5 μL per well of caspase‐3/7 Glo (Promega, Madison, WI), caspase‐9 Glo (Promega, Madison, WI) and Cell Titer‐Glo (Promega, Madison, WI) respectively. The luminescence signal that evolved was read using Envision (0.1 s per well, Perkin‐Elmer).
Insulin secretion assay
Rat insulin‐producing INS1E cells maintained in growth medium were detached using trypsin. After the removal of excess trypsin by gentle centrifugation (1000× g for 5 min), the cells were resuspended in growth medium at a density of 250 cells·μL−1; 40 μL of this solution was then dispensed to each well of 384‐well plates (Corning) that were pre‐spotted with 20 nL of various concentrations of compound. The plates were incubated for 24 h in the incubator at 37°C with a constant supply of 5% CO2 and 95% humidity. After the incubation, the plates were taken out and each well was supplemented with 10 μL of growth medium or 10 μL of growth medium containing cytokines. The plates were put back into the incubator for an additional 24 h. Quantification of secreted insulin in the medium was done by using a Homogeneous Time Resolved Fluorescence (HTRF) Insulin Assay Kit (Cisbio Assay, Bedford, MA) on 2 μL of the medium. Briefly, 8 μL of an antibodies solution containing two monoclonal antibodies that recognize the insulin was added for each 2 μL of the medium. These antibodies were labelled with fluorophores that are FRET pair. The FRET signal was measured using an Envision plate reader with excitation at 320 nm and emission at 665 and 615 nm.
Rat insulin‐producing INS1E cells were plated at a density of 5000 cells per well in 384‐well plates. Cells were pretreated with CAT639 for 4 h, and then cytokines were added for 24 h. Cell viability was tested using a Cell Titer Glo (CTG) assay. The activity of caspase‐9 and caspase‐3/7 was measured with caspase‐9 Glo and caspase‐3/7 Glo assay kit individually.
Mitochondrial membrane potential assay
Mitochondrial membrane potential was evaluated by using JC‐1 dye (Thermo Fisher). The treatment for the cells was the same as previously mentioned. After treatment, cells were suspended in culture medium at a density of 1 × 10⁶ cells·mL−1. Cells were incubated in JC‐1 dye for 20 min. Cells were washed once and resuspended in 200 μL PBS and analysed by flow cytometry. During apoptosis, JC‐1 dye aggregates in the interior of the membrane; a fluorescence emission wavelength will shift from green (~529 nm) to red (~590 nm). A decrease in the ratio of red:green indicates mitochondrial membrane depolarization. Data were analysed by FlowJo software.
Assessment of nitric oxide release
The final breakdown products of NO are nitrite and nitrate. NO production was detected by the sum of nitrite and nitrate levels, measured with a nitrite/nitrate fluorometric assay kit (Cayman Chemical, Chicago, IL). The assay was conducted by following the manufacturer's instructions. Rat insulin‐producing INS1E cells were incubated in DMEM/F12 medium during treatment to prevent nitrite present in RPMI from interfering with the assay procedure.
Islet isolation and cell culture
7–8 weeks old female Sprague Dawley rats with body weight ~250 g, were killed under anaesthesia using carbon dioxide. All animal care and experimental procedures were approved by the Institutional Animal Care and Use Committee (IACUC) of California Institute for Biomedical Research (Calibr) and strictly followed the NIH guidelines for humane treatment of animals. Pancreases were removed after perfusing 1 mg·mL−1 collagenase P (Sigma‐Aldrich, St. Louis, MO) in HBSS. Pancreases were incubated in a 37°C water bath for 10 min, vortexed for 5 s and incubated in water bath for another 1–2 min. The collagenase digestion was terminated by adding HBSS with 10% FBS. Islets were pelleted by centrifuging at 200× g for 1 min and washed in HBSS, three times. Histopaque‐1077 was used to purify islets derived from acinar cells. Islets were re‐suspended in 10 mL histopaque‐1077, and 10 mL HBSS was slowly layered on the top. After centrifugation at 1350× g for 5 min without a break, islets were collected from the interface. Islets were cultured in RPMI1640 supplemented with 10% FBS and 1% antibiotic/antimycotic (Thermo‐Fisher, Waltham, MA) and 5.5 mM glucose. Islets were trypsinized with 0.05% trypsin for 5–7 min and strongly pipetted several times. After neutralization of the trypsin by adding RPMI 1640 with 10% FBS and filtration through a 70 μm cell strainer, the dispersed islet cells were pelleted by centrifuging for 5 min at 1500× g. After an overnight recovery period, 5000 cells per well were plated in 384‐well plates for the cell viability assay and in 96‐well v‐bottom plates for the insulin stimulation [glucose‐stimulated insulin secretion (GSIS)] assay. For GSIS, cells were pre‐incubated in 2.8 mM glucose for 1 h; the concentration was then changed to 2.8 or 20 mM glucose for 1 h. The medium was then collected for measuring insulin levels using the HTRF insulin assay.
Low‐temperature SDS‐PAGE
Dimerization of iNOS was separated by using low‐temperature SDS‐PAGE. Rat insulin‐producing INS1E cells were seeded at a density of 3 × 10⁶ cells per well in six‐well plates. After pretreatment with different concentrations of CAT639 for 4 h, cells were treated with 10 ng·mL−1 IL‐1β for 24 h. Then cells were lysed on ice with cell lysis buffer (Cell Signaling, Danvers, MA) and sonicated for 5 s. The supernatant was cleared by centrifugation at 4°C and 16 000× g. Protein samples were prepared with LDS non‐reducing sample buffer without heating. SDS‐PAGE was run on ice at constant 125 mA for 5 h with pre‐cooled NuPAGE SDS running buffer. Proteins were transferred by wet transfer at constant 70 mA for 2.5 h. The following Western blot steps were done as usual.
Protein and mRNA analyses
Rat insulin‐producing INS1E cells were harvested at different time points after treatment and lysed in RIPA buffer. All of antibodies were used at 1:1000 dilution. Primary antibodies were incubated overnight, and secondary antibodies were incubated for 1 h. The image was scanned by LI‐COR Odyssey. RNA was extracted by Trizol and reverse transcribed into cDNA by using a Super Script II Reverse Transcriptase Kit (Invitrogen Inc., Carlsbad, CA). Gene expression was quantified using RT‐PCR and normalized against GAPDH. Primer sequences are shown in Supporting Information Table S3.
Data analysis
Data are represented as mean ± SD. Student's t‐test and one‐way ANOVA were used for statistical analysis, and P < 0.05 was considered as significant difference. The data and statistical analysis comply with the recommendations on experimental design and analysis in pharmacology (Curtis et al., 2018).
Materials
Antibodies against C/EBP‐homologous protein (CHOP), cleaved caspase‐3, caspase‐3, Phospho‐stress‐activated protein kinase (SAPK)/JNK, SAPK/JNK, Phospho‐p38 MAPK (Thr180/Tyr182), p38 MAPK and β‐actin were purchased from Cell Signaling (Boston, MA). Cell lysate buffer was obtained from Cell Signaling (Boston, MA). Antibody against iNOS was purchased from Abcam (Boston, MA). Pierce LDS Sample Buffer, Non‐reducing (4×), was purchased from Thermo Fisher (Dallas, TX). The NO assay kit was obtained from Cayman Chemical (Chicago, IL).
Nomenclature of targets and ligands
Key protein targets and ligands in this article are hyperlinked to corresponding entries in http://www.guidetopharmacology.org, the common portal for data from the IUPHAR/BPS Guide to PHARMACOLOGY (Harding et al., 2018), and are permanently archived in the Concise Guide to PHARMACOLOGY 2017/18 (Alexander et al., 2017a, 2017b, 2017c, 2017d).
Results
High‐content image‐based phenotypic screen identified ATV399 as a putative mitochondrial stress inhibitor
Recent advances in automated image analysis provide robust tools that enable the integration of high‐content analysis (HCA) of phenotypic endpoints toward high throughput screening identification of drug candidates (Philip et al., 2008). HCA allows for multi‐parametric data collection such that two or more targets can be recorded simultaneously (DeBiasio et al., 1987; Giuliano et al., 1997; Korn and Krausz, 2007). To this end, we developed an HCA‐based phenotypic assay to identify small molecules that inhibit mitochondrial stress‐induced apoptosis by monitoring cell number and cleaved caspase‐9 levels as indicators of viability and health in the presence of cellular stress. Specifically, rat insulin‐producing INS1E cells were treated with DMSO or compounds for 24 h, followed by a combination of cytokines (2.5 ng·mL−1 of IL‐1β and 25 ng·mL−1 IFN‐γ) and high glucose (33 mM) for 24 h. This diabetogenic cocktail induces cleaved caspase‐9 levels greater than threefold over neutral control (DMSO), with a robust Z factor (Z' ~ 0.71) (Figure 1B, C). We initially screened ~88 000 compounds, including compounds with known mechanism of action [such as the Library of Pharmacologically Active Compounds (LOPAC) from Sigma Aldrich] and compounds with an unknown mechanism of action from commercial vendors. Compounds inhibiting cytokine‐induced caspase‐9 activation by at least 50% were considered as hits (hit rate ~ 0.1%). Hit compounds were counter‐screened using luminescent caspase‐3/7 Glo, caspase‐9 Glo and CTG assays to ensure the authenticity of the hits and removal of cytotoxic compounds.
Figure 1.
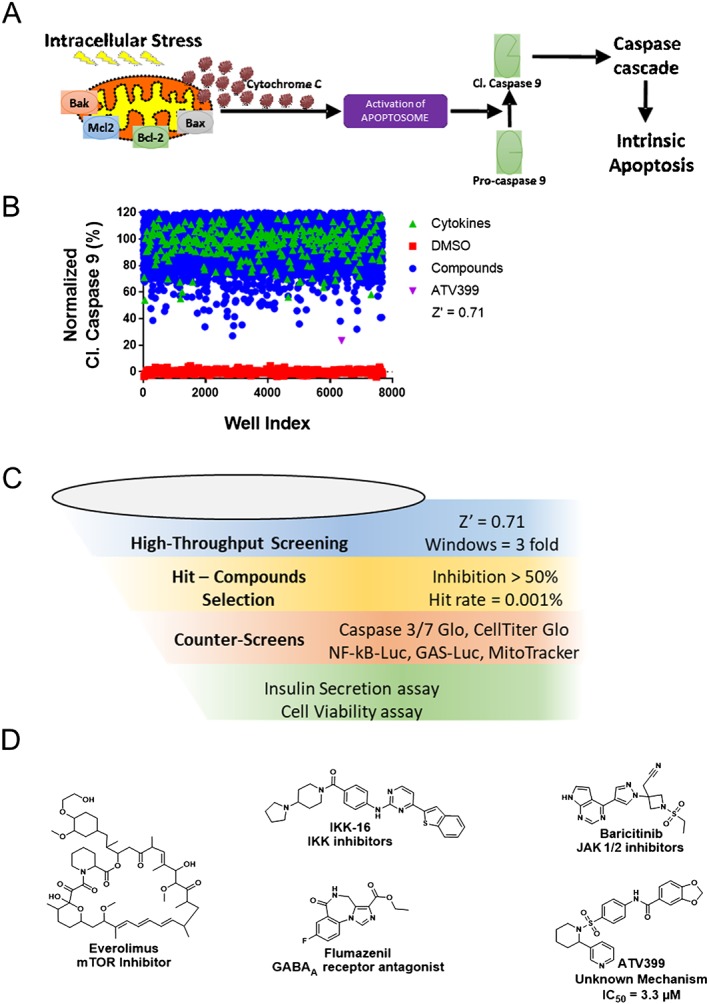
High throughput screening for small molecule inhibitors of mitochondrial apoptosis. (A) A schematic description of the intrinsic (mitochondrial) pathway of apoptosis. Cytokines induce intracellular stress and ultimately apoptosis. A high‐content image‐based phenotypic assay was designed to identify small molecules that protect beta cells from cytokine‐induced activation of mitochondrial apoptosis by monitoring cleaved caspase‐9 levels. (B) Representative screening set‐up from a subset of Life Chemicals Library (30 000 compounds), which identified the hit ATV399. Rat insulin‐producing INS1E cells were pretreated with compounds for 24 h. Cytokines (2.5 ng·mL−1 IL‐1β and 100 ng·mL−1 IFNγ) were then supplemented in the presence of high glucose (33 mM) to induce intracellular stress and activate cleaved caspase‐9. Compounds reducing cleaved caspase‐9 levels by >50% in the presence of cytokines were considered as hits. Z' > 0.7 was calculated based on DMSO versus cytokine‐treated wells, indicating that the assay was robust and suitable for high throughput screening. ATV399 was identified as one of the most potent hit compounds. (C) Schematic workflow of the high‐throughput screen. (D) Chemical structures of the selected hit compounds. Everolimus, IKK‐16, baricitinib and flumazenil were identified as hit compounds with known mechanisms of action.
Certain compounds with a known mechanism of action, such as http://www.guidetopharmacology.org/GRAC/FamilyIntroductionForward?familyId=578 (IKK)‐16, http://www.guidetopharmacology.org/GRAC/LigandDisplayForward?ligandId=7792 and http://www.guidetopharmacology.org/GRAC/LigandDisplayForward?ligandId=4192, were identified (Figure 1D). For example, IKK‐16 and baricitinib are known inhibitors of IKK and http://www.guidetopharmacology.org/GRAC/FamilyDisplayForward?familyId=581, respectively, which block signal transduction induced by cytokines, thereby reducing cleaved caspase‐9 levels and improving cell viability (Marrero et al., 2006; Waelchli et al., 2006; Reilly et al., 2013; Negi and Sharma, 2015). In addition to validating the screening assay, the observation that flumazenil can attenuate activation of caspase‐9 is interesting and suggests this http://www.guidetopharmacology.org/GRAC/FamilyDisplayForward?familyId=72 antagonist may have alternative applications. Importantly, ATV399 emerged as one of the most potent hit compounds from the Life Chemicals Library screen, representing a novel small molecule with an unknown mechanism of action that could be further investigated as a potential drug candidate.
ATV399 improved beta cell survival and function impaired by cytokine stress
In hit validation studies, ATV399 was shown to dose‐dependently inhibit caspase‐9 activation (IC50 = 3.3 μM; Figure 2A). Phenotypically, ATV399 also improved beta cell survival, as determined by the CTG assay that measures intracellular ATP content as a surrogate for cell viability. Addition of a pro‐inflammatory cytokine cocktail reduced cell viability approximately 60% in rat insulin‐producing INS1E cells, while pretreatment with ATV399 for 24 h fully prevented this reduction in viability (Figure 2A). To test whether ATV399 attenuates loss of beta cell function in the presence of cytokines, an HTRF assay (Cisbio; Bedford) that quantitatively measures the level of secreted insulin in culture medium was employed. Although cytokines markedly inhibited insulin secretion (from 480 to 320 ng·mL−1), pretreatment with ATV399 at 5 μM fully protected insulin levels (Figure 2A), indicating that ATV399 can prevent the impairment of insulin secretion induced by cytokines.
Figure 2.
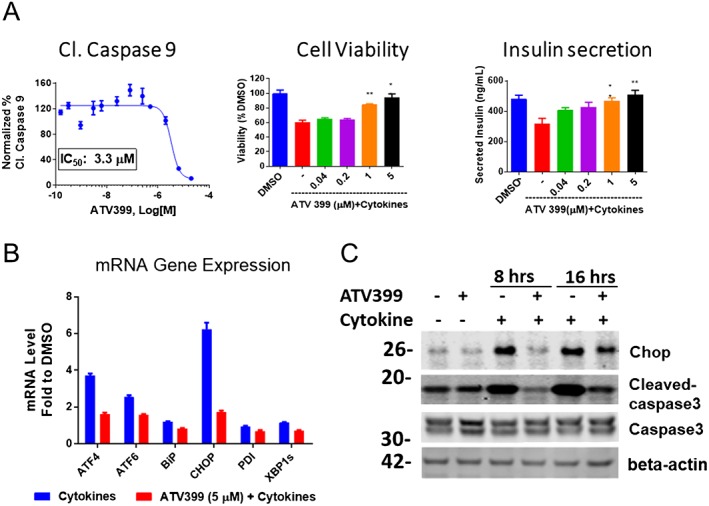
ATV399 protected rat insulin‐producing INS1E cells in vitro from cytokine stress. (A) Phenotypic activities of ATV399. Left, dose‐response reduction in cleaved caspase‐9 levels as determined from the screening assay. Middle, dose‐response reduction in viability of of rat insulin‐producing INS1E cells, as measured by CTG assay (n = 6). Right, dose‐response attenuation of the cytokine‐induced inhibition of insulin secretion in culture medium as determined by HTRF assay (n = 6). Rat insulin‐producing INS1E cells were pretreated with compounds for 24 h, followed by co‐treatment with pro‐inflammatory cytokines (10 ng·mL−1 IL‐1β, 100 ng·mL−1 IFNγ) for an additional 24 h and analysed accordingly. (B) ATV399 attenuated ER stress‐related genes induced by pro‐inflammatory cytokines (n = 3). (C) ATV399 reduced downstream apoptotic proteins, such as CHOP and cleaved caspase‐3, which were induced by cytokines. In both (B) and (C), cells were pretreated with compounds for 8 h, followed by co‐treatment with cytokines (10 ng·mL−1 IL‐1β, 100 ng·mL−1 IFNγ) for an additional 8 h and gene expression, and protein levels were analysed by qPCR and Western blot respectively. Data are presented as mean ± SD. **P < 0.05.
In addition to causing mitochondrial stress, cytokines are also known to induce apoptosis by triggering the unfolded protein response (UPR) and subsequent endoplasmic reticulum (ER) stress (Cardozo et al., 2005; Chan et al., 2011). The UPR is initially activated to restore ER homeostasis, while sustained UPR activation and unresolved ER stress can trigger apoptosis (Laybutt et al., 2007; Eizirik et al., 2008; Hotamisligil, 2010). We assessed the ability of ATV399 to modulate ER stress by monitoring ER stress‐related gene and protein expression levels using real‐time quantitative PCR (RT‐qPCR) and Western blotting respectively. Treatment with 5 μM ATV399 in the presence of cytokines significantly reduced expression levels of activating transcription factor 4 (ATF4), ATF6, binding immunoglobulin protein (BiP), CHOP, protein disulfide isomerase and spliced X‐box binding protein 1 (sXBP1) (Figure 2B). We observed an enhanced expression of these genes upon treatment with cytokines that is markedly reduced with ATV399 treatment. Hence, the anti‐apoptotic effects of ATV399 were confirmed at the protein level, with CHOP and cleaved caspase‐3, two major pro‐apoptotic proteins, up‐regulated upon treatment with cytokines after 8 or 16 h and dramatically decreased by ATV399 treatment (Figure 2C).
Medicinal chemistry optimization led to analogues with improved potency
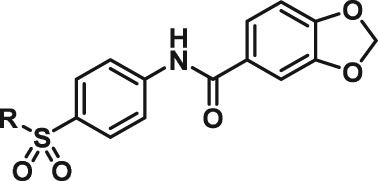
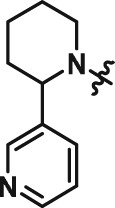
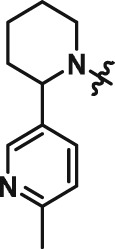
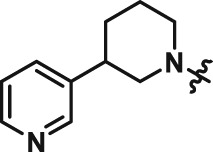
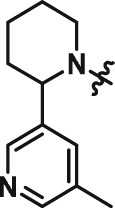
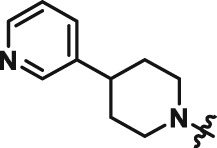
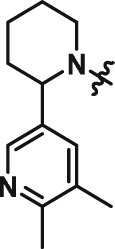
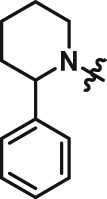
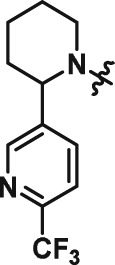
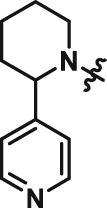
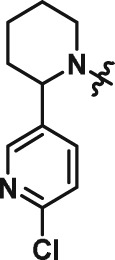
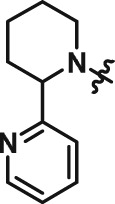
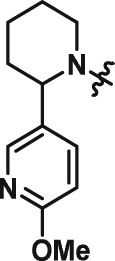
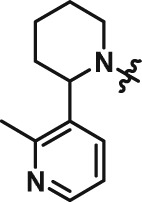
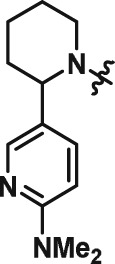
The interesting beta cell protection phenotype induced by ATV399 prompted us to explore structural analogues to establish a structure–activity relationship (SAR). The activity of initial ATV399 analogues from the inventory led us to the pyridinylpiperidine portion of the molecule for a focused SAR effort. Of the six active compounds, all but one contained this pyridinylpiperidine functionality, while most analogues lacking this moiety displayed modest or no activity. Additionally, because many types of substitution were tolerated at the benzamide portion of the molecule, we decided to focus on the pyridinylpiperidine to both identify what was important for activity and try to increase potency. After determining that the sulfonamide was needed for activity, we discovered that, as in our initial hit ATV399, the 3‐pyridine moiety was needed adjacent to the nitrogen of the pyrimidine (Table 1, Entries 1–6). Other heterocycles were investigated but were not tolerated. When investigating substitution of the pyridine ring, it was discovered that mono‐substitution ortho to the nitrogen was preferred (Table 1, Entries 7–10), leading to compound CAT639 (Entry 8), which robustly inhibited caspase‐9 activity at sub‐micromolar levels (IC50 = 0.48 μM) (Table 1). From initial ADME studies, we also knew that ATV399 exhibited potent inhibition of http://www.guidetopharmacology.org/GRAC/ObjectDisplayForward?objectId=1337, which is a key liability for drug development. This potent inhibition was partially alleviated with the introduction of the ortho‐methyl group of CAT639. The potency of analogues emerging from further SAR studies were tracked with the electronic properties of the substituents on the pyridine ring, with electron‐withdrawing substituents being preferred (Table 1, Entries 11–14). Substitution of the methyl group for a trifluoromethyl group led to CBD504 (Entry 11) with further increased potency (IC50 = 0.098 μM). The lead compound CBD504 also has an improved CYP profile compared to the ATV399 and CAT639 (Supporting Information Table S1). Next, we evaluated the potential in vivo application of mCBD504 in mouse pharmacokinetics studies, and oral dosing of 50 mg·kg−1 mCBD504 (n = 3), formulated as 10 mg·mL−1 clear solution in 75%PEG300/25%D5W, showed a reasonable half‐life (t1/2 = 10 h), although with a relatively low exposure (Cmax = 141 ng·mL−1) (Supporting Information Figure S6), which is not sufficient to support in vivo efficacy studies. Further medicinal chemistry optimization is required to improve its exposure and potency.
Table 1.
SAR of ATV399 led to compounds with increased potency
|
| |||||||
|---|---|---|---|---|---|---|---|
| Entry | Compound | Structure | EC50 (μM) | Entry | Compound | Structure | EC50 (μM) |
| 1 | ATV399 |
|
2.90 | 8 | CAT639 |
|
0.48 |
| 2 | CAT628 |
|
>20 | 9 | CAT636 |
|
3.10 |
| 3 | CAT640 |
|
>20 | 10 | CBD498 |
|
1.2 |
| 4 | CAT635 |
|
8.75 | 11 | CBD504 |
|
0.098 |
| 5 | CAT648 |
|
9.54 | 12 | CBD505 |
|
0.12 |
| 6 | CAT646 |
|
>20 | 13 | CBD501 |
|
0.91 |
| 7 | CAT634 |
|
>20 | 14 | CBE173 |
|
8.8 |
Rat insulin‐producing INS1E cells were pretreated with compounds at different doses (n = 6) for 24 h, followed by co‐treatment with pro‐inflammatory cytokines (10 ng·mL−1 IL‐1β and 100 ng·mL−1 IFNγ) for an additional 24 h. Then cleaved caspase‐9 levels were determined using caspase‐9 Glo, and the luminescence signal evolved was read and used to calculate EC50 values.
CAT639 protected primary rat islet survival and function impaired by cytokines
Consistent with ATV399, CAT639 dose‐dependently protected against the loss of cell viability and impaired insulin secretion induced by cytokines (Supporting Information Figure S1A, B). We next examined the expression levels of ER relevant genes by qRT‐PCR. Again, ER stress sensor genes (ATF4, ATF3, ATF6, BiP, CHOP and sXBP1) were down‐regulated by CAT639 in the presence of cytokines (Supporting Information Figure S1C). Effects of CAT639 on phenotypic activity and gene expression followed the same trend as ATV399, supporting the notion that CAT639 and ATV399 are likely to work via the same molecular mechanism. Furthermore, we also applied CAT639 6 h after cytokine treatment and found that post‐treatment of CAT639 also partially rescued beta cell viability and function impaired by cytokine‐induced ER stress, suggesting that CAT639 may have a therapeutic effect in addition to its prophylactic effect (Figure 3A, B).
Figure 3.
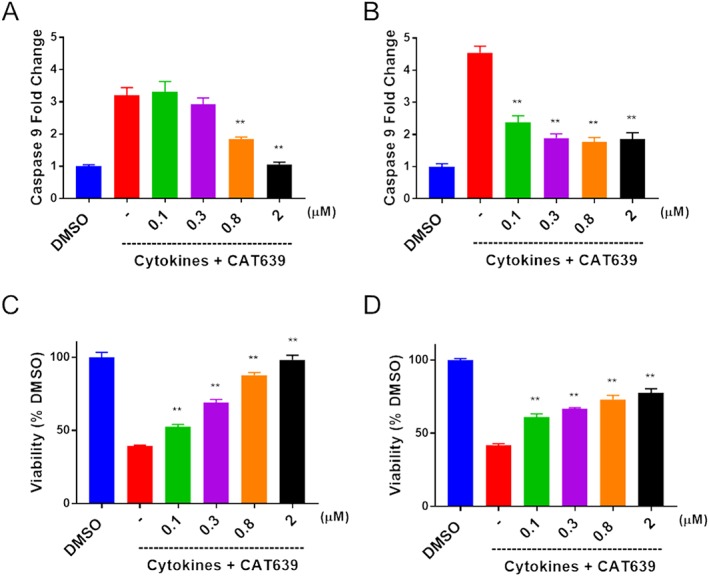
Pre‐ and post‐treatment with CAT639 protect INS1E beta cells. (A, C) Pretreatment with CAT639 for 6 h decreased caspase‐9 activity induced by cytokines (upper panels) and attenuated the impaired cell viability induced by cytokines (bottom panels). INS1E beta cells were pretreated with compounds for 6 h, followed by co‐treatment with cytokines (10 ng·mL−1 IL‐1β and 100 ng·mL−1 IFNγ) for an additional 24 h, and caspase‐9 and cell viability were measured by caspase Glo‐9 or CTG, according to the manufacturer's instructions (n = 6). (B, D) Post‐treatment of CAT639 6 h after cytokine treatment also partially decreased caspase‐9 activity induced by cytokines (upper panels) and restored cell viability impaired by cytokines (bottom panels). INS1E beta cells were plated overnight and treated with cytokines (10 ng·mL−1 IL‐1β and 100 ng·mL−1 IFNγ) for 6 h followed by compound treatment for 24 h, and caspase‐9 and cell viability were measured by caspase Glo‐9 or CTG, according to the manufacturer's manual (n = 6). Data are presented as mean ± SD. **P < 0.05.
Given the improved potency of CAT639 in protecting rat insulin‐producing INS1E cell viability and function in the presence of stressors, we investigated the effect of CAT639 on dispersed rat primary islet cells. A combination of cytokines (5 ng·mL−1 IL‐1β and 100 ng·mL−1 IFN‐γ) induced cellular stress and apoptosis, reducing cell viability to 47% in dispersed primary rat islet cells. Importantly, CAT639 treatment mitigated the effects of the cytokines, with cell viability increased to 60% at 0.6 μM and 78% at 10 μM (Figure 4A). In addition, we measured the effect of CAT639 on GSIS in dispersed primary rat islets. Cytokines dramatically inhibited insulin secretion at both 2.8 mM (threefold) and 20 mM glucose, which was prevented by pretreating with CAT639 in a dose‐dependent manner (Figure 4B).
Figure 4.
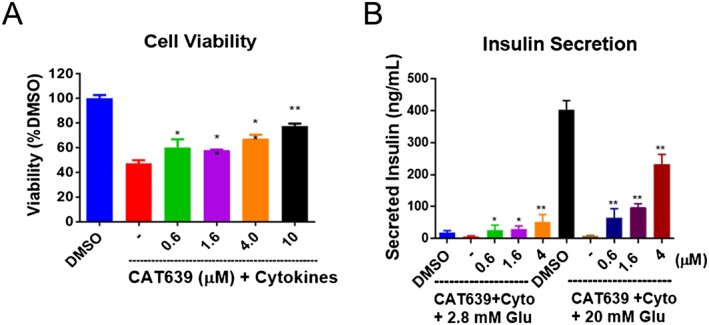
CAT639 protected dispersed rat primary islets cells from pro‐inflammatory cytokine stress. (A) CAT639 prevented cell apoptosis and (B) the attenuated the decrease in insulin secretion in the presence of cytokine stress (n = 6). Dissociated rat primary islets (5000 cells per well) were seeded in 96‐well plates and treated with a cocktail of pro‐inflammatory cytokines. The concentrations of cytokines for the cell viability assay were 5 ng·mL−1 IL‐1β and 100 ng·mL−1 IFN‐γ, and the concentrations of cytokines for insulin secretion were 0.3 ng·mL−1 IL‐1 and 25 ng·mL−1 IFN‐γ. For the GSIS assay, cells were pre‐incubated in 2.8 mM glucose for 1 h then incubated in 2.8 mM/20 mM glucose for 1 h. Secreted insulin in the medium was measured by elisa. Data are presented as mean ± SD. **P < 0.05.
Mechanism of action of ATV399 and its analogues
Since several kinase inhibitors are reported to inhibit mitochondrial stress, we profiled the hit compound ATV399 in a panel of 50 representative serine/threonine and tyrosine kinases (Supporting Information Table S2). ATV399 did not inhibit any kinase targets at 10 μM, suggesting that kinase inhibition was unlikely to be the primary mechanism of action.
Interestingly, the http://www.guidetopharmacology.org/GRAC/FamilyDisplayForward?familyId=738 of enzymes has recently been shown to be present within the cell in the cytoplasmic compartments as well as in the mitochondria (Klein and Bischoff, 2011). MMPs are typically involved in the degradation of proteins in the extracellular matrix, but they were reported to induce apoptosis by impairing the mitochondrial membrane potential upon activation within the cell (Kowluru et al., 2011; Mohammad and Kowluru, 2011). For this reason, we assessed gene expression levels of several MMPs (http://www.guidetopharmacology.org/GRAC/ObjectDisplayForward?objectId=1628, http://www.guidetopharmacology.org/GRAC/ObjectDisplayForward?objectId=1629 and http://www.guidetopharmacology.org/GRAC/ObjectDisplayForward?objectId=1633) and pro‐apoptotic genes such as http://www.guidetopharmacology.org/GRAC/LigandDisplayForward?ligandId=5152, programmed cell death protein 5 (dp5), http://www.guidetopharmacology.org/GRAC/ObjectDisplayForward?objectId=2847#OtherNames (myeloid cell leukaemia 1) and http://www.guidetopharmacology.org/GRAC/FamilyDisplayForward?familyId=910 (NADPH oxidase activator). CAT639 markedly down‐regulated these genes in the presence of cytokines (Figure 5B, C). This suggests that CAT639 is involved in the mitochondrial signalling pathway.
Figure 5.
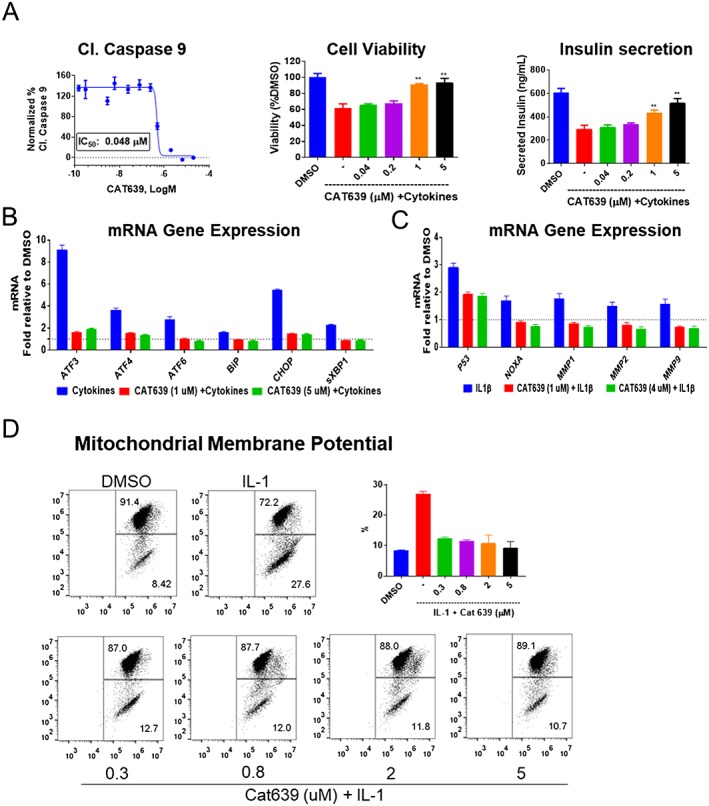
Effect of CAT639 on rat insulin‐producing INS1E cells treated with pro‐inflammatory cytokines. (A) CAT639 decreased caspase‐9 activity induced by IL‐1 alone and increased cell viability and insulin secretion impaired by pro‐inflammatory cytokines (n = 6). (B, C) qRT‐PCR analysis of gene expression of rat insulin‐producing INS1E cells. Cells were pretreated with CAT639 for 8 h prior to the addition of cytokines for 8 h (n = 3). (D) CAT639 decreased the percentage of cells exhibiting loss of mitochondrial membrane potential. Cells were pretreated with CAT639 for 4 h prior to the addition of cytokines (10 ng·mL−1 IL‐1) for 24 h (n = 3). JC1 was used as an indicator of mitochondrial membrane potential and analysed by FACS. Data are presented as mean ± SD. **P < 0.05.
To further elucidate the mechanism of action of CAT639, we treated rat insulin‐producing INS1E cells with individual cytokines. IL‐1β alone could decrease rat insulin‐producing INS1E cell viability and increase caspase‐9 activity (Figure 5A), while IFN‐γ could not (data not shown). Interestingly, CAT639 fully rescued these effects of IL‐1β on rat insulin‐producing INS1E cells (Figure 5A), suggesting the mechanism of action involves downstream effectors of IL‐1β.
Next, we investigated the ability of CAT639 to protect the mitochondria using JC‐1, a commonly used dye that provides a readout of mitochondrial membrane potential (Δψm) (Liu et al., 2007; De Proost et al., 2008). CAT639 potently reversed IL‐1β‐induced mitochondrial membrane depolarization (Figure 5D). Specifically, IL‐1β increased apoptotic cells from 8.4 to 27.6%. CAT639 markedly reduced the percentage of apoptotic cells to 10% at 5 μM.
Two major canonical pathways of IL‐1β are NF‐κB signalling (Heimberg et al., 2001; Eldor et al., 2006) and the JNK/p38MAPK pathways (Lin et al., 2005). To evaluate the potential impact of CAT639 on these pathways, we used the NF‐κB luciferase reporter gene‐based assay to assess the NF‐κB signalling pathway. Results showed that CAT639 did not reduce the NF‐κB‐Luc signal induced by IL‐1β (Supporting Information Figure S2A). In addition, CAT639 had no effect on the phosphorylation of JNK, and only modestly attenuated the phosphorylation of p38 MAPK induced by IL‐1β (Supporting Information Figure S2B). Cytokines induce ER stress in pancreatic beta cells by down‐regulation of the http://www.guidetopharmacology.org/GRAC/FamilyDisplayForward?familyId=159) and depleting Ca2+ from the ER (Oyadomari et al., 2001). http://www.guidetopharmacology.org/GRAC/LigandDisplayForward?ligandId=5351), a potent inducer of ER stress, specifically binds to SERCA and inhibits its function (Xu et al., 2004). CAT639 protected the cells from death, insulin secretion and expression of ER stress genes induced by the cytokines but not the ER stress induced by TG, suggesting that CAT639 may target a process upstream of the SERCA (Supporting Information Figure S5).
In many pro‐inflammatory contexts, activation of NF‐κB (Xie et al., 1994) leads to the production of NO, which is generated from L‐arginine by NOS. In beta cells, iNOS is the predominant source of NO (Eizirik et al., 1992) and most dynamic in terms of response to cellular stress and has been shown to be a factor in models of type 1 diabetes and acute pancreatitis (Qader et al., 2003; Torres et al., 2004; Fujimoto et al., 2005; Muhammed et al., 2012). Indeed, large amounts of NO generated by iNOS play a major role in IL‐1β‐mediated rat beta cell apoptosis (Welsh et al., 1991; Shimabukuro et al., 1997). Thus, we examined the iNOS mRNA expression levels using qRT‐PCR assay. IL‐1β induced a 36 000‐fold increase in iNOS at mRNA levels as compared to DMSO treatment. CAT639 only mildly reduced the iNOS mRNA levels (Figure 6A). However, CAT639 markedly blocked NO production that was induced by either IL‐1β alone or IL‐1β and IFN‐γ (Figure 6B). To assess whether the ability of CAT639 to protect rat insulin‐producing INS1E cells from apoptosis was dependent on NO, we used an NO donor, (±)‐S‐nitroso‐N‐acetylpenicillamine (SNAP). SNAP reduced INS1E cell viability; however, CAT639 treatment did not improve cell viability. Similarly, CAT639 treatment did not inhibit caspase‐9 activity induced by SNAP (Figure 6C). These results suggest that CAT639 may be directly inhibiting iNOS, downstream of iNOS mRNA induction but upstream of a chemical NO donor, such as SNAP.
Figure 6.
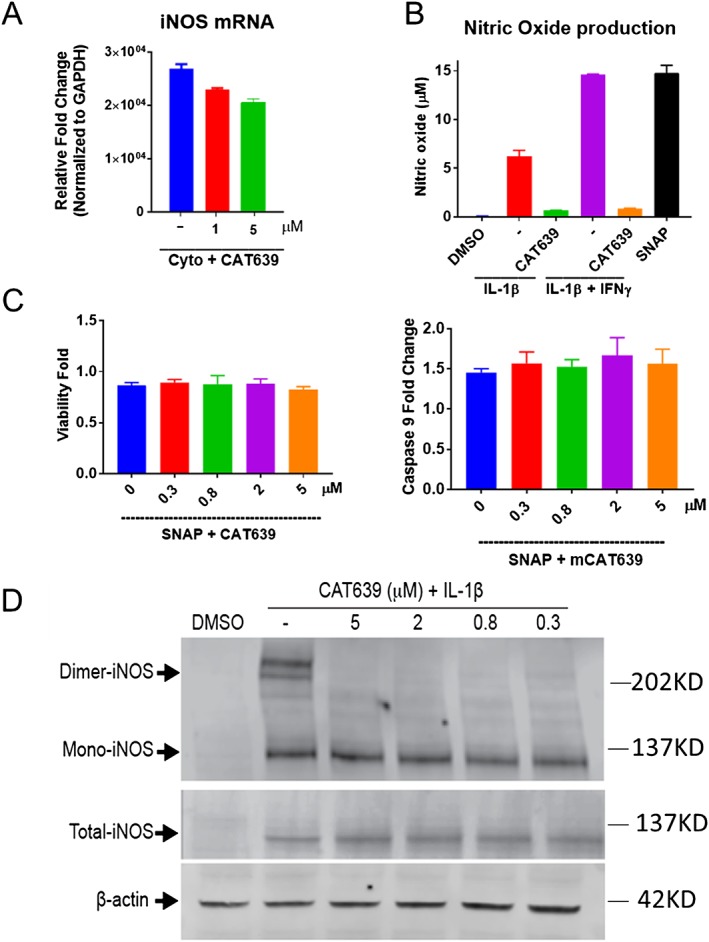
CAT639 inhibited dimerization of iNOS. (A) CAT639 slightly inhibited iNOS mRNA expression (n = 3). (B) CAT639 inhibited NO production induced by IL‐1 alone or IL‐1β + IFN‐γ. NO was measured using a nitrate/nitrite colorimetric assay kit (n = 3). (C) CAT639 had no effect on apoptosis induced by SNAP (n = 3). (D) CAT639 destabilized iNOS dimer in rat insulin‐producing INS1E cells. Dimeric proteins were determined by performing low‐temperature SDS‐PAGE. Samples lysed in sample buffer with β‐ME and boiled for 5 min were used as a positive control of total iNOS. Data are presented as mean ± SD.
NO production depends on iNOS expression and activity. We first examined the effect of CAT639 on total iNOS protein. The Western blot results show that iNOS was barely detected under normal physiological conditions and significantly increased after treatment with cytokines. However, CAT639 did not block the cytokine‐induced production of iNOS protein expression (Figure 6D). Interestingly, iNOS only generates NO when the enzyme forms a homodimer (Baek et al., 1993; Li and Poulos, 2005; Daff, 2010). Therefore, we studied the effect of CAT639 on iNOS dimerization.
To do this, we detected the dimer and monomer of iNOS by low‐temperature SDS‐PAGE immunoblots. Indeed, a clear band of dimeric iNOS was detected when rat insulin‐producing INS1E cells were treated with IL‐1β, while a reduction in dimeric enzyme was observed in cells co‐treated with CAT639 (Figure 6D). These data support the notion that CAT639 may down‐regulate NO production by inhibiting iNOS dimerization. Similar to CAT639, other iNOS inhibitors, like http://www.guidetopharmacology.org/GRAC/LigandDisplayForward?ligandId=5102, also protected beta cell viability and function from stress induced by cytokines (Supporting Information Figure S3).
Discussion
Mitochondrial stress and beta cell death, induced by pro‐inflammatory cytokines, plays a key role in type 1 diabetes. Through a high‐content image‐based screening campaign, we have identified a novel small molecule that inhibits cleaved caspase‐9 activation and subsequent beta cell apoptosis induced by diabetogenic media (a combination of IL‐1β, IFN‐γ and high glucose), potentially through inhibition of iNOS, by disrupting of its dimerization. Inhibition of iNOS by small molecules or in vitro knockdown of iNOS is known to improve beta cell viability and glucose‐stimulated insulin secretion (Bai‐Feng et al., 2010; Hynes et al., 2011; Muhammed et al., 2012). Moreover, iNOS inhibitors have been shown to attenuate fasting hyperglycaemia and fasting hyperinsulinaemia and significantly improve insulin sensitivity in diabetic mice (Sugita et al., 2005; Bai‐Feng et al., 2010). There are three major types of NOS inhibitors described to date: (i) inhibitors that mimic the substrate arginine (Víteček et al., 2012); (ii) inhibitors that mimic the cofactor 6R‐5,6,7,8‐tetrahydrobiopterin (BH4) and inhibit NOS enzymatic activity by interfering with the electron transfer and preventing the formation and release of NO at the catalytic centre of NOS (Klatt et al., 1995; Wei et al., 2008; Daff, 2010); and (iii) inhibitors of enzyme activation by targeting the phosphorylation and dimerization of iNOS (Pan et al., 1996; Sennequier et al., 1999; Symons et al., 2011). Our data suggest that the compounds ATV399, CAT639 and CBD504 inhibit the activation of iNOS by preventing iNOS dimerization and reducing NO production. Assessment of the expression levels of ER and mitochondrial stress‐related genes revealed that ATV399 and CAT639 could prevent the detrimental effects induced by cytokines. However, the mRNA expression levels of iNOS were only moderately modulated by the compounds. In conjunction, the production of NO was inhibited with 5 μM treatment in the presence of cytokines. It has been reported that allosteric inhibitors of iNOS and small molecule inhibitors bind to the iNOS‐haem cofactor and form an irreversible complex with the monomer iNOS, which prevents it from being converted to dimeric iNOS (McMillan et al., 2000; Nagpal et al., 2013). Low temperature SDS‐PAGE clearly indicated that CAT639 and analogues inhibit the formation of dimeric iNOS; however, the exact mode of binding of CAT639 to iNOS monomer and dimer requires further detailed biochemical and structural investigations.
Altogether, our data demonstrate a successful high‐content image‐based screen, which was aimed at identifying inhibitors of cleaved caspase‐9 activation, and using this screen, we identified compounds that are capable of inhibiting the dimerization of iNOS. Although the series of compounds potently protect rat insulin‐producing INS1E cells and primary dispersed islet cells from cytokine‐induced cell death and reduction in insulin secretion, we were not able to see a similar level of protection in human primary islets or beta cells, which is consistent with the observation that changes in NO production are not required for the suppression of human islet function induced by cytokines (Eizirik et al., 1994). Unfortunately, this limits the translatability of this discovery into human type 1 diabetes as this dominant signalling pathway in rodent beta cells turned out to be not crucial for human beta cells. Nevertheless, iNOS dimerization inhibitors have the potential to treat a number of other diseases. For example, iNOS dimerization inhibitors such as BBS‐4, KLYP961 and PPA250 have been studied for treatment of diseases associated with inflammatory and neuropathic pain (Ohtsuka et al., 2002; Davey et al., 2007; Symons et al., 2011). Furthermore, there are three isoforms of NOS, neuronal NOS (nNOS), iNOS and endothelial NOS (eNOS) (Förstermann and Sessa, 2012), and they all activate through homodimerization. To test whether CAT639 has similar effect on eNOS and nNOS, we induced nNOS dimerization in SH‐SY5Y neuronal cell lines with LPS and cytokine and eNOS dimerization with VEGF in pulmonary artery endothelial cells, and interestingly, from the Western blot assay, CAT639 also inhibited nNOS and eNOS dimerization (Supporting Information Figure S4). Thus, further evaluation of the effects of CAT639 and its analogues, their in vivo safety and their potential application for rheumatoid arthritis, neuroinflammatory and neurodegenerative diseases is warranted.
Author contributions
L.Z., T.T., M.T.T. and W.S. conceived the study; L.Z., T.T., S.J.L., T.D.B. and A.H. carried out the methodology; L.Z., T.T., A.T., S.L., S.Y. and F.A.G. did the investigation; L.Z. and T.T. wrote the original draft; L.Z., J.R., N.R., M.T.T. and W.S wrote, reviewed and edited the final draft; P.G.S., M.T.T. and W.S. acquired the funding; D.L.E., A.K.C., P.G.S, M.T.T. and W.S supervised the experiments.
Conflict of interest
The authors declare no conflicts of interest.
Declaration of transparency and scientific rigour
This http://onlinelibrary.wiley.com/doi/10.1111/bph.13405/abstract acknowledges that this paper adheres to the principles for transparent reporting and scientific rigour of preclinical research recommended by funding agencies, publishers and other organisations engaged with supporting research.
Supporting information
Figure S1 CAT639 had protective effects on INS‐1e cells. A) and B) CAT639 rescued cell viability and insulin secretion damaged by cytokines. Cells were pretreated with compounds for 24 h and followed co‐treatment with cytokines (10 ng·mL−1 IL‐1β, 100 ng·mL−1 IFNγ) for additional 24 h. C) CAT639 recovered cytokine‐induced up‐regulation of ER stress gene expression. Cells were pretreated with compounds for 8 h and followed co‐treatment with cytokines (10 ng·mL−1 IL‐1β, 100 ng·mL−1 IFNγ) for additional 8 h.
Figure S2 CAT639's effect on NF‐kB and MAPK signalling pathway. A CAT639 does not block NFκB‐activation induced by IL‐1β in INS‐1e cells (n = 3). B Cat639 mildly inhibits P38 MAPK phosphorylation induced by IL‐1β (n = 3).
Figure S3 1400W had both protective effects and therapeutic effects on INS‐1e cells. A) and B) Pretreatment and post‐treatment of 1400W decreased caspase 9 activity induced by cytokines (upper panels) and rescued cell viability damaged by cytokines (bottom panels).
Figure S4 CAT639 destabilized nNOS dimer in SH‐SY5Y cells (left panel) but has no effect on cMyc‐Max PPI in the protein fragment complimentary assay (PCA). Dimeric proteins were determined by performing low temperature SDS‐PAGE gel. Samples lysed in sample buffer with β ‐ME and boiled for 5 min and GAPDH were used as a loading control (n = 3). PCA was develop to screen for Myc/Max inhibitors and Hek293 cells was overexpressed with cMyc‐N‐terminal Gaussia Luc (Gluc2) fusion and Max‐C‐Terminal Gaussia Luc (Gluc1) fusion proteins were develop. When Myc and Max form heterodimer, GLuc is active and luminescence signal is recorded with addition of Luciferase substrate. The results showed that Cat639 did not inhibit the Myc/Max dimerization.
Figure S5 CAT639 had no effect on ER stress induced by thapsigargin. A) CAT639 was not able to rescue cell viability damaged by thapsigargin. B) Thapsigargin‐induced decreased insulin secretion was not affected by CAT639. C) CAT639 had no effect on the expression levels of ER stress genes induced by thapsigargin.
Figure S6 Mouse PK profile of mCBD504 after PO dosing at 50 mg kg−1 (n = 3).
Table S1 IC50 of CYP inhibition.
Table S2 Kinase profile of ATV399.
Table S3 Primer sequences.
Acknowledgements
We would like to thank Jeff Janes, Mitch Hull, Hung Nguyen, Megan Wogan and Alex Kretowicz for technical assistance and helpful discussions.
Zhong, L. , Tran, T. , Baguley, T. D. , Lee, S. J. , Henke, A. , To, A. , Li, S. , Yu, S. , Grieco, F. A. , Roland, J. , Schultz, P. G. , Eizirik, D. L. , Rogers, N. , Chartterjee, A. K. , Tremblay, M. S. , and Shen, W. (2018) A novel inhibitor of inducible NOS dimerization protects against cytokine‐induced rat beta cell dysfunction. British Journal of Pharmacology, 175: 3470–3485. 10.1111/bph.14388.
Contributor Information
Matthew S Tremblay, Email: mtremblay@calibr.org.
Weijun Shen, Email: wshen@calibr.org.
References
- Alexander SP, Fabbro D, Kelly E, Marrion NV, Peters JA, Faccenda E et al (2017a). The Concise Guide to PHARMACOLOGY 2017/18: enzymes. Br J Pharmacol 174: S272–S359. [DOI] [PMC free article] [PubMed] [Google Scholar]
- Alexander SP, Kelly E, Marrion NV, Peters JA, Faccenda E, Harding SD et al (2017b). The Concise Guide to PHARMACOLOGY 2017/18: overview. Br J Pharmacol 174: S1–S16. [DOI] [PMC free article] [PubMed] [Google Scholar]
- Alexander SPH, Kelly E, Marrion NV, Peters JA, Faccenda E, Harding SD et al (2017c). The Concise Guide To PHARMACOLOGY 2017/18: Transporters. Br J Pharmacol 174: S360–S446. [DOI] [PMC free article] [PubMed] [Google Scholar]
- Alexander SPH, Peters JA, Kelly E, Marrion NV, Faccenda E, Harding SD et al (2017d). The Concise Guide To PHARMACOLOGY 2017/18: Ligand‐gated ion channels. Br J Pharmacol 174: S130–S159. [DOI] [PMC free article] [PubMed] [Google Scholar]
- Baek KJ, Thiel BA, Lucas S, Stuehr DJ (1993). Macrophage nitric oxide synthase subunits. Purification, characterization, and role of prosthetic groups and substrate in regulating their association into a dimeric enzyme. J Biol Chem 268: 21120–21129. [PubMed] [Google Scholar]
- Bai‐Feng L, Yong‐Feng L, Ying C (2010). Silencing inducible nitric oxide synthase protects rat pancreatic islet. Diabetes Res Clin Pract 89: 268–275. [DOI] [PubMed] [Google Scholar]
- Barbu A, Welsh N, Saldeen J (2002). Cytokine‐induced apoptosis and necrosis are preceded by disruption of the mitochondrial membrane potential (Δψm) in pancreatic RINm5F cells: prevention by Bcl‐2. Mol Cell Endocrinol 190: 75–82. [DOI] [PubMed] [Google Scholar]
- Cardozo AK, Ortis F, Storling J, Feng Y‐M, Rasschaert J, Tonnesen M et al (2005). Cytokines downregulate the sarcoendoplasmic reticulum pump Ca2+ ATPase 2b and deplete endoplasmic reticulum Ca2+, leading to induction of endoplasmic reticulum stress in pancreatic beta cells. Diabetes 54: 452–461. [DOI] [PubMed] [Google Scholar]
- Cavelti‐Weder C, Babians‐Brunner A, Keller C, Stahel MA, Kurz‐Levin M, Zayed H et al (2012). Effects of gevokizumab on glycemia and inflammatory markers in type 2 diabetes. Diabetes Care 35: 1654–1662. [DOI] [PMC free article] [PubMed] [Google Scholar]
- Chan JY, Cooney GJ, Biden TJ, Laybutt DR (2011). Differential regulation of adaptive and apoptotic unfolded protein response signalling by cytokine‐induced nitric oxide production in mouse pancreatic beta cells. Diabetologia 54: 1766–1776. [DOI] [PubMed] [Google Scholar]
- Curtis MJ, Alexander S, Cirino G, Docherty JR, George CH, Giembycz MA et al (2018). Experimental design and analysis and their reporting II: updated and simplified guidance for authors and peer reviewers. Br J Pharmacol 175: 987–993. [DOI] [PMC free article] [PubMed] [Google Scholar]
- Daff S (2010). NO synthase: structures and mechanisms. Nitric Oxide 23: 1–11. [DOI] [PubMed] [Google Scholar]
- Davey DD, Adler M, Arnaiz D, Eagen K, Erickson S, Guilford W et al (2007). Design, synthesis, and activity of 2‐imidazol‐1‐ylpyrimidine derived inducible nitric oxide synthase dimerization inhibitors. J Med Chem 50: 1146–1157. [DOI] [PubMed] [Google Scholar]
- De Proost I, Pintelon I, Brouns I, Kroese ABA, Riccardi D, Kemp PJ et al (2008). Functional live cell imaging of the pulmonary neuroepithelial body microenvironment. Am J Respir Cell Mol Biol 39: 180–189. [DOI] [PMC free article] [PubMed] [Google Scholar]
- DeBiasio R, Bright GR, Ernst LA, Waggoner AS, Taylor DL (1987). Five‐parameter fluorescence imaging: wound healing of living Swiss 3T3 cells. J Cell Biol 105: 1613–1622. [DOI] [PMC free article] [PubMed] [Google Scholar]
- Eizirik DL, Cardozo AK, Cnop M (2008). The role for endoplasmic reticulum stress in diabetes mellitus. Endocr Rev 29: 42–61. [DOI] [PubMed] [Google Scholar]
- Eizirik DL, Cagliero E, Bjorklund A, Welsh N (1992). Interleukin‐1 beta induces the expression of an isoform of nitric oxide synthase in insulin‐producing cells, which is similar to that observed in activated macrophages. FEBS Lett 308: 249–252. [DOI] [PubMed] [Google Scholar]
- Eizirik DL, Sandler S, Welsh N, Cetkovic‐Cvrlje M, Nieman A, Geller DA et al (1994). Cytokines suppress human islet function irrespective of their effects on nitric oxide generation. J Clin Invest 93: 1968–1974. [DOI] [PMC free article] [PubMed] [Google Scholar]
- Eldor R, Yeffet A, Baum K, Doviner V, Amar D, Ben‐Neriah Y et al (2006). Conditional and specific NF‐kappaB blockade protects pancreatic beta cells from diabetogenic agents. Proc Natl Acad Sci U S A 103: 5072–5077. [DOI] [PMC free article] [PubMed] [Google Scholar]
- Förstermann U, Sessa WC (2012). Nitric oxide synthases: regulation and function. Eur Heart J 33: 829–837. [DOI] [PMC free article] [PubMed] [Google Scholar]
- Fujimoto M, Shimizu N, Kunii K, Martyn JAJ, Ueki K, Kaneki M (2005). A role for iNOS in fasting hyperglycemia and impaired insulin signaling in the liver of obese diabetic mice. Diabetes 54: 1340–1348. [DOI] [PubMed] [Google Scholar]
- Giuliano KA, DeBiasio RL, Dunlay RT, Gough A, Volosky JM, Zock J et al (1997). High‐content screening: a new approach to easing key bottlenecks in the drug discovery process. J Biomol Screen 2: 249–259. [Google Scholar]
- Green DR, Reed JC (1998). Mitochondria and apoptosis. Science 281: 1309–1312. [DOI] [PubMed] [Google Scholar]
- Gurzov EN, Eizirik DL (2011). Bcl‐2 proteins in diabetes: mitochondrial pathways of beta‐cell death and dysfunction. Trends Cell Biol 21: 424–431. [DOI] [PubMed] [Google Scholar]
- Harding SD, Sharman JL, Faccenda E, Southan C, Pawson AJ, Ireland S et al (2018). The IUPHAR/BPS Guide to PHARMACOLOGY in 2018: updates and expansion to encompass the new guide to IMMUNOPHARMACOLOGY. Nucl Acids Res 46: D1091–D1106. [DOI] [PMC free article] [PubMed] [Google Scholar]
- Heimberg H, Heremans Y, Jobin C, Leemans R, Cardozo AK, Darville M et al (2001). Inhibition of cytokine‐induced NF‐kappaB activation by adenovirus‐mediated expression of a NF‐kappaB super‐repressor prevents beta‐cell apoptosis. Diabetes 50: 2219–2224. [DOI] [PubMed] [Google Scholar]
- Hotamisligil GS (2010). Endoplasmic reticulum stress and the inflammatory basis of metabolic disease. Cell 140: 900–917. [DOI] [PMC free article] [PubMed] [Google Scholar]
- Hynes SO, McCabe C, O'Brien T (2011). β cell protection by inhibition of iNOS through lentiviral vector‐based strategies In: McCarthy OH, Coulter AJ. (eds). Nitric Oxide: Methods and Protocols. Humana Press: Totowa, NJ, pp. 153–168. [DOI] [PubMed] [Google Scholar]
- Klatt P, Schmidt K, Lehner D, Glatter O, Bächinger HP, Mayer B (1995). Structural analysis of porcine brain nitric oxide synthase reveals a role for tetrahydrobiopterin and L‐arginine in the formation of an SDS‐resistant dimer. EMBO J 14: 3687–3695. [DOI] [PMC free article] [PubMed] [Google Scholar]
- Klein T, Bischoff R (2011). Physiology and pathophysiology of matrix metalloproteases. Amino Acids 41: 271–290. [DOI] [PMC free article] [PubMed] [Google Scholar]
- Korn K, Krausz E (2007). Cell‐based high‐content screening of small‐molecule libraries. Curr Opin Chem Biol 11: 503–510. [DOI] [PubMed] [Google Scholar]
- Kowluru RA, Mohammad G, dos Santos JM, Zhong Q (2011). Abrogation of MMP‐9 gene protects against the development of retinopathy in diabetic mice by preventing mitochondrial damage. Diabetes 60: 3023–3033. [DOI] [PMC free article] [PubMed] [Google Scholar]
- Larsen CM, Faulenbach M, Vaag A, Volund A, Ehses JA, Seifert B et al (2007). Interleukin‐1‐receptor antagonist in type 2 diabetes mellitus. N Engl J Med 356: 1517–1526. [DOI] [PubMed] [Google Scholar]
- Laybutt DR, Preston AM, Åkerfeldt MC, Kench JG, Busch AK, Biankin AV et al (2007). Endoplasmic reticulum stress contributes to beta cell apoptosis in type 2 diabetes. Diabetologia 50: 752–763. [DOI] [PubMed] [Google Scholar]
- Li H, Poulos TL (2005). Structure–function studies on nitric oxide synthases. J Inorg Biochem 99: 293–305. [DOI] [PubMed] [Google Scholar]
- Li P, Nijhawan D, Budihardjo I, Srinivasula SM, Ahmad M, Alnemri ES et al (1997). Cytochrome c and dATP‐dependent formation of Apaf‐1/caspase‐9 complex initiates an apoptotic protease cascade. Cell 91: 479–489. [DOI] [PubMed] [Google Scholar]
- Lin F‐S, Lin C‐C, Chien C‐S, Luo S‐F, Yang C‐M (2005). Involvement of p42/p44 MAPK, JNK, and NF‐κB in IL‐1β‐induced ICAM‐1 expression in human pulmonary epithelial cells. J Cell Physiol 202: 464–473. [DOI] [PubMed] [Google Scholar]
- Liu T, Hannafon B, Gill L, Kelly W, Benbrook D (2007). Flex‐Hets differentially induce apoptosis in cancer over normal cells by directly targeting mitochondria. Am Assoc Cancer Res 6: 1814–1822. [DOI] [PMC free article] [PubMed] [Google Scholar]
- Lundh M, Scully SS, Mandrup‐Poulsen T, Wagner BK (2013). Small‐molecule inhibition of inflammatory beta‐cell death. Diabetes Obes Metab 15 (Suppl 3): 176–184. [DOI] [PMC free article] [PubMed] [Google Scholar]
- Marrero MB, Banes‐Berceli AK, Stern DM, Eaton DC (2006). Role of the JAK/STAT signaling pathway in diabetic nephropathy. Am J Physiol Renal Physiol 290: F762–F768. [DOI] [PubMed] [Google Scholar]
- McMillan K, Adler M, Auld DS, Baldwin JJ, Blasko E, Browne LJ et al (2000). Allosteric inhibitors of inducible nitric oxide synthase dimerization discovered via combinatorial chemistry. Proc Natl Acad Sci U S A 97: 1506–1511. [DOI] [PMC free article] [PubMed] [Google Scholar]
- Mohammad G, Kowluru RA (2011). Novel role of mitochondrial matrix metalloproteinase‐2 in the development of diabetic retinopathy. Invest Ophthalmol Vis Sci 52: 3832–3841. [DOI] [PMC free article] [PubMed] [Google Scholar]
- Muhammed SJ, Lundquist I, Salehi A (2012). Pancreatic β‐cell dysfunction, expression of iNOS and the effect of phosphodiesterase inhibitors in human pancreatic islets of type 2 diabetes. Diabetes Obes Metab 14: 1010–1019. [DOI] [PubMed] [Google Scholar]
- Nagpal L, Haque MM, Saha A, Mukherjee N, Ghosh A, Ranu BC et al (2013). Mechanism of inducible nitric‐oxide synthase dimerization inhibition by novel pyrimidine imidazoles. J Biol Chem 288: 19685–19697. [DOI] [PMC free article] [PubMed] [Google Scholar]
- Negi G, Sharma SS (2015). Inhibition of IκB kinase (IKK) protects against peripheral nerve dysfunction of experimental diabetes. Mol Neurobiol 51: 591–598. [DOI] [PubMed] [Google Scholar]
- Ohtsuka M, Konno F, Honda H, Oikawa T, Ishikawa M, Iwase N et al (2002). PPA250 [3‐(2,4‐difluorophenyl)‐6‐{2‐[4‐(1H‐imidazol‐1‐ylmethyl) phenoxy]ethoxy}‐2‐phenylpyridine], a novel orally effective inhibitor of the dimerization of inducible nitric‐oxide Synthase, exhibits an anti‐inflammatory effect in animal models of chronic arthritis. J Pharmacol Exp Ther 303: 52–57. [DOI] [PubMed] [Google Scholar]
- Oyadomari S, Takeda K, Takiguchi M, Gotoh T, Matsumoto M, Wada I et al (2001). Nitric oxide‐induced apoptosis in pancreatic beta cells is mediated by the endoplasmic reticulum stress pathway. Proc Natl Acad Sci U S A 98: 10845–10850. [DOI] [PMC free article] [PubMed] [Google Scholar]
- Pan J, Burgher KL, Szczepanik AM, Ringheim GE (1996). Tyrosine phosphorylation of inducible nitric oxide synthase: implications for potential post‐translational regulation. Biochem J 314: 889–894. [DOI] [PMC free article] [PubMed] [Google Scholar]
- Papaccio G, Graziano A, Valiante S, D'Aquino R, Travali S, Nicoletti F (2005). Interleukin (IL)‐1β toxicity to islet β cells: efaroxan exerts a complete protection. J Cell Physiol 203: 94–102. [DOI] [PubMed] [Google Scholar]
- Philip D, Janine S, Stefan P (2008). High‐content analysis in preclinical drug discovery. Comb Chem High Throughput Screen 11: 216–230. [DOI] [PubMed] [Google Scholar]
- Pop C, Timmer J, Sperandio S, Salvesen GS (2006). The apoptosome activates caspase‐9 by dimerization. Mol Cell 22: 269–275. [DOI] [PubMed] [Google Scholar]
- Qader SS, Ekelund M, Andersson R, Obermuller S, Salehi A (2003). Acute pancreatitis, expression of inducible nitric oxide synthase and defective insulin secretion. Cell Tissue Res 313: 271–279. [DOI] [PubMed] [Google Scholar]
- Reilly SM, Chiang S‐H, Decker SJ, Chang L, Uhm M, Larsen MJ et al (2013). An inhibitor of the protein kinases TBK1 and IKK‐[epsiv] improves obesity‐related metabolic dysfunctions in mice. Nat Med 19: 313–321. [DOI] [PMC free article] [PubMed] [Google Scholar]
- Renatus M, Stennicke HR, Scott FL, Liddington RC, Salvesen GS (2001). Dimer formation drives the activation of the cell death protease caspase 9. Proc Natl Acad Sci 98: 14250–14255. [DOI] [PMC free article] [PubMed] [Google Scholar]
- Rissanen A, Howard CP, Botha J, Thuren T, Global I (2012). Effect of anti‐IL‐1beta antibody (canakinumab) on insulin secretion rates in impaired glucose tolerance or type 2 diabetes: results of a randomized, placebo‐controlled trial. Diabetes Obes Metab 14: 1088–1096. [DOI] [PubMed] [Google Scholar]
- Sennequier N, Wolan D, Stuehr DJ (1999). Antifungal imidazoles block assembly of inducible NO synthase into an active dimer. J Biol Chem 274: 930–938. [DOI] [PubMed] [Google Scholar]
- Shimabukuro M, Ohneda M, Lee Y, Unger RH (1997). Role of nitric oxide in obesity‐induced beta cell disease. J Clin Invest 100: 290–295. [DOI] [PMC free article] [PubMed] [Google Scholar]
- Sloan‐Lancaster J, Abu‐Raddad E, Polzer J, Miller JW, Scherer JC, De Gaetano A et al (2013). Double‐blind, randomized study evaluating the glycemic and anti‐inflammatory effects of subcutaneous LY2189102, a neutralizing IL‐1beta antibody, in patients with type 2 diabetes. Diabetes Care 36: 2239–2246. [DOI] [PMC free article] [PubMed] [Google Scholar]
- Sugita H, Fujimoto M, Yasukawa T, Shimizu N, Sugita M, Yasuhara S et al (2005). Inducible nitric‐oxide synthase and no donor induce insulin receptor substrate‐1 degradation in skeletal muscle cells. J Biol Chem 280: 14203–14211. [DOI] [PubMed] [Google Scholar]
- Symons KT, Nguyen PM, Massari ME, Anzola JV, Staszewski LM, Wang L et al (2011). Pharmacological characterization of KLYP961, a dual inhibitor of inducible and neuronal nitric‐oxide synthases. J Pharmacol Exp Ther 336: 468–478. [DOI] [PubMed] [Google Scholar]
- Torres S, De Sanctis J, de Briceno LM, Hernandez N, Finol H (2004). Inflammation and nitric oxide production in skeletal muscle of type 2 diabetic patients. J Endocrinol 181: 419–427. [DOI] [PubMed] [Google Scholar]
- van Asseldonk EJ, van Poppel PC, Ballak DB, Stienstra R, Netea MG, Tack CJ (2015). One week treatment with the IL‐1 receptor antagonist anakinra leads to a sustained improvement in insulin sensitivity in insulin resistant patients with type 1 diabetes mellitus. Clin Immunol 160: 155–162. [DOI] [PubMed] [Google Scholar]
- Víteček J, Lojek A, Valacchi G, Kubala L (2012). Arginine‐based inhibitors of nitric oxide synthase: therapeutic potential and challenges. Mediators Inflamm 2012: 22. [DOI] [PMC free article] [PubMed] [Google Scholar]
- Waelchli R, Bollbuck B, Bruns C, Buhl T, Eder J, Feifel R et al (2006). Design and preparation of 2‐benzamido‐pyrimidines as inhibitors of IKK. Bioorg Med Chem Lett 16: 108–112. [DOI] [PubMed] [Google Scholar]
- Wei C‐C, Wang Z‐Q, Tejero J, Yang Y‐P, Hemann C, Hille R et al (2008). Catalytic reduction of a tetrahydrobiopterin radical within nitric‐oxide synthase. J Biol Chem 283: 11734–11742. [DOI] [PMC free article] [PubMed] [Google Scholar]
- Welsh N, Eizirik DL, Bendtzen K, Sandler S (1991). Interleukin‐1 beta‐induced nitric oxide production in isolated rat pancreatic islets requires gene transcription and may lead to inhibition of the Krebs cycle enzyme aconitase. Endocrinology 129: 3167–3173. [DOI] [PubMed] [Google Scholar]
- Xie QW, Kashiwabara Y, Nathan C (1994). Role of transcription factor NF‐kappa B/Rel in induction of nitric oxide synthase. J Biol Chem 269: 4705–4708. [PubMed] [Google Scholar]
- Xu C, Ma H, Inesi G, Al‐Shawi MK, Toyoshima C (2004). Specific structural requirements for the inhibitory effect of thapsigargin on the Ca2+ ATPase SERCA. J Biol Chem 279: 17973–17979. [DOI] [PubMed] [Google Scholar]
- Yang YH, Vilin YY, Roberge M, Kurata HT, Johnson JD (2014). Multiparameter screening reveals a role for Na+ channels in cytokine‐induced beta‐cell death. Mol Endocrinol 28: 406–417. [DOI] [PMC free article] [PubMed] [Google Scholar]
Associated Data
This section collects any data citations, data availability statements, or supplementary materials included in this article.
Supplementary Materials
Figure S1 CAT639 had protective effects on INS‐1e cells. A) and B) CAT639 rescued cell viability and insulin secretion damaged by cytokines. Cells were pretreated with compounds for 24 h and followed co‐treatment with cytokines (10 ng·mL−1 IL‐1β, 100 ng·mL−1 IFNγ) for additional 24 h. C) CAT639 recovered cytokine‐induced up‐regulation of ER stress gene expression. Cells were pretreated with compounds for 8 h and followed co‐treatment with cytokines (10 ng·mL−1 IL‐1β, 100 ng·mL−1 IFNγ) for additional 8 h.
Figure S2 CAT639's effect on NF‐kB and MAPK signalling pathway. A CAT639 does not block NFκB‐activation induced by IL‐1β in INS‐1e cells (n = 3). B Cat639 mildly inhibits P38 MAPK phosphorylation induced by IL‐1β (n = 3).
Figure S3 1400W had both protective effects and therapeutic effects on INS‐1e cells. A) and B) Pretreatment and post‐treatment of 1400W decreased caspase 9 activity induced by cytokines (upper panels) and rescued cell viability damaged by cytokines (bottom panels).
Figure S4 CAT639 destabilized nNOS dimer in SH‐SY5Y cells (left panel) but has no effect on cMyc‐Max PPI in the protein fragment complimentary assay (PCA). Dimeric proteins were determined by performing low temperature SDS‐PAGE gel. Samples lysed in sample buffer with β ‐ME and boiled for 5 min and GAPDH were used as a loading control (n = 3). PCA was develop to screen for Myc/Max inhibitors and Hek293 cells was overexpressed with cMyc‐N‐terminal Gaussia Luc (Gluc2) fusion and Max‐C‐Terminal Gaussia Luc (Gluc1) fusion proteins were develop. When Myc and Max form heterodimer, GLuc is active and luminescence signal is recorded with addition of Luciferase substrate. The results showed that Cat639 did not inhibit the Myc/Max dimerization.
Figure S5 CAT639 had no effect on ER stress induced by thapsigargin. A) CAT639 was not able to rescue cell viability damaged by thapsigargin. B) Thapsigargin‐induced decreased insulin secretion was not affected by CAT639. C) CAT639 had no effect on the expression levels of ER stress genes induced by thapsigargin.
Figure S6 Mouse PK profile of mCBD504 after PO dosing at 50 mg kg−1 (n = 3).
Table S1 IC50 of CYP inhibition.
Table S2 Kinase profile of ATV399.
Table S3 Primer sequences.


