

Abstract
Circulating antibodies that specifically bind polyethylene glycol (PEG), a polymer routinely used in protein and nanoparticle therapeutics, have been associated with reduced efficacy and increased adverse reactions to some PEGylated therapeutics. In addition to acute induction of anti-PEG antibodies (APA) by PEGylated drugs, typically low but detectable levels of APA are also found in up to 70% of the general population. Despite the broad implications of APA, the dynamics of APA-mediated clearance of PEGylated drugs, and why many patients continue to respond to PEGylated drugs despite the presence of pre-existing APA, remains not well understood. Here, we developed a minimal physiologically based pharmacokinetic (mPBPK) model that incorporates various properties of APA and PEGylated drugs. Our mPBPK model reproduced clinical PK data of APA-mediated accelerated blood clearance of pegloticase, as well as APA-dependent elimination of PEGyated liposomes in mice. Our model predicts that the prolonged circulation of PEGylated drugs will be compromised only at APA concentrations greater than ~500 ng/mL, providing a quantitative explanation to why the effects of APA on PEGylated treatments appear to be limited in most patients. This mPBPK model is readily adaptable to other PEGylated drugs and particles to predict the precise levels of APA that could render them ineffective, providing a powerful tool to support the development and interpretation of preclinical and clinical studies of various PEGylated therapeutics.
Keywords: Polyethylene glycol, anti-drug antibodies, ADA, PEG, anti-PEG antibodies, PBPK
Graphical abstract
1. Introduction
Polyethylene glycol (PEG) is a synthetic polymer routinely used to improve the stability, circulation kinetics, and efficacy of protein and nanoparticle therapeutics [1–6]. PEG conjugation increases the overall size of protein-conjugates, reducing renal filtration of the protein drug [7]. PEG grafting also reduces the adsorption of opsonins and complement proteins, thereby minimizing elimination of PEGylated proteins and particles by the mononuclear phagocytic system (MPS) [4, 8]. PEGylation of therapeutics has steadily increased since the 1970s; there are currently at least 16 PEGylated protein and PEG-liposome products on the market. Many more are in clinical development: a search of ClinicalTrials.gov for studies of interventions containing the keyword “PEG” returns 75 active trials of a PEG-containing intervention, with an additional 219 open studies (not yet recruiting, recruiting, or available for expanded access).
There are increasing concerns about the use of PEG in protein and nanoparticle therapeutics due to emerging clinical evidence of a specific class of anti-drug antibodies (ADA) that recognize and bind PEG, i.e. anti-PEG antibodies, (APA) [9, 10]. The potential immunogenicity of PEG was first reported in 1983 when Richter and Akerblom demonstrated that PEGylated proteins could induce PEG-specific antibodies [11]. Studies in animal models have since attributed the accelerated blood clearance (ABC) phenomenon observed in subsequent doses of PEG-liposomes to APA, which appear to be generated in a T-cell independent manner [12–15]. The first evidence of APA-mediated ABC of a PEGylated drug in humans occurred with pegaspargase used for the treatment of acute lymphoblastic leukemia; roughly one third of patients were non-responsive to treatment, with the rapid clearance of pegaspargase in the non-responsive group closely correlated with the presence of APA [16]. Studies of pegloticase, used for treatment of refractory chronic gout, showed that 45% (9/20) of patients developed high APA titers and became non-responsive to treatment within days following the first dose [17]. More recently, a Phase III study (NCT01848106) of pegnivacogin, a PEGylated RNA aptamer for inhibition of coagulation factor IXa, was halted due to serious adverse events (SAEs), with subjects experiencing SAEs all possessing very high titers of pre-existing APA relative to the other subjects [18, 19]. It should be noted that APA are unlike most anti-drug antibodies (ADA) in that they can actually be found in treatment-naïve individuals. Indeed, we and others have found circulating APA in individuals who likely have never received treatment with a PEGylated drug, with pre-existing IgG and/or IgM APA detectable in up to 70% of the general population [9, 19–24].
To date, ABC and adverse events (AEs) of PEGylated drugs or particles in most animal and clinical studies have only been qualitatively associated with APA, i.e. the absence or presence of APA. Interestingly, not all PEGylated drugs appear to suffer from the ABC effect [9]. In order for the circulation kinetics and efficacy of a PEGylated drug to be compromised by APA, we hypothesize that APA must be present at levels that result in multiple APA binding to the vast majority of the injected PEGylated drug molecules. Since the kinetics of APA accumulation on PEGylated drugs are difficult to quantify in vivo, we decided to turn to modeling to gain quantitative insights into the temporal dynamics of APA-mediated elimination of PEGylated drugs. Physiologically based pharmacokinetic (PBPK) models are one of the best current methods to account for the complex interplay between therapy attributes and human physiology, and are widely used in drug development and regulation [25–31]. Taking a reductionist principle [32, 33], we developed here a minimal PBPK (mPBPK) model of the interactions between PEGylated drugs, APA, and the body, and validated it against human clinical as well as mouse PK data.
2. Materials and Methods
2.1 Mouse model of PEGylated liposomal doxorubicin (PLD) clearance
Adult BALB/c mice were passively immunized with APA by the intravenous administration of mouse anti-PEG IgG1 (with 3 (low titer) or 30 (high titer) μg/mouse i.v., Silver Lake Research, CH2076, lot K0868) 24 hours prior to the intravenous administration of PLD (3 mg/kg, Doxil®, Janssen Products, LP). Samples for injection were sterilized via filtration through 0.2μm filters. At time points of 0.083, 3, 6, 24, 48, and 96 hours following PLD administration, mice were anesthetized using ketamine (100mg/kg, i.p.) and medetomidine hydrochloride (1 mg/kg, i.p.), then sacrificed via cardiac puncture (into sodium heparin vacutainers) and cervical dislocation. The blood, liver, spleen, and lungs were collected for doxorubicin quantification.
2.2 PLD Quantification
The complete methods for sample collection, preparation and analysis of encapsulated and released doxorubicin in plasma and total (encapsulated + released) doxorubicin in tissues after administration of PLD have been previously described [34–39]. Briefly, blood samples were collected in sodium heparin tubes at 0.083, 3, 6, 24, 48 and 96 hr after the administration of PLD. Blood was centrifuged at 1,500×g for 5 minutes to obtain plasma. Encapsulated and released doxorubicin in plasma were separated using solid phase separation. Tissues of interest were flash frozen in liquid nitrogen and stored at −80°C until processing. Upon processing, tissues were thawed, weighed, and diluted in a 1:3 ratio with phosphate buffered saline prior to homogenizing with a Precellys 24 bead mill homogenizer (Omni International Inc, Kennesaw, GA). Samples were further processed by addition of 800 μL extraction solution (acetonitrile with 100 ng/mL daunorubicin internal standard) to 200 μL of plasma or tissue homogenate. The samples were vortexed for 10 minutes and centrifuged at 10,000xg for 10 minutes at 4°C. The supernatant was removed to a clean tube, evaporated to dryness under nitrogen, and reconstituted in 150 μL of 15% acetonitrile in water plus 0.1% formic acid. The samples were then vortexed, transferred to autosampler vials, and analyzed by high-performance liquid chromatography with fluorescence detection (HPLC-FL) set to excitation wavelength 490nm/emission wavelength 590nm. The HPLC-FL technique had a quantitative range of 10 – 3,000 ng/mL for sum total doxorubicin in tissues and released doxorubicin in plasma and 300 – 30,000 ng/mL for encapsulated doxorubicin in plasma. Samples that returned a concentration above the quantitative limit were diluted to fall within the quantitative range and reinjected.
2.3 Anti-PEG Antibody quantification
To quantify APA, untreated half-area 96-well Costar plates (Corning #3695) were coated with 1,2-distearoyl-sn-glycero-3-phosphoethanolamine-methoxy PEG5kDa (DSPE-PEG; Nanocs, New York, NY, USA) at 50 μg/mL in DPBS overnight at 4C. The plates were blocked with 5% milk in DPBS for 1 hour, shaking at room temperature. Plasma samples were diluted 20 to 40-fold in 1% milk in DPBS and added to the plate, 50μL per well. The samples were plated in both the presence and absence of free PEG 10kDa (final concentration 10mg/mL) as competition, incubated at 4C overnight, and subsequently washed with DPBS. A standard curve was generated using anti-PEG IgG1 (Silver Lake Research, CH2076, lot K0868). Secondary antibodies were goat anti-mouse IgG-HRP (1:5,000 dilution, Santa Cruz, sc-2005, lot #D1816), with 1 step Ultra TMB (ThermoFisher) as substrate. The HRP reaction was stopped with 2N sulfuric acid, and the absorbance was read at 450 nm (signal) and 570 nm (background) using a Spectramax M2 plate reader (Molecular Devices). For every wash step, DPBS without TWEEN was used, because TWEEN contains PEG moieties that can be bound by APA. The level of anti-PEG Ab present in the samples was determined using a 5-parameter logistic regression curve, which was corrected for the nonspecific background signal of sample via comparison to competition wells incubated with the free PEG10kDa. Whole blood samples were processed via centrifugation at 1,500×g for 5 minutes to obtain plasma.
2.4 Physiologically based pharmacokinetic modeling
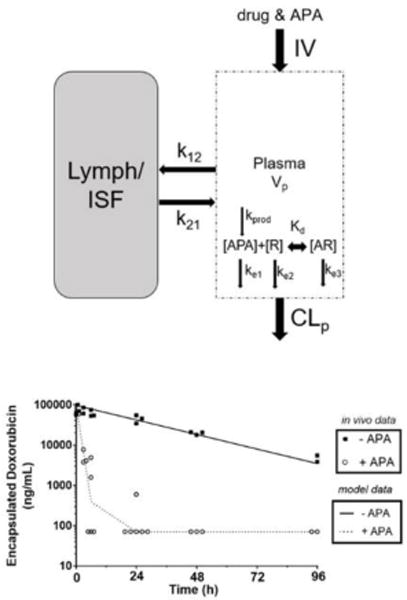
We chose to use a dynamic model-building strategy, leveraging knowledge from the literature to build a mPBPK model of APA-mediated ABC, then applied the modeling and simulation techniques to test against literature values and independent experimental studies to verify the performance of the model in predicting dispositions of APA-mediated clearance of PEG-liposomes and PEGylated proteins (Figure 1) [40]. Since no parameter was trained against our data to improve match statistics against preclinical or clinical pharmacokinetic results, the model predictions were the sole product of parameters obtained either from external literature review or independent experiments (e.g. determining the association/dissociation rates of antibodies). In silico experiments were coded in MATLAB (http://www.mathworks.com/products/matlab/) and executed on UNC-Chapel Hill’s KillDevil computer cluster or an Apple MacBook Pro. The differential equations were solved using MATLAB’s ode15s with the “NonNegative” option to ensure physically meaningful results. This simplified multicompartment model simulated the dynamics of APA interactions with both free-PEG and PEG-liposomes, including the formation and elimination of APA-PEG-liposome immune complexes (Figure 1). Due to the lack of biodistribution data for PEGylated drugs in patients with measured APA titers, we focused on developing a mPBPK model with two key compartments (plasma and interstitial space). The model incorporates a variety of physiologically-relevant parameters drawn from literature (such as rates of antibody production, stimulation and elimination, diffusion kinetics of antibody into and out of the interstitial space, circulation kinetics and biodistribution of PEG-liposomes or PEGylated drugs) and our own measurements (clinically realistic plasma APA concentrations, APA binding and unbinding rates to PEG) (Table 1). No parameter was fitted to improve match statistics against in vivo pharmacokinetic results. In this model, we made several key assumptions. We assumed that elimination rate constants of drug, antibody, and drug-antibody complexes did not change over time (i.e. that routes of elimination were non-saturable). We assumed fixed physiological parameter values for blood volume and interstitial volume, as described in Table 1, based on previously published values. We assumed that once there were at least three antibodies opsonizing the therapeutic particle, it would be eliminated at a fixed accelerated rate (first order elimination with a half-life of 45 minutes) [41]. Further opsonization by more antibodies did not lead to an increased rate of clearance. In the passive immunization studies, we assumed that PLD administration would not impact APA-mediated clearance (note that prior research has shown that the administration of PLD can kill APA-secreting B cells due to its cytotoxic cargo drug) [8]. We assumed that each PLD particle possessed up to 200 discrete binding sites for APA. Sensitivity analyses showed that under our conditions of interest, this value was not critical, as most PEG-liposome particles are only bound by 5 or fewer antibodies despite a large number of potential binding sites. Similarly, we assumed that each pegloticase drug molecule possessed up to 15 discrete binding sites for APA. When modeling a memory antibody response, we assumed a maximum target concentration of 5 μg/mL APA, with a rate of production sufficient to reach that concentration 5 days after the induction of memory response [42, 43]. For the human model of PEGylated liposomes, we assumed that the liposomes were not carrying a cytotoxic payload, and thus would be capable of inducing increased production of APA. BALB/c mouse hematocrit was measured via laboratory analysis (Alfa Wasserman Vet Axcel® Chemistry System).
Figure 1. Model structure of the developed minimal PBPK model. Symbols and physiological parameters are defined in Table 1 and equations (supplemental).
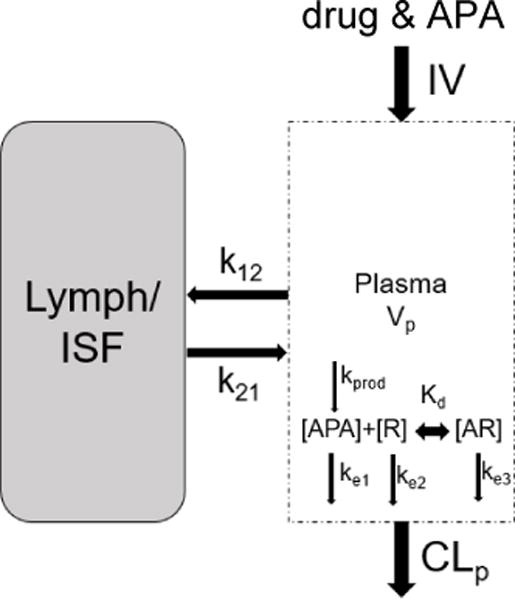
The plasma compartment represents venous plasma as in full PBPK models. APA and drug (R) were injected into the plasma, where they begin to associate with each other and undergo elimination separately or as a small immune complex. Antibody molecules were simulated to travel between blood and interstitial fluid (ISF), but drug particles did not enter the ISF. [AR] represents an antibody-drug complex. CLp represents clearance from plasma. Kprod and kd represent the rate of antibody production (when model conditions allow), and the dissociation constant describing the binding and unbinding of APA and drug molecules, respectively.
Table 1.
Key model parameters
| Parameter | Value (mouse/human) | Units | Reference | Description |
|---|---|---|---|---|
| Physiological | ||||
| Blood Volume | 1.3/5,000 | mL | [54, 55] | Total blood vol. |
| Fraction Plasma | 55%/55% | – | measured/[54] | % of blood that is plasma |
| Interstitial Volume | 2.75/12,000 | mL | [56] | Total interstitial vol. |
| Kinetics of APA | ||||
| Kon | 6.2 * 104 | M−1 * sec−1 | [20] | Ab attachment rate |
| Koff | 6.12 * 10−4 | sec−1 | [20] | Ab detachment rate |
| HalfLifeAb | 6/21 | days | [57] | Ab degradation rate |
| K12 | 0.4 | day−1 | [57] | Rate plasma→ISF |
| K21 | 0.4 | day−1 | [57] | Rate ISF→plasma |
| Clearance Kinetics | ||||
| Ke1 | 0.1155/0.033 | days−1 | [57] | Elimination rate of APA |
| Ke2 (pegloticase) | n/a/0.05544 | days−1 | [17] | Elimination rate of unopsonized pegloticase |
| Ke2 (PEG-liposome) | 0.8316/0.277 | days−1 | [58–60] | Elimination rate of unopsonized PEG-liposomes |
| Ke3 | 0.924 | hours−1 | [41] | Elimination rate of antibody-drug small immune complex |
3. Results
3.1. In vivo validation of mPBPK model of APA-mediated ABC
The currently available clinical data has a very coarse time resolution. For example, in the study of pegloticase, all patients exhibited equal pegloticase activity on day 2, whereas by the next time point measured (day 7), a large group of patients had lost pegloticase activity in the plasma to the extent that it was below the limit of detection [24]. Similarly, studies of the clinical impacts of APA on pegaspargase and pegnivacogin did not evaluate the kinetics of the negative effects seen in sensitized patients [16, 19]. Therefore, to confirm that our mPBPK model could faithfully reproduce the kinetics of the APA-mediated elimination of PEGylated entities, we first turned to modeling APA-induced ABC in mice, using parameter values that are reflective of the mouse anatomy and physiology. Generating an APA response in mice via vaccination with the aid of adjuvants not only results in variable, but also very high titer antibody responses (i.e. much higher than titers of APA typically found in humans). Thus, to reproducibly achieve APA levels that are comparable to those encountered in humans, we passively immunized mice against PEG by i.v. delivery of well-defined quantities of monoclonal APA and measured the consequent changes in PK and biodistribution of PLD, used here as an easily-quantifiable model PEG-liposomal drug. PLD was previously shown to kill APA-secreting B cells [8], and thus does not appear to be capable of inducing or stimulating APA response in patients. However, the use of PLD as a model PEGylated drug carrier is compatible with the use of infused APA to evaluate the ABC effect, since the APA are already present and there are no APA-secreting B-cells that PLD can kill. The results generated herein are expected to reflect the impact APA would have on other PEG-liposomes carrying non-cytotoxic cargo.
Predictions from our mPBPK model are largely consistent with the measured rates of clearance of PLD in mice possessing high (Figure 2A) and low (Figure 2B) titers of APA (~7μg/mL and ~0.3μg/mL of APA after 30 mins, respectively). The model predicts that high titers of APA would induceã27-fold decrease in total plasma exposure to PLD through 96-hours, from ~2,700 μg*h/mL in mice with no APA to ~100 μg*h/mL in mice with 7μg/mL APA (Figure 2E), in good agreement with the measured AUC0-96hr of ~2,600 μg*h/mL and ~90 μg*h/mL, respectively. Our model predicts that ABC induced by high titers of APA would occur within hours in mice. Indeed, by the 3-hour timepoint, the PLD levels in mice with high APA titers had dropped 94% relative to the no-APA control (80.4μg/mL) (Figure 2A). These results validate our mPBPK model’s potential as a tool to predict APA-induced ABC of PEGylated therapeutics in vivo. Our model attributes the swift elimination from the systemic circulation to a rapid accumulation of multiple APA on the surface of PLD (within 15 minutes; Figure 2C), leading to the formation of immune complexes that are quickly eliminated. In simulations of mice with low titers of APA, the mPBPK model suggests that fewer than 5% of PLD would be opsonized by at least three APA molecules, which explains why the PK profile remains largely unaltered compared to control mice without APA (Figure 2D).
Figure 2. A mouse model of pre-existing anti-PEG immunity confirmed PBPK model predictions.
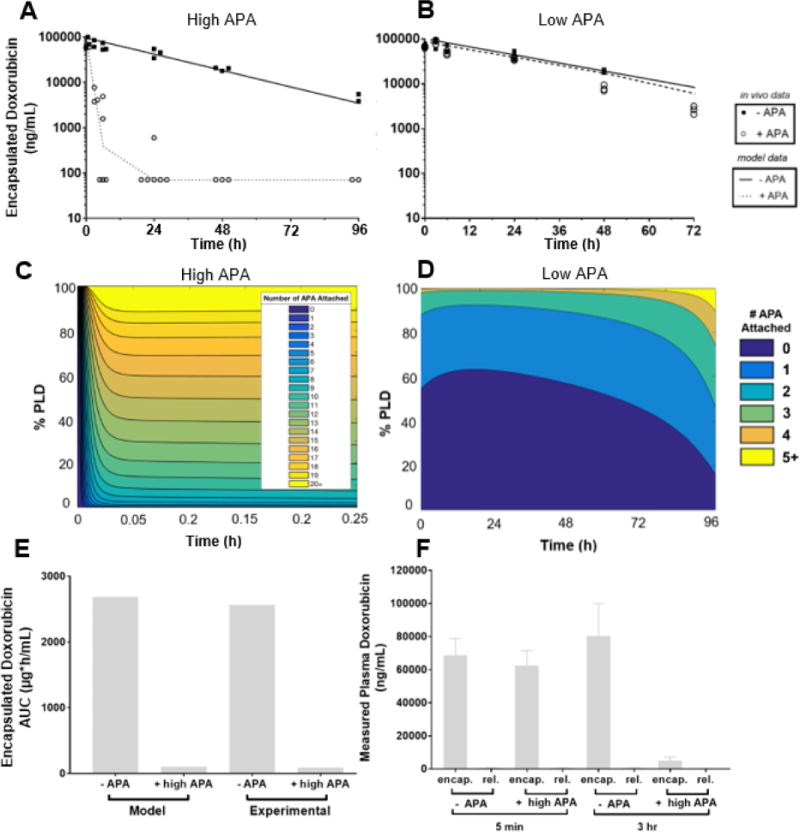
PBPK model predictions (solid and dashed lines) of APA’s impact on PLD PK in mice, plotted against encapsulated in vivo data from mice given PLD +/− APA, with APA starting concentration of 7μg/mL (A) or 300ng/mL (B). (C) The estimated fraction of PLD particles from mPBPK model with a specific number of APA attached over the first fifteen minutes following injection, modeled for high pre-existing APA. (D) The estimated proportion of PLD particles from mPBPK model with a specific number of APA attached through 96 hours post-injection, modeled with a low pre-existing APA. E) mPBPK model’s prediction of doxorubicin AUC with and without APA, compared to in vivo measurements. (F) Measured concentrations of encapsulated and released doxorubicin in the plasma of mice with or without APA at the 5 minute and 3-hour timepoints.
3.2. APA drive the elimination of PLD immune complexes from plasma to liver
Theoretically, in addition to forming immune complexes that are eliminated from circulation via erythrocytes, MPS, or liver sinusoidal endothelial cells [44–46], APA could also drive elimination of PLD by inducing activation of the classical complement pathway, leading to eventual accumulation of the C6-9 membrane attack complex and the formation of pores in the liposomal membrane [47]. We thus differentiated between released and encapsulated doxorubicin in plasma samples. We found that nearly all doxorubicin (>98%) detected in the plasma was encapsulated in liposomes, with or without the presence of APA (Figure 2F), suggesting that the presence of APA does not induce direct lysis of the liposomes.
Instead, consistent with the mechanism of hepatic clearance as immune complexes, APA induced rapid and extensive clearance of PLD to the liver (Figure 3). At the earliest timepoint (5 min) there was no apparent difference in the concentrations of doxorubicin between mice with and without APA. Starting from the 3-hour timepoint, however, mice with high APA titers had significantly greater concentrations of doxorubicin in their livers than mice without APA (Figure 3B). Hepatic elimination dominates the APA-mediated clearance of PLD relative to the spleen and lung (Figure 3, B, C, and D), supporting our use of a simplified 2-compartment mPBPK model.
Figure 3. APA drives elimination of PLD from plasma primarily to liver in mice.
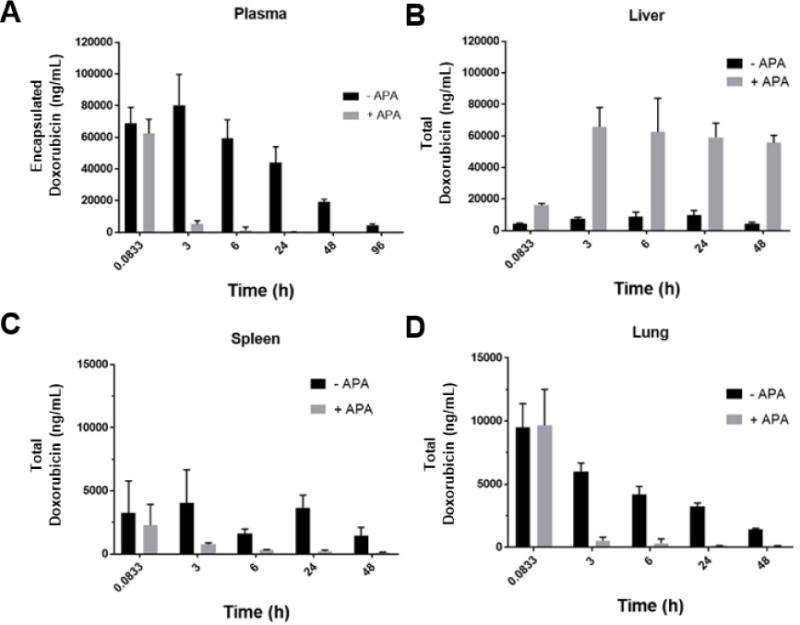
Tissue concentrations of doxorubicin are shown in the absence or presence of exogenously administered APA (7 μg/mL) in the A) plasma, B) liver, C) spleen, and D) lungs. Concentration values represent the total doxorubicin (encapsulated and released) present in each tissue.
3.3. Levels of pre-existing APA that are commonly observed in the general population are unlikely to considerably impact pegloticase AUC in humans
After validating that our mPBPK model could predict the kinetics of APA-mediated ABC in mouse, we next turned to examining how different levels of circulating APA may contribute to ABC of pegloticase in humans. We updated select parameters in our mPBPK model with human values (e.g. plasma volume, drug half-life), and calculated the AUC0-21days for a single dose of pegloticase (Figure 4B) across different levels of pre-existing APA from 0ng/mL to 10μg/mL (Figure 4A). Here, to focus on the effects of pre-existing APA, we did not model the secretion of additional APA due to a memory response. For patients who have APA titers at or below the median concentrations of APA in the general population (roughly 50 ng/mL), our model predicted only a 5% change in AUC relative to patients without APA at all. Only the top ~10% of patients in terms of pre-existing APA levels were predicted to experience a 50% or greater decrease in AUC0-21day with their first dose of pegloticase (Figure 4C). Our results suggest that for most patients, the concentrations of pre-existing APA are likely insufficient to cause a noticeable change in drug exposure and, consequently, efficacy.
Figure 4. Pre-existing concentrations of APA measured in the majority of the population is insufficient to impact the PK of PEG-uricase.
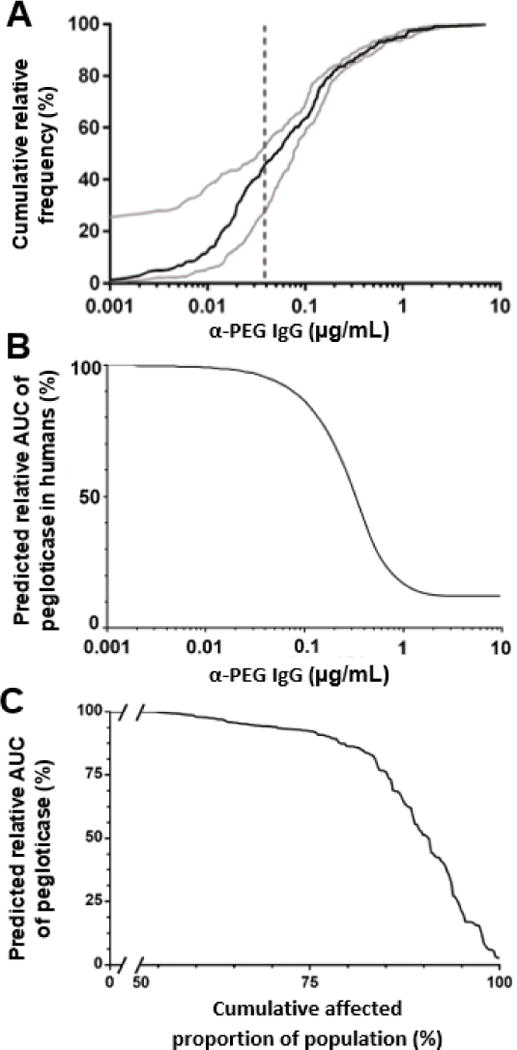
(A) Frequency of IgG APA concentrations measured in a sampling of the general public, reproduced from [20]. Dashed line represents the lower limit of detection. (B) AUC of pegloticase at different circulating APA concentrations, estimated by the mPBPK model. Y-axis values are percentages of AUC relative to predicted AUC with no APA. (C) Sweep of predicted AUC of pegloticase administered to simulated human patients with varying pre-existing APA, without the induction of further APA production.
3.4. Induced APA memory response is predicted to considerably impact the PK of pegloticase and PEG-liposomes in humans
We next constructed a condition in which a theoretical patient (with 50ng/mL pre-existing APA at baseline, and a memory response characterized by further production of APA starting at day 2) was dosed with pegloticase (8mg), and we compared the consequent PK profile to a patient with pre-existing APA, but no memory response (Figure 5A). When compared to clinical PK data, the mPBPK model was able to recapitulate the time profile of APA-mediated clearance, particularly the limited elimination by day 2 and the extensive clearance by day 7. The minor difference in pegloticase’s PK through the first two days is attributed to the prediction that fewer than 5% of drug molecules will be opsonized with three or more APA throughout this timeframe (Figure 5B). After increased APA production begins, however, the number of APA bound per pegloticase molecule is predicted to increase rapidly, leading to formation of immune complexes with at least three APA bound (Figure 5C). With the induction of increased APA secretion between 48 and 72 hours (Figure 5C), the rate of clearance of immune complexes was accelerated, leading to the prediction that the majority of infused pegloticase molecules are expected to be eliminated from the circulation by day 3 (Figure 5A). Although the clinical data does not provide an accurate measure of the precise time point at which pegloticase concentrations in plasma diminish, our model predicts that within hours of increased APA production, pegloticase levels will begin to rapidly decrease.
Figure 5. The mPBPK model’s simulation of APA memory response is similar to clinical data for the clearance of pegloticase.
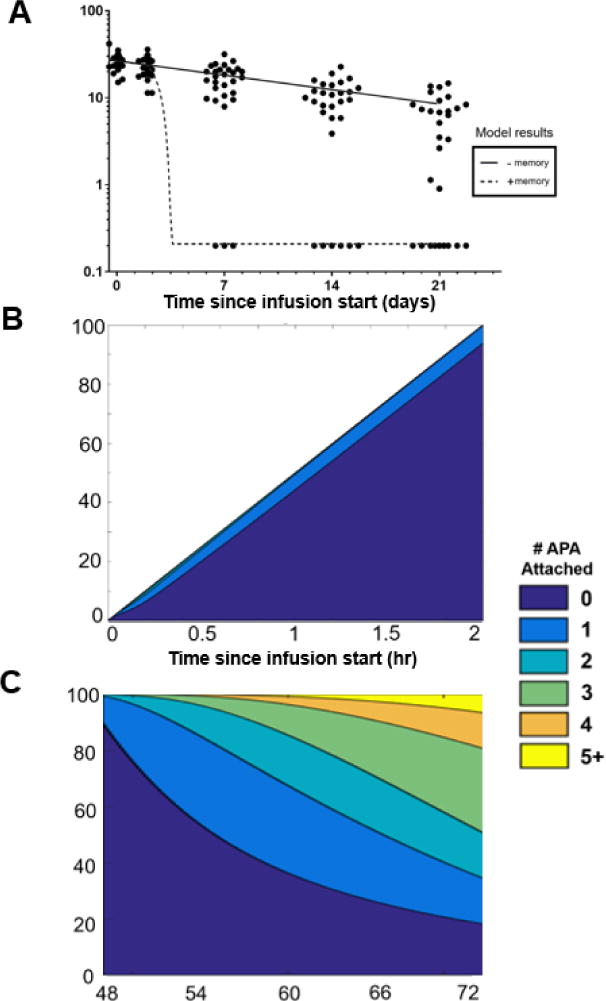
A) mPBPK model predictions of simulated patients with and without a memory APA response, overlaid with the clinical data adapted from [17]. Black circles represent individual patients’ measured pegloticase activity levels over time. All patients assumed to have 0.05μg/mL pre-existing APA. B) and (C): The predicted number of APA bound per pegloticase molecule in a simulated patient from the “+ memory” group shown in panel A over the course of (B) a 2-hour intravenous drug infusion of pegloticase or (C) between days 2 and 3 following administration. Further APA production was simulated to begin on day 2 and continue through the end of the simulation.
Finally, we simulated the impact of pre-existing and memory APA responses on the PK of PEGylated liposomes in humans. The mPBPK model suggested that PEG-liposomes administered to humans with an average amount of pre-existing APA i.e. ~50 ng/mL will circulate largely unaffected until the time of increased APA production, similar to the profile of pegloticase (Figure 6A). The similarity of PK profiles was driven by the same estimate that fewer than 5% of the total PEG-liposome dose would be opsonized by more than two APA over the first two days (Figure 6C). Upon the induction of further APA production beyond day 2, however, most liposomes were predicted to be quickly opsonized by 3+ APA molecules, leading to their rapid clearance from systemic circulation (Figure 6D).
Figure 6. The mPBPK model’s simulation of APA memory response’s effects on predicted PEG-liposome PK.
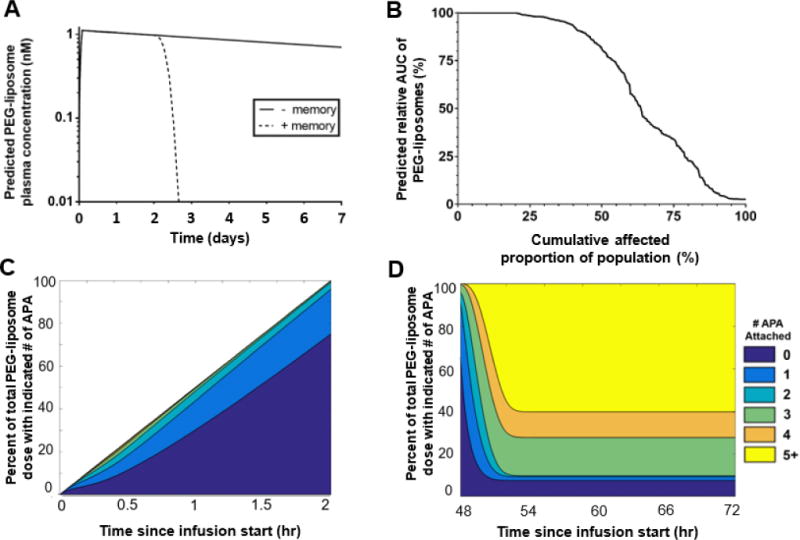
A) mPBPK model predictions of PEG-liposome concentrations administered to simulated patients with and without a memory APA response (initial dose 3.07 nmole). All patients were assumed to have 0.05μg/mL pre-existing APA. B) The predicted AUC of PEG-liposomes administered to simulated patients with antibody concentrations representing varying frequencies of prevalence among the population with no simulated memory response. C) and D): The predicted number of APA bound per PEG-liposome particle in a simulated patient from the “+ memory” group shown in panel A over the course of (C) a 2-hour intravenous drug infusion of PEG-liposomes or (D) between days 2 and 3 following administration. Further APA production was simulated to begin on day 2 and continue through the end of the simulation.
Discussion
Numerous clinical trials have demonstrated that the immune system can form specific antibodies against therapeutic molecules, i.e. ADA, which can directly reduce efficacy and/or trigger hypersensitivity reactions. APA represents an emerging class of ADA which appear to exhibit many of the classical attributes associated with ADA, with the notable exception that the induced antibodies are directed at PEG and thus can exist prior to the administration of the therapeutics. Although a number of mathematical models have been published [48, 49], quantitative insights into the interactions between ADA and their therapeutic targets, particularly in physiologically relevant contexts, remain very limited, as it is difficult to experimentally tease apart complex binding interactions in a living system. This motivated us to develop a mPBPK model that can theoretically approximate the kinetics of APA-mediated clearance of PEGylated drugs in both mouse and human studies. Our model shows that the circulation profiles of PEGylated drugs and liposomes are only likely to be impacted by high titers of APA. Patients with pre-existing APA around the median titer i.e. 50 ng/mL are expected to experience only a ~5-15% decrease in AUC relative to patients with no pre-existing APA. This finding is consistent with the clinical observations that the short-term circulation of PEGylated drugs (<2 days) is relatively consistent across patients. The discrepancies compared to animal studies reporting the ABC phenomenon is likely attributed to very high APA titers induced in animals, possibly to the tune of tens to hundreds of μg/mL of IgG and IgM APA that would be found in exceedingly few patients. Past clinical studies have correlated pre-existing APA with the incidence of AEs, finding that higher titer patients were generally more likely to exhibit AEs [18, 19, 24], and only those with the highest APA titers typically experienced SAEs.
Our findings are consistent with the notion that it is a memory APA response that drives the rapid elimination of PEGylated therapeutics. If APA acted equally upon all PEGylated medications, it would be expected that roughly the same fraction of patients would exhibit sensitivity to each PEGylated drug. Yet, not all PEGylated therapeutics are impacted by APA. Of the current 16 FDA-approved PEGylated therapeutics, only two have thus far been noted to suffer ABC and AEs in correlation with APA titers (although it remains unclear for PEGylated drugs that have failed to gain approval, how many of those failures could be attributed to APA, since APA levels have historically not been measured in clinical studies). To date, however, no reports have addressed this apparent inconsistency in the clinical impacts of APA. Since differences in PEGylated drugs cannot impact pre-existing APA levels, variations in APA-mediated elimination of PEGylated drugs is most likely attributed to differences in their capacity to stimulate production of APA to high titers. While our peak memory response of ~5 μg/mL APA is highly conservative (representing 0.05% of all IgG in the circulation [50]), we found that much of the impact on PK occurred at even lower APA levels (~1 μg/mL and greater).
We observed that APA induced an accumulation of PLD in the liver. This does not appear to be the result of a general increase in MPS activity, because we simultaneously measured an actual decrease in splenic accumulation of PLD in mice with APA. Instead, the shift toward hepatic clearance is consistent with the elimination of small immune complexes from the circulation by a combination of liver sinusoidal endothelial cells expressing FcγIIb, MPS, and erythrocytes’ binding to complement-opsonized particles via CR1 [45, 51]. Due to the physical forces of tissue homogenization necessary for analysis in our biodistribution studies, we were unable to discriminate whether doxorubicin present in the tissues remained encapsulated in PLD or released from the liposomes prior to hepatic clearance. Given that prior evidence has shown that released doxorubicin reaches concentrations in the spleen ~3.5x higher than the liver by the 24 hour timepoint [52], however, we believe it is far more likely that PEG-liposomes are directly eliminated from the plasma to the liver in the form of immune complexes containing intact liposomes.
Naturally occurring humoral responses generate polyclonal antibodies, which differ markedly from monoclonal antibodies in antigenic coverage, binding kinetics and the extent of surface coverage on a pathogen surface. Thus, it is generally much more accurate to model a polyclonal than monoclonal response with naturally occurring humoral immunity. Interestingly, in the case of PEG, induced antibodies typically bind to the repeating ethylene glycol units of the PEG backbone, which is identical throughout the PEG polymer. Thus, the binding coverage potential of a monoclonal anti-PEG antibody should be very similar to the coverage from a polyclonal serum preparation, a reality that other groups have exploited to develop monoclonal anti-PEG Ab standards for quantifying total polyclonal anti-PEG antibodies [20, 21].
As PEGylated therapeutics continue to gain popularity, there will inevitably be increasing instances where patients may be treated with multiple sensitizing PEGylated therapeutics. Consequently, it would not be surprising if APA responses induced by one PEGylated drug could cause ABC of a second PEGylated therapeutic administered while circulating APA titers are still elevated as a result of the first treatment. To ensure the safe and efficacious use of PEGylated drugs, we believe there will be increasing demand for the capacity to detect APA and adjust the dosing of PEGylated therapeutics accordingly. Furthermore, it will be important for physicians who regularly prescribe APA-sensitive drugs (such as pegloticase, pegaspargase, and investigational PEGylated compounds) to be aware of the issue of APA. We recently found that only roughly one quarter of physicians who regularly prescribe PEGylated therapeutics are aware that 1) PEG is part of those drugs, and 2) that patients can form antibodies against PEG [53]. Addressing this knowledge gap will be necessary to ensure the continued safe and efficacious use of PEGylated therapeutics.
Conclusions
The mPBPK model developed in this work was able to capture the impacts of APA on the pharmacokinetics of PEGylated entities in both humans and mice, thus providing a valuable tool for a personalized medicine approach to selecting doses and dosing regimens of PEGylated therapeutics in sensitized individuals. To realize this vision, a sensitive and specific method for predicting which patients (and for which PEGylated drugs) will lead to high titer memory APA responses, as well as data on the extent of APA produced by an anti-PEG memory response, would both be necessary. Incorporation of these insights would allow us to further enhance the usefulness and translational potential of our current mPBPK model.
Supplementary Material
Acknowledgments
Funding
This work was supported by a National Science Foundation Graduate Research Fellowship (MDM), The David and Lucile Packard Foundation (2013-39274, SKL), National Institutes of Health (R21EB017938; SKL), UNC Research Opportunities Initiative grant in Pharmacoengineering (SKL), and startup funds from the Eshelman School of Pharmacy and Lineberger Comprehensive Cancer Center (SKL). National Institutes of Health (R35 GM119661; YC). MGF was supported in part from the National Science Foundation (NSF) DMS-1462992, DMS-1412844, DMS-1517274, DMS-1664645.
Footnotes
Publisher's Disclaimer: This is a PDF file of an unedited manuscript that has been accepted for publication. As a service to our customers we are providing this early version of the manuscript. The manuscript will undergo copyediting, typesetting, and review of the resulting proof before it is published in its final citable form. Please note that during the production process errors may be discovered which could affect the content, and all legal disclaimers that apply to the journal pertain.
Conflict of Interest
The authors have no conflicts of interest to disclose.
References
- 1.van Vlerken LE, Vyas TK, Amiji MM. Poly(ethylene glycol)-modified nanocarriers for tumor-targeted and intracellular delivery. Pharm Res. 2007;24(8):1405–14. doi: 10.1007/s11095-007-9284-6. [DOI] [PubMed] [Google Scholar]
- 2.Senior J, et al. Influence of surface hydrophilicity of liposomes on their interaction with plasma protein and clearance from the circulation: studies with poly(ethylene glycol)-coated vesicles. Biochim Biophys Acta. 1991;1062(1):77–82. doi: 10.1016/0005-2736(91)90337-8. [DOI] [PubMed] [Google Scholar]
- 3.Klibanov AL, et al. Amphipathic polyethyleneglycols effectively prolong the circulation time of liposomes. FEBS Lett. 1990;268(1):235–7. doi: 10.1016/0014-5793(90)81016-h. [DOI] [PubMed] [Google Scholar]
- 4.Owens DE, 3rd, Peppas NA. Opsonization, biodistribution, and pharmacokinetics of polymeric nanoparticles. Int J Pharm. 2006;307(1):93–102. doi: 10.1016/j.ijpharm.2005.10.010. [DOI] [PubMed] [Google Scholar]
- 5.Jokerst JV, et al. Nanoparticle PEGylation for imaging and therapy. Nanomedicine (Lond) 2011;6(4):715–28. doi: 10.2217/nnm.11.19. [DOI] [PMC free article] [PubMed] [Google Scholar]
- 6.Armstrong JK. The occurrence, induction, specificity and potential effect of antibodies against poly(ethylene glycol) In: Veronese FM, editor. PEGylated Protein Drugs: Basic Science and Clinical Applications. Birkhäuser Basel; Basel: 2009. pp. 147–168. [Google Scholar]
- 7.Milla P, Dosio F, Cattel L. PEGylation of proteins and liposomes: a powerful and flexible strategy to improve the drug delivery. Curr Drug Metab. 2012;13(1):105–19. doi: 10.2174/138920012798356934. [DOI] [PubMed] [Google Scholar]
- 8.Ishida T, et al. Accelerated blood clearance of PEGylated liposomes upon repeated injections: effect of doxorubicin-encapsulation and high-dose first injection. J Control Release. 2006;115(3):251–8. doi: 10.1016/j.jconrel.2006.08.017. [DOI] [PubMed] [Google Scholar]
- 9.Yang Q, Lai SK. Anti-PEG immunity: emergence, characteristics, and unaddressed questions. Wiley Interdiscip Rev Nanomed Nanobiotechnol. 2015;7(5):655–77. doi: 10.1002/wnan.1339. [DOI] [PMC free article] [PubMed] [Google Scholar]
- 10.Zhang P, et al. Anti-PEG antibodies in the clinic: Current issues and beyond PEGylation. J Control Release. 2016;244(Pt B):184–193. doi: 10.1016/j.jconrel.2016.06.040. [DOI] [PMC free article] [PubMed] [Google Scholar]
- 11.Richter AW, Akerblom E. Antibodies against polyethylene glycol produced in animals by immunization with monomethoxy polyethylene glycol modified proteins. Int Arch Allergy Appl Immunol. 1983;70(2):124–31. doi: 10.1159/000233309. [DOI] [PubMed] [Google Scholar]
- 12.Ishida T, et al. PEGylated liposomes elicit an anti-PEG IgM response in a T cell-independent manner. J Control Release. 2007;122(3):349–55. doi: 10.1016/j.jconrel.2007.05.015. [DOI] [PubMed] [Google Scholar]
- 13.Mima Y, et al. Anti-PEG IgM Is a Major Contributor to the Accelerated Blood Clearance of Polyethylene Glycol-Conjugated Protein. Mol Pharm. 2015;12(7):2429–35. doi: 10.1021/acs.molpharmaceut.5b00144. [DOI] [PubMed] [Google Scholar]
- 14.Ichihara M, et al. Anti-PEG IgM Response against PEGylated Liposomes in Mice and Rats. Pharmaceutics. 2011;3(1):1–11. doi: 10.3390/pharmaceutics3010001. [DOI] [PMC free article] [PubMed] [Google Scholar]
- 15.Cheng TL, et al. Accelerated clearance of polyethylene glycol-modified proteins by anti-polyethylene glycol IgM. Bioconjug Chem. 1999;10(3):520–8. doi: 10.1021/bc980143z. [DOI] [PubMed] [Google Scholar]
- 16.Armstrong JK, et al. Antibody against poly(ethylene glycol) adversely affects PEG-asparaginase therapy in acute lymphoblastic leukemia patients. Cancer. 2007;110(1):103–11. doi: 10.1002/cncr.22739. [DOI] [PubMed] [Google Scholar]
- 17.Hershfield MS, et al. Induced and pre-existing anti-polyethylene glycol antibody in a trial of every 3-week dosing of pegloticase for refractory gout, including in organ transplant recipients. Arthritis Research & Therapy. 2014;16(2):R63–R63. doi: 10.1186/ar4500. [DOI] [PMC free article] [PubMed] [Google Scholar]
- 18.Ganson NJ, et al. Pre-existing anti-polyethylene glycol antibody linked to first-exposure allergic reactions to pegnivacogin, a PEGylated RNA aptamer. J Allergy Clin Immunol. 2016;137(5):1610–1613.e7. doi: 10.1016/j.jaci.2015.10.034. [DOI] [PMC free article] [PubMed] [Google Scholar]
- 19.Povsic TJ, et al. Pre-existing anti-PEG antibodies are associated with severe immediate allergic reactions to pegnivacogin, a PEGylated aptamer. Journal of Allergy and Clinical Immunology. 2016;138(6):1712–1715. doi: 10.1016/j.jaci.2016.04.058. [DOI] [PubMed] [Google Scholar]
- 20.Yang Q, et al. Analysis of Pre-existing IgG and IgM Antibodies against Polyethylene Glycol (PEG) in the General Population. Anal Chem. 2016;88(23):11804–11812. doi: 10.1021/acs.analchem.6b03437. [DOI] [PMC free article] [PubMed] [Google Scholar]
- 21.Chen BM, et al. Measurement of Pre-Existing IgG and IgM Antibodies against Polyethylene Glycol in Healthy Individuals. Analytical Chemistry. 2016;88(21):10661–10666. doi: 10.1021/acs.analchem.6b03109. [DOI] [PubMed] [Google Scholar]
- 22.Garay RP, et al. Antibodies against polyethylene glycol in healthy subjects and in patients treated with PEG-conjugated agents. Expert Opin Drug Deliv. 2012;9(11):1319–23. doi: 10.1517/17425247.2012.720969. [DOI] [PubMed] [Google Scholar]
- 23.Lipsky PE, et al. Pegloticase immunogenicity: the relationship between efficacy and antibody development in patients treated for refractory chronic gout. Arthritis Res Ther. 2014;16(2):R60. doi: 10.1186/ar4497. [DOI] [PMC free article] [PubMed] [Google Scholar]
- 24.Hershfield MS, et al. Induced and pre-existing anti-polyethylene glycol antibody in a trial of every 3-week dosing of pegloticase for refractory gout, including in organ transplant recipients. Arthritis Res Ther. 2014;16(2):R63. doi: 10.1186/ar4500. [DOI] [PMC free article] [PubMed] [Google Scholar]
- 25.Peters SA, Ungell AL, Dolgos H. Physiologically based pharmacokinetic (PBPK) modeling and simulation: applications in lead optimization. Curr Opin Drug Discov Devel. 2009;12(4):509–18. [PubMed] [Google Scholar]
- 26.Leong R, et al. Regulatory experience with physiologically based pharmacokinetic modeling for pediatric drug trials. Clin Pharmacol Ther. 2012;91(5):926–31. doi: 10.1038/clpt.2012.19. [DOI] [PubMed] [Google Scholar]
- 27.Sinha V, et al. Physiologically based pharmacokinetic modeling: from regulatory science to regulatory policy. Clin Pharmacol Ther. 2014;95(5):478–80. doi: 10.1038/clpt.2014.46. [DOI] [PubMed] [Google Scholar]
- 28.Wagner C, et al. Predicting the effect of cytochrome P450 inhibitors on substrate drugs: analysis of physiologically based pharmacokinetic modeling submissions to the US Food and Drug Administration. Clin Pharmacokinet. 2015;54(1):117–27. doi: 10.1007/s40262-014-0188-4. [DOI] [PubMed] [Google Scholar]
- 29.Vieira MD, et al. PBPK model describes the effects of comedication and genetic polymorphism on systemic exposure of drugs that undergo multiple clearance pathways. Clin Pharmacol Ther. 2014;95(5):550–7. doi: 10.1038/clpt.2014.43. [DOI] [PubMed] [Google Scholar]
- 30.Wagner C, et al. Application of Physiologically Based Pharmacokinetic (PBPK) Modeling to Support Dose Selection: Report of an FDA Public Workshop on PBPK. CPT Pharmacometrics Syst Pharmacol. 2015;4(4):226–30. doi: 10.1002/psp4.33. [DOI] [PMC free article] [PubMed] [Google Scholar]
- 31.Zhuang X, Lu C. PBPK modeling and simulation in drug research and development. Acta Pharmaceutica Sinica B. 2016;6(5):430–440. doi: 10.1016/j.apsb.2016.04.004. [DOI] [PMC free article] [PubMed] [Google Scholar]
- 32.Cao Y, Balthasar JP, Jusko WJ. Second-generation minimal physiologically-based pharmacokinetic model for monoclonal antibodies. J Pharmacokinet Pharmacodyn. 2013;40(5):597–607. doi: 10.1007/s10928-013-9332-2. [DOI] [PMC free article] [PubMed] [Google Scholar]
- 33.Cao Y, Jusko WJ. Applications of minimal physiologically-based pharmacokinetic models. J Pharmacokinet Pharmacodyn. 2012;39(6):711–23. doi: 10.1007/s10928-012-9280-2. [DOI] [PMC free article] [PubMed] [Google Scholar]
- 34.Gabizon A, Shiota R, Papahadjopoulos D. Pharmacokinetics and tissue distribution of doxorubicin encapsulated in stable liposomes with long circulation times. J Natl Cancer Inst. 1989;81(19):1484–8. doi: 10.1093/jnci/81.19.1484. [DOI] [PubMed] [Google Scholar]
- 35.Amselem S, Gabizon A, Barenholz Y. Optimization and upscaling of doxorubicin-containing liposomes for clinical use. J Pharm Sci. 1990;79(12):1045–52. doi: 10.1002/jps.2600791202. [DOI] [PubMed] [Google Scholar]
- 36.Petschauer JS, et al. The effects of nanoparticle drug loading on the pharmacokinetics of anticancer agents. Nanomedicine (London, England) 2015;10(3):447–463. doi: 10.2217/nnm.14.179. [DOI] [PMC free article] [PubMed] [Google Scholar]
- 37.Zamboni WC, et al. Plasma, tumor, and tissue disposition of STEALTH liposomal CKD-602 (S-CKD602) and nonliposomal CKD-602 in mice bearing A375 human melanoma xenografts. Clin Cancer Res. 2007;13(23):7217–23. doi: 10.1158/1078-0432.CCR-07-1035. [DOI] [PubMed] [Google Scholar]
- 38.Song G, et al. Effects of tumor microenvironment heterogeneity on nanoparticle disposition and efficacy in breast cancer tumor models. Clin Cancer Res. 2014;20(23):6083–95. doi: 10.1158/1078-0432.CCR-14-0493. [DOI] [PMC free article] [PubMed] [Google Scholar]
- 39.Anders CK, et al. Pharmacokinetics and efficacy of PEGylated liposomal doxorubicin in an intracranial model of breast cancer. PLoS One. 2013;8(5):e61359. doi: 10.1371/journal.pone.0061359. [DOI] [PMC free article] [PubMed] [Google Scholar]
- 40.Bergeron BP, Greenes RA. Modeling and Simulation in Medicine: The State of the Art. Proceedings of the Annual Symposium on Computer Application in Medical Care. 1988:282–286. [Google Scholar]
- 41.Rojas JR, et al. Formation, distribution, and elimination of infliximab and anti-infliximab immune complexes in cynomolgus monkeys. J Pharmacol Exp Ther. 2005;313(2):578–85. doi: 10.1124/jpet.104.079277. [DOI] [PubMed] [Google Scholar]
- 42.Ahlstedt S, Holmgren J, Hanson LÅ. The primary and secondary antibody response to Escherichia coli O6 lipopolysaccharide analysed at the humoral and cellular level: Amount and avidity of the antibodies in relation to protective capacity. Immunology. 1973;24(2):191–202. [PMC free article] [PubMed] [Google Scholar]
- 43.Gysin J, Fandeur T, Pereira da Silva L. Kinetics of the humoral immune response to blood-induced falciparum malaria in the squirrel monkey Saimiri sciureus. Ann Immunol (Paris) 1982;133d(1):95–102. [PubMed] [Google Scholar]
- 44.Cornacoff JB, et al. Primate erythrocyte-immune complex-clearing mechanism. Journal of Clinical Investigation. 1983;71(2):236–247. doi: 10.1172/JCI110764. [DOI] [PMC free article] [PubMed] [Google Scholar]
- 45.Ganesan LP, et al. FcγRIIb on liver sinusoidal endothelium clears small immune complexes. Journal of immunology (Baltimore, Md: 1950) 2012;189(10):4981–4988. doi: 10.4049/jimmunol.1202017. [DOI] [PMC free article] [PubMed] [Google Scholar]
- 46.Halma C, Daha MR, van Es LA. In vivo clearance by the mononuclear phagocyte system in humans: an overview of methods and their interpretation. Clinical and Experimental Immunology. 1992;89(1):1–7. doi: 10.1111/j.1365-2249.1992.tb06868.x. [DOI] [PMC free article] [PubMed] [Google Scholar]
- 47.Tegla CA, et al. MEMBRANE ATTACK BY COMPLEMENT: THE ASSEMBLY AND BIOLOGY OF TERMINAL COMPLEMENT COMPLEXES. Immunologic research. 2011;51(1):45–60. doi: 10.1007/s12026-011-8239-5. [DOI] [PMC free article] [PubMed] [Google Scholar]
- 48.Gomez-Mantilla JD, et al. Review on modeling anti-antibody responses to monoclonal antibodies. J Pharmacokinet Pharmacodyn. 2014;41(5):523–36. doi: 10.1007/s10928-014-9367-z. [DOI] [PubMed] [Google Scholar]
- 49.Chen X, et al. A mathematical model of the effect of immunogenicity on therapeutic protein pharmacokinetics. Aaps J. 2013;15(4):1141–54. doi: 10.1208/s12248-013-9517-z. [DOI] [PMC free article] [PubMed] [Google Scholar]
- 50.Gonzalez-Quintela A, et al. Serum levels of immunoglobulins (IgG, IgA, IgM) in a general adult population and their relationship with alcohol consumption, smoking and common metabolic abnormalities. Clinical and Experimental Immunology. 2008;151(1):42–50. doi: 10.1111/j.1365-2249.2007.03545.x. [DOI] [PMC free article] [PubMed] [Google Scholar]
- 51.Cosio FG, et al. Clearance of human antibody/DNA immune complexes and free DNA from the circulation of the nonhuman primate. Clin Immunol Immunopathol. 1987;42(1):1–9. doi: 10.1016/0090-1229(87)90167-x. [DOI] [PubMed] [Google Scholar]
- 52.Working PK, et al. Pharmacokinetics, Biodistribution and Therapeutic Efficacy of Doxorubicin Encapsulated in Stealth® Liposomes (Doxil®) Journal of Liposome Research. 1994;4(1):667–687. [Google Scholar]
- 53.McSweeney MD, et al. Physician Awareness of Immune Responses to Polyethylene Glycol-Drug Conjugates. Clinical and Translational Science. 2018:n/a–n/a. doi: 10.1111/cts.12537. [DOI] [PMC free article] [PubMed] [Google Scholar]
- 54.Berson SA. Blood Volume in Health and Disease. Bulletin of the New York Academy of Medicine. 1954;30(10):750–776. [PMC free article] [PubMed] [Google Scholar]
- 55.Feldschuh J, Enson Y. Prediction of the normal blood volume. Relation of blood volume to body habitus. Circulation. 1977;56(4 Pt 1):605–12. doi: 10.1161/01.cir.56.4.605. [DOI] [PubMed] [Google Scholar]
- 56.Arthur C, Guyton JEH. Textbook of Medical Physiology. 11th. 2006. [Google Scholar]
- 57.Dirks NL, Meibohm B. Population pharmacokinetics of therapeutic monoclonal antibodies. Clin Pharmacokinet. 2010;49(10):633–59. doi: 10.2165/11535960-000000000-00000. [DOI] [PubMed] [Google Scholar]
- 58.Ritschel WA, et al. The allometric approach for interspecies scaling of pharmacokinetic parameters. Comp Biochem Physiol C. 1992;103(2):249–53. doi: 10.1016/0742-8413(92)90003-p. [DOI] [PubMed] [Google Scholar]
- 59.Wang W, Prueksaritanont T. Prediction of human clearance of therapeutic proteins: simple allometric scaling method revisited. Biopharm Drug Dispos. 2010;31(4):253–63. doi: 10.1002/bdd.708. [DOI] [PubMed] [Google Scholar]
- 60.Gabizon A, Shmeeda H, Barenholz Y. Pharmacokinetics of pegylated liposomal Doxorubicin: review of animal and human studies. Clin Pharmacokinet. 2003;42(5):419–36. doi: 10.2165/00003088-200342050-00002. [DOI] [PubMed] [Google Scholar]
Associated Data
This section collects any data citations, data availability statements, or supplementary materials included in this article.