Abstract
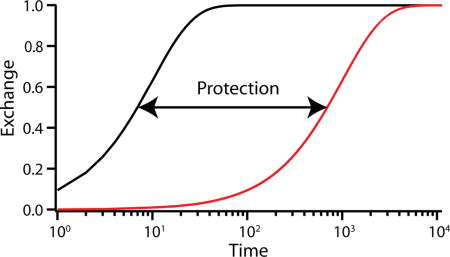
The analysis of many hydrogen exchange (HX) experiments depends on knowledge of exchange rates expected for the unstructured protein under the same conditions. We present here some minor adjustments to previously calibrated values and a stringent test of their accuracy.
Graphical abstract

Introduction
Hydrogen exchange (HX) methods can now provide detailed information about protein structure, structure change, interactions, folding, energetics, and dynamics in solution under any chosen conditions resolved to near amino acid levels [1–8]. The evaluation of structure-dependent effects depends on knowing the HX rates expected for the unprotected structure-free situation. Free peptide HX rates have been calibrated as a function of their important determinants - pH, temperature, nearest neighbor effects, isotope effects, and salt concentration [9, 10]. The detailed accuracy of these values has been ambiguous. This paper considers these values, describes minor adjustments, and demonstrates their reliability.
The reference rate
Calculation of the expected HX rate for any individual main chain amide is based on the reference value for an amide between two alanine residues in an unstructured peptide under the existing conditions and the superimposed effects of nearest neighbor side chains. For the Ala-Ala reference rate, our previous calibrations used main chain amide HX rates measured by 1D NMR for poly-D,L-alanine (PDLA). We assume PDLA to adopt a random coil conformation in solution. (Note: This is not necessarily identical to “disordered” real proteins in native conditions which tend to show a low level of protection against HX [11].
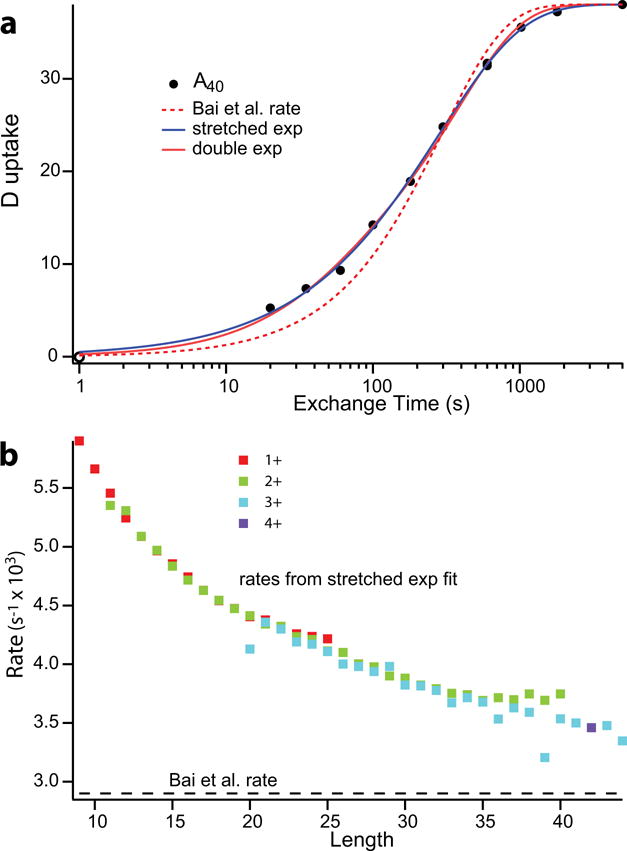
In previous calibrations a surprising anomaly was observed. HX rate varies with the size of the reference molecule. Polymeric PDLA showed 2-fold slower HX rates than a blocked tri-alanine oligomer, perhaps due to their different diffusivities. The present work used a mass spectrometric method (HX MS) [8] to resolve HX rates through a population of PDLA molecules that vary in size from 9 to 44 residues. Fig. 1A shows the exchange curve for Ala40. Interestingly, HX is not single exponential. It can be well fit by either a double exponential or a stretched single exponential (D = D0(1−exp(−(kext)β))) with β = 0.74. Evidently the HX rate of any main chain amide depends on whether adjacent residues have the same or opposite chirality. Fig. 1B shows the stretched exponential rate constant for PDLA peptides as a function of peptide length, which confirms the size effect seen before.
Figure 1.

PDLA exchange: (a) Deuterium uptake of a 40 residue peptide from random heterogeneously polymerized D,L-alanine. PDLA samples were exposed to H to D exchange (15°C in 90% D2O at pDread of 4.01) for increasing times, samples quenched at pH 2.4, 0°C to essentially halt exchange, and injected into an online sytem where they were desalted on a small C8 column, and separated by size in a C18 column. The eluant was introduced by electrospray into a Thermo LTQ Orbitrap XL mass spectrometer which further separates peptides by mass and allows time-dependent deuterium uptake of the differently sized PDLA peptides to be measured. Deuterium loss due to back exchange during the analysis was corrected for using an “all D” sample initially fully exchanged in the same buffer. The point shown at 1 sec is a zero time control which was injected immediately after simultaneous addition of quench and D2O buffer. The dashed line shows the single exponential rate predicted from the Bai et al. parameters for large poly peptides. The blue and red solid lines show single stretched exponential and double exponential fits. (b) Stretched exponential rates as a function of PDLA polymer length. The dashed line along the bottom indicates the reference rate from Bai et al. (9) for large poly peptides.
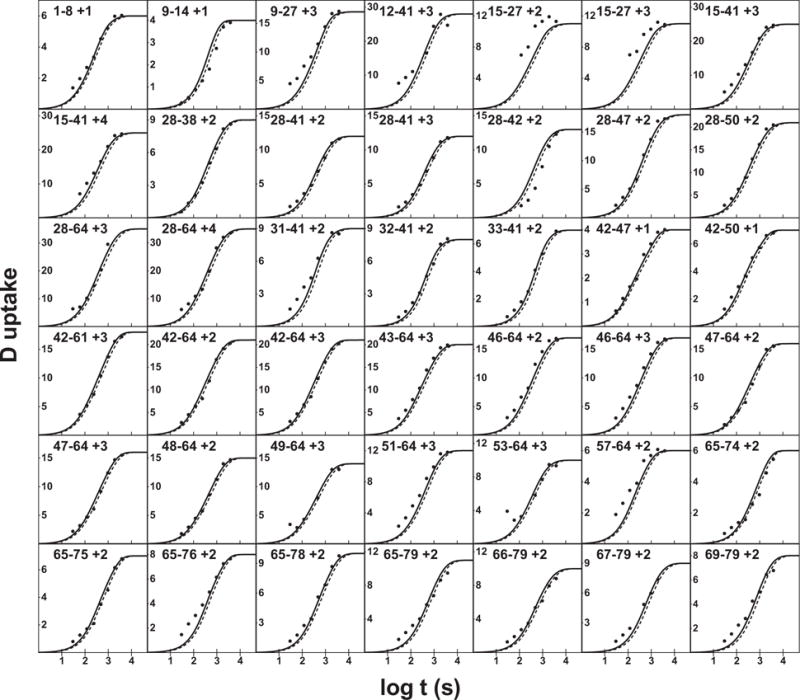
However, the non-single exponential kinetics of PDLA presents a question. What value should be used for the reference rate constant of protein amides? We compared these results with HX MS data measured for a protein, apolipoprotein C3, under conditions where it is wholly unstructured (Fig. 2). In calculating pD we added 0.36 to the pH meter reading rather than 0.40 [12] to account for the 90% D2O present. An increase of the reference rate previously used by the small factor of 1.35 brings the predicted rate into excellent agreement with the apoC3 data. Except for short outlier peptides that are significantly affected by the histidine residue at position 18, the average deviation is very small, 7%.
Figure 2.

Exchange curves for peptides obtained by HX MS for unstructured apolipoprotein C3 (90% D2O, pDread 4.10, 5°C). Samples were analyzed as for PDLA in Fig. 1 with the addition of an online pepsin digest. Peptides are identified by their sequence position in apoC3 and charge state in the MS. The expected free peptide exchange curves calculated with the original Bai et al. & Connelly et al. (9, 10) parameters are shown as a dashed line. The solid line uses the newly recommended value for the reference alanine rate (Table 1) and side chain effects described here (Table 2).
Table 1 lists the reference rate parameters from Connelly et al. [10] including this adjustment. Our readjusted HX rate spreadsheets (Online Resource) use this reference value to calculate expected protein amide HX rates and are also updated for the amino acid-level effects described below.
Table 1.
Reference Ala-Ala rate for unfolded protein corrected to 20°C. Newly adjusted rates are in bold.
| log10kA M−1 min−1 | log10kB M−1 min−1 | log10kW M−1 min−1 | |
|---|---|---|---|
| NH/D2O | 1.62 | 10.18 | −1.50 |
| ND/H2O | 1.40 | 10.00 | −1.60 |
| NH/H2O | 1.39 | 10.08 |
Amino acid side chain effects
Previous work calibrated the effect on the HX rate of any main chain amide due to its nearby amino acid side chains [9, 10]. Effects extend only to the nearest neighbor amide and can be accurately computed as the combined multiplicative effects of the side chains to the right and left.
Additional amino acid-level issues have since become clear. Among many other tests of our calibrations, Mori et al. [13] have accurately evaluated side chain effects in NMR studies of unstructured Δ131Δ staphylococcal nuclease. They found that, at neutral pH where Asp and Glu side chains are deprotonated, our previous reference rate correction factor led to predicted rates that are low (in the context of the Bai et al. alanine base rate) by about 2.5-fold for the amide before the side chain (“Left” in the notation of Bai et al.). In the earlier calibrating work [9, 10] side chain effects were evaluated at low pH where exchange is conveniently slow to allow accurate rate measurements. Calibration for the Asp and Glu effects at higher pH where their side chains are deprotonated used a different less precise NMR method. Mori et al. [13] also decided that the previous effect of a neighboring Gly side chain is too high by a factor of ~1.5 in rate. In the context of the above revised alanine reference rate, the L effect of deprotonated Glu and Asp should be faster by a factor of 1.85 and Gly slower by a factor of 2.0 compared to the factors from Bai et al. Table 2 reproduces Table 2 from Bai et al. [9] with these changes included.
Table 2.
Effect of amino acid side chains on the HX rates of neighboring peptides, given as Log10kex(X)-Log10kex(Ala). The modified L Base reference rate factors for Gly and deprotonated Asn and Glu are shown in bold. The other values are as in Bai et al. (9). L refers to the effect of that side chain on the exchange rate of the amide to its immediate left, toward the N-terminus. R refers to the effect on the amide toward the C-terminus, separated by an intervening carbonyl.
| Acid | Base | |||
|---|---|---|---|---|
| Side chain | L | R | L | R |
| Ala | 0.00 | 0.00 | 0.00 | 0.00 |
| Arg | −0.59 | −0.32 | 0.08 | 0.22 |
| Asn | −0.58 | −0.13 | 0.49 | 0.32 |
| Asp(COO−) | 0.90 | 0.58 | 0.10 | −0.18 |
| Asp(COOH) | −0.90 | −0.12 | 0.69 | 0.60 |
| Cys | −0.54 | −0.46 | 0.62 | 0.55 |
| Cys2 | −0.74 | −0.58 | 0.55 | 0.46 |
| GlY | −0.22 | 0.22 | −0.03 | 0.17 |
| Gln | −0.47 | −0.27 | 0.06 | 0.20 |
| Glu(COO−) | −0.90 | 0.31 | −0.11 | −0.15 |
| Glu(COOH) | −0.60 | −0.27 | 0.24 | 0.39 |
| His | −0.10 | 0.14 | ||
| His+ | −0.80 | −0.51 | 0.80 | 0.83 |
| Ile | −0.91 | −0.59 | −0.73 | −0.23 |
| Leu | −0.57 | −0.13 | −0.58 | −0.21 |
| Lys | −0.56 | −0.29 | −0.04 | 0.12 |
| Met | −0.64 | −0.28 | −0.01 | 0.11 |
| Phe | −0.52 | −0.43 | −0.24 | 0.06 |
| Pro(trans) | −0.19 | −0.24 | ||
| Pro(cis) | −0.85 | 0.60 | ||
| Ser | −0.44 | −0.39 | 0.37 | 0.30 |
| Thr | −0.79 | −0.47 | −0.07 | 0.20 |
| Trp | −0.40 | −0.44 | −0.41 | −0.11 |
| Tyr | −0.41 | −0.37 | −0.27 | 0.05 |
| Val | −0.74 | −0.30 | −0.70 | −0.14 |
| N-term (NH3+) | −1.32 | 1.62 | ||
| C-term (COO−) | 0.96 | −1.80 | ||
| C-term (COOH) | 0.05 | |||
Some other side chain issues are of interest. It appears that the protonated histidine side chain can modestly catalyze HX of nearby amides beyond its nearest neighbors. We assume that this effect functions through acid catalysis of nearby amides but the size of the effect and its reach are unknown. Results in Fig. 2 for the shorter peptides containing His18 show that the effect is real and detectable.
Previous work showed that, like all other polar side chain protons, the NδH of the Arg side chain will be rapidly labeled in the usual protein experiment done above pH ~5 but it can be slow at pH 2 to 4 where the HX MS fragment analysis is done. Therefore, unlike all other polar side chains, residual Arg side chain label may not be totally lost due to back exchange during the HX MS analysis.
Finally, polymer end effects occur. These are generally not important for whole protein HX but can affect back exchange results for the many much smaller fragments during HX MS analysis. Earlier work showed that hydroxide-catalyzed exchange of an oligopeptide C-terminal amide is slowed by about 40-fold in addition to the standard effect of the neighboring side chain [14]. Similarly, hydroxide-catalysis of the first amide NH (amide of residue #2) in an oligopeptide is faster by about 40-fold at elevated pH under hydroxide catalysis. At pH 2.5 usually used during the HX MS analysis step, the intrinsic back exchange rate at amino acid residue #2 is ~10-fold faster than it would be further from the N-terminal. As a result, its amide NH will experience relatively fast back exchange during the analysis stage of HX MS experimentation. It is often assumed that back exchange will be complete at that position but slowing due to the effect of large apolar side chains at the first two positions, especially I, L, P, V, & W may prevent complete back exchange, as illustrated in Figure 5 of Engen & Wales [3]
Detailed methods for calculating free peptide HX rates using these parameters including temperature effects are given in Bai et al. [9] and Connelly et al. [10]. Excel spreadsheets incorporating these adjustments are available as an online resource and at http://HX2.med.upenn.edu.
Supplementary Material
Acknowledgments
This work was supported by research grants from the NIH (GM031846), NSF (MCB1020649), and the G. Harold and Leila Y. Mathers Charitable Foundation.
References
- 1.Gallagher ES, Hudgens JW. Mapping Protein-Ligand Interactions with Proteolytic Fragmentation, Hydrogen/Deuterium Exchange-Mass Spectrometry. Methods Enzymol. 2016;566:357–404. doi: 10.1016/bs.mie.2015.08.010. [DOI] [PubMed] [Google Scholar]
- 2.Brock A. Fragmentation hydrogen exchange mass spectrometry: a review of methodology and applications. Protein Expr Purif. 2012;84:19–37. doi: 10.1016/j.pep.2012.04.009. [DOI] [PubMed] [Google Scholar]
- 3.Engen JR, Wales TE. Analytical Aspects of Hydrogen Exchange Mass Spectrometry. Annu Rev Anal Chem (Palo Alto Calif) 2015;8:127–148. doi: 10.1146/annurev-anchem-062011-143113. [DOI] [PMC free article] [PubMed] [Google Scholar]
- 4.Englander SW. Hydrogen exchange mass spectrometry: A historical perspective. J Am Soc Mass Spectrom. 2006;17:1481–1489. doi: 10.1016/j.jasms.2006.06.006. [DOI] [PMC free article] [PubMed] [Google Scholar]
- 5.Jaswal SS. Biological insights from hydrogen exchange mass spectrometry. Biochim Biophys Acta. 2013;1834:1188–1201. doi: 10.1016/j.bbapap.2012.10.011. [DOI] [PubMed] [Google Scholar]
- 6.Kaltashov IA, Bobst CE, Abzalimov RR. Mass spectrometry-based methods to study protein architecture and dynamics. Protein Sci. 2013;22:530–544. doi: 10.1002/pro.2238. [DOI] [PMC free article] [PubMed] [Google Scholar]
- 7.Konermann L, Pan J, Liu YH. Hydrogen exchange mass spectrometry for studying protein structure and dynamics. Chem Soc Rev. 2011;40:1224–1234. doi: 10.1039/c0cs00113a. [DOI] [PubMed] [Google Scholar]
- 8.Mayne L. Hydrogen Exchange Mass Spectrometry. Methods Enzymol. 2016;566:335–356. doi: 10.1016/bs.mie.2015.06.035. [DOI] [PMC free article] [PubMed] [Google Scholar]
- 9.Bai Y, Milne JS, Mayne L, Englander SW. Primary structure effects on peptide group hydrogen exchange. Proteins. 1993;17:75–86. doi: 10.1002/prot.340170110. [DOI] [PMC free article] [PubMed] [Google Scholar]
- 10.Connelly GP, Bai Y, Jeng MF, Englander SW. Isotope effects in peptide group hydrogen exchange. Proteins. 1993;17:87–92. doi: 10.1002/prot.340170111. [DOI] [PubMed] [Google Scholar]
- 11.Ye X, Mayne L, Kan ZY, Englander SW. Folding of maltose binding protein outside of and in GroEL. Proc Natl Acad SciUS A. 2018;115:519–524. doi: 10.1073/pnas.1716168115. [DOI] [PMC free article] [PubMed] [Google Scholar]
- 12.Glasoe PK, Long FA. Use of Glass Electrodes to Measure Acidities in Deuterium Oxide. J Phys Chem-Us. 1960;64:188–190. [Google Scholar]
- 13.Mori S, van Zijl PC, Shortle D. Measurement of water-amide proton exchange rates in the denatured state of staphylococcal nuclease by a magnetization transfer technique. Proteins. 1997;28:325–332. [PubMed] [Google Scholar]
- 14.Molday RS, Englander SW, Kallen RG. Primary structure effects on peptide group hydrogen exchange. Biochemistry. 1972;11:150–158. doi: 10.1021/bi00752a003. [DOI] [PubMed] [Google Scholar]
Associated Data
This section collects any data citations, data availability statements, or supplementary materials included in this article.


