Abstract
Fast Photochemical Oxidation of Proteins (FPOP) may be used to characterize changes in protein structure by measuring differences in the apparent rate of peptide oxidation by hydroxyl radicals. The variability between replicates is high for some peptides and limits the statistical power of the technique, even using modern methods controlling variability in radical dose and quenching. Currently, the root cause of this variability has not been systematically explored, and it is unknown if the major source(s) of variability are structural heterogeneity in samples, remaining irreproducibility in FPOP oxidation, or errors in LC-MS quantification of oxidation. In this work, we demonstrate that coefficient of variation of FPOP measurements varies widely at low peptide signal intensity, but stabilizes to ≈0.13 at higher peptide signal intensity. We dramatically reduced FPOP variability by increasing the total sample loaded onto the LC column, indicating that the major source of variability in FPOP measurements is the difficulties in quantifying oxidation at low peptide signal intensities. This simple method greatly increases the sensitivity of FPOP structural comparisons, an important step in applying the technique to study subtle conformational changes and protein-ligand interactions.
Graphical Abstract
Introduction
Hydroxyl radical protein footprinting (HRPF) by FPOP is a technique that measures the apparent rate of protein oxidation by freely diffusing hydroxyl radicals, and correlates changes in this apparent rate with changes in the solvent accessibility of the protein oxidation target [1]. This technique has been applied in a number of applications, including protein-protein interaction, protein folding, protein-ligand binding, and membrane protein topography [2–5]. Each set of FPOP experiments is performed in replicates to allow for modeling of error, allowing for changes in apparent oxidation to be measured for statistical significance. Reliable interpretation of FPOP data relies on strong statistics to ensure both sensitivity and specificity. However, the higher variability between replicates greatly impacts applied statistics by introducing error into the data and decreasing the ability to reliably reject the null hypothesis (i.e. detect relatively small differences in apparent rates of oxidation).
FPOP data acquisition and analysis involves three major potential sources of variability: (1) inherent structural variability from replicate to replicate; (2) variability in the radical exposure process (e.g. variable light fluence, variable radical half-life, variable post-irradiation quenching, etc.); (3) variability in post-oxidation sample measurement by LC-MS(/MS) (e.g. variable tryptic digestion efficiency, variable instrument response). Considerable effort has gone into identifying and correcting major sources of error in labeling-induced artifacts [6], reproducible and measurable radical generation and scavenging [7, 8], and proper methods for quenching of secondary oxidants [9, 10]. However, even after including these advances in methodology, FPOP studies where the coefficient of variation of oxidation (CV) of some peptides is much higher than that of the other peptides in the sample is still frequently reported by leading groups in the field, often reaching a CV 0.6 or higher [5, 11–14]. Understanding the major source(s) of observed variability is crucial in correcting such variability and improving the sensitivity of the technique.
Here, the root of this remaining variation was explored using ten different proteins on which the FPOP was performed in our laboratory. Correlation of FPOP CV with spectral characteristics quickly revealed a strong correlation between FPOP oxidation CV and the total signal intensity of all oxidized and unoxidized versions of the peptide (average summed peptide intensity, ΣPI) across all ten proteins tested. By injecting different amounts of sample to increase ΣPI within the same sample, we tested the causality of signal intensity to CV and found that increasing the sample load in LC-MS/MS reliably decreases the CV between replicates. Based on our data, we are able to estimate the amount of variance that is contributable to poor signal intensity versus other experimental considerations. Finally, we demonstrate that misidentification of peptide oxidation products can sometimes be detected by the deviation of a sample from the established relationship between signal intensity and CV.
Experimental
Gp120 protein (53 kDa protein mass) was purchased from Immune Technology Corp (New York, USA). VAR2CSA (121 kDa) was obtained from Dr. Thomas Clausen, University of Copenhagen; Skp1A (19 kDa) from Dictyostelium discoideum, expressed in E. coli as its native sequence and purified by conventional chromatographic methods under non-denaturing conditions [15], was obtained from Dr. Christopher West, University of Georgia; RPTP Sigma (25 kDa) and COSMC (34 kDa) were obtained from Dr. Kelley Moremen, University of Georgia; bCSE (45 kDa), hCSE (47 kDa), and RNAP (370 kDa) were obtained from Dr. Evgeny Nudler, New York University Medical Center. Hen egg white lysozyme (14 kDa), horse heart myoglobin (17 kDa), catalase and ammonium bicarbonate were purchased from Sigma-Aldrich (St. Louis, MO, USA). Dithiothreitol (DTT) was purchased from Soltec Ventures (Beverly, MA). LC-MS grade formic acid, sodium phosphate buffer, and hydrogen peroxide were obtained from Fisher Scientific (Fair Lawn, NJ, USA). Methionine amide was purchased from Bachem (Torrance, CA, USA). Adenine and L-glutamine were obtained from Acros Organics (Geel, Belgium). Sequencing-grade trypsin was purchased from Promega Corp (Madison, WI). Purified water (18 MΩ) was obtained from an in-house Milli-Q Purification system (Millipore, Billerica, MA, USA).
FPOP of Proteins
HRPF by FPOP experiments were performed as previously described [13]. In summary, sample mixtures were prepared in triplicate, each containing 2–10 μM protein, 1 mM adenine as a radical dosimeter, 17 mM glutamine for radical scavenging, and 20 mM sodium phosphate buffer. Freshly made hydrogen peroxide was added to each sample at 100 mM immediately prior to laser exposure. Samples were flowed through a fused silica capillary through the path of a pulsed focused laser (fluence ~5 mJ/mm2/pulse, depending on the sample) at a flow rate calculated to illuminate each volume of sample with a single laser pulse, with ~20% of the volume as an unirradiated buffer volume. After laser irradiation, the oxidized protein sample was quenched in a 25 μL quenching solution containing 25 mM methionine amide and 50 nM catalase. Adenine UV absorbance was measured at 260 nm using a Nanodrop 2000C UV/VIS spectrophotometer (Thermo Scientific) to ensure consistent effective radical dose between replicates. After oxidation and quenching, Tris buffer was added to a final concentration of ~45 mM (pH 8.0). The protein was reduced by adding DTT to 5mM and denatured by incubating at 95 C for 20 minutes. The samples were immediately cooled down to room temperature. Samples were digested by adding trypsin to the sample protein (1:20 weight ratio) and incubating them at 37°C for 14 hours, and digestion was terminated by heating to 95 C for ten minutes to inactivate the protease [16]. When necessary, peptides were deglycosylated using PNGase F.
Mass spectral analysis of peptides was conducted on a Thermo Scientific Orbitrap Fusion Tribrid (Thermo Fisher Scientific, Waltham, MA, USA) coupled to an Ultimate 3000 Nano UHPLC system (Dionex, Sunnyvale, CA, USA) using a 150 × 0.75 mm PepMap 100 C18, 2 μm particle size, analytical column (Thermo Fisher Scientific) in trapping mode with a C18 trap cartridge. Peptides were eluted at a flow rate of 0.3 μL/min, using a gradient elution, 2% acetonitrile in 0.1% formic acid isocratic hold for 6 min, 2% to 40% acetonitrile in 0.1% formic acid, run from 6min to 28min, after increasing to 95% acetonitrile between 28 min and 33min, an isocratic hold run until 35min, followed by a gradient decrease to 2% acetonitrile from 35min to 36min. The column was re-equilibrated to 2% acetonitrile at the end of each run with an 8 min isocratic step that ended at 45min. MS analysis was performed by nanoelectrospray ionization in positive ion mode using the Orbitrap mass analyzer, with a nominal resolution of 60,000 and an m/z range of 200 to 2000. Peptides were selected for isolation by data dependent acquisition, and fragmented by both collision induced dissociation (CID) at 35% collision energy, as well as by electron transfer dissociation (ETD) for charge states +3 and higher with a 100 ms reaction time. For +2 charge states, ETD with 5% CID supplemental activation was used. Both fragmentation modes were used for peptide identification by database search.
Data were analyzed by computer-assisted manual validation. Byonic version v2.10.5 (Protein Metrics) was used to identify oxidized gp120, VAR2CSA, SKP1, bCSE, hCSE, RNAP, RPTP-sigma, and COSMC peptide sequences using a sequence database for each protein. For all peptides detected, the major oxidation products were net additions of one or more oxygen atoms. Masses of oxidized peptides were calculated by adding n*15.9949/(charge state of the peptide) to the unoxidized peptide mass, in which n is the number of oxygen atoms added to the peptide. The area under the curve (AUC) for peaks of unoxidized and oxidized peptides was used to calculate the oxidation events per peptide according to equation 1, below. In short, the oxidation events per peptide (OEP) were calculated by summing the AUC for each peptide multiplied by the number of oxidation events on the peptide over the sum of all AUCs, where “I” is the AUC of each oxidized peptide.
| Eq. 1 |
Coefficient of variation was indicated by the standard deviation of OEP divided by the mean OEP for each oxidized peptide measured in each protein tested. Average summed peptide intensity (ΣPI) was calculated by summing the average AUC of all oxidized and unoxidized peptide in each triplicate sample.
Observed changes in HRPF oxidation were analyzed by a two-tailed Student’s t-test to test for statistical significance, with α = 0.05.
Results and Discussion
Relationship of OEP coefficient of variation with ΣPI of each peptide
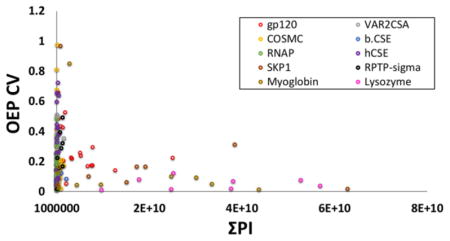
Ten proteins were analyzed using HRPF-FPOP and oxidation event of each peptide was measured in triplicate at the peptide level. The relationship of ΣPI and OEP CV was examined for 180 peptides of ten different oxidized proteins. For each, the relationship of the CV in the measurement of the number of OEP from triplicate analyses was analyzed, and correlated with ΣPI for that peptide in both unoxidized and all detected oxidized forms. The result of this correlation is shown in Figure 1. At low ΣPI, the CV of OEP varies widely, reaching over 0.9 for some peptides. However, as ΣPI increases above a value of 3 × 10⁹, the CV of OEP reaches a very stable and predictable value of 0.125 ± 0.090. These results suggest that high CV of OEP is not primarily a function of reproducibility of oxidation and/or quenching, but rather a function of the reproducibility of LC-MS measurement.
Figure 1.
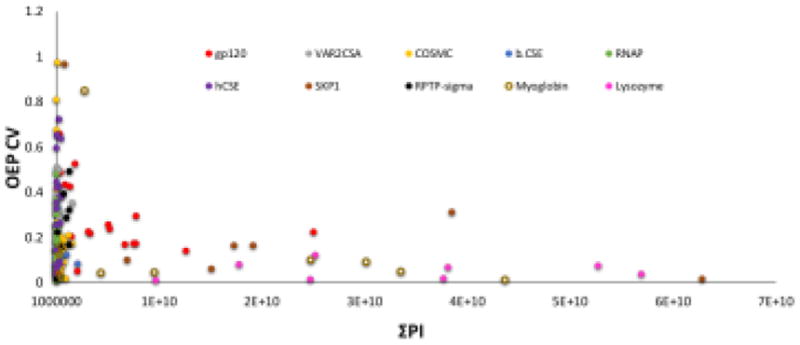
OEP CV versus the ΣPI of 180 oxidized peptides from ten model proteins. As the signal intensity of a peptide gets smaller, the variability in the amount of oxidation measured from triplicate samples increases.
Increasing injected sample decreased CV of OEP
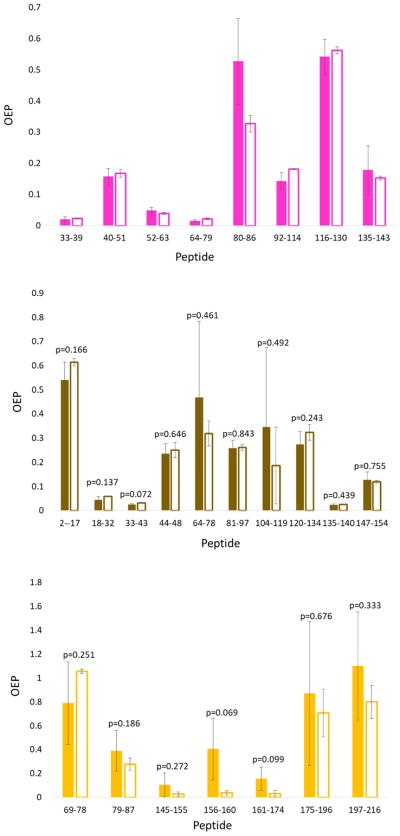
Based on the obtained relationship between OEP CV and ΣPI, we hypothesized that injecting more sample could result in significantly lower OEP CV. Therefore, the effect of different injection volumes of the same sample on OEP CV was investigated. While the correlation between ΣPI and CV of OEP held for all proteins tested, only two proteins (gp120 and Skp1) resulted in very high ΣPI values. So in order to test the effect of peptide ΣPI on OEP CV, we tested three proteins: COSMC, lysozyme and myoglobin. These proteins represent different ranges of ΣPI in Figure 1 to see if increasing ΣPI would increase OEP CV: COSMC gave peptides with low ΣPI, lysozyme primarily gave peptides with high ΣPI, and myoglobin gave a range of ΣPI between the two. Two different volumes, 2 μL and 5 μL, of the same oxidized protein tryptic peptide triplicate samples were injected for C18 LC-MS analysis using the same method. As shown in Figure 2, increasing the overall amount of the same sample injected had large effect on the standard deviation of measurement, markedly decreasing the OEP CV for each peptide. For COSMC, as the ΣPI increases 10 times from 1.3×10⁹ to 2.0×10¹⁰ on average for all 7 peptides, the average OEP CV of peptides decreased from 0.601 to 0.355. For lysozyme, ΣPI increases almost 4 times from 8.9×10⁹ to 3.3×10¹⁰ on average, with a decrease in the average OEP CV of the eight peptides from 0.255 to 0.055. Similar observations were seen with myoglobin, where the ΣPI increased on average approximately 4-fold (4.0×10⁹ to 1.5×10¹⁰) with the average OEP CV decreasing from 0.324 to 0.152. Changes in the mean OEP measured at low and high sample loads were not consistent in magnitude or direction from peptide to peptide, and for no peptide were the changes statistically significant (α = 0.05), suggesting that the changes from injecting more sample are changes in precision of the measurement, not accuracy. Increases in the injection volume led to small increases in the chromatographic peak width, but peaks remained very narrow (~3–4 seconds full width at half maximum intensity) and consistent with typical UHPLC separations. Increases in sample load actually decreased the observed peak width for very low signal intensity oxidation products, as chemical noise could still play a significant role in extracted ion chromatogram peak areas at very low signal intensities, even at 10 ppm mass accuracy.
Figure 2.
Effect of injection amount on the oxidation event per peptide measurements of three different proteins: (Top) hen egg white lysozyme, (Middle) horse heart myoglobin, and (Bottom) COSMC. Solid and outlined columns represent 2 and 5μL injection volume, respectively. Error bars represent the oxidation events per peptide standard deviation. A two-tailed Student’s t-test was performed to test statistical significance between the OEP of each peptide at two different injection amounts, and found no statistically significant differences (α = 0.05).
Detecting misidentifications of HRPF products by high CV at high peptide intensity
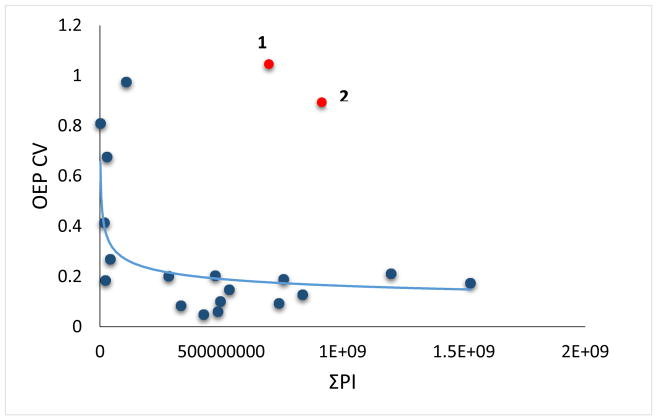
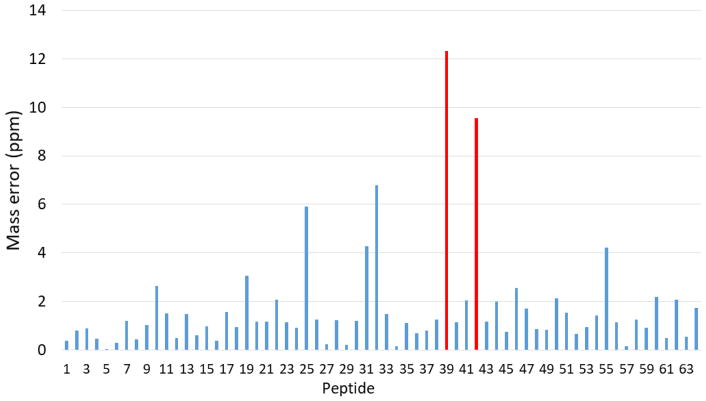
While the correlation between ΣPI and OEP CV is robust, we wanted to test if this correlation is sufficiently robust to be predictive. Peak misassignment in LC-MS data is a common problem in FPOP HRPF for novice practitioners of the technique. Given the relationship between ΣPI and OEP CV observed in Figure 1, we tested the ability to screen for misassignments of LC-MS peaks using this relationship. Initial analysis of the plotted COSMC HRPF data indicated there were two outliers with OEP CVs much greater than expected that observed from the general trend (Figure 3). Close manual review of the data by a more experienced practitioner indicated that each outlier had an assigned oxidized peptide with an unusually high mass error (Figure 4, Table 1). Additionally, both peptides violated the expected binomial distribution for peptide oxidation products typically observed (e.g. peptide X-Y+4O was assigned when peptide X-Y+3O was not observed)[6]. Finally, the ETD MS/MS fragments of the first hypothetically misidentified oxidized peptide, KDPSQPFYLGHTIK with 4 oxidation events, which has a +12.316 ppm mass error, were not matched to any of the c or z ions of the peptide (Figure S1). No ETD or CID MS/MS fragmentation was found for the second hypothetically misidentified oxidized peptide, SGDLEYVGMEGGIVLSVESMK with 3 oxidation events and a +9.55 ppm mass error. When these misassigned oxidation products were included in the calculation of the OEP data for each of these peptides, these peptides clearly violated the ΣPI correlation with OEP CV. After removing the two misidentified oxidized peptides, the remaining data for the peptides fit perfectly with the overall data indicating that the two outliers were due to the misidentification of oxidized forms of the peptides. These results suggest that the relationship between OEP CV and ΣPI may also be useful in auditing assignments of oxidation products, which is especially important in the development of automated tools for FPOP data analysis.
Figure 3.
OEP CV versus the ΣPI of COSMC peptides before the removal of the suspected misidentified peptides. Peptide 1 and 2 are suspected misidentified peptides.
Figure 4.
Mass error of all oxidized and unoxidized of all COSMC peptides. The red columns represent the hypothetically misidentified peptides with an aberrantly large mass error, while the blue ones represent the peptides with a mass error of <7 ppm.
Table 1.
The mass error of all oxidized and unoxidized suspected misidentified COSMC peptides.
| Peptide | charge | Theoretical peptide mass | Actual Peptide mass | Mass error (ppm) |
|---|---|---|---|---|
| (161- KDPSQPFYLGHTIK-174) | 3 | 544.291 | 544.292 | −0.673 |
| (161- KDPSQPFYLGHTIK-174)+1O | 3 | 549.622 | 549.6234 | −0.788 |
| (161- KDPSQPFYLGHTIK-174)+2O | 3 | 554.954 | 554.955 | −1.261 |
| (161- KDPSQPFYLGHTIK-174)+3O | 3 | 560.285 | Not detected | N/A |
| (161- KDPSQPFYLGHTIK-174)+4O | 3 | 565.616 | 565.61 | 12.316 |
| (175-SGDLEYVGMEGGIVLSVESMK-196) | 2 | 1100.529 | 1100.531 | −1.135 |
| (175-SGDLEYVGMEGGIVLSVESMK-196)+1O | 2 | 1108.526 | 1108.529 | −2.029 |
| (175-SGDLEYVGMEGGIVLSVESMK-196)+2O | 2 | 1116.523 | Not detected | N/A |
| (175-SGDLEYVGMEGGIVLSVESMK-196)+3O | 2 | 1124.520 | 1124.510 | 9.559 |
Conclusions
The overall purpose of this work was to determine the primary cause of high variability often reported in FPOP data that made it less reliable when trying to detect protein structural changes. This high variability has been reported across a wide variety of unrelated proteins by a number of labs, and shows no obvious correlation to peptide physical properties. We demonstrated the strong correlation between the average summed peptide intensity (ΣPI) and the coefficient of variation of oxidation events per peptide (CV of OEP). Further, we demonstrated that injecting larger amounts of the same sample onto the column greatly reduces the CV of OEP, which should be considered in conducting FPOP experiments and analysis to increase sensitivity. By loading more sample onto the column, we have higher peak intensity which results in a lower CV of OEP, and therefore it leads to higher statistical power for the analysis, useful for both comparative analyses and absolute analyses of protein topography by FPOP HRPF [17]. Recently, Storek and coworkers at Genentech released an FPOP study using analytical scale chromatography (2.1 mm column ID), which offers much higher LC-MS stability and signal intensity at the cost of much higher sample consumption. The results published exhibited consistently low CV of oxidation [18], supporting our findings here that poor precision in modern FPOP workflows is caused largely by low signal intensity, and this can be remediated (at least in many cases) by increasing the amount of sample injected for LC-MS analysis. While we have only tested this relationship in FPOP HRPF, this method of improving accuracy and sensitivity in HRPF may be valid regardless of the method of radical generation [1, 19–23], as the source of variability identified is in the common LC-MS measurement, not the radical exposure method.
Supplementary Material
Acknowledgments
This research was supported by the National Institute of General Medical Sciences Research Resource for Integrated Glycotechnology (P41GM103390) and the National Science Foundation (CHE1608685). The authors thank Dr. Kelley Moremen for the expression and purification of COSMC and RPTP Sigma, Dr. Thomas Clausen for expression and purification of VAR2CSA, and Dr. Christopher West for expression and purification of Skp1. E.N. acknowledges support of the Howard Hughes Medical Institute and the Blavatnik Family Foundation.
References
- 1.Sharp JS, Becker JM, Hettich RL. Protein surface mapping by chemical oxidation: structural analysis by mass spectrometry. Anal Biochem. 2003;313(2):216–225. doi: 10.1016/s0003-2697(02)00612-7. [DOI] [PubMed] [Google Scholar]
- 2.Charvatova O, Foley BL, Bern MW, Sharp JS, Orlando R, Woods RJ. Quantifying protein interface footprinting by hydroxyl radical oxidation and molecular dynamics simulation: application to galectin-1. J Am Soc Mass Spectrom. 2008;19(11):1692–1705. doi: 10.1016/j.jasms.2008.07.013. [DOI] [PMC free article] [PubMed] [Google Scholar]
- 3.Vahidi S, Stocks BB, Liaghati-Mobarhan Y, Konermann L. Mapping pH-Induced Protein Structural Changes Under Equilibrium Conditions by Pulsed Oxidative Labeling and Mass Spectrometry. Anal Chem. 2012;84(21):9124–9130. doi: 10.1021/ac302393g. [DOI] [PubMed] [Google Scholar]
- 4.Zhang H, Gau BC, Jones LM, Vidavsky I, Gross ML. Fast photochemical oxidation of proteins for comparing structures of protein-ligand complexes: the calmodulin-peptide model system. Anal Chem. 2011;83(1):311–318. doi: 10.1021/ac102426d. [DOI] [PMC free article] [PubMed] [Google Scholar]
- 5.Li X, Grant OC, Ito K, Wallace A, Wang S, Zhao P, Wells L, Lu S, Woods RJ, Sharp JS. Structural Analysis of the Glycosylated Intact HIV-1 gp120-b12 Antibody Complex Using Hydroxyl Radical Protein Footprinting. Biochemistry. 2017;56(7):957–970. doi: 10.1021/acs.biochem.6b00888. [DOI] [PMC free article] [PubMed] [Google Scholar]
- 6.Gau BC, Sharp JS, Rempel DL, Gross ML. Fast photochemical oxidation of protein footprints faster than protein unfolding. Anal Chem. 2009;81(16):6563–6571. doi: 10.1021/ac901054w. [DOI] [PMC free article] [PubMed] [Google Scholar]
- 7.Niu B, Zhang H, Giblin D, Rempel DL, Gross ML. Dosimetry determines the initial OH radical concentration in fast photochemical oxidation of proteins (FPOP) J Am Soc Mass Spectrom. 2015;26(5):843–846. doi: 10.1007/s13361-015-1087-0. [DOI] [PMC free article] [PubMed] [Google Scholar]
- 8.Xie B, Sharp JS. Hydroxyl Radical Dosimetry for High Flux Hydroxyl Radical Protein Footprinting Applications Using a Simple Optical Detection Method. Anal Chem. 2015;87(21):10719–10723. doi: 10.1021/acs.analchem.5b02865. [DOI] [PMC free article] [PubMed] [Google Scholar]
- 9.Saladino J, Liu M, Live D, Sharp JS. Aliphatic peptidyl hydroperoxides as a source of secondary oxidation in hydroxyl radical protein footprinting. J Am Soc Mass Spectrom. 2009;20(6):1123–1126. doi: 10.1016/j.jasms.2009.02.004. [DOI] [PMC free article] [PubMed] [Google Scholar]
- 10.Hambly DM, Gross ML. Cold chemical oxidation of proteins. Anal Chem. 2009;81(17):7235–7242. doi: 10.1021/ac900855f. [DOI] [PMC free article] [PubMed] [Google Scholar]
- 11.Gau BC, Chen J, Gross ML. Fast photochemical oxidation of proteins for comparing solvent-accessibility changes accompanying protein folding: Data processing and application to barstar. Biochim Biophys Acta. 2013;1834(6):1230–1238. doi: 10.1016/j.bbapap.2013.02.023. [DOI] [PMC free article] [PubMed] [Google Scholar]
- 12.Jones LM, Zhang H, Cui W, Kumar S, Sperry JB, Carroll JA, Gross ML. Complementary MS methods assist conformational characterization of antibodies with altered S-S bonding networks. J Am Soc Mass Spectrom. 2013;24(6):835–845. doi: 10.1007/s13361-013-0582-4. [DOI] [PMC free article] [PubMed] [Google Scholar]
- 13.Li Z, Moniz H, Wang S, Ramiah A, Zhang F, Moremen KW, Linhardt RJ, Sharp JS. High structural resolution hydroxyl radical protein footprinting reveals an extended robo1-heparin binding interface. J Biol Chem. 2015;290(17):10729–10740. doi: 10.1074/jbc.M115.648410. [DOI] [PMC free article] [PubMed] [Google Scholar]
- 14.Chen J, Rempel DL, Gau BC, Gross ML. Fast photochemical oxidation of proteins and mass spectrometry follow submillisecond protein folding at the amino-acid level. J Am Chem Soc. 2012;134(45):18724–18731. doi: 10.1021/ja307606f. [DOI] [PMC free article] [PubMed] [Google Scholar]
- 15.Xu X, Eletsky A, Sheikh MO, Prestegard JH, West CM. Glycosylation Promotes the Random Coil to Helix Transition in a Region of a Protist Skp1 Associated with F-Box Binding. Biochemistry. 2018;57(5):511–515. doi: 10.1021/acs.biochem.7b01033. [DOI] [PMC free article] [PubMed] [Google Scholar]
- 16.Petritis BO, Qian WJ, Camp DG, 2nd, Smith RD. A simple procedure for effective quenching of trypsin activity prevention of 18O-labeling back-exchange. J Proteome Res. 2009;8(5):2157–2163. doi: 10.1021/pr800971w. [DOI] [PMC free article] [PubMed] [Google Scholar]
- 17.Xie B, Sood A, Woods RJ, Sharp JS. Quantitative Protein Topography Measurements by High Resolution Hydroxyl Radical Protein Footprinting Enable Accurate Molecular Model Selection. Sci Rep. 2017;7(1):4552. doi: 10.1038/s41598-017-04689-3. [DOI] [PMC free article] [PubMed] [Google Scholar]
- 18.Storek KM, Auerbach MR, Shi H, Garcia NK, Sun D, Nickerson NN, Vij R, Lin Z, Chiang N, Schneider K, Wecksler AT, Skippington E, Nakamura G, Seshasayee D, Koerber JT, Payandeh J, Smith PA, Rutherford ST. Monoclonal antibody targeting the beta-barrel assembly machine of Escherichia coli is bactericidal. Proc Natl Acad Sci U S A. 2018;115(14):3692–3697. doi: 10.1073/pnas.1800043115. [DOI] [PMC free article] [PubMed] [Google Scholar]
- 19.Aye TT, Low TY, Sze SK. Nanosecond laser-induced photochemical oxidation method for protein surface mapping with mass spectrometry. Anal Chem. 2005;77(18):5814–5822. doi: 10.1021/ac050353m. [DOI] [PubMed] [Google Scholar]
- 20.Sharp JS, Becker JM, Hettich RL. Analysis of protein solvent accessible surfaces by photochemical oxidation and mass spectrometry. Anal Chem. 2004;76(3):672–683. doi: 10.1021/ac0302004. [DOI] [PubMed] [Google Scholar]
- 21.Smedley JG, Sharp JS, Kuhn JF, Tomer KB. Probing the pH-dependent prepore to pore transition of Bacillus anthracis protective antigen with differential oxidative protein footprinting. Biochemistry. 2008;47(40):10694–10704. doi: 10.1021/bi800533t. [DOI] [PMC free article] [PubMed] [Google Scholar]
- 22.Watson C, Janik I, Zhuang T, Charvatova O, Woods RJ, Sharp JS. Pulsed electron beam water radiolysis for submicrosecond hydroxyl radical protein footprinting. Anal Chem. 2009;81(7):2496–2505. doi: 10.1021/ac802252y. [DOI] [PMC free article] [PubMed] [Google Scholar]
- 23.Kaur P, Kiselar J, Yang S, Chance MR. Quantitative protein topography analysis and high-resolution structure prediction using hydroxyl radical labeling and tandem-ion mass spectrometry (MS) Mol Cell Proteomics. 2015;14(4):1159–1168. doi: 10.1074/mcp.O114.044362. [DOI] [PMC free article] [PubMed] [Google Scholar]
Associated Data
This section collects any data citations, data availability statements, or supplementary materials included in this article.


