Abstract
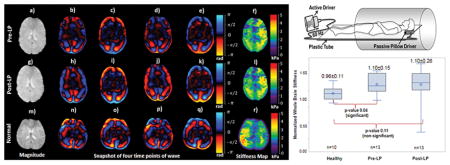
This study determines the reproducibility of magnetic resonance elastography(MRE) derived brain stiffness in normal volunteers and compares it against pseudotumor patients before and after lumbar puncture(LP).
MRE was performed on 10 normal volunteers for reproducibility and 14 pseudotumor patients before and after LP. During LP, opening and closing cerebrospinal fluid(CSF) pressures were recorded before and after removal of CSF and correlated to brain stiffness.
Stiffness reproducibility was observed (r>0.78;p<0.008). Whole brain opening LP stiffness was significantly (p=0.04) higher than normals, but no significant difference (p=0.11) in closing LP measurements. No significant correlation was observed between opening and closing pressure and brain stiffness.
Keywords: Pseudotumor Cerebri, Idiopathic Intracranial Hypertension (IIH), Magnetic Resonance Elastography (MRE), Brain Stiffness, Lumbar Puncture (LP)
Graphical Abstract
Introduction
Brain stiffness has been studied in the context of many neurological disease processes, including brain tumors (1,2), injury (3), multiple sclerosis (4), and many neurodegenerative diseases (5,6), and is considered important, as it could provide quantitative biomechanical measurements. It is known that stiffness is a function of pressure (7–9) and therefore it is important to understand the influence of intracranial pressure on brain stiffness.
Pseudotumor cerebri, also known as idiopathic intracranial hypertension (IIH), is a disease process characterized by elevated intracranial pressure of the cerebrospinal fluid (CSF) around the brain, without the presence of a tumor or other underlying cause. The incidence of IIH has been reported in the range of 1–2 cases per 100,000 people, with evidence of increasing numbers in the last several years (10–13). The rate of occurrence in women is consistently reported as being significantly higher compared to men (14). Patients with IIH typically present with headache, although the disease can also clinically present with nausea and vomiting, pulsatile tinnitus, decrease in visual acuity, papilledema, and rarely cranial nerve palsy (10).
The current standard tool for diagnosing IIH is through a lumbar puncture (LP), where intracranial pressure is determined through a measurement of CSF pressure, and other pathologies are ruled out through routine imaging and laboratory analysis (15). LP is also used as a disease management modality since removing a certain amount of CSF during the procedure can lower intracranial pressure and relieve symptoms. This procedure is considered invasive, with risk of complications (16). Some patients tested for IIH are found to have normal pressures, yet claim that after the procedure they experience improvement in their symptoms. Finding an alternative non-invasive method for determining intracranial pressure would be beneficial to filter true IIH cases from patients experiencing headache not related to increased intracranial pressure. However, in these patients, LP would have a therapeutic benefit not related to lowering of a high intracranial pressure, possibly related to placebo effect (17–19).
Magnetic resonance elastography (MRE) is a novel non-invasive imaging technique used to estimate spatial stiffness of soft tissues (20–25). It is a phase contrast technique in which mechanical waves are synchronized with a motion encoding gradient to generate wave images. These wave images depict the small displacements that result from mechanical waves propagating throughout the tissues in certain regions of interest. These images are subsequently processed using an inversion algorithm to generate stiffness maps. Currently, MRE is a clinical diagnostic tool in staging liver fibrosis (26).
MRE was used to test-retest repeatability in measuring regional brain stiffness in healthy volunteers (27). Elasticity has been shown to be related to intracranial pressure (7–9). Additionally, this modality is also being investigated for brain applications including Parkinson’s disease, Alzheimer's disease, traumatic brain injury, brain tumors including meningioma, multiple sclerosis, autoimmune encephalomyelitis, and normal pressure hydrocephalus (1–3,5,6,28,29).
Recently, volumetric strain in the brain was shown to correlate to venous pressure altered by abdominal muscle contraction (30), where volumetric strain is an indirect surrogate for estimating the compliance (i.e. inverse of stiffness) of the soft tissue. Therefore, we hypothesize that MRE-derived brain stiffness in pseudotumor patients may be higher than normal volunteers and may correlate with intracranial pressure. The purpose of this study is to determine i) the reproducibility of MRE-derived brain stiffness in normal volunteers; ii) the MRE-derived brain stiffness in pseudotumor patients before and after LP and comparing it against normal volunteers; and iii) the relationship between MRE-derived stiffness and intracranial pressure in patients with pseudotumor cerebri before and after LP.
Methods
This study was approved by the Institutional Review Board and written informed consent was obtained from 10 normal volunteers (n=20 samples) and 14 patients (n=28 samples). Normal volunteers (age: 23–36 years, mean: 28.9 years, median: 27.5 years) were recruited for performing reproducibility study. For reproducibility study, after the first scan normal volunteers were asked to step out of the scanner and were repositioned for a repeat MRE study.
Patients were recruited as they presented at the institution’s emergency department with symptoms, or during scheduled appointments to evaluate the functionality of a previously implanted shunt. Clinical examination and/or previous medical records were used to confirm suspected IIH. Patients with headache, papilledema confirmed through ophthalmic assessment, and prior imaging to exclude the presence of a mass lesion were included in the study. Fourteen patients (13 female, 1 male) were screened and included in this study (age: 25–53 years, mean: 38.7 years, median: 37 years). Two subjects had shunts, which were deemed MRI compatible. Conventional MRI as well as MRE of the brain was performed, before and after LP to measure opening and closing CSF pressures. In the two patients with shunts, there was signal loss both in the magnitude and phase images. The regions with signal loss were not included in the study. Additionally, there was no problem in introducing vibration into the brain in these two patients.
Data Acquisition
All imaging was performed using a clinical 3T MRI system (Verio, Siemens Healthcare, Erlangen, Germany). The subjects (i.e. both normal volunteers and patients) were positioned supine and head-first with a passive MRE pillow driver placed under their heads as shown in Figure 1.
Figure 1.
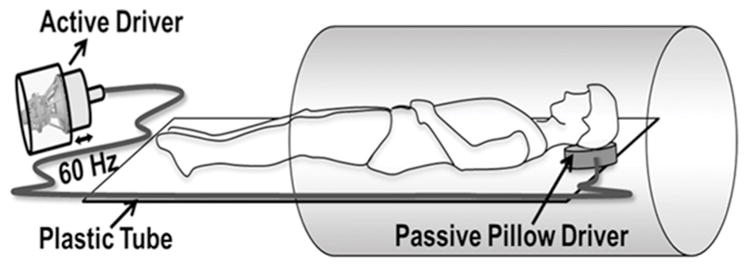
Schematic of the MRE driver setup. A pillow driver is placed posterior to the head, and acoustic waves are noninvasively transmitted from the active driver to the pillow, and into the subject’s brain. These waves are subsequently imaged and used to calculate the shear modulus.
Mechanical waves were non-invasively introduced into the brain using a pneumatic driver system (Resoundant Inc., Rochester, MN, USA), consisting of a remote active driver, along with a passive component adjacent to the head, connected through a rigid, plastic tube. Acoustic vibrations of 60 Hz were used to produce waves in the brain. This frequency is based on prior work considering the depth of wave penetration and the power required to achieve detectable waves (2). Standard anatomical gradient-recalled echo (GRE) sequences were used to acquire 10–20 axial slices covering the brain, focusing on the lateral ventricles. A separate GRE-MRE sequence (31) was performed both in normal volunteers and patients covering the same region, with the following imaging parameters: TE/TR = 21/25 ms; field of view (FOV) = 256x256 mm2; slice thickness 3–5 mm; matrix size = 128x64; flip angle = 16 , generalized autocalibrating partially parallel acquisition (GRAPPA) acceleration factor = 2 with 24 reference lines, and 4 MRE phase offsets. This sequence was synchronized to the applied acoustic vibrations. First moment nulled motion encoding gradients were applied separately in all three directions to encode the in-plane and through-plane motion with a period of 16.67 ms. The number of slices varied based on the size of the brain and coverage of the ventricles. Additionally, the slice thickness was also varied from 3mm to 5mm in some patients in order to reduce scan time for patient comfortability.
MRE data was acquired to obtain stiffness measurements before and after LP procedure and is referred to as opening LP and closing LP in this study, respectively. During the LP procedure, the patient lay prone on the fluoroscopy table. The LP was generally performed at the L2–3 level using a 20 gauge 3.5 inch spinal needle and using a paramedian approach, with the needle entering the thecal sac through the interlaminar space just lateral to the spinous process with the goal that the tip of the needle terminating in the midline. Once CSF was noted in the needle, the stylet was replaced and the patient was turned to a left lateral decubitus position. The stylet was removed and the manometer was then connected to the needle hub with short tubing and the manometer 0-mark placed at the level of the spine. The CSF was allowed to equilibrate and when the meniscus stopped, this was considered equilibrium and the pressure was recorded. Recorded opening pressures were used to confirm suspected IIH in previously undiagnosed patients, using the clinical criterion that LP opening pressure should be higher than 25 cm H2O. Between 6 and 20 ml of CSF was removed for lab analysis and for therapeutic purposes in each patient generally the pressure was lowered with the goal in the range of 12–18 cm of water. Closing pressures were recorded and the needle was removed. There was a cool down period of 1 hour where the patients were required to lay flat before going back to MRI for the closing LP scan.
Image Analysis
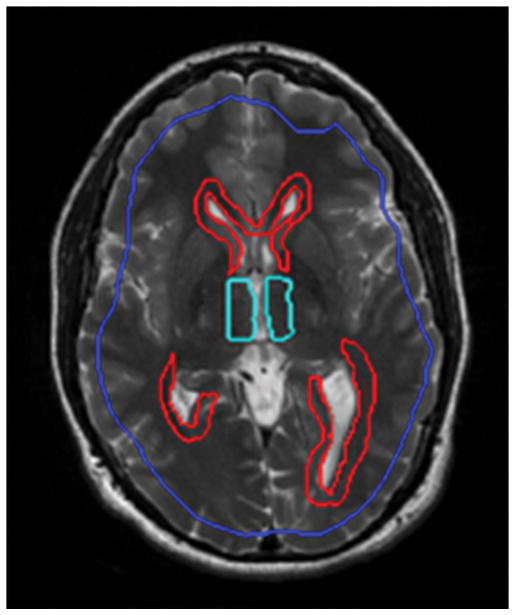
The acquired data was visually inspected for artifacts and subsequently analyzed. Octahedral shear strain-signal to noise ratio (OSS-SNR) [35] was performed to determine the regions with adequate SNR. Regions of interest (ROI) were drawn to exclude the skull or regions with artifacts stemming from the presence of shunts and also an OSS-SNR≤3. Using MRE-Lab software (Mayo Clinic, Rochester, MN, USA), shear stiffness maps of the brain were calculated using a 3D Local Frequency Estimation (LFE) inversion algorithm. In this algorithm, first, curl processing was performed to remove longitudinal waves, followed by a directional filter to remove reflected waves (24). Finally, first harmonic displacements were processed to obtain the weighted spatial stiffness map of the brain. A group of slices that depict the largest coverage of the ventricles was selected and used for statistical analysis. ROI’s were drawn by a trained radiologist around the periventricular regions of the lateral and third ventricles to determine local stiffness. Figure 2 demonstrates the ROI boundary drawn where blue shows brain after eroding boundary pixels, red and cyan shows periventricular regions of the lateral and third ventricles, respectively.
Figure 2.
ROI drawn for whole brain after eroding boundary pixels in blue, periventricular regions of lateral ventricle in red and periventricular regions of third ventricle in cyan.
Statistical Analysis
Pearson correlation analysis was performed to determine the reproducibility of stiffness measurements between two scans, and Bland-Altman plots were also used to visualize the agreement of the two scans. Data was normalized by log2 transformation and an influential outlier was excluded based on interquartile range rule (IQR) during analysis. Analysis of variance (ANOVA) was performed to compare stiffness estimates between normal volunteers and patients (mean of scan1 and scan2) for opening LP and closing LP stiffness estimates in each section, using Holm’s (step down Bonferroni) method [36] to adjust multiplicity. Pressure and stiffness measurements opening LP and closing LP were compared using a paired t-test, to determine statistically significant differences (p<0.05). A spearman correlation analysis using regression line was performed to determine relationship between opening LP and closing LP stiffness values and LP opening and closing pressures, respectively, for the periventricular regions as well as the whole axial plane of the brain. Additionally, a Pearson correlation analysis was performed to determine relationship between change in opening LP and closing LP stiffness values and change in LP opening and closing pressures, respectively, the periventricular regions as well as the whole axial plane of the brain.
Results
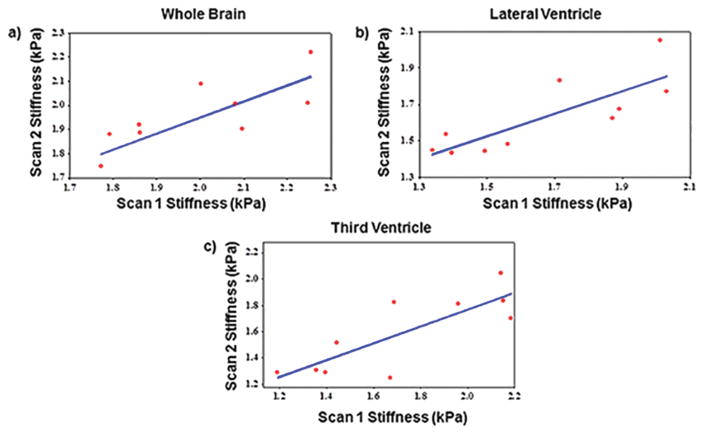
Good agreement in brain stiffness measurements was found between repeated scans within the same volunteer. The mean absolute percentage difference in stiffness values between repeated scans was 4.8±3.3 kPa, 7.7±4.3 kPa and 10.6±7.6 kPa for whole brain, periventricular region of lateral and third ventricle, respectively. Figure 3a–c shows Pearson correlation plots between repeat scans for whole brain, periventricular region of lateral ventricle and the third ventricle with correlation coefficients of 0.78, 0.81 and 0.81, respectively with a significant p-value<0.008.
Figure 3.
Plot demonstrating the correlation of MRE-derived brain stiffness measurements between inter-scans. a) Pearson correlation coefficient of 0.78 with p=0.0081 between scan 1 and scan 2 of whole brain stiffness measurements. b) Pearson correlation coefficient of 0.81 with p=0.0042 between scan1 and scan 2 of lateral ventricular region stiffness measurements. c) Pearson correlation coefficient of 0.81 with p=0.0042 between scan1 and scan 2 of 3rd ventricular region stiffness measurements. All these plots demonstrate good reproducible MRE-derived brain stiffness measurements.
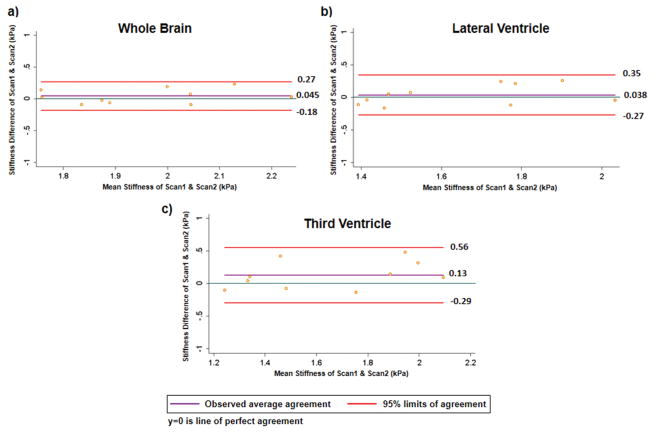
Figure 4a–c shows Bland-Altman plots of the repeatability study for whole brain, periventricular region of lateral and third ventricle with observed mean difference of 0.045 kPa (95% CI:−0.18 kPa, 0.27 kPa), 0.038 (95% CI: −0.27 kPa, 0.35 kPa) and 0.13 kPa (95% CI: −0.29 kPa, 0.56 kPa), respectively.
Figure 4.
Bland-Altman plots for a) whole brain with observed average agreement of 0.045(95% CI:−0.18,0.27); b) periventricular region of lateral ventricle with observed average agreement of 0.038 (95% CI: −0.27, 0.35); c) periventricular region of third ventricle with observed average agreement of 0.13(95% CI: −0.29, 0.56).
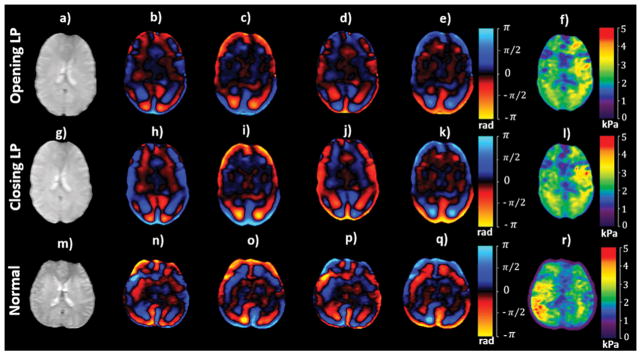
Minor differences in stiffness estimates were observed between opening LP and closing LP. Figures 5a–f and 5g–l show an axial magnitude image, snapshot of wave images and stiffness maps covering the lateral ventricles, acquired before and after LP, respectively, in the same patient. 11 ml CSF was drained from this patient. Mean stiffness across the whole brain in this patient was 2.04±0.59 kPa before LP and 2.02±0.58 kPa after LP. Figure 5m–r shows an axial magnitude image, snapshot of wave images and stiffness map in a normal volunteer. Mean stiffness across the whole brain in this normal volunteer was 2.1±0.71 kPa.
Figure 5.
An axial magnitude image (a; g) covering the lateral ventricles in a pseudotumor cerebri patient, along with snap shots of wave images (b–e; h–k) with motion encoding in the anterior-posterior direction and (f; l) the corresponding shear stiffness map before and after LP, respectively. An axial magnitude image (m) in a normal volunteer, along with snap shots of wave images (n–q) with the corresponding shear stiffness map (r).
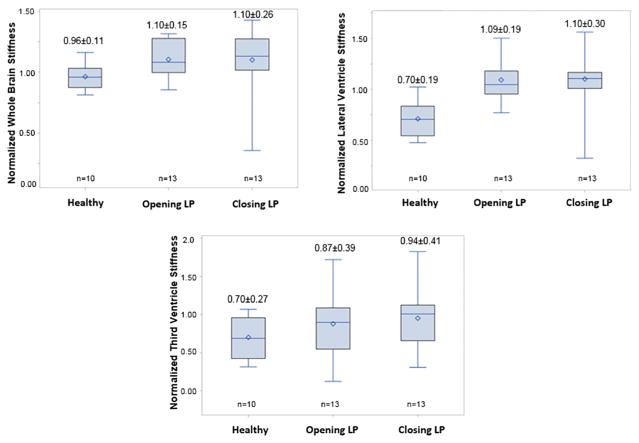
Whole brain stiffness was significantly (p=0.04) higher in opening LP patients but non-significant (p=0.11) in closing LP patients when compared to normal subjects. Figure 6a shows boxplot of normalized MRE-derived stiffness measurements in the normal, opening LP and closing LP patients. Normalized mean stiffness measurements of normal volunteers, opening LP and closing LP patients were 0.96±0.11, 1.10±0.15, and 1.10±0.26, respectively.
Figure 6.
Boxplot of normalized MRE-derived stiffness measurements in normal, opening LP and closing LP patients in whole brain region (a), lateral ventricle periventricular region (b) and third ventricle periventricular region (c).
Lateral ventricle periventricular region stiffness was significantly (p<0.001) higher in opening LP and closing LP when compared to normal subjects. Figure 6b shows boxplot of normalized MRE-derived stiffness measurements in normal, opening LP and closing LP patients. Normalized mean stiffness measurements of normal volunteers, opening LP and closing LP patients were 0.70±0.19, 1.09±0.19, and 1.10±0.30, respectively.
No significant difference (p>0.1) in third ventricle periventricular region stiffness was observed in patients before opening LP and after closing LP when compared to normal subjects. Figure 6c shows boxplot of normalized MRE-derived stiffness measurements in normal, opening LP and closing LP patients. Normalized mean stiffness measurements of normal volunteers, opening LP and closing LP were 0.70±0.27, 0.87±0.39, and 0.94±0.41, respectively.
Opening LP and closing LP stiffness estimates of the brain did not change significantly (all p>0.55). Whole brain stiffness measurements before and after LP are shown in Table 1, where it can be observed that 1 patient displayed a slight decrease in stiffness, 3 displayed slight increase in stiffness, and in 10 patients the stiffness remained unchanged.
Table 1.
LP opening and closing pressures, along with corresponding whole brain stiffness estimates. All subjects displayed elevated opening pressures, with 5 having opening pressures > 25 cm H2O (bold, italic). No consistent increase or decrease is observed in stiffness.
| Patient number | LP opening pressure (cm H2O) | Whole brain stiffness opening LP (kPa) | LP closing pressure (cm H2O) | Whole brain stiffness closing LP (kPa) |
|---|---|---|---|---|
| 1 | 8.5 | 2.04 | 1 | 2.02 |
| 2 | 21.5 | 2 | 13.5 | 2.2 |
| 3 | 18 | 2.5 | 12 | 2.5 |
| 4 | 38.5 | 2.2 | 18 | 2.15 |
| 5 | 22 | 2.4 | 16 | 2.3 |
| 6 | 23 | 2.4 | 15 | 2.4 |
| 7 | 18 | 2.2 | 14 | 2.4 |
| 8 | 20 | 2.5 | 14 | 2.7 |
| 9 | 17 | 2.1 | 15 | 2 |
| 10 | 36 | 2 | 18 | 2.1 |
| 11 | 20 | 2.1 | 15 | 2 |
| 12 | 28 | 1.9 | 13 | 1.3 |
| 13 | 29 | 1.8 | 16 | 2.3 |
| 14 | 30 | 1.4 | 19 | 1.3 |
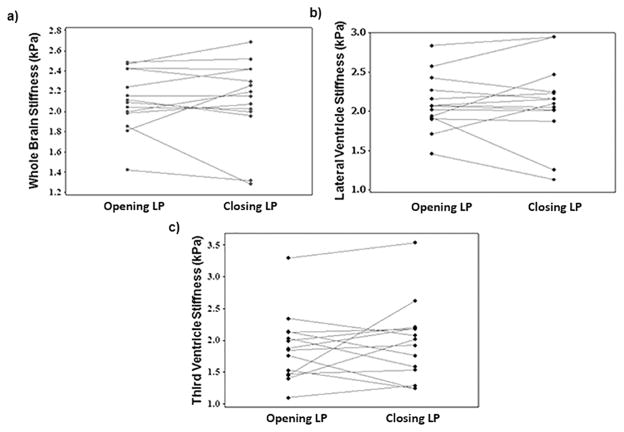
Mean opening LP and closing LP whole brain stiffness values across all subjects were 2.10±0.3 kPa and 2.11±0.4 kPa, respectively, with no significant difference (p=0.94), as illustrated in Figure 7a. Similarly, no significant change in opening LP and closing LP stiffness was observed in periventricular region of lateral ventricle (Figure 7b) and third ventricle (Figure 7c), respectively. The mean stiffness of lateral ventricle periventricular region opening LP and closing LP was 2.10±0.35 kPa and 2.11±0.51 kPa, respectively; and for third ventricle periventricular region were 1.87±0.54 kPa and 1.95±0.62 kPa, respectively.
Figure 7.
a) Plot of whole brain stiffness for all patients opening LP and closing LP with means of 2.11±0.3 and 2.12±0.4 kPa, respectively showing no significant difference (p=0.94). b) Plot of lateral ventricular stiffness for all patients opening LP and closing LP with means of 2.1±0.35 and 2.1±0.51 kPa, respectively showing no significant difference (p=0.88) and c) for 3rd ventricular region were 1.87±0.54 and 1.95±0.62 kPa, respectively showing no significant difference (p=0.55).
A significant difference in opening and closing pressures was found (p<0.0001). All subjects displayed elevated (>15 cm H2O) opening pressures except one, and 5 patients had pressure readings > 25 cm H2O, as shown in Table 1. Opening and closing pressures ranged from 1 cm H2O to 38.5 cm H2O, with a mean opening pressure of 23.5±8.0 cm H2O and a mean closing pressure of 14.3±4.3 cm H2O.
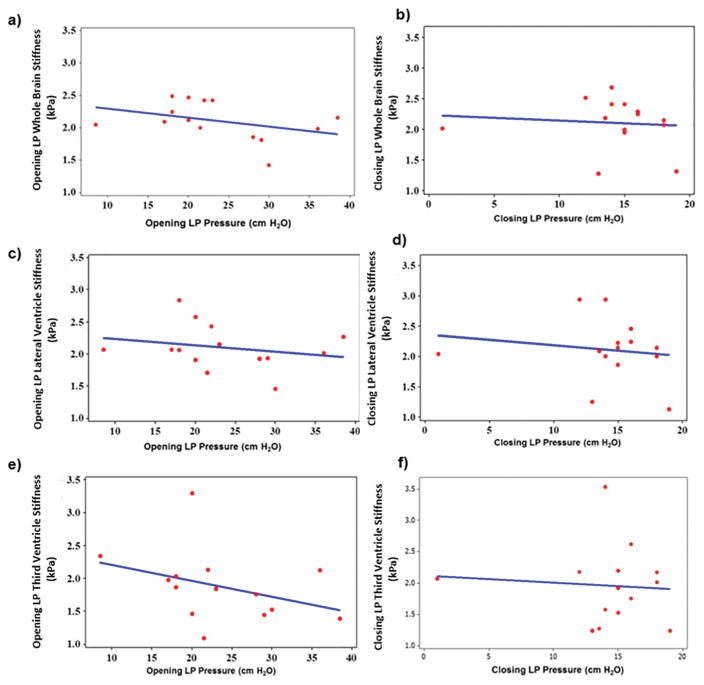
No significant correlation was found between stiffness and pressure in the whole brain. Figure 8a showed no correlation (ρ=−0.42, p=0.13) between opening LP stiffness measurements and opening LP opening pressure. Closing LP stiffness and LP closing pressure showed no correlation either (ρ=−0.19, p=0.52), as shown in Figure 8b.
Figure 8.
Spearman rho correlation plot between MRE-derived opening LP whole brain shear stiffness and LP opening pressure (ρ=−0.42, p=0.13) (a); closing LP whole brain shear stiffness and LP closing pressure (ρ=−0.19, p=0.52) (b); opening LP lateral ventricle shear stiffness and LP opening pressure (ρ=−0.27, p=0.34) (c); closing LP lateral ventricle shear stiffness and LP closing pressure (ρ=−0.16, p=0.59) (d); opening LP 3rd ventricle shear stiffness and LP opening pressure (ρ=−0.46, p=0.09) (e) and closing LP 3rd ventricle shear stiffness and LP closing pressure (ρ=−0.05, p=0.86) (f).
Stiffness in the regions surrounding the lateral ventricles showed no correlation with pressure. Opening LP stiffness demonstrated no significant correlation to opening pressure (ρ=−0.27, p=0.34) as shown in Figure 8c. Figure 8d shows closing LP stiffness as a function of closing pressure, with a non-significant correlation (ρ=−0.16, p=0.59).
Measurements in the regions surrounding the third ventricles showed similar results, with opening LP stiffness (Figure 8e) non-significantly correlated to opening pressure (ρ=−0.46, p=0.09) and closing LP stiffness (Figure 8f) showing no linear correlation to closing LP pressure (ρ=−0.05, p=0.86).
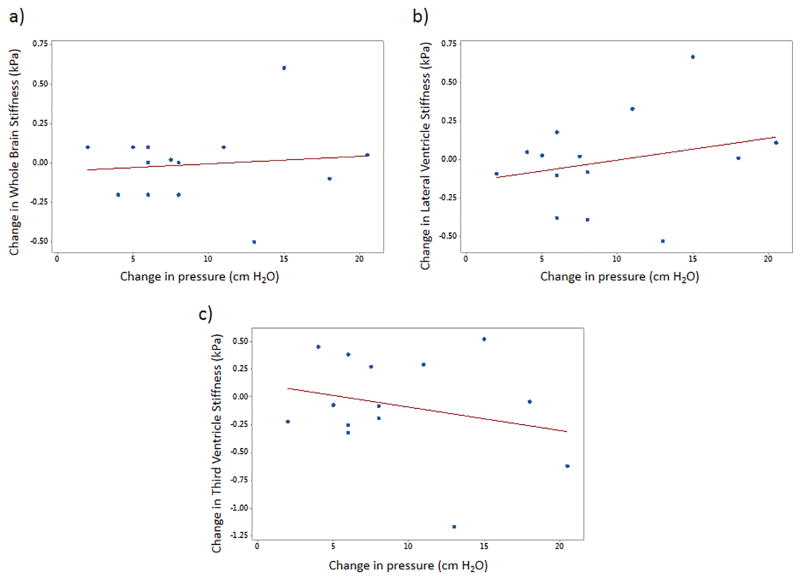
No correlation of change in stiffness to change in pressure was found. Figures 9a–c show no significant correlation to change in pressure to change in stiffness in the whole brain (ρ=0.11, p=0.71), lateral ventricle (ρ=0.26, p=0.38) and third ventricle (ρ=−0.25, p=0.39), respectively.
Figure 9.
Plot demonstrating the correlation of change in MRE-derived stiffness measurements with change in pressure. No significant (all p > 0.05) was found in whole brain (a), lateral ventricle (b), and third ventricle (c).
In the ventricular regions, stiffness estimates did not display significant changes either. Measurement results for the lateral ventricle periventricular region, and the third ventricle periventricular region, are tabulated in Table 2.
Table 2.
Brain stiffness measurements surrounding the lateral and 3rd ventricles opening LP and closing LP, for the patients corresponding to Table 1 and 5 subjects displayed opening pressures>25cm H2O (bold, italic). No consistent increase or decrease is observed in stiffness.
| Patient number | Opening LP stiffness surrounding lateral ventricle | Closing LP stiffness surrounding lateral ventricle | Opening LP stiffness surrounding 3rd ventricle | Closing LP stiffness surrounding 3rd ventricle |
|---|---|---|---|---|
| 1 | (kPa) 2.07 | (kPa) 2.05 | (kPa) 2.34 | (kPa) 2.07 |
| 2 | 1.71 | 2.1 | 1.09 | 1.28 |
| 3 | 2.84 | 2.94 | 1.86 | 2.18 |
| 4 | 2.26 | 2.15 | 1.39 | 2.01 |
| 5 | 2.43 | 2.25 | 2.13 | 1.75 |
| 6 | 2.15 | 2.23 | 1.84 | 1.92 |
| 7 | 2.06 | 2.01 | 2.03 | 1.58 |
| 8 | 2.57 | 2.95 | 3.29 | 3.54 |
| 9 | 2.06 | 2.15 | 1.98 | 2.2 |
| 10 | 2.02 | 2.01 | 2.13 | 2.17 |
| 11 | 1.9 | 1.87 | 1.46 | 1.53 |
| 12 | 1.92 | 1.25 | 1.76 | 1.24 |
| 13 | 1.94 | 2.47 | 1.45 | 2.62 |
| 14 | 1.46 | 1.13 | 1.52 | 1.23 |
In these regions, 9 cases showed slight decrease in closing LP stiffness in lateral ventricle; and 5 cases showed slight decrease in closing LP stiffness in the 3rd ventricular region.
Discussion
This study demonstrated good reproducibility of estimating brain stiffness and showed significant difference in stiffness estimates between normal and IIH patients in whole brain as well as periventricular regions of lateral ventricle. No significant correlation was found between LP pressure and brain stiffness. In particular, opening LP and closing LP MRE-derived brain stiffness showed no correlation to opening and closing LP pressures. No change in brain stiffness was observed before and after LP, despite CSF drainage to reduce pressure.
Prior studies have examined the normal topography of the brain and elicited normal values for different regions of the brain (32,33), but to our knowledge no study prior to ours tried to correlate intracranial pressure in IIH patients to brain stiffness. Similarly, earlier studies did not compare brain stiffness measurements in IIH patients to that of normal volunteers. However, there were studies (7,9) that indirectly estimated the biomechanical properties of the brain and its relationship to intracranial pressure. Shapiro et al (7) study was performed in cats and indirectly inferred biomechanical properties in hydrocephalus cats based on resistance to CSF absorption and pressure volume index. Similarly, Sklar et al (9) had only few patients with pseudotumor cerebri, where the authors observed variation in intracranial pressure at the level of intracranial pressure correlating to elasticity slope. This elasticity slope is an indirect surrogate of biomechanical properties of the brain, which was measured based on the CSF absorption to the change in intracranial pressure. However, our measurements were determined based on the tissue response to an external excitation at a particular frequency. Therefore, we cannot have a direct comparison of above studies to our results.
An important question relevant to this study is by what mechanism brain stiffness is related to intracranial pressure. Based on our results, the amount of decrease in intracranial pressure after LP may not have significantly altered the acute brain stiffness. If the brain is viewed as a passive component inside a closed system consisting of CSF surrounded by skull, then a positive correlation between stiffness and pressure would have been expected, i.e. an increase in CSF pressure would reflect upon the brain, resulting in an increased stiffness. However, the results shown in this study do not indicate such a trend, demonstrating that this causal perspective of the brain is incomplete in this scenario. A possible reason for not observing a correlation between CSF pressure and stiffness might be due to the fact that vascular pressure would have additional influence on stiffness estimates, or that the temporal resolution of brain stiffness change lies outside the experimental setup. Perhaps there is a delayed response between intracranial pressure change and brain stiffness change. However, we have found that brain stiffness in IIH patients was significantly higher than normals, indicating chronic influence of pressure compared to the acute changes (i.e. opening LP and closing LP).
Previous studies have shown that in normal pressure hydrocephalus (34–36), CSF pressure did not increase significantly. Furthermore, Streitberger et al. observed a decrease in shear modulus in normal pressure hydrocephalus patients (37). These studies further corroborate our findings that CSF pressure may not be the main factor influencing brain stiffness.
There are several limitations in our study. First, this study has a limited population size, with lumbar puncture revealing only a small number of patients with severely increased CSF pressures. This further demonstrates the difficulty in determining IIH symptomatically. Second, this study did not include a vascular component. Venous pressures were not measured, but only CSF pressures. Third, because of different slices and slice thickness there is a possibility of partial volume effects causing varying phase changes in adjacent regions of CSF. This can possibly affect the stiffness estimates in those regions. Fourth, psychological factors related to pain and anxiety during LP has shown transient elevation in CSF pressure due to Valsalva maneuver (45, 46) which could affect opening pressure measurements. Finally, not all patients were imaged immediately after the LP procedure, but within a 2 hour window due to cool down period and scanner availability.
Future work involves a longitudinal study measuring stiffness over an extended period of time in a larger study population. A long-term study may provide insight into the dynamic response of stiffness to pressure changes, as well as possible adaptive behaviors. It would be beneficial to include patients with slightly increased CSF pressures that may develop into true IIH cases, as well as acute and chronic pseudotumor cerebri patients.
In conclusion, good reproducibility of MRE-derived brain stiffness in normal volunteers was determined. There was a significant difference in MRE-derived brain stiffness between normal volunteers and IIH patients. Moreover, CSF intracranial pressure did not significantly alter brain stiffness before and after LP, and that additional work is warranted.
Highlights.
MRE-derived stiffness measurements of the brain are reproducible.
MRE brain stiffness in pseudotumor patients before and after LP was investigated.
MRE stiffness was significantly higher in IIH patients before LP compared to normal healthy volunteers.
No correlation was observed between opening and closing pressure and stiffness.
Acknowledgments
We would like to acknowledge our grant funding agencies: NIH- NHLBI: R01HL124096, AHA-13SDG14690027 and CCTS-UL1TR000090. Additionally, we would like to acknowledge Dr. Ehman (Mayo Clinic) for providing us the pillow driver and also MRE-Lab software (funded by EB001981).
Footnotes
Publisher's Disclaimer: This is a PDF file of an unedited manuscript that has been accepted for publication. As a service to our customers we are providing this early version of the manuscript. The manuscript will undergo copyediting, typesetting, and review of the resulting proof before it is published in its final citable form. Please note that during the production process errors may be discovered which could affect the content, and all legal disclaimers that apply to the journal pertain.
References
- 1.Xu L, Lin Y, Han JC, Xi ZN, Shen H, Gao PY. Magnetic resonance elastography of brain tumors: preliminary results. Acta Radiol. 2007;48(3):327–330. doi: 10.1080/02841850701199967. [DOI] [PubMed] [Google Scholar]
- 2.Murphy MC, Huston J, Glaser KJ, Manduca A, Meyer FB, Lanzino G, Morris JM, Felmlee JP, Ehman RL. Preoperative assessment of meningioma stiffness using magnetic resonance elastography. Journal of Neurosurgery. 2013;118(3):643–648. doi: 10.3171/2012.9.JNS12519. [DOI] [PMC free article] [PubMed] [Google Scholar]
- 3.Boulet T, Kelso ML, Othman SF. Long-Term In Vivo Imaging of Viscoelastic Properties of the Mouse Brain after Controlled Cortical Impact. Journal of Neurotrauma. 2013;30(17):1512–1520. doi: 10.1089/neu.2012.2788. [DOI] [PMC free article] [PubMed] [Google Scholar]
- 4.Streitberger KJ, Sack I, Krefting D, Pfuller C, Braun J, Paul F, Wuerfel J. Brain viscoelasticity alteration in chronic-progressive multiple sclerosis. PLoS One. 2012;7(1):e29888. doi: 10.1371/journal.pone.0029888. [DOI] [PMC free article] [PubMed] [Google Scholar]
- 5.Murphy MC, Huston J, 3rd, Jack CR, Jr, Glaser KJ, Manduca A, Felmlee JP, Ehman RL. Decreased brain stiffness in Alzheimer's disease determined by magnetic resonance elastography. J Magn Reson Imaging. 2011;34(3):494–498. doi: 10.1002/jmri.22707. [DOI] [PMC free article] [PubMed] [Google Scholar]
- 6.Lipp A, Trbojevic R, Paul F, Fehlner A, Hirsch S, Scheel M, Noack C, Braun J, Sack I. Cerebral magnetic resonance elastography in supranuclear palsy and idiopathic Parkinson's disease. Neuroimage Clin. 2013;3:381–387. doi: 10.1016/j.nicl.2013.09.006. [DOI] [PMC free article] [PubMed] [Google Scholar]
- 7.Shapiro K, Takei F, Fried A, Kohn I. Experimental feline hydrocephalus: the role of biomechanical changes in ventricular enlargement in cats. Journal of Neurosurgery. 1985;63(1):82–87. doi: 10.3171/jns.1985.63.1.0082. [DOI] [PubMed] [Google Scholar]
- 8.Alperin NJ, Lee SH, Loth F, Raksin PB, Lichtor T. MR-intracranial pressure (ICP): a method to measure intracranial elastance and pressure noninvasively by means of MR imaging: baboon and human study 1. Radiology. 2000;217(3):877–885. doi: 10.1148/radiology.217.3.r00dc42877. [DOI] [PubMed] [Google Scholar]
- 9.Sklar FH, Beyer CW, Jr, Clark WK. Physiological features of the pressure-volume function of brain elasticity in man. Journal of Neurosurgery. 1980;53(2):166–172. doi: 10.3171/jns.1980.53.2.0166. [DOI] [PubMed] [Google Scholar]
- 10.Friedman DI, Jacobson DM. Diagnostic criteria for idiopathic intracranial hypertension. Neurology. 2002;59(10):1492–1495. doi: 10.1212/01.wnl.0000029570.69134.1b. [DOI] [PubMed] [Google Scholar]
- 11.Kesler A, Gadoth N. Epidemiology of idiopathic intracranial hypertension in Israel. J Neuroophthalmol. 2001;21(1):12–14. doi: 10.1097/00041327-200103000-00003. [DOI] [PubMed] [Google Scholar]
- 12.Radhakrishnan K, Ahlskog JE, Cross SA, Kurland LT, O'Fallon WM. Idiopathic intracranial hypertension (pseudotumor cerebri). Descriptive epidemiology in Rochester, Minn, 1976 to 1990. Arch Neurol. 1993;50(1):78–80. doi: 10.1001/archneur.1993.00540010072020. [DOI] [PubMed] [Google Scholar]
- 13.Durcan FJ, Corbett JJ, Wall M. The incidence of pseudotumor cerebri. Population studies in Iowa and Louisiana. Arch Neurol. 1988;45(8):875–877. doi: 10.1001/archneur.1988.00520320065016. [DOI] [PubMed] [Google Scholar]
- 14.Tibussek D, Distelmaier F, von Kries R, Mayatepek E. Pseudotumor cerebri in childhood and adolescence -- results of a Germany-wide ESPED-survey. Klin Padiatr. 2013;225(2):81–85. doi: 10.1055/s-0033-1333757. [DOI] [PubMed] [Google Scholar]
- 15.Smith JL. Whence Pseudotumor Cerebri. Journal of Clinical Neuro-Ophthalmology. 1985;5(1):55–56. [PubMed] [Google Scholar]
- 16.Brown MW, Yilmaz TS, Kasper EM. Iatrogenic spinal hematoma as a complication of lumbar puncture: What is the risk and best management plan? Surgical Neurology International. 2016;7(Suppl 22):S581. doi: 10.4103/2152-7806.189441. [DOI] [PMC free article] [PubMed] [Google Scholar]
- 17.Higgins N, Pickard J, Lever A. Lumbar puncture, chronic fatigue syndrome and idiopathic intracranial hypertension: a cross-sectional study. JRSM Short Rep. 2013;4(12):2042533313507920. doi: 10.1177/2042533313507920. [DOI] [PMC free article] [PubMed] [Google Scholar]
- 18.Ljubisavljevic S, Zidverc Trajkovic J, Covickovic Sternic N, Spasic M, Kostic V. Idiopathic intracranial hypertension from the perspective of headache center. Acta Neurol Belg. 2013;113(4):487–492. doi: 10.1007/s13760-013-0228-0. [DOI] [PubMed] [Google Scholar]
- 19.Peng KP, Fuh JL, Wang SJ. High-pressure headaches: idiopathic intracranial hypertension and its mimics. Nat Rev Neurol. 2012;8(12):700–710. doi: 10.1038/nrneurol.2012.223. [DOI] [PubMed] [Google Scholar]
- 20.Ringleb SI, Bensamoun SF, Chen Q, Manduca A, An KN, Ehman RL. Applications of magnetic resonance elastography to healthy and pathologic skeletal muscle. J Magn Reson Imaging. 2007;25(2):301–309. doi: 10.1002/jmri.20817. [DOI] [PubMed] [Google Scholar]
- 21.Sinkus R, Tanter M, Catheline S, Lorenzen J, Kuhl C, Sondermann E, Fink M. Imaging anisotropic and viscous properties of breast tissue by magnetic resonance-elastography. Magn Reson Med. 2005;53(2):372–387. doi: 10.1002/mrm.20355. [DOI] [PubMed] [Google Scholar]
- 22.Glaser KJ, Manduca A, Ehman RL. Review of MR elastography applications and recent developments. Journal of Magnetic Resonance Imaging. 2012;36(4):757–774. doi: 10.1002/jmri.23597. [DOI] [PMC free article] [PubMed] [Google Scholar]
- 23.Shi Y, Guo QY, Xia F, Sun JX, Gao YY. Short- and midterm repeatability of magnetic resonance elastography in healthy volunteers at 3. 0 T. Magnetic Resonance Imaging. 2014;32(6):665–670. doi: 10.1016/j.mri.2014.02.018. [DOI] [PubMed] [Google Scholar]
- 24.Kenyhercz WE, Raterman B, Illapani VS, Dowell J, Mo X, White RD, Kolipaka A. Quantification of aortic stiffness using magnetic resonance elastography: Measurement reproducibility, pulse wave velocity comparison, changes over cardiac cycle, and relationship with age. Magn Reson Med. 2015 doi: 10.1002/mrm.25719. [DOI] [PMC free article] [PubMed] [Google Scholar]
- 25.Wassenaar PA, Eleswarpu CN, Schroeder SA, Mo X, Raterman BD, White RD, Kolipaka A. Measuring age-dependent myocardial stiffness across the cardiac cycle using MR elastography: A reproducibility study. Magn Reson Med. 2015 doi: 10.1002/mrm.25760. [DOI] [PMC free article] [PubMed] [Google Scholar]
- 26.Yin M, Glaser KJ, Talwalkar JA, Chen J, Manduca A, Ehman RL. Hepatic MR Elastography: Clinical Performance in a Series of 1377 Consecutive Examinations. Radiology. 2016;278(1):114–124. doi: 10.1148/radiol.2015142141. [DOI] [PMC free article] [PubMed] [Google Scholar]
- 27.Murphy MC, Huston J, III, Jack CR, Jr, Glaser KJ, Senjem ML, Chen J, Manduca A, Felmlee JP, Ehman RL. Measuring the characteristic topography of brain stiffness with magnetic resonance elastography. PLoS One. 2013;8(12):e81668. doi: 10.1371/journal.pone.0081668. [DOI] [PMC free article] [PubMed] [Google Scholar]
- 28.Freimann FB, Streitberger KJ, Klatt D, Lin K, McLaughlin J, Braun J, Sprung C, Sack I. Alteration of brain viscoelasticity after shunt treatment in normal pressure hydrocephalus. Neuroradiology. 2012;54(3):189–196. doi: 10.1007/s00234-011-0871-1. [DOI] [PubMed] [Google Scholar]
- 29.Riek K, Millward JM, Hamann I, Mueller S, Pfueller CF, Paul F, Braun J, Infante-Duarte C, Sack I. Magnetic resonance elastography reveals altered brain viscoelasticity in experimental autoimmune encephalomyelitis. Neuroimage Clin. 2012;1(1):81–90. doi: 10.1016/j.nicl.2012.09.003. [DOI] [PMC free article] [PubMed] [Google Scholar]
- 30.Mousavi SR, Fehlner A, Streitberger KJ, Braun J, Samani A, Sack I. Measurement of in vivo cerebral volumetric strain induced by the Valsalva maneuver. J Biomech. 2014;47(7):1652–1657. doi: 10.1016/j.jbiomech.2014.02.038. [DOI] [PubMed] [Google Scholar]
- 31.Chamarthi SK, Raterman B, Mazumder R, Michaels A, Oza VM, Hanje J, Bolster B, Jin N, White RD, Kolipaka A. Rapid acquisition technique for MR elastography of the liver. Magn Reson Imaging. 2014;32(6):679–683. doi: 10.1016/j.mri.2014.02.013. [DOI] [PMC free article] [PubMed] [Google Scholar]
- 32.Guo J, Hirsch S, Fehlner A, Papazoglou S, Scheel M, Braun J, Sack I. Towards an elastographic atlas of brain anatomy. PLoS One. 2013;8(8):e71807. doi: 10.1371/journal.pone.0071807. [DOI] [PMC free article] [PubMed] [Google Scholar]
- 33.Johnson CL, McGarry MDJ, Van Houten EEW, Weaver JB, Paulsen KD, Sutton BP, Georgiadis JG. Magnetic resonance elastography of the brain using multishot spiral readouts with self-navigated motion correction. Magnetic Resonance in Medicine. 2013;70(2):404–412. doi: 10.1002/mrm.24473. [DOI] [PMC free article] [PubMed] [Google Scholar]
- 34.Rekate HL. A consensus on the classification of hydrocephalus: its utility in the assessment of abnormalities of cerebrospinal fluid dynamics. Childs Nervous System. 2011;27(10):1535–1541. doi: 10.1007/s00381-011-1558-y. [DOI] [PMC free article] [PubMed] [Google Scholar]
- 35.Rekate HL. Hydrocephalus and idiopathic intracranial hypertension. Journal of Neurosurgery. 2007;107(6):435–437. doi: 10.3171/PED-07/12/435. [DOI] [PubMed] [Google Scholar]
- 36.Bradley WG., Jr Idiopathic normal pressure hydrocephalus: new findings and thoughts on etiology. AJNR Am J Neuroradiol. 2008;29(1):1–3. doi: 10.3174/ajnr.A0867. [DOI] [PMC free article] [PubMed] [Google Scholar]
- 37.Streitberger KJ, Wiener E, Hoffmann J, Freimann FB, Klatt D, Braun J, Lin K, McLaughlin J, Sprung C, Klingebiel R, Sack I. In vivo viscoelastic properties of the brain in normal pressure hydrocephalus. NMR Biomed. 2011;24(4):385–392. doi: 10.1002/nbm.1602. [DOI] [PubMed] [Google Scholar]
- 38.Sack I, Beierbach B, Hamhaber U, Klatt D, Braun A. Non-invasive measurement of brain viscoelasticity using magnetic resonance elastography. Nmr in Biomedicine. 2008;21(3):265–271. doi: 10.1002/nbm.1189. [DOI] [PubMed] [Google Scholar]
- 39.Johnson CL, McGarry MD, Gharibans AA, Weaver JB, Paulsen KD, Wang H, Olivero WC, Sutton BP, Georgiadis JG. Local mechanical properties of white matter structures in the human brain. Neuroimage. 2013;79:145–152. doi: 10.1016/j.neuroimage.2013.04.089. [DOI] [PMC free article] [PubMed] [Google Scholar]
- 40.Green MA, Bilston LE, Sinkus R. In vivo brain viscoelastic properties measured by magnetic resonance elastography. NMR Biomed. 2008;21(7):755–764. doi: 10.1002/nbm.1254. [DOI] [PubMed] [Google Scholar]
- 41.Johnson CL, Chen DD, Olivero WC, Sutton BP, Georgiadis JG. Effect of off-frequency sampling in magnetic resonance elastography. Magnetic Resonance Imaging. 2012;30(2):205–212. doi: 10.1016/j.mri.2011.09.017. [DOI] [PubMed] [Google Scholar]
- 42.Kruse SA, Rose GH, Glaser KJ, Manduca A, Felmlee JP, Jack CR, Jr, Ehman RL. Magnetic resonance elastography of the brain. Neuroimage. 2008;39(1):231–237. doi: 10.1016/j.neuroimage.2007.08.030. [DOI] [PMC free article] [PubMed] [Google Scholar]
- 43.Murphy M, Huston J, Jack C, Glaser K, Felmlee J, Jones D, Senjem M, Manduca A, Ehman R. Regional brain stiffness changes across the Alzheimer's disease spectrum. Alzheimer's & Dementia: The Journal of the Alzheimer's Association. 2012;8(4):S775. doi: 10.1016/j.nicl.2015.12.007. [DOI] [PMC free article] [PubMed] [Google Scholar]
- 44.Dittmann F, Hirsch S, Tzschätzsch H, Guo J, Braun J, Sack I. In vivo wideband multifrequency MR elastography of the human brain and liver. Magnetic Resonance in Medicine. 2015 doi: 10.1002/mrm.26006. [DOI] [PubMed] [Google Scholar]
- 45.Neville L, Egan RA. Frequency and amplitude of elevation of cerebrospinal fluid resting pressure by the Valsalva maneuver. Canadian Journal of Ophthalmology/Journal Canadien d'Ophtalmologie. 2005;40(6):775–777. doi: 10.1016/S0008-4182(05)80100-0. [DOI] [PubMed] [Google Scholar]
- 46.Greenfield JC, Rembert JC, Tindall GT. Transient changes in cerebral vascular resistance during the Valsalva maneuver in man. Stroke. 1984;15(1):76–79. doi: 10.1161/01.str.15.1.76. [DOI] [PubMed] [Google Scholar]


