Abstract
A basic assumption about the normal nervous system is that its neurons possess identical genomes. Here we present direct evidence for genomic variability, manifested as chromosomal aneuploidy, among developing and mature neurons. Analysis of mouse embryonic cerebral cortical neuroblasts in situ detected lagging chromosomes during mitosis, suggesting the normal generation of aneuploidy in these somatic cells. Spectral karyotype analysis identified ≈33% of neuroblasts as aneuploid. Most cells lacked one chromosome, whereas others showed hyperploidy, monosomy, and/or trisomy. The prevalence of aneuploidy was reduced by culturing cortical explants in medium containing fibroblast growth factor 2. Interphase fluorescence in situ hybridization on embryonic cortical cells supported the rate of aneuploidy observed by spectral karyotyping and detected aneuploidy in adult neurons. Our results demonstrate that genomes of developing and adult neurons can be different at the level of whole chromosomes.
The mammalian central nervous system is remarkable for its high degree of organization among vastly heterogeneous cell types of varied function. The molecular basis for this heterogeneity is thought to involve complex regulation, at both transcriptional (1) and posttranscriptional levels (2), of large and diverse gene families (3, 4). These and virtually all other mechanisms implicated in brain development, function, and disease are assumed to operate on a constant genome.
Indirect evidence for some form of somatic genomic alteration has come from nervous system expression and neurogenetic effects of a growing list of molecules that function in DNA recombination/repair and surveillance (5–14). Interestingly, many of these genes are also implicated in cancer, where a commonly associated sequela is aneuploidy. Precedent exists for aneuploidy during early mammalian development (15, 16) where it is thought to result in cell death. These observations led us to ask whether the number of chromosomes in neuroblasts and neurons is variable.
Materials and Methods
Immunohistochemistry.
Immunohistochemistry was performed as described (17). The primary anti-nestin (PharMingen) and anti-phosphorylated histone H3 (phospho-H3; Upstate Biotechnology, Lake Placid, NY) Abs were detected with a Cy3-conjugated secondary IgG (Jackson ImmunoResearch). High-power images of mitotic neuroblasts were acquired and processed by using a DeltaVision deconvolution microscope (Applied Precision, Seattle, WA). For microtubule-associated protein 2 (MAP2) staining of adult male brain, sections that had been hybridized with X and Y chromosome paints and imaged were subsequently stained with a monoclonal MAP2 Ab (Sigma) and an anti-mouse Cy3 secondary IgG (Jackson ImmunoResearch). Cells identified previously as aneuploid, based on fluorescence in situ hybridization (FISH), were reimaged after MAP2 immunohistochemistry. Images were prepared by using photoshop (Adobe Systems, Mountain View, CA).
Cell Preparation.
Animal protocols have been approved by the Animal Subjects Committee at the University of California, San Diego, and conform to National Institutes of Health guidelines and public law. BALB/c mice (Simonsen Laboratories, Gilroy, CA) were used for these analyses. Timed-pregnant females were killed by cervical dislocation, and the embryos were removed at the appropriate age [embryonic day (E) 11–E15)]. Cortical neuroblasts and splenic lymphocytes were obtained by using standard techniques (18, 19). Intact hemispheres were cultured in the presence of 50 ng/ml of fibroblast growth factor 2 (FGF-2; GIBCO/BRL) containing OptiMem (GIBCO/BRL) by using described methods (20, 21).
Spectral Karyotype (SKY).
Chromosome spreads were obtained from all cell types by using standard protocols (19). SKY and 4′,6-diamidino-2-phenylindole (DAPI; Sigma) staining were performed according to manufacturer's instructions (Applied Spectral Imaging, Carlsbad, CA). Images of chromosome spreads were acquired by using a Zeiss ×63 or ×100 objective with an interferometer and charge-coupled device camera (Applied Spectral Imaging).
FISH.
Interphase nuclei from embryonic and adult cerebral cortex were harvested for FISH by detergent-lysis, centrifuged at 500 × g, and affixed to glass slides (19). Frozen sections of adult brain (10–14 μm) were prepared by using immunohistochemical protocols. Hybridization with X and Y chromosome paints (Applied Spectral Imaging) was performed per manufacturer's instructions. Nuclei (300) from each animal were examined for X and Y chromosome hybridization signals. Nuclei were not counted if both X and Y signals were absent. Images were captured with a charge-coupled device camera and prepared by using photoshop.
Flow Cytometric Analysis of DNA Content.
Lymphocytes and neuroblasts were stained with propidium iodide, and DNA content was determined by flow cytometry as described (22). Chick erythrocyte nuclei (Biosure, Grass Valley, CA) were used at one-tenth the sample concentration. Cerebral cortices of E12 embryos were prepared as for SKY, and paired hemispheres were analyzed separately. One hemisphere was prepared immediately for flow cytometry, whereas the other was cultured for 2 days in FGF-2 before analysis by flow cytometry.
Results
Lagging Chromosomes in Mitotic Cerebral Cortical Neuroblasts.
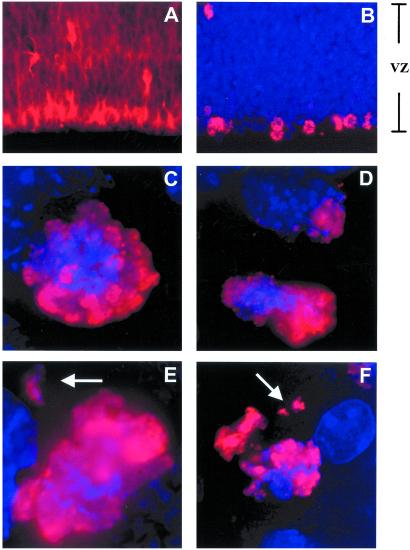
We examined proliferating cerebral cortical neuroblasts isolated from E11 to E17, the period of neurogenesis in mice (23). Postmitotic cortical neurons arise from neuroblasts located in the ventricular zone, a region lining the lateral ventricles of the cerebral hemispheres (24). Neuroblasts can be identified by their birthdate (23) and immunoreactivity for the intermediate filament protein, nestin (ref. 25; Fig. 1A). Such combined birthdating and immunohistochemical analyses of embryonic preparations used in this study indicated that over 95% of examined cells were nestin-immunoreactive neuroblasts (data not shown).
Figure 1.
Mitotic neuroblasts in the embryonic mouse cortex with lagging chromosomes. (A and B) Low magnification (×20) micrographs of the embryonic cerebral cortex. Immunofluorescence for the intermediate filament protein nestin (A), a neural progenitor cell marker, illustrates the distribution of neuroblasts in the ventricular zone (VZ) of the embryonic cerebral cortex. Phospho-H3 labeling (B, red) reveals mitotic neuroblasts concentrated at the ventricular surface (bottom) of the VZ. Nuclei are counterstained with DAPI (blue). (C–F) High magnification (×100) Z stacks from deconvolution microscopy of phospho-H3-labeled mitotic figures at the bottom of the VZ reveal morphologically normal prometaphase/metaphase (C) and anaphase (D) profiles. In addition, lagging chromosomes (arrows) are readily observed in prometaphase/metaphase (E) and anaphase (F) profiles.
Chromosomes of mitotic neuroblasts can be visualized by immunostaining for phospho-H3 (Fig. 1B; ref. 26). To examine chromosome segregation in dividing neuroblasts, freshly prepared tissue sections from the embryonic cerebral cortex were immunostained for phospho-H3 and DAPI. Deconvolution microscopy produced three-dimensional images of condensed chromosomes in mitotic neuroblasts (representative Z stacks are shown in Fig. 1 C–F and in Movies 1–3, which are published as supporting information on the PNAS web site, www.pnas.org). Although the majority of profiles appeared normal (Fig. 1 C and D), a common finding was the presence of lagging chromosomes. Lagging chromosomes (Fig. 1 E and F) are physically separated from the other condensed chromosomes and are indicative of aneuploidy in other systems (27–29). This observation predicted the presence of aneuploid neuroblasts during cortical neurogenesis.
Aneuploid Neuroblasts Identified by SKY.
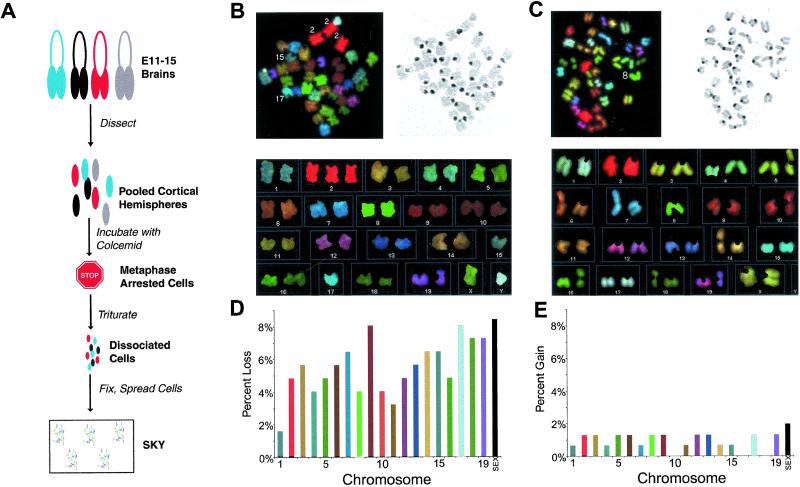
We used SKY (30) to assess chromosomal number and identity in neuroblasts. In mice, karyotype analysis is technically demanding because mouse chromosomes are acrocentric and of similar size. The SKY technique uses labeled DNA probes to “paint” each chromosome a spectral color with a unique combination of fluorophores. Analysis software interprets the spectral color and assigns a chromosomal identity to prometaphase/metaphase genomic DNA. Over 220 cortical neuroblasts, 7-fold more than typically analyzed in SKY studies (12, 14), were karyotyped by SKY from 40 BALB/c embryos (Fig. 2A). SKY revealed a range of numerical chromosomal abnormalities in neuroblasts, including trisomies (Fig. 2B) and multiple monosomies (Fig. 2 B and C); no obvious structural abnormalities were consistently observed. Approximately 33% of neuroblasts were aneuploid (Table 1), with 98% of these hypoploid (Fig. 3B). Individual chromosomes were observed missing at rates from 1.6% to 8.4% (Fig. 2D) and were gained at rates of less than 2% (Fig. 2E). Similar results were obtained in other mouse strains (data not shown). In striking contrast, routine karyotyping of lymphocytes (31) identified only 3 aneuploid spreads of 88 observed (≈3%) from the parents of embryos used (Table 1). This low rate of lymphocyte aneuploidy is consistent with previous reports in humans and mice (32–34) and is significantly different (P < 10−7) from that observed in neuroblasts.
Figure 2.
Aneuploid neuroblasts in the embryonic mouse brain. (A) Flowchart summarizing the protocol for neuroblast SKY. Cortical hemispheres were pooled from embryonic littermates to ensure abundant prometaphase/metaphase spreads. (B and C) SKYs from representative aneuploid prometaphase/metaphase embryonic neuroblasts. (Top Left and Right) Spectral and inverse DAPI images of chromosome spreads are shown, respectively. (Bottom) The karyotypes are shown. Note that each different chromosome has a unique spectral color. Euploid chromosome number in mice is 40. The prometaphase/metaphase spread in B has an extra copy of chromosome 2, but has only 1 copy of chromosomes 15 and 17 (39, XY, +2, −15, −17). The prometaphase/metaphase spread in C has only 1 copy of chromosome 8 (39, XX, −8). Observed loss and gain of whole chromosomes appeared to be similar between males and females. (D and E) Graphs show the percentage of loss (D) and gain (E) of specific chromosomes in neuroblasts. Bars are color-coded based on the spectral color of each chromosome (except for sex chromosomes). Specific chromosomes are lost at rates of 1.6–8.4% of cells analyzed and are gained at rates of less than 2%.
Table 1.
Rates of aneuploidy in adult lymphocytes, acutely isolated embryonic neuroblasts, and cultured neuroblasts (2 days in vitro with FGF-2) revealed by SKY
 |
, P < 10−7, χ2;
, P < 0.01, χ2.
Figure 3.
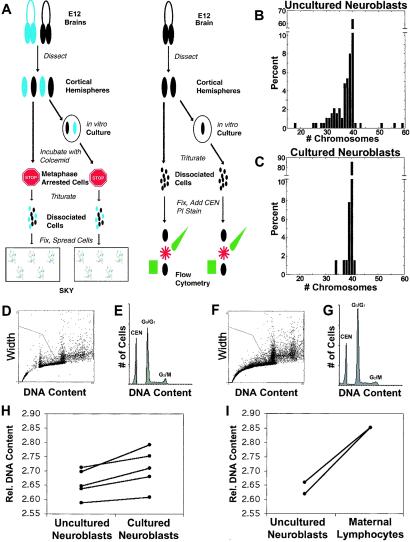
The rate of aneuploidy is attenuated in vitro. (A) Flowchart summarizing the protocol for comparison of uncultured (acutely isolated) and cultured neuroblasts by SKY and flow cytometry. (B and C) Chromosome count histograms from SKY analysis of uncultured (B) and cultured with FGF-2 (C) neuroblasts reveal a decrease in the proportion of aneuploid cells in cultured preparations. The fraction of cells missing more than one chromosome was lower in cultured than in uncultured neuroblasts. In both conditions, the majority of prometaphases/metaphases examined had 40 chromosomes; among aneuploid cells, the majority had lost chromosomes. The mean number of chromosomes is 38.69 for uncultured neuroblasts and 39.77 for cultured neuroblasts, a difference of 2.78%. (D–G) Flow cytometric analysis of propidium iodide-stained neuroblasts from uncultured (D and E) and cultured (F and G) cortical hemispheres. DNA content histograms for uncultured (E) and cultured (G) neuroblasts are qualitatively similar. For quantitation of DNA content, Gaussians were fit to the G0/G1 and chick erythrocyte nuclei (CEN) peaks. Relative DNA content was expressed as the ratio of the mean of the G0/G1 peak to the mean of the CEN peak. (H) Cultured neuroblasts have 2% more genomic DNA on average than uncultured neuroblasts (P < 0.01, paired t test). Each solid line connects uncultured to cultured samples from the same animal. Error bars are omitted for visual clarity but were never greater than 0.55%. (I) Maternal lymphocytes have more genomic DNA than uncultured neuroblasts.
Aneuploidy Altered by Culturing with FGF-2.
To examine whether the rate of neuroblast aneuploidy could be altered experimentally, intact cortical hemispheres were cultured for 2 days in vitro with FGF-2, a well documented neuroblast mitogen that promotes the growth of less differentiated cells (35), before SKY analysis. This approach allowed us to alter a single variable—growth condition—in otherwise identical preparations (Fig. 3A). Culturing reduced the overall prevalence of aneuploidy to 14%, compared with a rate of 33% in freshly isolated neuroblasts (P < 0.001; Table 1 and Fig. 3 B and C). This result indicated that the proportion of aneuploid cells could be experimentally reduced by growth conditions. Interestingly, the reduction in aneuploidy appears to be the result of the preferential loss of those cells with greater than one chromosome gained or lost, because the population missing just one chromosome remained comparatively unchanged (Fig. 3 B and C).
The different rates of chromosome loss revealed by SKY in cultured as compared with freshly isolated cerebral cortical neuroblasts predicted a small difference in total DNA content between the two populations. Based on SKY data, the mean DNA content in freshly isolated neuroblasts (mean chromosome number = 38.69) would be 2.78% less than cultured neuroblasts (mean chromosome number = 39.77). To measure such hypothesized differences, flow cytometric analysis of propidium iodide-stained cells, capable of detecting DNA content differences of this magnitude (22), was used. In control studies, the mean G0/G1 DNA content of adult BALB/c lymphocytes was determined to be 6.30 ± 0.02 pg per cell in females and 6.17 ± 0.01 pg per cell in males (mean ± standard error). These values agreed with those reported for BALB/c females and males of 6.38 pg per cell and 6.16 pg per cell, respectively (22).
Neuroblasts from the same brain were analyzed by flow cytometry immediately, or following culture (Fig. 3A). Chick erythrocyte nuclei were included as internal controls in all samples. Measurements were made in triplicate, and identical gating parameters were used for all samples (Fig. 3 D and F). The mean G0/G1 DNA content of freshly isolated neuroblasts was always less than that of cultured neuroblasts (Fig. 3 E, G, and H). The average difference in DNA content between conditions was 2.0% (P < 0.01), in agreement with the predicted difference of 2.78% from SKY data.
We also compared the mean G0/G1 DNA content of female uncultured neuroblasts and adult (maternal) lymphocytes. As expected from SKY analyses of these cells, neuroblasts with increased hypoploidy exhibited less DNA content than the substantially more euploid adult lymphocytes (Fig. 3I; cf. Table 1).
Aneuploid Neurons Identified by Interphase FISH.
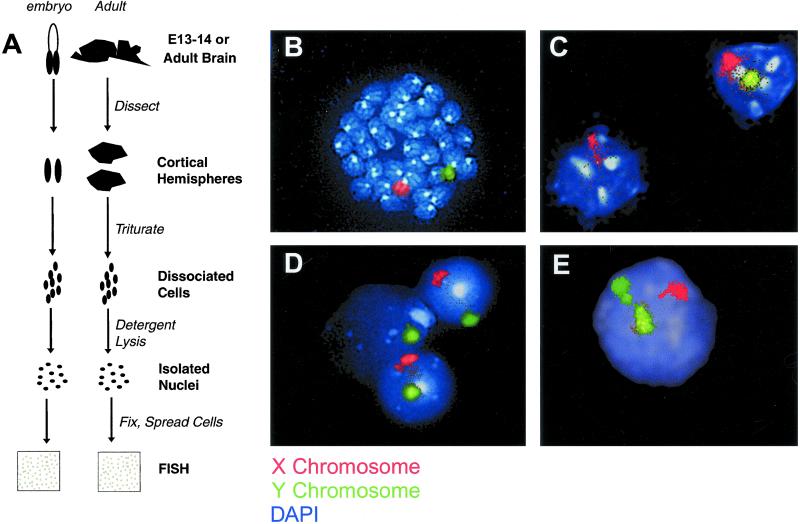
To assess the rate of aneuploidy in interphase embryonic neuroblasts and neurons, we optimized two-color FISH by using X and Y chromosome paints (XY FISH) on samples from male (XY) mice (Fig. 4A). Chromosome paints hybridize to sequences along the entire length of a chromosome, providing better chromosome detection compared with point probes. The use of paints for two different chromosomes controlled against hybridization-dependent false negatives. Analysis of sex chromosomes in males with a red X paint and a green Y paint allowed less ambiguous detection than for an autosomal pair.
Figure 4.
Aneuploid cells in the adult mouse brain. (A) Flowchart summarizing the protocol for XY FISH on isolated nuclei from embryonic and adult cerebral cortices. (B) A male lymphocyte prometaphase/metaphase spread hybridized with X (red) and Y (green) chromosome paints illustrates the specificity of these reagents. (C–E) Isolated interphase nuclei from adult male cortices were hybridized with X (red) and Y (green) chromosome paints. Nuclei were counterstained with DAPI (blue/white). Euploid male nuclei showed exactly one painted X chromosome (red) and one painted Y chromosome (green). (C) The nucleus on the right contains both an X and a Y chromosome, whereas the nucleus on the left is missing Y. (D) The nucleus in the middle is missing X, whereas the two nuclei flanking it are euploid. (E) This nucleus contains an extra Y chromosome.
The XY FISH technique was validated on stimulated lymphocytes. These preparations contained both interphase nuclei and prometaphase/metaphase chromosome spreads (Fig. 4B). XY FISH detected equivalent rates of sex chromosome loss (≈1%) in both populations (Table 2) and matched the rate of sex chromosome loss measured by SKY (data not shown). Application of this approach to embryonic cerebral cortical cells revealed that 5.90% of these nuclei were missing an X or Y chromosome, whereas 0.84% of nuclei had gained an X or Y (Table 2). This result agrees with the ≈8% loss and 2% gain measured in neuroblast prometaphase/metaphase spreads by SKY (Fig. 2 D and E).
Table 2.
Rates of sex chromosome loss and gain measured by XY FISH
| Sample | Normal X and Y, % | Lost Y, % | Lost X, % | Total lost, % | Gained Y, % | Gained X, % | Total gained, % |
|---|---|---|---|---|---|---|---|
| Adult lymphocyte metaphases | 99.04 | 0.96 | 0.00 | 0.96 | — | — | — |
| Adult lymphocyte interphases | 98.81 | 0.59 | 0.59 | 1.19 | — | — | — |
| Embryonic cortex | 93.26 | 4.50 | 1.40 | 5.90 | 0.17 | 0.67 | 0.84 |
| Adult cortex | 98.84 | 0.64 | 0.37 | 1.01 | 0.10 | 0.05 | 0.15 |
| Adult cortex ≥10 μm | 98.85 | 0.29 | 0.14 | 0.43 | 0.43 | 0.29 | 0.72 |
Cells were isolated from adult lymphocytes and E13–E14 and adult cerebral cortices. ≥10 μm, isolated adult cortical nuclei with diameters greater than or equal to 10 μm.
Neurons are postmitotic, and thus SKY cannot be used to measure mitotic neuronal aneuploidy in the adult brain. However, XY FISH, which analyzes interphase chromosomes and produces results in agreement with SKY (see above), could be used to detect aneuploidy in adult neurons. Isolated nuclei from the adult male cerebral cortex (Fig. 4 C–E) revealed aneuploidy in nuclei typical of neurons (nuclear diameter ≥ 10 μm; Table 2; ref. 36). Adult nuclei were missing an X or Y chromosome at a rate of 1.01%, whereas 0.15% had gained an X or Y (Table 2). These rates, as with all XY FISH measurements, were lower than the rate of aneuploidy measured by SKY (33%). XY FISH analysis measured only sex chromosome gain and loss, whereas SKY data assessed all chromosomes (Fig. 2 D and E). Therefore, the overall percentage of aneuploid cells in the adult cortex is likely to be higher than that measured with XY FISH.
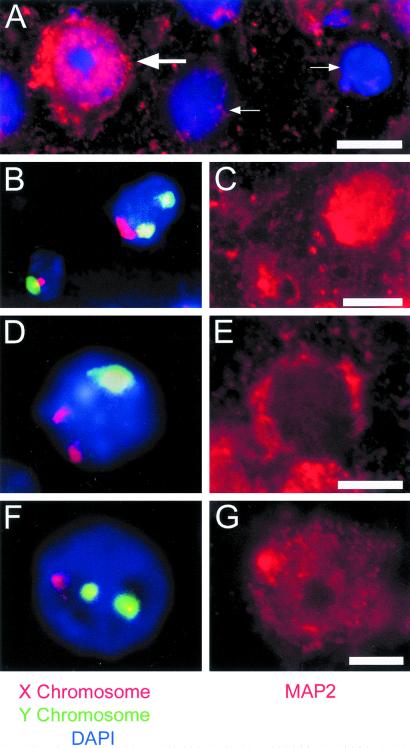
Aneuploid nuclei from the adult cortex were likely neuronal based on their large diameters, but positive identification was complicated by loss of cytoskeletal antigens during nuclear isolation. To determine the cellular identity of aneuploid nuclei, XY FISH was combined with immunohistochemistry on adult tissue sections. Aneuploid nuclei were identified in adult cortical cells that were also immunoreactive for the neuronal marker, MAP2 (Fig. 5; ref. 37). MAP2-immunoreactive aneuploid cells were also observed throughout the central nervous system, including the cerebellum and hippocampus (data not shown).
Figure 5.
Aneuploid cells in the adult cortex are neurons. (A) The presence of both MAP2-positive (large arrow) and MAP2-negative (small arrows) cells in a 10 μm section through adult cerebral cortex demonstrates the specificity of MAP2 labeling (red). Nuclei were counterstained with DAPI (blue). (B–G) Cells in 10 μm sections through the adult male cortex were hybridized with X (red) and Y (green) chromosome paints (B, D, and F). Cells in these same 10 μm sections were then immunostained for MAP2 (C, E, and G). (B and C) The cell on the left contains both an X and a Y chromosome, whereas the cell on the right has an extra Y chromosome (B). The cell with 2 Y chromosomes is MAP2-positive (C). These cells are in visual cortex. (D and E) A cell in motor cortex contains an extra X chromosome (D) and is MAP2-positive (E). (F and G) A cell in motor cortex contains an extra Y chromosome (F) and is MAP2-positive (G). [Bars = 10 μm (A and C) and 5 μm (E and G).]
Discussion
The fundamental observation of this study is neuroblast aneuploidy. By comparison to an accepted cytogenetic standard, lymphocytes, 10 times as many neuroblasts were aneuploid. This surprising extent of aneuploidy led us to seriously question these results. However, no artifact or combination of artifacts can reasonably explain these data, and multiple lines of evidence supporting the existence of aneuploidy include the following: (i) Lagging chromosomes were commonly seen in neurogenic regions of freshly isolated embryonic cortex. This observation suggests an innate biological mechanism for generating aneuploidy. (ii) Approximately 97% of adult lymphocytes were identified as euploid by SKY and >98% contained both sex chromosomes as measured by XY FISH. Thus, the approaches used in the present study can reliably identify euploid cells. (iii) Some neuroblasts were hyperploid, whereas some hypoploid cells were trisomic for individual chromosomes. This result renders trivial explanations of chromosome loss during sample preparation extremely unlikely. (iv) DNA content measured by flow cytometry is independent of nucleotide hybridization used for SKY and FISH, yet flow cytometry also detected differences in mean DNA content consistent with SKY and XY FISH analyses. In addition, aneuploidy could be altered by culturing as measured by both SKY and flow cytometry. These data demonstrate that aneuploidy, as measured by two different techniques, can be experimentally altered. (v) XY FISH detects aneuploidy at rates comparable to those observed by SKY, despite use of fundamentally different tissue preparations. This observation further demonstrates that aneuploidy cannot be explained by an artifact like sample preparation. From these and other considerations, we conclude that the aneuploidy observed in neuroblasts and neurons is not caused by technical artifact but instead reflects the normal existence of aneuploid neuroblasts.
What is the fate of aneuploid neuroblasts? One probable fate is cell death, as observed in aneuploid embryos during in vitro fertilization (15, 16, 38). The decreased aneuploidy we observed in the adult cortex relative to the embryonic cortex suggests that aneuploid neuroblasts may be preferentially prone to cell death during central nervous system development. This fate is consistent with ongoing programmed cell death normally occurring in neuroproliferative zones (39–41). However, as observed in cancer cells (42), aneuploidy may not necessarily augur death. Our observations of aneuploid interphase neuroblasts during embryonic development and of MAP2-immunoreactive aneuploid cells in the adult brain support the view that a significant population of aneuploid neuroblasts can survive for periods of time, including survival into adulthood as postmitotic neurons. An alternative, but not mutually exclusive, possibility is that mature neurons may also undergo distinct processes resulting in aneuploidy.
Our results indicate that the central nervous system, both during development and in adulthood, is a genetic mosaic: a euploid population intermixed with a smaller but genetically diverse aneuploid population. Such mosaicism may have relevance to a variety of fields including stem cell biology, mammalian cloning, genomics, neurogenetics, and neuropsychiatric diseases. The biological consequences of neural aneuploidy may be similar to X-inactivation, genetic imprinting (43), or allelic inactivation (44). One possibility is that aneuploid neuroblasts and neurons have quantitatively altered signaling properties (45–47) through mechanisms like ploidy-dependent gene expression (48). Aneuploidy in solitary non-neoplastic cells may be of little consequence to the organism. However, we note that a hallmark of the nervous system is its myriad connections that form elaborate and functionally essential neural networks. In this setting, the presence of even a few genomically distinct neurons with altered physiology could have substantial effects on networks formed by interconnected cells. At the organismal level, these permanent genomic changes might contribute to physiological and behavioral variation among individuals not accounted for by classical genetics.
Supplementary Material
Acknowledgments
We are grateful to Drs. D. Baltimore, D. Cleveland, and C. Lois for critical reading of this manuscript. We thank C. Akita and M. Fontanoz for technical assistance; C. Cox for copyediting the manuscript; and Drs. M. J. Difilippantonio, K. Arden, L. Geise, F. Canavez, J. J. A. Contos, J. S. Isaacson, N. Fukushima, I. Ishii, and H. L. Borges for helpful discussions. This work was supported by the National Institute of Mental Health and an unrestricted gift from Merck Research Laboratories (to J.C.); by predoctoral support from the National Science Foundation (to D.K.) and a National Institute of General Medical Sciences Pharmacology training grant (to M.J.M. and A.H.Y.); by postdoctoral support from the Pew Latin American Fellows in the Biomedical Sciences and Conselho Nacional de Pesquisas (Brazil) (to S.K.R.) and by a Neuroplasticity of Aging training grant (to M.A.K.).
Abbreviations
- SKY
spectral karyotype
- FISH
fluorescence in situ hybridization
- MAP2
microtubule-associated protein 2
- En
embryonic day n
- FGF-2
fibroblast growth factor 2
- DAPI
4′,6-diamidino-2-phenylindole
- phospho-H3
phosphorylated histone H3
- XY FISH
two-color FISH using X and Y chromosome paints
References
- 1.Marin O, Anderson S A, Rubenstein J L. J Neurosci. 2000;20:6063–6076. doi: 10.1523/JNEUROSCI.20-16-06063.2000. [DOI] [PMC free article] [PubMed] [Google Scholar]
- 2.Schmucker D, Clemens J C, Shu H, Worby C A, Xiao J, Muda M, Dixon J E, Zipursky S L. Cell. 2000;101:671–684. doi: 10.1016/s0092-8674(00)80878-8. [DOI] [PubMed] [Google Scholar]
- 3.Wu Q, Maniatis T. Cell. 1999;97:779–790. doi: 10.1016/s0092-8674(00)80789-8. [DOI] [PubMed] [Google Scholar]
- 4.Yagi T, Takeichi M. Genes Dev. 2000;14:1169–1180. [PubMed] [Google Scholar]
- 5.Chun J, Schatz D G. Neuron. 1999;22:7–10. doi: 10.1016/s0896-6273(00)80671-6. [DOI] [PubMed] [Google Scholar]
- 6.Chun J, Schatz D G. Curr Biol. 1999;9:R251–R253. doi: 10.1016/s0960-9822(99)80156-0. [DOI] [PubMed] [Google Scholar]
- 7.Rolig R L, McKinnon P J. Trends Neurosci. 2000;23:417–424. doi: 10.1016/s0166-2236(00)01625-8. [DOI] [PubMed] [Google Scholar]
- 8.Lee Y, McKinnon P J. Apoptosis. 2000;5:523–529. doi: 10.1023/a:1009637512917. [DOI] [PubMed] [Google Scholar]
- 9.Yang X, Li W, Prescott E D, Burden S J, Wang J C. Science. 2000;287:131–134. doi: 10.1126/science.287.5450.131. [DOI] [PubMed] [Google Scholar]
- 10.Gao Y, Sun Y, Frank K M, Dikkes P, Fujiwara Y, Seidl K J, Sekiguchi J M, Rathbun G A, Swat W, Wang J, et al. Cell. 1998;95:891–902. doi: 10.1016/s0092-8674(00)81714-6. [DOI] [PubMed] [Google Scholar]
- 11.Gu Y, Sekiguchi J, Gao Y, Dikkes P, Frank K, Ferguson D, Hasty P, Chun J, Alt F W. Proc Natl Acad Sci USA. 2000;97:2668–2673. doi: 10.1073/pnas.97.6.2668. [DOI] [PMC free article] [PubMed] [Google Scholar]
- 12.Sekiguchi J, Ferguson D O, Chen H T, Yang E M, Earle J, Frank K, Whitlow S, Gu Y, Xu Y, Nussenzweig A, Alt F W. Proc Natl Acad Sci USA. 2001;98:3243–3248. doi: 10.1073/pnas.051632098. . (First Published March 6, 2001; 10.1073/pnas.051632098) [DOI] [PMC free article] [PubMed] [Google Scholar]
- 13.Gao Y, Ferguson D O, Xie W, Manis J P, Sekiguchi J, Frank K M, Chaudhuri J, Horner J, DePinho R A, Alt F W. Nature (London) 2000;404:897–900. doi: 10.1038/35009138. [DOI] [PubMed] [Google Scholar]
- 14.Allen D M, van Praag H, Ray J, Weaver Z, Winrow C J, Carter T A, Braquet R, Harrington E, Ried T, Brown K D, Gage F H, Barlow C. Genes Dev. 2001;15:554–566. doi: 10.1101/gad.869001. [DOI] [PMC free article] [PubMed] [Google Scholar]
- 15.Voullaire L, Slater H, Williamson R, Wilton L. Hum Genet. 2000;106:210–217. doi: 10.1007/s004390051030. [DOI] [PubMed] [Google Scholar]
- 16.Harrison R H, Kuo H C, Scriven P N, Handyside A H, Ogilvie C M. Zygote. 2000;8:217–224. doi: 10.1017/s0967199400001015. [DOI] [PubMed] [Google Scholar]
- 17.Weiner J A, Chun J. J Neurosci. 1997;17:3148–3156. doi: 10.1523/JNEUROSCI.17-09-03148.1997. [DOI] [PMC free article] [PubMed] [Google Scholar]
- 18.Fukushima N, Weiner J A, Chun J. Dev Biol. 2000;228:6–18. doi: 10.1006/dbio.2000.9930. [DOI] [PubMed] [Google Scholar]
- 19.Barch M J, Knutsen T, Spurbeck J L. The AGT Cytogenetics Laboratory Manual. Philadelphia: Lippincott; 1997. [Google Scholar]
- 20.Rehen S K, Varella M H, Freitas F G, Moraes M O, Linden R. Development (Cambridge, UK) 1996;122:1439–1448. doi: 10.1242/dev.122.5.1439. [DOI] [PubMed] [Google Scholar]
- 21.Rehen S K, Neves D D, Fragel-Madeira L, Britto L R, Linden R. Eur J Neurosci. 1999;11:4349–4356. doi: 10.1046/j.1460-9568.1999.00868.x. [DOI] [PubMed] [Google Scholar]
- 22.Capparelli R, Cottone C, D'Apice L, Viscardi M, Colantonio L, Lucretti S, Iannelli D. Cytometry. 1997;29:261–266. doi: 10.1002/(sici)1097-0320(19971101)29:3<261::aid-cyto9>3.0.co;2-e. [DOI] [PubMed] [Google Scholar]
- 23.Angevine J B, Sidman R L. Nature (London) 1961;192:766–768. doi: 10.1038/192766b0. [DOI] [PubMed] [Google Scholar]
- 24.Bayer S A, Altman J. Neocortical Development. New York: Raven; 1991. [Google Scholar]
- 25.Dahlstrand J, Lardelli M, Lendahl U. Brain Res Dev Brain Res. 1995;84:109–129. doi: 10.1016/0165-3806(94)00162-s. [DOI] [PubMed] [Google Scholar]
- 26.Hendzel M J, Wei Y, Mancini M A, Van Hooser A, Ranalli T, Brinkley B R, Bazett-Jones D P, Allis C D. Chromosoma. 1997;106:348–360. doi: 10.1007/s004120050256. [DOI] [PubMed] [Google Scholar]
- 27.Cimini D, Howell B, Maddox P, Khodjakov A, Degrassi F, Salmon E D. J Cell Biol. 2001;153:517–527. doi: 10.1083/jcb.153.3.517. [DOI] [PMC free article] [PubMed] [Google Scholar]
- 28.Shah J V, Cleveland D W. Cell. 2000;103:997–1000. doi: 10.1016/s0092-8674(00)00202-6. [DOI] [PubMed] [Google Scholar]
- 29.Abrieu A, Kahana J A, Wood K W, Cleveland D W. Cell. 2000;102:817–826. doi: 10.1016/s0092-8674(00)00070-2. [DOI] [PubMed] [Google Scholar]
- 30.Liyanage M, Coleman A, du Manoir S, Veldman T, McCormack S, Dickson R B, Barlow C, Wynshaw-Boris A, Janz S, Wienberg J, et al. Nat Genet. 1996;14:312–315. doi: 10.1038/ng1196-312. [DOI] [PubMed] [Google Scholar]
- 31.Cimino M C, Tice R R, Liang J C. Mutat Res. 1986;167:107–122. doi: 10.1016/0165-1110(86)90012-6. [DOI] [PubMed] [Google Scholar]
- 32.Neurath P, DeRemer K, Bell B, Jarvik, Kato T. Nature (London) 1970;225:281–282. doi: 10.1038/225281a0. [DOI] [PubMed] [Google Scholar]
- 33.Guttenbach M, Koschorz B, Bernthaler U, Grimm T, Schmid M. Am J Hum Genet. 1995;57:1143–1150. [PMC free article] [PubMed] [Google Scholar]
- 34.Burns E M, Christopoulou L, Corish P, Tyler-Smith C. J Cell Sci. 1999;112:2705–2714. doi: 10.1242/jcs.112.16.2705. [DOI] [PubMed] [Google Scholar]
- 35.Ghosh A, Greenberg M E. Neuron. 1995;15:89–103. doi: 10.1016/0896-6273(95)90067-5. [DOI] [PubMed] [Google Scholar]
- 36.Peters A, Palay S, Webster H d. The Fine Structure of the Nervous System. Philadelphia: Saunders; 1976. [Google Scholar]
- 37.Shafit-Zagardo B, Kalcheva N. Mol Neurobiol. 1998;16:149–162. doi: 10.1007/BF02740642. [DOI] [PubMed] [Google Scholar]
- 38.Ogasawara M, Aoki K, Okada S, Suzumori K. Fertil Steril. 2000;73:300–304. doi: 10.1016/s0015-0282(99)00495-1. [DOI] [PubMed] [Google Scholar]
- 39.Blaschke A J, Staley K, Chun J. Development (Cambridge, UK) 1996;122:1165–1174. doi: 10.1242/dev.122.4.1165. [DOI] [PubMed] [Google Scholar]
- 40.Blaschke A J, Weiner J A, Chun J. J Comp Neurol. 1998;396:39–50. doi: 10.1002/(sici)1096-9861(19980622)396:1<39::aid-cne4>3.0.co;2-j. [DOI] [PubMed] [Google Scholar]
- 41.Pompeiano M, Blaschke A J, Flavell R A, Srinivasan A, Chun J. J Comp Neurol. 2000;423:1–12. [PubMed] [Google Scholar]
- 42.Lengauer C, Kinzler K W, Vogelstein B. Nature (London) 1998;396:643–649. doi: 10.1038/25292. [DOI] [PubMed] [Google Scholar]
- 43.Ohlsson R, Paldi A, Graves J A. Trends Genet. 2001;17:136–141. doi: 10.1016/s0168-9525(00)02211-3. [DOI] [PubMed] [Google Scholar]
- 44.Chess A, Simon I, Cedar H, Axel R. Cell. 1994;78:823–834. doi: 10.1016/s0092-8674(94)90562-2. [DOI] [PubMed] [Google Scholar]
- 45.Bhalla U S, Iyengar R. Science. 1999;283:381–387. doi: 10.1126/science.283.5400.381. [DOI] [PubMed] [Google Scholar]
- 46.Koch C, Laurent G. Science. 1999;284:96–98. doi: 10.1126/science.284.5411.96. [DOI] [PubMed] [Google Scholar]
- 47.Weng G, Bhalla U S, Iyengar R. Science. 1999;284:92–96. doi: 10.1126/science.284.5411.92. [DOI] [PMC free article] [PubMed] [Google Scholar]
- 48.Galitski T, Saldanha A J, Styles C A, Lander E S, Fink G R. Science. 1999;285:251–254. doi: 10.1126/science.285.5425.251. [DOI] [PubMed] [Google Scholar]
Associated Data
This section collects any data citations, data availability statements, or supplementary materials included in this article.


