

Abstract
Altered immune function is an established finding in psychotic disorders such as schizophrenia and bipolar disorder with psychosis, though its role in their development and progression remains to be understood. Evidence suggests altered JAK-STAT1 pathway activity in peripheral blood cells from participants with schizophrenia compared to controls. Activation of this pathway leads to increased expression of complement component 4A (C4A), which has recently been implicated in schizophrenia. Here, we examine mRNA expression of C4A in peripheral blood cells from participants with schizophrenia, bipolar disorder and controls. STAT1 and IRF-1 mRNA expression are included as measures of JAK-STAT1 pathway activation in the same participants. Further, we examine the association of each genes mRNA expression with clinical symptom measures using the Positive and Negative Syndrome Scale (PANSS) and the Psychotic Symptom Rating Scale (PSYRATS). We demonstrate that C4A, STAT1 and IRF-1 mRNA expression levels are correlated across the entire sample, indicating shared transcriptional regulatory mechanisms. Secondly, we show that C4A mRNA expression alone is positively associated with psychotic symptomatology, specifically the presence and severity of delusions. These findings are noteworthy given recent findings that demonstrate a critical role for complement proteins in synaptic pruning, alterations of which are proposed to contribute to psychopathology in psychosis.
Keywords: schizophrenia, bipolar, psychosis, C4A, complement, immune
1. BACKGROUND
Altered immune system activity has been repeatedly demonstrated in individuals with schizophrenia and bipolar disorder, though a clear mechanistic understanding of the cause and consequence of immune activation remains to be elucidated (Beumer et al., 2012; Miller and Goldsmith, 2016). We have recently shown that a subset of individuals with schizophrenia have elevated levels of phosphorylated STAT1 (pSTAT1-Y701) in peripheral blood mononuclear cell (PBMC) nuclear extracts, indicating activation of the JAK/STAT1 signaling pathway (Sharma et al., 2016). This pathway is involved in the activation of myeloid cells to an inflammatory phenotype and is downstream of a number of keymembrane cytokine receptors, including interferon gamma (IFN-γ), which demonstrates altered expression in schizophrenia (Miller et al., 2011; Rauch et al., 2013). Complement component 4A (C4A) was among the top 20 most significantly enriched genes in a genome-wide study of STAT1 binding regions, and demonstrated a strong transcriptional response measured by increased mRNA expression following cytokine stimulation (Satoh and Tabunoki, 2013). Interestingly, C4A has recently been implicated in schizophrenia (Sekar et al., 2016). Sekar and colleagues (2016) demonstrated that common structural variants of the C4 gene region which lead to the greatest expression of C4A mRNA also confer risk for developing schizophrenia. Additionally, C4A mRNA expression was elevated in multiple areas of post-mortem brain from individuals with schizophrenia compared to controls.
As C4A is strongly induced by activation of the JAK-STAT1 pathway we hypothesized that elevated C4A mRNA expression in schizophrenia could also reflect altered immune activity. While we have not investigated JAK-STAT1 signaling in participants with bipolar disorder, the overlap between these disorders with regards to the presence of peripheral inflammation is well documented (Drexhage et al., 2010; Goldsmith et al., 2016). Previous reports comparing serum C4 protein levels in schizophrenia and bipolar disorder to controls have had mixed results (dos Santos Soria et al., 2012; Mayilyan et al., 2008; Wadee et al., 2002). However, these studies are somewhat difficult to interpret because they do not distinguish between C4A and C4B protein isoforms. To our knowledge, the JAK-STAT1 signaling pathway has not been directly investigated in post-mortem tissue from individuals with a diagnosis of schizophrenia or bipolar disorder. However, results of microarray studies often show differential expression of genes involved in the immune response in both blood and brain, and mega-analysis of these findings revealed a significant enrichment of the hallmark IFN-γ response gene set in schizophrenia post-mortem brain (Bergon et al., 2015; Hess et al., 2016)
Additionally, while a number of peripheral immune markers have been associated with specific categories of psychopathology such as positive symptomatology and cognitive deficits in both schizophrenia and bipolar disorder (Cabrera et al., 2016; Chase et al., 2016; Hope et al., 2015, 2013), to our knowledge the relationship of complement expression and clinical variables in these disorders has not been previously addressed in the scientific literature. Given the complexity, heterogeneity and lack of definitive diagnostic borders of schizophrenia and bipolar disorder, it is critical to consider not only diagnostic categories but to also examine more closely the association between immune activation and symptom clusters (i.e. delusions, hallucinations, thought disorder).
Our objective, therefore, was a) to measure C4A mRNA expression in a sample of participants with schizophrenia, bipolar disorder with psychosis and controls, b) to determine whether C4A mRNA expression is associated with mRNA expression of STAT1 and IRF-1, used as measures of JAK-STAT1 pathway activity (Satoh and Tabunoki, 2013; Waddell et al., 2010), and c) to examine the relationship of C4A mRNA expression with diagnosis, clinical metrics and symptomatology.
2. METHODS
2.1 Participant information and clinical measures
The study was approved by the IRB of the University of Illinois, and signed consent was obtained prior to the initiation of study procedures. Inclusion criteria for the study included persons between the ages of 21 and 60 who met DSM-IV diagnostic criteria for schizophrenia or persons with no history of a psychiatric disorder. Exclusion criteria included treatment with VPA, carbamazepine, or clozapine in the previous 30 days, current substance dependence, seizure disorders, and neurological conditions. Consensus diagnoses were determined by both the clinical and research team using the Structured Clinical Interview for DSM-IVTR (First et al., 2002) and available collateral information. Demographic characteristics for the sample were obtained at the study evaluation and are outlined in Table 1. Antipsychotic use for participants with schizophrenia was converted to chlorpromazine equivalents (CPZE) (Danivas, V. Venkatasubramanian, 2013; Gardner et al., 2010). The Positive and Negative Syndrome Scale (PANSS) was administered to participants with schizophrenia and bipolar disorder with psychosis, and the Psychotic Symptom Rating Scale (PSYRATS) was administered to a subset of 54 participants with schizophrenia or bipolar with psychosis (Haddock et al., 1999; Kay et al., 1989).
Table 1.
Demographic metrics displayed by participant group.
| Demographic | Control | Schizophrenia | Bipolar | |||
|---|---|---|---|---|---|---|
| Sex | n | n | n | |||
| Female | 25 | 24 | 11 | |||
| Male | 19 | 39 | 12 | |||
| Total | 44 | 63 | 23 | |||
| Age (Mean ± SD) | 38.8 ± 12.8 | 40.8 ± 13.2 | 40.9 ± 13.5 | |||
| Race** | n | n | n | |||
| Caucasian, non-Hispanic | 12 | 4 | 4 | |||
| Black, non-Hispanic | 18 | 49 | 16 | |||
| Asian or other Pacific Islander | 10 | 2 | 0 | |||
| Hispanic | 4 | 8 | 3 | |||
| BMI (Mean ± SD)* | 29.3 ± 8.1 | 32.8 ± 8.6 | 28.8 ± 7.7 | |||
| Nicotine* | Yes | No | Yes | No | Yes | No |
| 7 | 35 | 27 | 35 | 10 | 13 | |
| Medication | Yes | No | Yes | No | Yes | No |
| Typical Antipsychotics | 0 | 44 | 10 | 53 | 1 | 22 |
| Atypical Antipsychotics | 0 | 44 | 50 | 10 | 16 | 7 |
| mRNA Expression (Mean ± SD) | n | n | n | |||
| C4A | 3.94 ± 1.55 | 4.14 ± 1.52 | 3.66 ± 1.20 | |||
| STAT1 | 6.38 ± 5.02 | 5.31 ± 4.01 | 4.89 ± 3.23 | |||
| IRF-1* | 10.87 ± 5.65 | 8.50 ± 4.48 | 7.69 ± 3.05 | |||
p ≤ .05.
p ≤ .01.n.s.=non-significant
2.2 Sample Collection, Processing and Quantitative PCR
Collection of blood samples, PBMC isolation, and RNA extraction were carried out according to previously described protocols (Chase et al., 2015). RNA extracts were treated with DNAse (Ambion) to remove any possible genomic DNA contaminants, and reverse transcribed using the Applied Biosystems High Capacity Archive Kit. Maxima SYBR Green/ROX qPCR Master Mix (#K0222) was used for detection of PCR product and mixtures were run on a Thermo Scientific™ PikoReal. Relative quantification values were calculated using the delta delta ct method relative to the geometric mean of the housekeeping genes GAPDH and ACTB (Vandesompele et al., 2002). Primers were designed using NCBI primer-BLAST. Primers sequences were as follows: C4A forward, 5′-GGCTCACAGCCTTTGTGTTG-3′; C4A reverse, 5′-CCCTGCATGCTCCTGTCTAA-3′;STAT1 forward, 5′-GCCAAAGGAAGCACCAGAGCCAAT-3′;STAT1 reverse, 5′-AGGAGACATGGGGAGCAGGTTGT-3′; IRF-1 forward, 5′-ATGAGACCCTGGCTAGAG-3′, IRF-1 reverse, 5′-AAGCATCCGGTACACTCG-3′; GAPDH forward, 5′-CGAGATCCCTCCAAAATCAA-3′; GAPDH reverse, 5′-TTCACACCCATGACGAACAT-3′; ACTB forward, 5′-TGAAGGTAGTTTCGTGGATGC-3′; ACTB reverse, 5′-TCCCTGGAGAAGAGCTACGA-3′. The C4A PCR product was sent to University of Illinois at Chicago DNA Services for sequencing to confirm specificity for C4A mRNA.
2.3 Cell Culture
THP-1 cells (ATCC TIB-202) were maintained in culture at 37°C and 5% CO2 with RPMI 1640 medium supplemented with 10 % FBS, l. glut, and 50u/mL each of penicillin and streptomycin. Cells were treated with either vehicle, 10ng/μl IFN-γ, or 100ng/μl lipopolysaccharide (LPS) for 1, 6 and 24 hours prior to harvesting.
2.4 Primary Clinical Measures
The primary clinical measure for this study was the PANSS (Kay et al., 1989). PANSS items were scored along a continuum of severity between 1 (asymptomatic) to 7 (extreme symptom severity). The coefficient alpha for inter-rater reliability was between 0.83 and 0.87. Analysis was conducted via data reduction strategies guided by prior empirical studies of symptom domains assessed by the PANSS. Scores were calculated for five-factors assessing Positive symptoms (delusions, grandiosity, suspiciousness/persecution, unusual thought content), Negative symptoms (blunted affect, emotional withdrawal, poor rapport, passive/apathetic social withdrawal, lack of spontaneity and flow of conversation, and active social avoidance), Cognitive Disorganization (conceptual disorganization, difficulty in abstract thinking, mannerisms and posturing, disorientation, and poor attention), Excitement (excitement, hostility, tension, and poor impulse control), and Depression (somatic concern, anxiety, guilt feelings, depression, and preoccupation). Items were grouped in this way based on previous factor analytic findings (Lindenmayer et al., 1994).
To further evaluate the characteristics of the delusions, the PSYRATS was administered. The PSYRATS consists of two sub-scales that measure the dimensions or characteristics of auditory verbal hallucinations and delusions (Haddock et al., 1999). For the purposes of this study, we utilized the delusions subscale that measures 6 characteristics of delusions. The dimensions of delusions consisted of items that measured frequency, duration, conviction, emotional valence of content and disruption caused by delusional activity. Each dimension of this scale is evaluated on a 5-point Likert Scale ranging from 0 to 4. The coefficient alpha for inter-rater reliability was over 0.80 for each dimension.
2.5 Statistical Analyses
SPSS (version 24.0 for Windows) was used for all statistical analyses. Demographic and descriptive metrics and between group comparisons were analyzed using Chi Square, independent sample t-tests, and one way ANOVAs. For ANOVAs that yielded significant results, Newman-Keuls post hoc tests were used to identify significant pair-wise group differences. Spearman correlations were used to determine associations between mRNA relative expression levels and clinical metrics. A hierarchical multiple linear regression model was performed to predict the presence and severity of delusions, examining specifically the relative contribution of individual descriptive variables (age of onset of psychosis, duration of untreated psychosis, and total CPZE), clinical symptomology (PANSS hallucination, PANSS cognitive 5 factor, PANSS negative 5 factor) and C4A mRNA expression in participants with psychosis (schizophrenia and bipolar disorder with psychosis). All independent variables in the hierarchical regression were selected based on their known association with the presence and/or severity of psychosis, particularly delusions.
3. RESULTS
3.1 Demographics
Table 1 summarizes participant characteristics. There was no overall significant difference between diagnostic groups on sex (χ2=3.69, df=2, p=.16) or age (F(2,127) = 0.35, p= .71). However there was a significant diagnostic difference between groups with regards to race (χ2=26.76, df=6, p<.001), showing a higher percentage of African American participants with schizophrenia,. Our analysis also showed a significant difference between groups in BMI (F(2,126) = 3.92, p= .02) and nicotine consumption (F(2,124) = 3.13, p= .05), which were both greater in participants with schizophrenia.
The clinical sample primarily consisted of persons with current, and often chronic and persistent psychotic symptoms, with the duration of illness ranging in schizophrenia from initial onset of psychosis to 51 years (Median = 17.00 years) and episodic psychosis in the bipolar disorder with psychosis sample that ranged from initial onset of psychosis to 43 years over the course of illness (Median = 16.00). Three independent sample t-tests (two-tailed) were performed comparing persons with schizophrenia and persons with bipolar disorder with psychosis on age of onset, DUP or duration of illness. Results demonstrated no significant group difference between age of onset (t76 = 0.02, p= .99); duration of untreated psychosis (DUP) (t75 = 0.97, p= .34); or duration of illness (t76 = 0.57, p= .57).
3.2 C4A, STAT1 and IRF-1mRNA expression and sample descriptive characteristics
Results of analyses examining the relationship of gene expression with sample descriptives are listed in Table 2. The clinical and control sample combined showed no significant correlation of C4A mRNA expression and age, BMI or nicotine consumption. Both STAT1 and IRF-1 demonstrated a positive correlation with age. There was no association of STAT1 or IRF-1 with BMI or nicotine consumption. We next conducted independent samples t-tests examining the relationship between sex and gene expression and found no association between the level of C4A, STAT1 or IRF-1 mRNA expression and sex. Additionally, a one-way ANOVA showed no relationship between C4A, STAT1 or IRF-1 mRNA expression and race.
Table 2.
Association of mRNA expression with demographics.
| Variable | C4A | STAT1 | IRF-1 | ||||||
|---|---|---|---|---|---|---|---|---|---|
|
| |||||||||
| r2 | p | n | r2 | p | n | r2 | p | n | |
| Age | .01 | .89 | 130 | .31 | .00 | 129 | .21 | .02 | 128 |
| BMI | .09 | .32 | 129 | .00 | .98 | 128 | −.12 | .17 | 127 |
| Nicotine | −.09 | .3 | 127 | .06 | .52 | 126 | .02 | .82 | 125 |
| Typical CPZE | .23 | .52 | 10 | .13 | .73 | 9 | −.13 | .73 | 9 |
| Atypical CPZE | .02 | .87 | 60 | −.05 | .69 | 60 | −.25 | .06 | 59 |
| t | p | df | t | p | df | t | p | df | |
| Sex | 0.18 | .87 | 128 | 0.03 | .17 | 127 | 2.07 | .49 | 126 |
| F | p | df | F | p | df | F | p | df | |
| Race | 0.45 | .72 | 3, 126 | 0.13 | .94 | 3, 125 | 1.89 | .14 | 3, 124 |
Lastly, in the clinical sample we examined the association of C4A, STAT1 and IRF-1 mRNA expression and antipsychotic CPZE. There was no association of typical or atypical antipsychotic CPZE and mRNA expression. Additionally, there was no difference in mRNA expression when comparing participants with a psychiatric diagnosis who were taking antipsychotic medication (n=74) with those who were currently unmedicated (n=12) for C4A (t=.55, p=.59), STAT1 (t=.47, p=.64) or IRF-1 (t=.62, p=.54). Thus, there does not appear to be any influence of demographic characteristics or ancillary factors shown to alter immune parameters (BMI and nicotine consumption) on C4A, STAT1 or IRF-1 mRNA expression. Further, our data do not point to an impact of antipsychotic medication on C4A, STAT1 or IRF-1 mRNA expression.
3.3 C4A, STAT1 and IRF-1mRNA expression and diagnostic specificity
To examine the relationship between C4A, STAT1 and IRF-1 mRNA expression and diagnostic specificity we conducted a one-way ANOVA and our analysis showed no difference in mRNA expression in PBMCs based on diagnosis across all levels of severity (Table 3; C4A shown in Figure 1). However, within a subgroup of participants experiencing severe psychosis (PANSS ≥3 in delusion AND hallucination scores) there was a significant difference in C4A mRNA expression between diagnostic groups (schizophrenia: n=57, M=4.18, SD=1.56; bipolar disorder: n=12, M=3.26, SD= 1.32; (t67 = 2.12, p= .05)). A diagnostic difference for this particular subsample was not present for either STAT1 (schizophrenia: n=56, M=5.12, SD=3.89; bipolar disorder: n=12, M=4.28, SD=3.01; (t66 = .70, p = .49)) or IRF-1 (schizophrenia: n=55, M=8.53, SD=4.50; bipolar disorder: n=12, M=7.71, SD=2.96; (t65 = .60, p = .55)) mRNA expression.
Table 3.
Between groups differences in mRNA expression and association with clinical characteristics.
| Variable | C4A | STAT1 | IRF-1 | ||||||
|---|---|---|---|---|---|---|---|---|---|
|
| |||||||||
| F | p | df | F | p | df | F | p | df | |
| Between Groups | 0.91 | .40 | 2, 127 | 1.2 | .31 | 2, 126 | 4.6 | .01 | 2, 125 |
| Expression | r2 | p | n | r2 | p | n | r2 | p | n |
| STAT1 | .21 | .02 | 129 | – | – | – | – | – | – |
| IRF-1 | .29 | .001 | 128 | .53 | .00 | 128 | – | – | – |
| PANSS | r2 | p | n | r2 | p | n | r2 | p | n |
| Positive | .31 | .004 | 86 | −.11 | .3 | 85 | .18 | .10 | 84 |
| Delusions | .31 | .003 | 86 | – | – | – | – | – | – |
| SCZ | .26 | .04 | 64 | – | – | – | – | – | – |
| BD-P | .43 | .04 | 23 | – | – | – | – | – | – |
| Negative | .14 | .20 | 86 | −.03 | .82 | 85 | .12 | .29 | 84 |
| Cognitive | .11 | .30 | 86 | −.18 | .10 | 85 | .09 | .44 | 84 |
| Excitement | −.06 | .61 | 86 | −.09 | .39 | 85 | .10 | .36 | 84 |
| Depression | .19 | .08 | 86 | −.02 | .87 | 85 | .17 | .12 | 84 |
| PSYRATS Delusions | r2 | p | n | r2 | p | n | r2 | p | n |
| SCZ | .35 | .03 | 39 | – | – | – | – | – | – |
| BD-P | −.37 | .17 | 15 | – | – | – | – | – | – |
Figure 1.
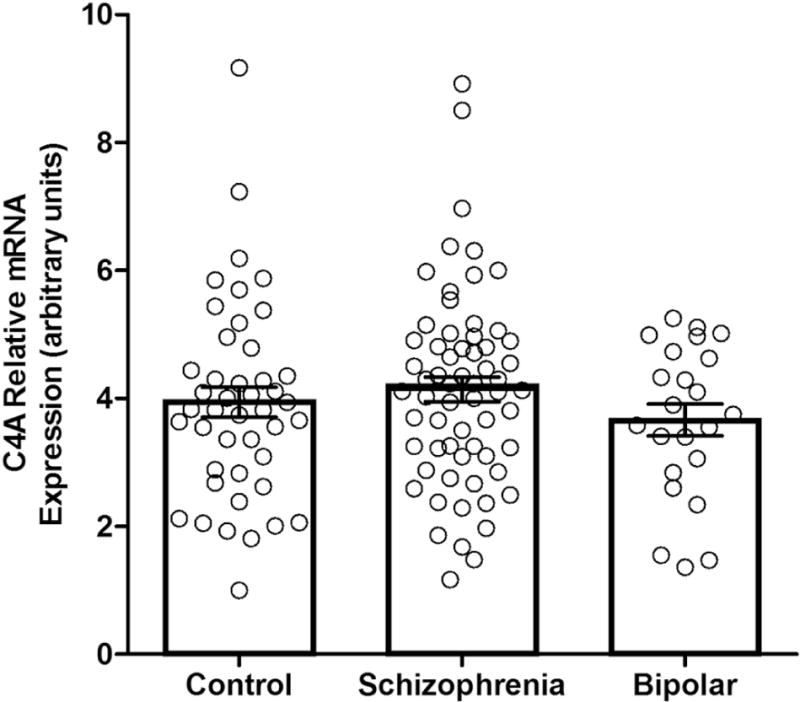
C4A mRNA expression in controls and participants with schizophrenia and bipolar disorder with psychosis. Relative mRNA expression is displayed in arbitrary units. Error bars represent standard error.
3.4 Association of baseline C4A, STAT1 and IRF-1 mRNA expression in study participants and transcriptional response to cytokine stimulation in a monocyte cell line
Analyses revealed a positive correlation of C4A, STAT1 and IRF-1 mRNA expression in PBMCs across all participants (Table 3; Figure 2A). Additionally, in-vivo treatment of THP-1 cells with IFN-γ, a potent activator of JAK-STAT1 signaling, resulted in increased expression of C4A, STAT1 and IRF-1 mRNA. Treatment with LPS, which activates the NF-κB pathway, resulted in small elevations in C4A and STAT1 and a small decrease in IRF-1 mRNA expression, but did not induce a comparably strong transcriptional response as IFN-γ (Figure 2B). Thus, in this monocyte cell line these genes are preferentially activated by IFN-γ, which is consistent with previous studies that demonstrate JAK-STAT1 regulation of C4A, STAT1, and IRF-1 expression. Taken together, these findings indicate that C4A, STAT1 and IRF-1 share common regulatory mechanisms in human peripheral blood cells.
Figure 2.
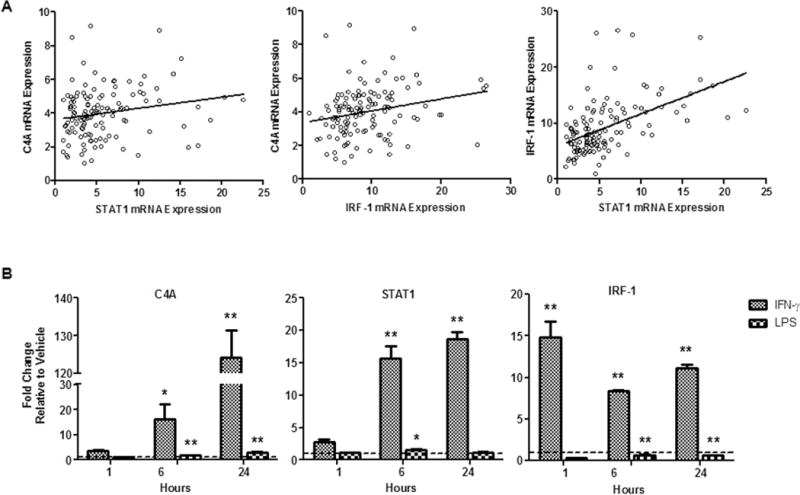
A) Correlation of C4A, STAT1 and IRF-1 mRNA expression in PBMCs from all participants. B) Transcriptional response in THP-1 cells to stimulation with IFN-γ and LPS in culture. Error bars represent standard error; for Neumans-Keuls post hoc tests *p≤.05 **p≤.01; n=2.
3.5 Association of C4A, STAT1 and IRF-1 mRNA expression with psychotic symptomatology in clinical participants
Results of analyses to investigate the relationship between mRNA expression and symptomatology are presented in Table 3. As shown in Figure 3A, when we examined C4A mRNA expression in participants with psychosis (schizophrenia and bipolar disorder with psychosis) we found a positive correlation with PANSS positive factor scores. There was no significant correlation between C4A mRNA expression and PANSS negative, cognitive, excitement or depression symptom domains. Neither STAT1 nor IRF-1 mRNA expression demonstrated an association with any of the PANSS subscales.
Figure 3.
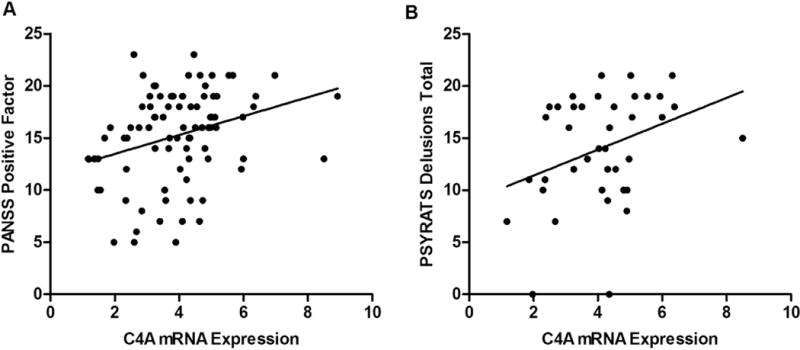
A) Correlation of C4A mRNA expression with PANSS Positive Subscale scores in participants with schizophrenia and bipolar disorder. B) Correlation of C4A mRNA expression with severity of delusional symptoms in participants with schizophrenia as measured by the PSYRATS. Relative mRNA expression is displayed in arbitrary units.
Further examination of the relationship of C4A with positive symptomatology revealed that C4A mRNA expression was correlated with the PANSS positive delusions subscale in both participants with schizophrenia and bipolar disorder with psychosis, and in all patients with psychosis regardless of diagnosis. We next explored the association of delusions with C4A mRNA expression in a subsample of participants with schizophrenia and bipolar disorder with psychosis using the PSYRATS delusions subscale. Our analyses showed that C4A mRNA expression also correlates with delusions as measured by the PSYRATS in participants with schizophrenia (r39=.35, p=.03; Figure 3B) but not bipolar disorder with psychosis (r15=−.37, p=.17).
In an attempt to further understand the relationship between C4A mRNA expression, diagnosis and psychotic symptoms, we performed a hierarchical multiple regression using C4A as a predictor. The relevant assumptions of this statistical analysis were tested (Tabachnick and Fidell, 2007). There were a total of 61 subjects included in the analysis. An examination of correlations revealed that several independent variables were correlated. However, the collinearity statistics (i.e., Tolerance and VIF) were all within accepted limits (Coakes, 2005; Hair et al., 1998). An examination of the Mahalanobis distance scores indicated no multivariate outliers. Residual and scatter plots indicated that the assumptions of normality, linearity and homoscedasticity were all satisfied (Hair et al., 1998; Pallant, 2001). A three stage hierarchical multiple regression was conducted with delusions as the dependent variable. Descriptive variables known to be associated with course and outcome of psychosis (age of onset of psychosis, duration of untreated psychosis and total CPZE) were entered at stage one of the regression. Hallucinations, negative and cognitive symptoms were entered at stage two, and C4A mRNA expression was entered at stage three. All independent variables in stages one and two were selected based on their known association with the presence and/or severity of psychosis, particularly delusions. C4A mRNA was introduced as the primary and novel marker of measurement in the model. The regression statistics are reported in Table 4.
Table 4.
Hierarchical multiple regression: The prediction of the presence and severity of delusions
| Step | Variable | B | SE | β | t | p | Zero-order | Semi-partial | Tolerance | VIF |
|---|---|---|---|---|---|---|---|---|---|---|
| 1. | Age of onset of psychosis | −.010 | .019 | −.051 | −.502 | .618 | −.080 | −.046 | .791 | 1.264 |
| Duration of untreated psychosis | .000 | .002 | −.022 | −.225 | .823 | .044 | −.020 | .893 | 1.119 | |
| Total CPZE | .000 | .001 | .079 | .783 | .437 | .092 | .071 | .806 | 1.240 | |
| Diagnosis | −.321 | .401 | −.087 | −.801 | .427 | −.434 | −.073 | .698 | 1.433 | |
| 2. | PANSS 3_Hallucinations | .287 | .143 | .314 | 2.004 | .050 | .677 | .182 | .336 | 2.973 |
| PANSS Cognitive_5 factor | .080 | .050 | .260 | 1.609 | .114 | .639 | .146 | .317 | 3.156 | |
| PANSS Negative_5 factor | .032 | .026 | .151 | 1.237 | .221 | .541 | .113 | .552 | 1.810 | |
| 3. | C4A mRNA expression | .214 | .094 | .217 | 2.282 | .027 | .280 | .208 | .915 | 1.093 |
Note. Step 1 R2= .211, p= .009; Step 2R2= .527, p≤ .001; Step 3R2= .570, p≤ .001.
The hierarchical multiple regression revealed that at stage one descriptive variables contributed significantly to the regression model (F(4,56)= 3.74,p=.01). Introducing the clinical symptomatology variables at stage two also significantly contributed to the regression model (F(7,53)= 8.43, p=.00). Importantly, the additions of C4A mRNA expression in stage three resulted in a significant change in R2(F(8,52)= 8.62, p=.00). Thus, when all independent variables were modeled in stage three, only C4A (.22) and hallucinations (.31) significantly contributed to the predication of the presence and severity of delusions. The dominance statistics show that C4A was the dominant variable contributing to the presence and severity of delusions (p=.03) followed by hallucinations (p=.05). Together, the combined independent variables in stage three accounted for 50% of the variance in the presence and severity of delusions.
4. DISCUSSION
To our knowledge this is the first study to specifically measure C4A mRNA expression in PBMCs from participants with psychosis. This is an important investigation given recent findings relating C4A gene structural variants to schizophrenia risk (Sekar et al., 2016), as well as our labs previous results that indicate altered JAK-STAT1 pathway activation in schizophrenia (Sharma et al., 2016). We hypothesized that previously reported elevations in C4A mRNA expression in schizophrenia might be a consequence of altered JAK-STAT1 activity, but found that this relationship was complex and linked to diagnosis only in the context of symptoms. While we did not find a straightforward elevation in mRNA expression of C4A or canonical JAK-STAT1 regulated genes (STAT1 and IRF-1) in broadly characterized diagnoses of schizophrenia or bipolar disorder there were noteworthy associations with symptoms that could have neurobiological implications. Thus, we found that a more severe psychotic manifestation was associated with elevated C4A mRNA expression in participants with schizophrenia. Additionally, across all participants with psychosis (schizophrenia plus bipolar with psychosis) we were able to demonstrate a positive association of C4A mRNA expression and positive symptomatology, specifically delusions, using the PANSS. Furthermore, this replicated using a more nuanced measure of delusions (the PSYRATS) in participants with schizophrenia but not bipolar disorder with psychosis. Finally, to consider C4A itself as a predictor of delusions, using a hierarchical regression we demonstrated that C4A mRNA expression contributed to the prediction of the presence and severity of delusions.
Because C4A is within the JAK/STAT cistrome, we considered other measures of activation along this path such as STAT1 and IRF-1 mRNA. To support this approach, we were able to confirm using a monocyte cell line that C4A, STAT1 and IRF-1 each exhibit a strong transcriptional response to stimulation of the JAK-STAT1 signaling pathway, and further, demonstrate that mRNA expression of each gene is positively correlated in PBMCs across the entire participant sample. As there were no similar diagnostic findings or relationship with measures of psychopathology for STAT1 or IRF-1 mRNA we infer that our findings with C4A are not coordinated with overall JAK/STAT1 signaling. An alternate explanation could be that this C4A specific finding reflects the presence of risk variants leading to increased C4A mRNA expression in a subset of individuals with schizophrenia. Given the literature that indicates a critical role for C4 and other complement proteins in processes such as synaptic refinement and pruning in the developing central nervous system (Orsini et al., 2014; Sekar et al., 2016; Stevens et al., 2007), it is attractive to speculate that JAK/STAT1 activation in genetically susceptible individuals and at critical time points, and subsequently elevated C4A expression may lead to inappropriate synapse loss and altered connectivity. Excessive synaptic pruning is implicated in neurodevelopmental theories of psychosis, and may underlie specific neuro-circuitry changes that are thought to be involved in psychosis development (Keshavan et al., 2014). Future work should directly investigate whether gene structural variation at the C4 locus is associated with severity of psychopathology in individuals with psychosis.
There are some study limitations that require addressing in future investigation. Firstly, with regard to the lack of diagnostic specificity across the entire set of participants, the sample is not ideally matched for sex, race and BMI, factors that may influence complement gene structure and/or expression (Yang et al., 2003). In particular, C4 gene structure exhibits high inter-individual variation and shared features within specific ethnic groups (Lintner et al., 2016). Secondly, the sample size is underpowered to detect this small of a difference in mRNA expression. Thus, it is possible that our lack of a diagnostic finding may be due to these confounding factors and/or limited sample size. Overall, this investigation brings forward a novel contribution to the scientific literature in that as well as examining for a diagnostic effect, we explore the transdiagnostic relationship of C4A mRNA expression in relation to positive symptoms in participants with psychosis. Here we showed a positive association of C4A mRNA expression with the presence and severity of delusions. As future work better clarifies the common and distinguishing clinical (primary and secondary symptoms) and biological features of psychosis within the cytokine milieu, the identification of specific patterns of immune activation or proinflammatory molecular symptoms signatures will aid in the development of new models of psychopathology and treatment strategies. It has been demonstrated that immune function waxes and wanes, very similar to the experience of psychotic symptoms, and alignment of these separate domains (one psychological and the other immune) across time would increase the validity of immunoreactivity in the pathophysiology of psychosis.
Acknowledgments
The authors would like to thank all individuals who participated in this study.
Funding
This work was supported in part by PHS grant (NIH) R01MH094358 (R.P.S.).
Footnotes
Publisher's Disclaimer: This is a PDF file of an unedited manuscript that has been accepted for publication. As a service to our customers we are providing this early version of the manuscript. The manuscript will undergo copyediting, typesetting, and review of the resulting proof before it is published in its final citable form. Please note that during the production process errors may be discovered which could affect the content, and all legal disclaimers that apply to the journal pertain.
Conflict of Interest
The authors declare no conflicts of interest.
Contributors
Study conception and design: J.M., C.R., R.S.; patient recruitment and clinical measures: C.R., R.S.; biochemical measures: J.M., B.F., analysis and interpretation: J.M., C.R., R.S., drafting of manuscript: J.M., C.R., R.S., review of manuscript: J.M., C.R., B.F., R.S.
Contributor Information
Jennifer K. Melbourne, Email: JMelbourne@psych.uic.edu.
Cherise Rosen, Email: CRosen@psych.uic.edu.
Benjamin Feiner, Email: BFeiner@psych.uic.edu.
References
- Bergon A, Belzeaux R, Comte M, Pelletier F, Herv?? M, Gardiner EJ, Beveridge NJ, Liu B, Carr V, Scott RJ, Kelly B, Cairns MJ, Kumarasinghe N, Schall U, Blin O, Boucraut J, Tooney PA, Fakra E, Ibrahim EC. CX3CR1 is dysregulated in blood and brain from schizophrenia patients. Schizophr Res. 2015;168:434–443. doi: 10.1016/j.schres.2015.08.010. [DOI] [PubMed] [Google Scholar]
- Beumer W, Gibney SM, Drexhage RC, Pont-Lezica L, Doorduin J, Klein HC, Steiner J, Connor TJ, Harkin A, Versnel Ma, Drexhage Ha. The immune theory of psychiatric diseases: a key role for activated microglia and circulating monocytes. J Leukoc Biol. 2012;92:959–975. doi: 10.1189/jlb.0212100. [DOI] [PubMed] [Google Scholar]
- Cabrera B, Bioque M, Penadés R, González-Pinto A, Parellada M, Bobes J, Lobo A, García-Bueno B, Leza JC, Bernardo M. Cognition and psychopathology in first-episode psychosis: are they related to inflammation? Psychol Med. 2016:1–12. doi: 10.1017/S0033291716000659. [DOI] [PubMed] [Google Scholar]
- Chase KA, Cone JJ, Rosen C, Sharma RP. The value of interleukin 6 as a peripheral diagnostic marker in schizophrenia. BMC Psychiatry. 2016;16:152. doi: 10.1186/s12888-016-0866-x. [DOI] [PMC free article] [PubMed] [Google Scholar]
- Chase KA, Rosen C, Gin H, Bjorkquist O, Feiner B, Marvin R, Conrin S, Sharma RP. Metabolic and inflammatory genes in schizophrenia. Psychiatry Res. 2015;225:208–11. doi: 10.1016/j.psychres.2014.11.007. [DOI] [PMC free article] [PubMed] [Google Scholar]
- Coakes SJ. SPSS: Analysis without Anguish: Version 12.0 for Windows. John Wiley & Son Australia, Ltd.; 2005. [Google Scholar]
- Danivas V, Venkatasubramanian G. Current perspectives on chlorpromazine equivalents: Comparing apples and oranges! Indian J Psychiatry. 2013;55:207–208. doi: 10.4103/0019-5545.111475. [DOI] [PMC free article] [PubMed] [Google Scholar]
- dos Santos Soria L, de Moura Gubert C, Cereser KM, Serverino Gama C, Kapczinski F. Revista Brasileira de Psiquiatria Psychiatry. Rev Bras Psiquiatr. 2012;34:219–232. doi: 10.1016/j.rbp.2012.11.003. [DOI] [PubMed] [Google Scholar]
- Drexhage RC, van der Heul-Nieuwenhuijsen L, Padmos RC, van Beveren N, Cohen D, Versnel Ma, Nolen Wa, Drexhage Ha. Inflammatory gene expression in monocytes of patients with schizophrenia: overlap and difference with bipolar disorder. A study in naturalistically treated patients. Int J Neuropsychopharmacol. 2010;13:1369–1381. doi: 10.1017/S1461145710000799. [DOI] [PubMed] [Google Scholar]
- First MB, Spitzer RL, Gibbon M, Williams JBW. Structured Clinical Interview for DSM-IV-TR Axis I Disorders. 2002 doi: 10.1001/archpsyc.1992.01820080032005. Patient Edition (SCID-I/P, 11/2002 revision), for DSMIV. doi:M. [DOI] [PubMed] [Google Scholar]
- Gardner DM, Murphy AL, O’Donnell H, Centorrino F, Baldessarini RJ. International consensus study of antipsychotic dosing. Am J Psychiatry. 2010;167:686–693. doi: 10.1176/appi.ajp.2009.09060802. [DOI] [PubMed] [Google Scholar]
- Goldsmith DR, Rapaport MH, Miller BJ. A meta-analysis of blood cytokine network alterations in psychiatric patients: comparisons between schizophrenia, bipolar disorder and depression. Mol Psychiatry. 2016:1–14. doi: 10.1038/mp.2016.3. [DOI] [PMC free article] [PubMed] [Google Scholar]
- Haddock G, McCarron J, Tarrier N, Faragher E. Scales to measure dimensions of hallucinations and delusions: the psychotic symptom rating scales (PSYRATS) Psychol Med. 1999;29:879–89. doi: 10.1017/s0033291799008661. [DOI] [PubMed] [Google Scholar]
- Hair JF, Anderson RE, Tatham RL, Black WC. Multivariate Data Analysis with Readings. 5th. Prentice Hall; Englewood Cliffs, NJ: 1998. [Google Scholar]
- Hess JL, Tylee DS, Barve R, de Jong S, Ophoff RA, Kumarasinghe N, Tooney P, Schall U, Gardiner E, Beveridge NJ, Scott RJ, Yasawardene S, Perera A, Mendis J, Carr V, Kelly B, Cairns M, Tsuang MT, Glatt SJ. Transcriptome-wide mega-analyses reveal joint dysregulation of immunologic genes and transcription regulators in brain and blood in schizophrenia. Schizophr Res. 2016;176:114–124. doi: 10.1016/j.schres.2016.07.006. [DOI] [PMC free article] [PubMed] [Google Scholar]
- Hope S, Hoseth E, Dieset I, Mørch RH, Aas M, Aukrust P, Djurovic S, Melle I, Ueland T, Agartz I, Ueland T, Westlye LT, Andreassen OA. Inflammatory markers are associated with general cognitive abilities in schizophrenia and bipolar disorder patients and healthy controls. Schizophr Res. 2015;165:188–194. doi: 10.1016/j.schres.2015.04.004. [DOI] [PubMed] [Google Scholar]
- Hope S, Ueland T, Eiel N, Dieset I, Lorentzen S, Berg AO, Agartz I, Aukrust P, Andreassen OA. Interleukin 1 receptor antagonist and soluble tumor necrosis factor receptor 1 are associated with general severity and psychotic symptoms in schizophrenia and bipolar disorder. Schizophr Res. 2013;145:36–42. doi: 10.1016/j.schres.2012.12.023. [DOI] [PubMed] [Google Scholar]
- Kay SR, Opler LA, Lindenmayer JP. The Positive and Negative Syndrome Scale (PANSS): Rationale and standardisation. Br J Psychiatry. 1989 doi: 10.1093/schbul/13.2.261. [DOI] [PubMed] [Google Scholar]
- Keshavan MS, Giedd J, Lau JYF, Lewis DA, Paus T. Changes in the adolescent brain and the pathophysiology of psychotic disorders. The Lancet Psychiatry. 2014;1:549–558. doi: 10.1016/S2215-0366(14)00081-9. [DOI] [PubMed] [Google Scholar]
- Lindenmayer J, Bernstein-Hyman R, Grochowski S. Five-factor model of schizophrenia. Initial validation. J Nerv Ment Dis. 1994;182:631–8. doi: 10.1097/00005053-199411000-00006. [DOI] [PubMed] [Google Scholar]
- Lintner KE, Wu YL, Yang Y, Spencer CH, Hauptmann G, Hebert LA, Atkinson JP, Yu CY. Early components of the complement classical activation pathway in human systemic autoimmune diseases. Front Immunol. 2016;7:1–22. doi: 10.3389/fimmu.2016.00036. [DOI] [PMC free article] [PubMed] [Google Scholar]
- Mayilyan KR, Weinberger DR, Sim RB. The complement system in schizophrenia. Drug News Perspect. 2008;21:200–210. doi: 10.1358/dnp.2008.21.4.1213349. [DOI] [PMC free article] [PubMed] [Google Scholar]
- Miller BJ, Buckley P, Seabolt W, Mellor A, Kirkpatrick B. Meta-analysis of cytokine alterations in schizophrenia: Clinical status and antipsychotic effects. Biol Psychiatry. 2011;70:663–671. doi: 10.1016/j.biopsych.2011.04.013. [DOI] [PMC free article] [PubMed] [Google Scholar]
- Miller BJ, Goldsmith DR. Towards an Immunophenotype of Schizophrenia: Progress, Potential Mechanisms, and Future Directions. Neuropsychopharmacology. 2016;42:1–19. doi: 10.1038/npp.2016.211. [DOI] [PMC free article] [PubMed] [Google Scholar]
- Orsini F, De Blasio D, Zangari R, Zanier ER, De Simoni MG. Versatility of the complement system in neuroinflammation, neurodegeneration and brain homeostasis. Front Cell Neurosci. 2014;8:380. doi: 10.3389/fncel.2014.00380. [DOI] [PMC free article] [PubMed] [Google Scholar]
- Pallant J. SPSS Survival Manual. Allen & Unwin; Sydney: 2001. [Google Scholar]
- Rauch I, Müller M, Decker T. The regulation of inflammation by interferons and their STATs. Jak-Stat. 2013;2:e23820. doi: 10.4161/jkst.23820. [DOI] [PMC free article] [PubMed] [Google Scholar]
- Satoh JI, Tabunoki H. A comprehensive profile of ChIP-Seq-based STAT1 target genes suggests the complexity of STAT1-mediated gene regulatory mechanisms. Gene Regul Syst Bio. 2013;2013:41–56. doi: 10.4137/GRSB.S11433. [DOI] [PMC free article] [PubMed] [Google Scholar]
- Sekar A, Bialas AR, de Rivera H, Davis A, Hammond TR, Kamitaki N, Tooley K, Presumey J, Baum M, Van Doren V, Genovese G, Rose SA, Handsaker RE, Daly MJ, Carroll MC, Stevens B, McCarroll SA. Schizophrenia risk from complex variation of complement component 4. Nature. 2016:1–17. doi: 10.1038/nature16549. [DOI] [PMC free article] [PubMed] [Google Scholar]
- Sharma RP, Rosen C, Melbourne JK, Feiner B, Chase KA. Activated Phosphorylated STAT1 Levels as a Biologically Relevant Immune Signal in Schizophrenia. Neuroimmunomodulation. 2016;23:224–229. doi: 10.1159/000450581. [DOI] [PMC free article] [PubMed] [Google Scholar]
- Stevens B, Allen NJ, Vazquez LE, Howell GR, Christopherson KS, Nouri N, Micheva KD, Mehalow AK, Huberman AD, Stafford B, Sher A, Litke AM, Lambris JD, Smith SJ, John SWM, Barres BA. The Classical Complement Cascade Mediates CNS Synapse Elimination. Cell. 2007;131:1164–1178. doi: 10.1016/j.cell.2007.10.036. [DOI] [PubMed] [Google Scholar]
- Tabachnick BG, Fidell LS. Using multivariate statistics. Pearson Education Inc; Boston, MC: 2007. [Google Scholar]
- Vandesompele J, De Preter K, Pattyn F, Poppe B, Van Roy N, De Paepe A, Speleman F. Accurate normalization of real-time quantitative RT-PCR data by geometric averaging of multiple internal control genes. Genome Biol. 2002;3 doi: 10.1186/gb-2002-3-7-research0034. RESEARCH0034. [DOI] [PMC free article] [PubMed] [Google Scholar]
- Waddell SJ, Popper SJ, Rubins KH, Griffiths MJ, Brown PO, Levin M, Relman Da. Dissecting Interferon-Induced Transcriptional Programs in Human Peripheral Blood Cells. PLoS One. 2010;5:1–13. doi: 10.1371/journal.pone.0009753. [DOI] [PMC free article] [PubMed] [Google Scholar]
- Wadee AA, Kuschke RH, Wood LA, Berk M, Ichim L, Maes M. Serological observations in patients suffering from acute manic episodes. Hum Psychopharmacol. 2002;17:175–179. doi: 10.1002/hup.390. [DOI] [PubMed] [Google Scholar]
- Yang Y, Chung EK, Zhou B, Blanchong CA, Yu CY, Fust G, Kovacs M, Vatay A, Szalai C, Karadi I, Varga L. Diversity in Intrinsic Strengths of the Human Complement System: Serum C4 Protein Concentrations Correlate with C4 Gene Size and Polygenic Variations, Hemolytic Activities, and Body Mass Index. J Immunol. 2003;171:2734–2745. doi: 10.4049/jimmunol.171.5.2734. [DOI] [PubMed] [Google Scholar]