

Abstract
One of the crucial cardiac signaling pathways is cAMP-mediated PKA signal transduction, which is regulated by a family of scaffolding proteins, i.e., A-kinase anchoring proteins (AKAPs). Muscle-specific AKAP (mAKAP) partly regulates cardiac cAMP/PKA signaling by binding to PKA and phosphodiesterase 4D3 (PDE4D3), among other proteins, and plays a central role in modulating cardiac remodeling. Moreover, genetics plays an incomparable role in modifying the risk of cardiovascular diseases (CVDs). Single-nucleotide polymorphisms (SNPs) in various proteins have especially been shown to predispose individuals to CVDs. Hence, we hypothesized that human mAKAP polymorphisms found in humans with CVDs alter the cAMP/PKA pathway, influencing the susceptibility of individuals to CVDs. Our computational analyses revealed two mAKAP SNPs found in cardiac disease-related patients with the highest predicted deleterious effects, Ser 1653 Arg (S1653R) and Glu 2124 Gly (E2124G). Coimmunoprecipitation data in human embryonic kidney-293T cells showed that the S1653R SNP, present in the PDE4D3-binding domain of mAKAP, changed the binding of PDE4D3 to mAKAP and that the E2124G SNP, flanking the 3′-PKA binding domain, changed the binding of PKA before and after stimulation with isoproterenol. These SNPs significantly altered intracellular cAMP levels, global PKA activity, and cytosolic PDE activity compared with the wild type before and after isoproterenol stimulation. PKA-mediated phosphorylation of pathological markers was found to be upregulated after cell stimulation in both mutants. In conclusion, human mAKAP polymorphisms may influence the propensity of developing CVDs by affecting cAMP/PKA signaling, supporting the clinical significance of PKA-mAKAP-PDE4D3 interactions.
NEW & NOTEWORTHY We found that single-nucleotide polymorphisms in muscle-specific A-kinase anchoring protein found in human patients with cardiovascular diseases significantly affect the cAMP/PKA signaling pathway. Our results showed, for the first time, that human muscle-specific A-kinase anchoring protein polymorphisms might alter the susceptibility of individuals to develop cardiovascular diseases with known underlying molecular mechanisms.
INTRODUCTION
In 2015, an estimated 17.92 million deaths were attributed to cardiovascular diseases (CVDs), causing one-third of total global deaths (35). World Heart Federation statistics mention that the treatment costs of CVDs are expected to rise from $863 billion to $1044 billion from 2012 to 2030, respectively. The complexity and overlap of various signaling pathways governing the normal functioning of the heart are the culprits for these devastating statistics. One such signaling pathway is cAMP-dependent PKA signaling, which is coordinated by scaffolding proteins, i.e., A-kinase anchoring proteins (AKAPs). PKA signaling is central in many pathological hypertrophic signaling pathways, and thus studying AKAPs has gained a lot of interest from scientists in the last two to three decades (24).
AKAPs are a family of scaffolding proteins that have diverse structures, and more than 70 of them have been discovered so far since AKAP was first identified in 1984 (22). AKAPs are characterized by the conserved amphipathic α-helix region to bind to PKA, the targeting domain that tethers them to subcellular compartments and various binding domains that interact with other signaling proteins (20, 33). So far, 17 AKAPs have been identified in the heart, although not all of them are entirely cardiac specific (39). These AKAPs restrict PKA activity to specific subcellular compartments by scaffolding PKA and regulate downstream phosphorylation events by bringing together phosphatases, phosphodiesterases (PDEs), and other target proteins. Although AKAPs are low abundant proteins in the heart, specific deletions of them have significant cardiac pathophysiological effects (45).
Muscle-specific AKAP (mAKAP) is present in the heart, brain, and skeletal muscle. It is a prohypertrophic AKAP that forms a large intracellular “signalosome” near the nuclear envelope of cardiomyocytes and regulates stress-dependent cardiac remodeling (30). PKA-mAKAP interaction is necessary for the hypertrophic signaling as shown by mutant mAKAP lacking the PKA-binding domain (28). Heart-specific deletion of mAKAP in adult mice improves cardiac function after the induction of heart failure but slows down physiological hypertrophy (17). These data indicate that mAKAP signalosome assembly may be crucial for cardiac physiology and pathophysiology; hence, targeting protein interactions of mAKAP becomes pathophysiologically significant. Conversely, genetic predisposition to CVDs adds to the higher number of cases per year, which is due primarily to single-nucleotide polymorphisms (SNPs) in crucial proteins involved in the complex cardiac physiology (26). The National Human Genome Research Institute has accumulated and reported 5,585 SNPs with an associated correlation to CVDs at P < 10−5 (13). A meta-analysis of several genome-wide association studies (GWAS) revealed more than 150 SNPs linked to a higher risk of developing CVDs (10).
Previous reports have shown that genetic variants in mAKAP were associated with increased susceptibility to several human diseases. A few SNPs in mAKAP have been reported to be associated with human neurological diseases in GWAS. The intronic SNPs rs2383378 and rs4296166 in mAKAP were found to increase the risk of developing anorexia nervosa and Alzheimer’s disease, respectively (41). As far as increasing the risk of CVDs is concerned, SNP rs12885467 in mAKAP was found to be associated with higher body mass index (9). Obesity is one of the essential risk factors in making individuals more susceptible to CVDs; hence, an increased body mass index in polymorphic mAKAP cohorts may indirectly increase the risk of developing CVDs. A novel polymorphism in mAKAP, valine 839 alanine, was found in patients with congenital arrhythmia (34). Interestingly, this SNP was frequent in patients with drug-induced torsades de pointes (41). However, with the established importance of mAKAP, mAKAP polymorphisms have not been yet associated with changes in the susceptibility to CVDs in humans.
Previously, we reported, for the first time, that mAKAP polymorphisms alter the binding of PKA and PDE4D3 to mAKAP (32). However, the SNPs studied in this report were extremely rare and not present in patients with CVDs; hence, it was difficult to acknowledge the clinical significance of mAKAP polymorphisms. Therefore, we decided to study mechanistic links between mAKAP SNPs and cardiac pathophysiology found frequently in humans with CVDs.
MATERIALS AND METHODS
Materials.
Expression plasmids coding for human PKA regulatory RIIα subunit (PKA RIIα) green fluorescent protein (GFP) tagged, human PDE4D3 GFP tagged, and Flag-tagged human wild-type (WT) AKAP6 (mAKAP) were purchased from OriGene. Protein phosphatase 2A (PP2A) B56δ subunit-hemagglutinin-tagged plasmid (V249 pCEP-4HA B56delta) was a gift from David Virshup (Addgene plasmid no. 14536) (37). DMSO (D8418), roflumilast (SML1099), cAMP (A9501), and isoproterenol (I6504) were purchased from Sigma.
Databases of single-nucleotide variants of mAKAP.
We used the Exome Aggregation Consortium (ExAC; version 0.3.1) (19) and the Exome Variant Server, NHLBI GO Exome Sequencing Project (ESP) (http://evs.gs.washington.edu/EVS/), to obtain potentially pathogenic mAKAP single-nucleotide variants (SNVs), since both of them contain genetic variants from the patient cohorts associated with heart disease, among others. We also used the 1000 Genomes Project (1000G) database to obtain mAKAP variants seen in healthy individuals, which were considered benign (43). Missense SNPs were selected to be present in ExAC and ESP and absent from 1000G.
Computational tools to prioritize mAKAP SNVs.
The functional impact of mAKAP SNVs was analyzed using the Evolutionary Action Server (http://mammoth.bcm.tmc.edu/uea/). Evolutionary Action (EA) scores range from 0 (benign) to 100 (deleterious) and indicate the predicted percentage of protein fitness loss (14). EA was found to have a consistently good performance by assessments from independent researchers (15); however, we further scrutinized its prioritization by independent computational tools to achieve a consensus. SNPs3D predicts mutation impact using machine learning that combines structure and sequence information, and it was trained on Human Gene Mutation Database data (http://www.snps3d.org) (46). PolyPhen-2 also predicts mutation impact using machine learning, but it was trained on data from the UniProtKB database (http://genetics.bwh.harvard.edu/pph2/) (2). Homology experiments were performed using the sequence alignment from the PolyPhen-2 web server followed by Genomic Evolutionary Rate Profiling (GERP) analysis using the EVS server (http://evs.gs.washington.edu/EVS/) to investigate conservation of amino acids at specific positions (5).
Expression plasmids and cell culture.
S1653R-mAKAP and E2124G-mAKAP mutants were custom produced from WT mAKAP-expressing plasmid using site-directed mutagenesis by Biomatik. Full sequences of mutant mAKAP plasmids were carried out by Biomatik along with DNA gel electrophoresis. All plasmid DNA was amplified using the EndoFree Plasmid Maxi Kit (Qiagen). Human embryonic kidney (HEK)-293T cells were purchased from the American Type Culture Collection and maintained and subcultured as per instructions provided by the American Type Culture Collection. Cells were grown in high-glucose DMEM (GIBCO) with 10% FBS (GIBCO) and 1% penicillin-streptomycin antibiotic (GIBCO). An incubator was set for 37°C at 5% CO2-95% O2 for optimum cell growth. Trypsin-EDTA (0.05%, GIBCO) was used for subculturing, and only passage 4−9 cells were used for all experiments. Transient transfection was performed for the above-mentioned plasmids in HEK-293T cells using Lipofectamine 2000 (Invitrogen) reagent when cells reached 70–80% confluency. Cells were washed twice with sterile PBS ∼40–44 h after transfection and then serum starved for 8–9 h before further treatment or cell lysis. To stimulate cells, 1 µM isoproterenol was used for 10 min (38), and DMSO was used as a control. Roflumilast (50 nM) was added before isoproterenol treatment for 15 min wherever applicable. Cells were washed once with sterile Tris-buffered saline after treatments and lysed with cell lysis buffer, as previously decribed (32). Cell debris was cleared by centrifugation at 10,000 g for 2 min (18).
Coimmunoprecipitation.
Anti-flag M2 Affinity Gel (Sigma) was used for coimmunoprecipitation of mAKAP and PKA, PDE4D3, or PP2A as per the manufacturer’s instructions. In brief, cell lysates with equal protein concentration were incubated with the gel overnight at 4°C on a slow shaker and then centrifuged at 8,000 g for 30 s. After three to four washes with Tris-buffered saline (50 mM Tris·HCl and 150 mM NaCl, pH 7.4), immunoprecipitated proteins were eluted using sample buffer, and 20 µl of the eluted sample was used for immunoblot analysis (32). Immunoblot analysis was performed as explained below, and the amount of mAKAP was used to compare the expression of PKA RIIα, PDE4D3, and PP2A-B56δ.
Intracellular cAMP assay.
Intracellular cAMP was quantified using a direct cAMP ELISA kit (ADI-900-066, Enzo) as per the manufacturer’s instructions. Briefly, cells were lysed in 0.1 N HCl such that 1 ml of HCl was used for ∼1 × 10⁶ cells. The nonacetylated method with serially diluted cAMP standards was used, and 100-µl samples were used. The p-nitrophenylphosphate substrate generates a yellow color at the end of the assay, which was quantified by measuring absorbance at 405 nm. Because this assay reacts with bound cAMP, the intensity of the color is indirectly related to the intracellular cAMP in the sample. Assay Blaster software (ADI-28-00020, Enzo) was used to find unknown cAMP concentrations of samples. Each experiment was independently performed four times, and an average of at least three repeats was considered for one experiment.
Total PKA activity.
Global PKA activity was measured by the PKA kinase activity kit (ADI-EKS-390A, Enzo). Purified PKA was used as positive control; the kinase assay dilution buffer provided with the kit was used as a blank. After an initial optimization process, 1 µg of the protein sample (cell lysate) in 30 µl of kinase assay dilution buffer (provided with the kit) was used for the assay, and a reaction was triggered by adding ATP. After subsequent incubation with primary and secondary antibodies and washing, 3,3′,5,5′-tetramethylbenzidine substrate was used for the color reaction. The absorbance of the final color developed after the addition of stop solution was measured at 450 nm. Stimulated PKA activity was calculated by incubating samples with 5 µM cAMP for 10 min at 37°C (32). Each experiment was repeated four times independently, with an average of three technical replicates for one experiment. Relative PKA activity was calculated by subtracting an average absorbance of the sample from the blank.
Cytosolic PDE activity.
Cytosolic fractions were prepared by collecting supernatants from centrifuging lysates at 20,000 g for 30 min (23). PDE activity was colorimetrically determined by the cyclic nucleotide PDE assay kit (BML-AK800-0001, Enzo) in terms of nanomoles of 5′-AMP released. A purified PDE enzyme was used as positive control; the assay buffer was used as a blank. The assay was performed using 20 µl of KI-180 substrate (0.5 mM), 15 µl of assay buffer, and 10 µl of 5′-nucleotidase (5 kU/µl) as per the instructions provided by Enzo for 45 min at 30°C. Cytosolic fractions were desalted before the assay using desalting columns to remove interference of phosphates and nucleotides. Biomol Green Reagent was used to stop the reaction, and absorbance was measured at 620 nm. A standard curve was plotted for serially diluted PDE enzyme solution, and unknown PDE activity was determined by the following formula: nanomoles of 5′-AMP = (optical density at 620 nm − 0.0709)/0.232. Four independent experiments and at least three repetitions per sample were performed for statistical analysis.
Immunoblot analysis.
An equal quantity of (60 µg) of protein sample was resolved on NuPAGE 3–8% Tris-acetate and 4–12% bis-Tris gels (Invitrogen) and transferred to a polyvinylidene difluoride membrane. The appropriate primary antibodies were added to membranes overnight at 4°C followed by three washes with Tris-buffered saline with 0.1% Tween 20. Blots were then incubated with anti-rabbit secondary antibody (1:10,000, Cell Signaling Technology) for ≥1 h. Finally, the bands were developed using Pierce ECL Western Blotting Substrate (ThermoFischer). National Institutes of Health ImageJ software was used for densitometric analysis (20). Three to four independent repetitions were performed for each experiment for statistical analysis. Primary antibodies with the following dilutions and manufacturers were used: mAKAP (1:2,000, BioLegend), PKA RIIα (1:500, Santa Cruz Bioetchnology), PKA-Cα (1:1,000, Cell Signaling Technology), PP2A C-subunit (1:1,000, Cell Signaling Technology), PDE4D3 (1:500, Abcam), GAPDH (1:10,000, Cell Signaling Technology), cAMP response element-binding protein (CREB) and phospho-CREB (Ser133) (1:1,000, Cell Signaling Technology), calcineurin (1:1,000, Cell Signaling Technology), histone deacetylase 4 (HDAC4) and phospho-HDAC4 (Ser467/632) (1:1,000, Cell Signaling Technology), PKD (1:500, Abcam), phospho-PKD (Ser916) (1:500, Cell Signaling Technology), myocyte-specific enhancer factor 2D (MEF2D; 1:500, GeneTex), phospho-MEF2D (1:500, GeneTex), β1-adrenergic receptor (1:500, Abcam), and β2-adrenergic receptor (1:500, Abcam).
Statistical analysis.
The data obtained were analyzed by one-way ANOVA with Tukey’s multiple-comparison tests (GraphPad Prism 5). Data were expressed as means ± SE. P values of 0.05 were considered statistically significant in all circumstances.
RESULTS
S1653R and E2124G mAKAP missense SNPs were found in ExAC and ESP databases with high evolutionary action scores and S1653R was found with a greater frequency in humans.
The ExAC database included 769 missense mAKAP SNPs, whereas ESP had 175 of them. After combining these SNPs and eliminating mAKAP SNPs found in 1000G, we short listed around 100 missense SNPs found only in ExAC and ESP databases. These SNPs were then arranged in descending order of their EA score obtained from the EA server (data not shown). We finalized two SNPs based on their location and EA score: S1653R, present in the PDE4D3-binding domain of mAKAP, with an EA score of 89.35, and E2124G, present in the 3′-PKA RIIα-binding domain, with an EA score of 84.16 (Table 1). The nucleotide changes corresponding to S1653R and E2124G SNPs are A4957C and A6371G, respectively.
Table 1.
Summary of computational studies of mAKAP SNPs
| Number of SNPs | Amino Acid Positions | Nucleotide Change | Amino Acid Change | Binding Domain | EA Score | SVM Score | PolyPhen-2 score | GERP Score |
|---|---|---|---|---|---|---|---|---|
| 1 | 1653 | Adenine to cytosine | Serine to arginine | PDE4D3 | 89.35 | −1.14 | Damaging with 0.994 score | 5.98 |
| 2 | 2124 | Adenine to guanine | Glutamic acid to glycine | 3′-PKA RIIα (PP2A) | 84.16 | −1.83 | Damaging with 0.991 score | 6.03 |
EA, Evolutionary Action; GERP, Genomic Evolutionary Rate Profiling; mAKAP, muscle-specific A-kinase anchoring protein; SNP, single-nucleotide polymorphism; SVM, Support Vector Machine Computational experiments showed details of human mAKAP SNPs that were finalized for study here with respect to their amino acid positions, nucleotide and amino acid changes, and the binding domain of mAKAP in which they are found. Summary of computational studies, as explained in the text, is also shown.
Remarkably, the allele frequency for S1653R SNP was found to be 0.06% in the ExAC database, which had 60,706 unrelated individuals. Furthermore, the S1653R SNP was found in 18 individuals in one of the data sets in ESP database, Atherosclerosis Risk in Communities (ARIC), having 10,990 individuals, showing an occurrence of 0.16%. S1653R was also present in seven of 2,054 individuals from the Precocious Coronary Artery Disease Study (PROCARDIS), a part of ExAC database. We also found the presence of the S1653R SNP in other data sets, as shown in Table 2. Interestingly, the E2124G SNP was found exclusively and moderately frequently in the African-American population of the ARIC study (2 in 3,180 African-American individuals) and the Jackson Heart Study (4 in 2,018 individuals; Table 2).
Table 2.
Availability of human mAKAP SNPs in cardiac disease data sets
| Data Sets | S1653R | E2124G |
|---|---|---|
| ARIC study | ||
| European-American cohort | 16 in 7,810 | 0 in 7,810 |
| African-American cohort | 2 in 3,180 | 2 in 3,180 |
| Italian Atherosclerosis, Thrombosis, and Vascular Biology Working Group | 3 in 3,592 | 0 in 3,592 |
| Ottawa Genomics Heart Study | 1 in 1,968 | 0 in 1,968 |
| PROCARDIS | 7 in 2,054 | 0 in 2,054 |
| Jackson Heart Study | 1 in 2,018 | 4 in 2,018 |
| Exome Aggregation Consortium | 1 in 3,035 alleles | 1 in 40,469 alleles |
ARIC, Atherosclerosis Risk in Communities; PROCARDIS, Precocious Coronary Artery Disease Study. Numbers of human individuals that were found in particular cardiac disease-related data sets that contained either the S1653R muscle-specific A-kinase anchoring protein (mAKAP) single-nucleotide polymorphism (SNP) or E2124G mAKAP SNP are shown. The total number of individuals in each data set is also shown.
The high fitness effects of S1653R and E2124G mAKAP SNPs were also confirmed by SNPs3D, PolyPhen-2, and GERP.
The SNPs3D Support Vector Machine scored the deleterious effect on protein function for the S1653R SNP to be −1.14 and for the E2124G SNP to be −1.83, where values of less than −0.5 indicated damaging SNPs (46). PolyPhen-2 annotated the functional impact of amino acid substitutions along with sensitivity and specificity of the prediction on a scale of 0 (benign) to 1 (probably damaging) (1). The PolyPhen-2 score for S1653R was 0.994, predicted to be probably damaging with a sensitivity of 0.46 and a specificity of 0.96; for E2124G, the score was 0.991, predicted to be probably damaging with a sensitivity of 0.50 and a specificity of 0.95. Our homology experiments using PolyPhen-2 multiple sequence alignment showed that amino acid residues at Ser1653 and Glu2124 positions were evolutionarily conserved in approximately more than 15 mammalian species (data not shown). The ability of those positions to tolerate substitutions was also estimated by the GERP score, which was accessed via the exome variant server and gave a score between −12.3 (neutral evolution) and 6.17 (strong constraints). Serine at the 1653 position was found to have a GERP score of 5.98, and glutamic acid at the 2124 position was assigned a GERP score of 6.03, indicating very highly conserved amino acids.
Polymorphisms in mAKAP did not alter the expression of mAKAP in HEK-293T cells.
Expression plasmids for S1653R and E2124G mAKAPs in the pCMV6 vector were commercially generated using site-directed mutagenesis from WT mAKAP, and their full-length sequences were confirmed to ensure the accuracy of the mutagenesis (data not shown). Additionally, DNA gel electrophoresis results (provided by Biomatik) further proved the success of site-directed mutagenesis displaying no contaminating bands after restriction enzyme digestion (Fig. 1A). Next, we transiently overexpressed WT and mutant mAKAP in HEK-293T cells and found that there was no significant difference in the expression of mAKAP in mutant mAKAP (S1653R and E2124G) compared with WT (n = 3, P = 0.8272; Fig. 1B). Untransfected HEK-293T cells were used as a negative control and showed no endogenous expression of mAKAP (Fig. 1B). β-Adrenergic receptor expression was confirmed in our HEK-293T cells using previously published antibodies from Abcam (Fig. 1C) (21, 29). Adult mouse heart homogenate was used as a positive control, and cell lysis buffer was used as a negative control to validate antibody specificity (data not shown). We also found out that transient overexpression of WT and mutant mAKAP did not alter β1- and β2-adrenergic receptor expression in HEK-293T cells (n = 4, P = 0.7720 for the β1-adrenergic receptor and P = 0.6530 for the β2-adrenergic receptor; Fig. 1C). The mRNA expression of β1- and β2-adrenergic receptors has been shown successfully in HEK cells elsewhere (44).
Fig. 1.

S1653R and E2124G human in muscle-specific A-kinase anchoring protein (mAKAP) single-nucleotide polymorphisms (SNPs) were successfully created by site-directed mutagenesis, and both mutants did not alter mAKAP expression along with β1- and β2-adrenergic receptors (β1- and β2-ARs). A: double digestion of mutated plasmids by the restriction enzymes ApaI and NotI with only two expected bands and no other contaminating bands on 1% Tris-acetate-EDTA gels, as provided by Biomatik. The DNA marker shows the corresponding molecular weight of DNA (in bp). B: representative Western blots showing mAKAP and GAPDH bands and quantification of the same using one-way ANOVA with Tukey’s multiple-comparison test. Three independent experiments (n = 3) of human embryonic kidney (HEK)-293T cell lysates were analyzed, and data are expressed as means ± SE. **P < 0.01 vs. control untransfected cells [control: 0.2409 ± 0.06368; wild type (WT): 1.417 ± 0.1330; S1653R: 1.261 ± 0.2145; E2124G: 1.375 ± 0.1905]. C: representative Western blots for β1- and β2-ARs along with GAPDH and quantification by one-way ANOVA with Tukey’s multiple-comparison test. Four independent experiments (n = 4) were performed, and data are expressed as means ± SE: β1-AR (control: 0.8779 ± 0.1198; WT: 1.005 ± 0.09496; S1653R: 1.015 ± 0.1226; E2124G: 0.9573 ± 0.05715) and β2-AR (control: 2.166 ± 0.08062; WT: 1.903 ± 0.1221; S1653R: 1.927 ± 0.2458; E2124G: 1.894 ± 0.1986).
The S1653R SNP, present in the PDE4D3-binding domain of mAKAP, changed the binding of PDE4D3, and the E2124G SNP, present in the 3′-PKA binding domain, changed the binding of PKA RIIα to the mAKAP scaffold with no changes in the binding of PP2A.
When PDE4D3-GFP was coexpressed with either WT or mutant mAKAP, our coimmunoprecipitation data revealed that binding of PDE4D3 was significantly higher in S1653R mAKAP compared with WT at baseline (n = 4–5, P < 0.001; Fig. 2A). Interestingly, the binding propensity of PDE4D3 was reduced after cell stimulation with isoproterenol in S1653R mutant mAKAP-expressing cells compared with before stimulation (n = 4–5, P < 0.01; Fig. 2A). In WT and E2124G mAKAP-expressing cells, binding of PDE4D3 was significantly increased after stimulation with isoproterenol (n = 4 for WT, P < 0.01, and n = 4 for E2124G, P < 0.05; Fig. 2A). On the other hand, when PKA RIIα-GFP was coexpressed with either WT or mutant mAKAP, we found that binding of PKA was significantly lowered in E2124G mAKAP-expressing cells at baseline compared with WT (n = 4, P < 0.01; Fig. 2B). Surprisingly, binding of PKA was significantly increased after cell stimulation in E2124G mAKAP compared with before stimulation (n = 4, P < 0.001; Fig. 2B). In WT and S1653R mAKAP-expressing cells, the binding propensity of PKA was unchanged after stimulation (Fig. 2B). When we cotransfected PP2A B56δ-subunit plasmid as a B56δ-subunit of PP2A binds to mAKAP (7), we found no significant alteration in the binding of PP2A to mAKAP in WT and mutant mAKAP before and after cell stimulation (n = 4, P = 0.5413; Fig. 2C).
Fig. 2.
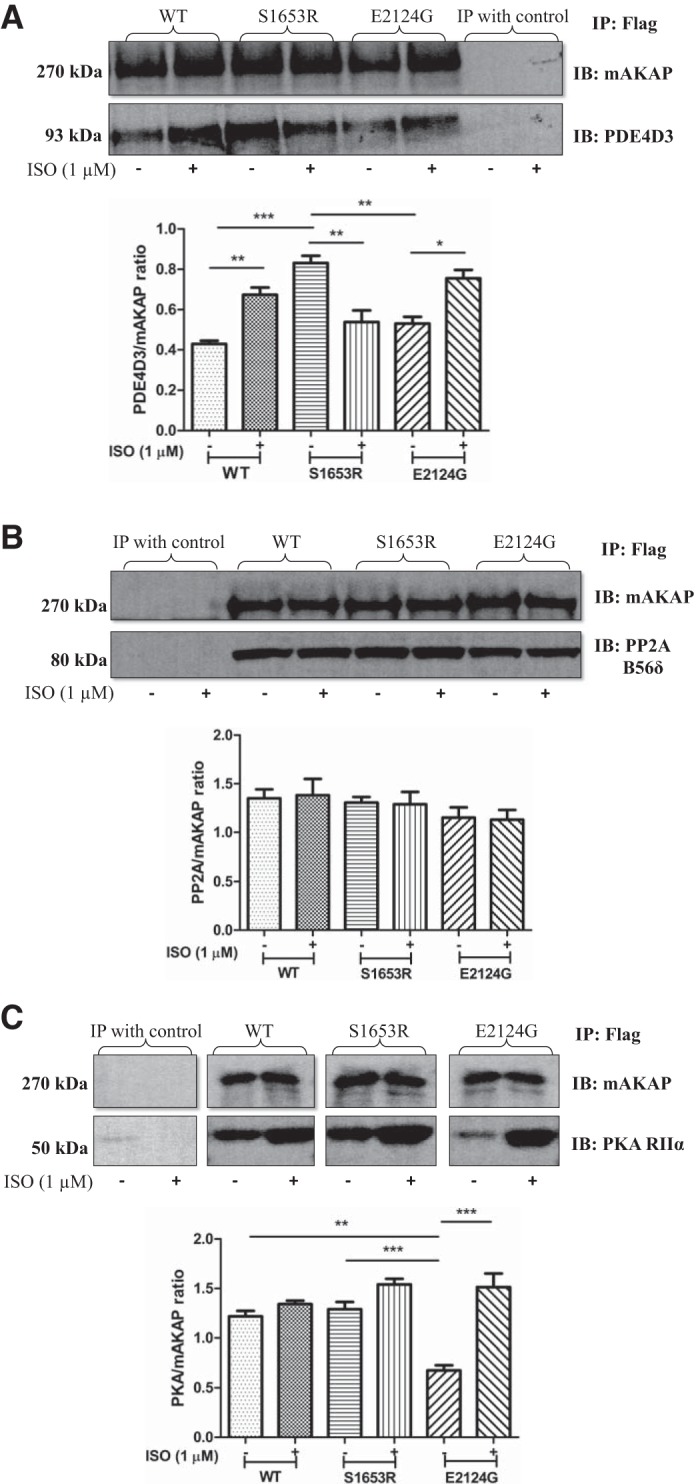
Human muscle-specific A-kinase anchoring protein (mAKAP) polymorphisms alter the binding of mAKAP to phosphodiesterase 4D3 (PDE4D3) and PKA both before and after stimulation with isoproterenol (ISO) in human embryonic kidney-293T cells. A: representative immunoblots of equal amounts of Flag-immunoprecipitated samples immunoblotted with PDE4D3 and mAKAP antibodies. A quantification of the four independent experiments is shown. Data are expressed as means ± SE [wild-type (WT) (−): 0.4294 ± 0.01563; WT (+): 0.6740 ± 0.03602; S1653R (−): 0.8312 ± 0.03568; S1653R (+): 0.5389 ± 0.05761; E2124G (−): 0.5313 ± 0.03342; and E2124G (+): 0.7554 ± 0.04143]. B: representative immunoblot Flag-immunoprecipitated samples showing bands for PKA RIIα and mAKAP antibodies. The corresponding quantification of four independent replicates by one-way ANOVA with Tukey’s multiple-comparison test is shown. Data are expressed as means ± SE [WT (−): 1.220 ± 0.05473; WT (+): 1.343 ± 0.03416; S1653R (−): 1.291 ± 0.07361; S1653R (+): 1.542 ± 0.05610; E2124G (−): 0.6783 ± 0.05108; E2124G (+): 1.514 ± 0.1369]. C: representative immunoblots of Flag-immunoprecipitated samples immunoblotted with hemagglutinin tag and mAKAP antibodies. The quantification of four separate experiments was performed by one-way ANOVA with Tukey’s multiple-comparison test (P = 0.5413) [WT (−): 1.351 ± 0.09165; WT (+): 1.382 ± 0.1681; S1653R (−): 1.305 ± 0.05912; S1653R (+): 1.290 ± 0.1259; E2124G (−): 1.153 ± 0.1054; E2124G (+): 1.131 ± 0.09952]. In A–C, cells were stimulated with ISO (1 µM) for 10 min (+), and unstimulated cells were treated with DMSO for 10 min (−). *P < 0.05; **P < 0.01; ***P < 0.001. IB, immunoblot analysis; IP, immunoprecipitation; PP2A, protein phosphatase 2A.
S1653R SNP altered cytosolic PDE activity and intracellular cAMP accumulation.
To see changes in cAMP dynamics due to the changes in PDE4D3 binding, we first measured cytosolic PDE activity in WT and mutant mAKAP-expressing cells. Our data suggested that PDE activity in cytosolic fractions of S1653R mutant mAKAP-expressing cells was significantly higher before stimulation and that PDE activity was significantly reduced after stimulation compared with WT (n = 4, P < 0.05; Fig. 3A). E2124G mutant mAKAP-expressing cells showed no change in PDE activity compared with WT before and after cell stimulation (Fig. 3A). Treatment with roflumilast, a selective PDE4 inhibitor (50 nM), inhibited most of the cytosolic PDE activity in control, WT, and mutant mAKAP-expressing cells at baseline or under isoproterenol-stimulated conditions (Figs. 3A and 4C). Intracellular cAMP accumulation assay revealed that cAMP levels were significantly lower in S1653R SNP-expressing cells at baseline compared with WT (n = 4, P < 0.001; Fig. 3B). However, after cell stimulation, cAMP levels in S1653R SNP-expressing cells were not significantly different compared with WT (Fig. 3B). Untransfected cells were used as an additional control, and we found no significant change in PDE activity or cAMP levels in control or WT mAKAP-expressing cells (Fig. 3, A and B). We also checked the effects of roflumilast treatment on cAMP levels and discovered that roflumilast did increase cAMP levels as expected in control, WT, and mutant mAKA-expressing cells before and after stimulation (Figs. 3B and 4A).
Fig. 3.

S1653R muscle-specific A-kinase anchoring protein single-nucleotide polymorphism changes cytosolic phosphodiesterase (PDE) activity and intracellular cAMP levels before and after isoproterenol (ISO) stimulation in human embryonic kidney-293T cells. A: PDE activity of cytosolic fractions was measured by calculating nanomoles of 5′-AMP released using colorimetry at 620 nm: baseline [control: 0.6588 ± 0.07612; wild-type (WT): 0.5998 ± 0.07175; S1653R: 1.059 ± 0.1156; E2124G: 0.5701 ± 0.08640] and stimulated (control: 0.8188 ± 0.1473; WT: 0.9443 ± 0.1654; S1653R: 0.4076 ± 0.05919; E2124G: 0.9869 ± 0.1004). B: free intracellular cAMP levels were calculated by measuring the absorbance at 405 nm: baseline (control: 2.510 ± 0.1480; WT: 2.995 ± 0.2767; S1653R: 1.413 ± 0.05879; E2124G: 2.825 ± 0.1995) and stimulated (control: 7.983 ± 0.5658; WT: 6.178 ± 0.4226; S1653R: 6.458 ± 0.2745; E2124G: 7.020 ± 1.324). In A and B, each sample was measured three times, and the average was taken as one experiment. Four separate experiments (n = 4) were performed for each group, and data are expressed as means ± SE. One-way ANOVA with Tukey’s multiple-comparison test was used for the analysis. *P < 0.05; **P < 0.01; ***P < 0.001. In A and B, cells were pretreated with ISO (1 µM) for 10 min (stimulation), and unstimulated cells were treated with DMSO for 10 min (baseline).
Fig. 4.

Roflumilast treatment showed no change in cAMP levels, PKA activity, or phosphodiesterase (PDE) activity either before or after isoproterenol stimulation. A: cells were pretreated with roflumilast (selective PDE4 inhibitor, 50 nM) for 15 min followed by DMSO (−) or isoproterenol (ISO) (+) treatment for 10 min. Four independent experiments were used to analyze the data, where each reading of an experiment is an average of three technical replicates, and data are expressed as means ± SE [control (−): 7.888 ± 0.5883; control (+): 9.063 ± 0.6162; wild-type (WT) (−): 7.515 ± 0.3998; WT (+): 9.715 ± 0.2228; S1653R (−): 7.683 ± 0.7788; S1653R (+): 8.948 ± 0.3886; E2124G (−): 7.573 ± 0.7420; E2124G (+): 8.898 ± 0.6284]. B: cells were pretreated with roflumilast (selective PDE4 inhibitor, 50 nM) for 15 min before cell lysis. Cells were then given no treatment (−) or treated with cAMP (+; 5 µM) for 10 min before PKA activity was measured. Four independent experiments were used to analyze the data, where each reading of an experiment is an average of three technical replicates, and data are expressed as means ± SE [control (−): 1.411 ± 0.2452; control (+): 1.914 ± 0.07938; WT (−): 1.360 ± 0.3208; WT (+): 1.745 ± 0.2556; S1653R (−): 1.201 ± 0.2641; S1653R (+): 1.700 ± 0.1890; E2124G (−): 0.9401 ± 0.3261; E2124G (+): 1.745 ± 0.1297]. C: cells were pretreated with roflumilast (selective PDE4 inhibitor; 50 nM) for 15 min followed by DMSO (−) or ISO (+) treatment for 10 min. Four independent experiments were used to analyze the data, where each reading of an experiment is an average of three technical replicates, and data are expressed as means ± SE [control (−): 0.1813 ± 0.02838; control (+): 0.1628 ± 0.03394; WT (−): 0.1952 ± 0.04658; WT (+): 0.2108 ± 0.03931; S1653R (−): 0.2006 ± 0.03572; S1653R (+): 0.1653 ± 0.03781; E2124G (−): 0.2199 ± 0.03684; E2124G (+): 0.1891 ± 0.04315].
S1653R and E2124G mutant mAKAP abnormally changed global PKA activity without any change in the expressions of PKA, PDE4D3, and PP2A.
We measured total PKA activity in cell lysates expressing WT and mutant mAKAP and found that PKA activity was significantly lower in S1653R and E2124G mAKAP- compared with WT mAKAP-expressing cells at baseline (P < 0.01, for WT vs. S1653R and P < 0.05, n = 3 for WT vs. E2124G; Fig. 5A). Nevertheless, after stimulation with cAMP, the difference in PKA activity was lost, showing no significant change in WT and mutant mAKAP (n = 3, P = 0.2223 by ANOVA; Fig. 5A). We observed no significant change in untransfected control and WT mAKAP-expressing cells at any point (Fig. 5A). Roflumilast treatment showed the expected rise in PKA activity in control, WT, and mutant mAKAP under unstimulated and stimulated conditions (Figs. 4B and 5A). To account for endogenous changes in the expression of PKA, PDE4D3, and PP2A due to WT and/or mutant mAKAP, we checked the expression of PKA RIIα, PKA catalytic subunit-α (PKA-Cα), PDE4D3, and PP2A catalytic subunit (PP2A C). We found that expression of PKA RIIα, PKA-Cα, PDE4D3, and PP2A C did not change in WT and mutant mAKAP (S1653R and E2124G)-expressing cell lysates before and after cell stimulation with isoproterenol (Fig. 5, B and C).
Fig. 5.

S1653R and E2124G muscle-specific A-kinase anchoring protein single-nucleotide polymorphisms abruptly affect global PKA activity before and after stimulation, with no endogenous changes in PKA, phosphodiesterase 4D3 (PDE4D3), or protein phosphatase 2A (PP2A). A: total PKA activity was calculated by quantifying the color developed at the end of the assay by measuring the absorbance at 450 nm. Baseline, no pretreatment; stimulation, cell treatment with cAMP (5 µM) for 10 min at 37°C after the cell lysis. Three independent experiments (n = 3) were performed for this assay, where each experiment was calculated as an average of three replicates of readings, and values are expressed as means ± SE: baseline [control: 0.5741 ± 0.01450; wild-type (WT): 0.5994 ± 0.007568; S1653R: 0.4352 ± 0.03462; E2124G: 0.4527 ± 0.03182] and stimulated (control: 2.445 ± 0.1103; WT: 2.402 ± 0.02461; S1653R: 2.129 ± 0.1279; E2124G: 2.312 ± 0.1181). B: representative immunoblots of PKA RIIα and PKA-Cα along with their respective GAPDH and quantification bar graphs of four independent experiments: PKA RIIα [control (−): 0.5207 ± 0.06271; control (+): 0.5357 ± 0.05975; WT (−): 0.5003 ± 0.06987; WT (+): 0.5411 ± 0.07028; S1653R (−): 0.5077 ± 0.05017; S1653R (+): 0.5054 ± 0.02433; E2124G (−): 0.5365 ± 0.03641; E2124G (+): 0.5768 ± 0.03634] and PKA-Cα [control (−): 0.9823 ± 0.1819; control (+): 0.9259 ± 0.1102; WT (−): 1.256 ± 0.1595; WT (+): 1.173 ± 0.2164; S1653R (−): 1.121 ± 0.2033; S1653R (+): 1.251 ± 0.2746; E2124G (−): 1.229 ± 0.2860; E2124G (+): 1.291 ± 0.3183]. C: representative immunoblots of PDE4D3 and PP2A-C with their GAPDH and respective quantification bar graphs of four independent experiments: PDE4D3 [control (−): 1.084 ± 0.1215; control (+): 1.034 ± 0.1739; WT (−): 1.343 ± 0.2465; WT (+): 1.406 ± 0.1837; S1653R (−): 1.231 ± 0.08577; S1653R (+): 1.536 ± 0.1102; E2124G (−): 1.337 ± 0.06269; E2124G (+): 1.505 ± 0.07232] and PP2A-C [control (−): 1.008 ± 0.1251; control (+): 1.169 ± 0.09173; WT (−): 1.301 ± 0.05079; WT (+): 1.260 ± 0.04579; S1653R (−): 1.383 ± 0.1051; S1653R (+): 1.291 ± 0.1351; E2124G (−): 1.359 ± 0.1253; E2124G (+): 1.396 ± 0.07268]. In B and C, cells were pretreated with isoproterenol (ISO; 1 µM) for 10 min (+), and unstimulated cells were treated with DMSO for 10 min (−).
Phosphorylation of transcription factors CREB, PKD, and HDAC4 was upregulated in mutant mAKAP, whereas expression levels of calcineurin and phospho-MEF2D were unaltered.
Our immunoblot data showed that phosphorylation of phospho-CREB at Ser133 was significantly higher after stimulation in mutant mAKAP-expressing cells compared with before stimulation, whereas WT and untransfected control cells showed no significant change in the expression of phospho-CREB poststimulation (Fig. 6A). Similarly, phosphorylation of PKD at Ser916 was significantly upregulated in S1653R SNP-expressing cells after stimulation, whereas WT and E2124 SNP-expressing cells did not show any significant change after isoproterenol stimulation (Fig. 6B). HDAC4 phosphorylation at 467/632 residues was analyzed, and the results showed that phospho-HDAC4 levels were significantly greater in S1653R SNP-expressing cells after cell stimulation (Fig. 6C). There was no significant change in the expression of calcineurin and phospho-MEF2D in WT and mutant mAKAP (S1653R and E2124G)-expressing cells before and after isoproterenol stimulation (Fig. 7, A and B). Untransfected cells were used as a control, and there was no significant difference in the expression of the above-mentioned proteins in control and WT mAKAP-expressing cells either before or after stimulation (Fig. 5, A–C, and Fig. 7, A and B).
Fig. 6.
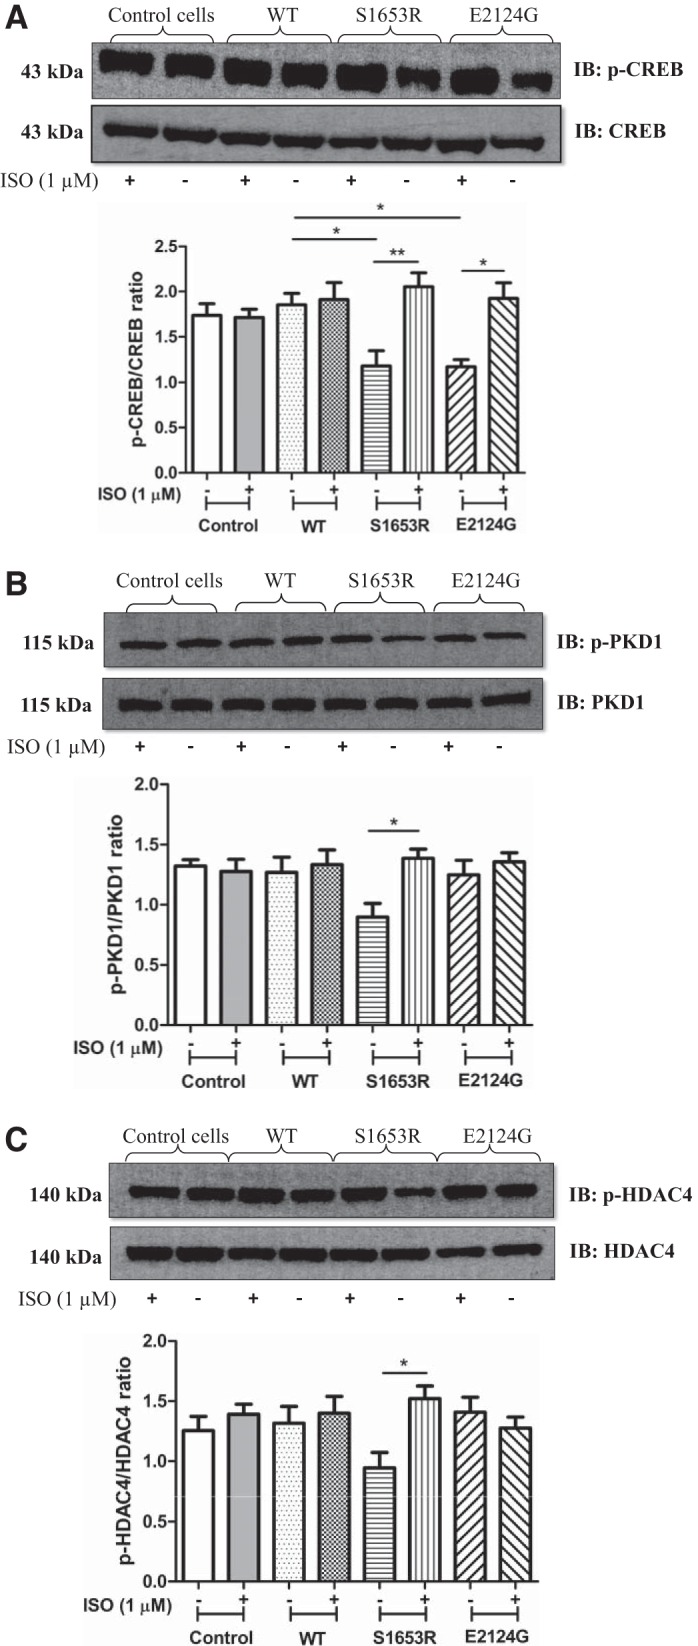
Expression of S1653R and E2124G single-nucleotide polymorphisms upregulate phosphorylation of endogenous cAMP response element-binding protein (CREB), PKD1, and histone deacetylase 4 (HDAC4) in human embryonic kidney (HEK)-293T cells after cell stimulation. A: representative images of immunoblots developed from PKA/phosphorylation-specific Ser133 phospho-CREB and total CREB antibodies. Quantification of the same was performed using four independent cell lysates for each group. *P < 0.05; **P < 0.01 [control (−): 1.736 ± 0.1304; control (+): 1.713 ± 0.09135; wild-type (WT) (−): 1.854 ± 0.1275; WT (+): 1.911 ± 0.1882; S1653R (−): 1.176 ± 0.1692; S1653R (+): 2.054 ± 0.1528; E2124G (−): 1.167 ± 0.07977; E2124G (+): 1.923 ± 0.1733]. B: representative immunoblots were obtained from bands developed by phospho-PKD1 (Ser916) and PKD1 antibodies. Quantification bar graphs were plotted by analyzing four separate cell lysates for each group. *P < 0.05 vs. S1653R-expressing cells before stimulation [control (−): 1.321 ± 0.05268; control (+): 1.275 ± 0.1021; WT (−): 1.268 ± 0.1290; WT (+): 1.333 ± 0.1224; S1653R (−): 0.8973 ± 0.1134; S1653R (+): 1.386 ± 0.07693; E2124G (−): 1.248 ± 0.1217; E2124G (+): 1.356 ± 0.07624]. C: representative Western blots obtained from phospho-HDAC4 (Ser467/632) and HDAC4 antibodies. Quantification bar graph plotted using four independent cell lysates for each group. Values are means ± SE. *P < 0.05 vs. S1653R-expressing cells before stimulation [control (−): 1.254 ± 0.1181; control (+): 1.390 ± 0.08392; WT (−): 1.315 ± 0.1405; WT (+): 1.400 ± 0.1390; S1653R (−): 0.9449 ± 0.1273; S1653R (+): 1.522 ± 0.1038; E2124G (−): 1.408 ± 0.1236; E2124G (+): 1.275 ± 0.09248]. In all above experiments, HEK-293T cells were pretreated with isoproterenol (ISO; 1 µM) for 10 min (+), and unstimulated cells were treated with DMSO for 10 min (−). Please note that the sequence of A–C was reversed to that of the sequence of quantification graphs. This was done to avoid cutting and rearranging of bands unnecessarily, because during the experimental transfer procedure the gels were inadvertently transferred the opposite way round. IB, immunoblot analysis; IP, immunoprecipitation.
Fig. 7.

There was no change in the expression of calcineurin and phospho-MEF2D before or after isoproterenol (ISO) in mutant muscle-specific A-kinase anchoring protein-expressing human embryonic kidney-293T cells. A: representative immunoblots of bands obtained from calcineurin and GAPDH antibodies and the corresponding quantification bar graph. Values are means ± SE obtained from four independent experiments [control (−): 0.9312 ± 0.04733; control (+): 0.9992 ± 0.04312; wild-type (WT) (−): 1.019 ± 0.005362; WT (+): 1.032 ± 0.01538; S1653R (−): 1.018 ± 0.06504; S1653R (+): 1.185 ± 0.08820; E2124G (−): 1.064 ± 0.01953; E2124G (+): 1.054 ± 0.05452]. B: representative Western blot image of phospho-MEF2D (Ser444) and total MEF2D with respective bar graph quantification. Four separate experiments were performed for analysis. Values are expressed as means ± SE [control (−): 1.009 ± 0.02920; control (+): 1.065 ± 0.08603; WT (−): 0.9977 ± 0.04492; WT (+): 1.010 ± 0.06008; S1653R (−): 1.065 ± 0.06702; S1653R (+): 1.116 ± 0.06349; E2124G (−): 1.064 ± 0.06982; E2124G (+): 1.078 ± 0.08712]. −, No stimulation or absence of stimulation; +ISO stimulation, where indicated. IB, immunoblot analysis.
DISCUSSION
Upstream stimulation of G protein-coupled receptors (GPCRs) activates adenylate cyclase, leading to increased cAMP, and subsequently increases PKA activity. PKA is targeted to its substrates to subcellular compartments by AKAPs. Thus, AKAPs are crucial molecular regulators of PKA-mediated phosphorylation and downstream signaling, which are crucial for normal heart functioning induced by GPCR stimulation (33). Defective heart functioning may lead to cardiovascular disease, which is the number 1 cause of deaths in the world and the United States. Pathological hypertrophy is a very common finding in patients with CVDs or CVD risk factors. Several studies have advocated that genetics plays an important role in increasing the risk of developing CVDs in humans (4, 42). Additionally, a wide variety of drug treatment is available for CVDs, but there is very high variability to drug treatment. Genetic factors, especially SNPs, play a decisive role in determining such variability coupled with the higher risk of CVDs.
mAKAP is a master scaffold for cardiac remodeling (17). At the cellular level, mAKAP regulates cAMP very tightly by binding to PDE4D3 and PP2A. Basal cAMP levels and PKA activity are maintained by tonic PDE4D3 activity (7). After cell stimulation, tonic PDE activity is surpassed by adenylate cyclase activity, leading to an increase in cAMP, followed by higher PKA activity. PKA phosphorylation of PDE4D3 increases its binding to mAKAP and catalytic activity, leading to a reduction of cAMP levels. However, PKA phosphorylation of PP2A leads to higher dephosphorylation of PDE4D3, which reduces its binding to the mAKAP, leading to higher cAMP levels (16). Hence, there is a rapid turn on and off of PKA activity, which is dependent on the corresponding changes in the local cAMP pools. This cAMP/PKA signaling is critical for normal operating of the heart, and aberrant changes in this pathway are implicated in the pathophysiology of CVDs (40).
The purpose of our research was to study mAKAP SNPs found in CVDs patients’ cohorts with respect to cAMP/PKA pathway. Our computational experiments revealed that mAKAP SNPs, S1653R and E2124G, had very high predicted damaging effects (Table 1). Case control enrichment experiments were not feasible based on publicly available data sets due to the lack of appropriate phenotypical annotation and the confounding ethnic background of available sequenced individuals. However, we observed the S1653R SNP in 25 individuals of the ARIC and PROCARDIS data sets, where it may have influenced the risk of atherosclerotic coronary artery disease (Table 2). The E2124G SNP was found exclusively in African-American individuals of the ARIC and JHS cohorts, signifying its importance in individuals with African ancestry (Table 2). Several studies have shown that African-American individuals are more prone to left ventricular cardiac hypertrophy than white individuals (3). Similarly, left ventricular hypertrophy is an independent factor that can predict CVD survival in a biracial cohort ARIC study containing 14,489 participants when followed for 10 yr (27). mAKAP controls pathological hypertrophic gene expression by regulating the transcription factors nuclear factor of activated T cells family member c, MEF2D, hypoxia-inducible factor-1α and type II HDACs (17, 30). Because mAKAP has an essential role in mediating left ventricular cardiac remodeling, studying and analyzing how these mAKAP SNPs may modulate the predisposition to CVDs is critical.
Our results demonstrated that mAKAP SNPs do not alter the expression of mAKAP (Fig. 1B), which is incongruent with our previously published report where similar mAKAP SNPs did not alter mAKAP expression in HEK-293 cells (32). Therefore, any deviations in cell signaling due to SNPs was not due to an inherent change in the expression of mAKAP. Furthermore, our coimmunoprecipitation data suggested that the S1653R SNP, which is found in the PDE4D3-binding domain of mAKAP, significantly upregulated the binding of PDE4D3 at baseline and downregulated PDE4D3-mAKAP interactions after cell stimulation (Fig. 2A). These changes in the binding of PDE4D3 were translated into cytosolic PDE activity in these cells showing similar changes (Fig. 3A). A majority of the cytosolic PDE activity is attributed to the PDE4 isoform, and, hence, cytosolic fractions were taken into account (23). On the other hand, WT and E2124G mAKAP showed an expected increase in the binding of PDE4D3 after cell stimulation possibly to prevent the abnormally high levels of cAMP as observed in our previously reported results (32) (Fig. 2A). Interestingly, our study also showed that the E2124G SNP, found in 3′-PKA RIIα or PP2A-binding domain of mAKAP, significantly decreased the binding of PKA to mAKAP at baseline, which was increased after cell stimulation (Fig. 2B). WT and S1653R mAKAP did not alter PKA binding to mAKAP after cell stimulation, which was incongruent with our previous publication (Fig. 2B) (32).
The abrupt cAMP changes demonstrated by the S1653R mAKAP mutant might be due to higher PDE4D3 binding to S1653R mAKAP, with the corresponding higher cytosolic PDE activity at baseline showing lower cAMP levels and lower PDE4D3 binding coupled with lower PDE activity after cell stimulation, leading to an abrupt rise in cAMP. Changes in PKA activity in S1653R mAKAP can be attributed to respective changes in PDE4D3 binding and PDE activity, as explained above. The altered PKA activity in E2124G mAKAP could be attributed to the respective changes in the binding of PKA to E2124G mAKAP. Furthermore, roflumilast treatment showed the expected rise in cAMP levels and PKA activity along with inhibition of PDE activity, acting as an additional control proving faithfulness of the respective assays (Fig. 4, A–C). We also confirmed that the changes in cAMP levels and PKA activity were not due to endogenous changes in the expression of PKA, PP2A, or PDE4D3 (Fig. 5, B and C).
Changing serine (neutral) to arginine (positively charged) at the 1653 position might change the protein-protein interactions of mAKAP with PDE4D3. In general, charged amino acids exhibit higher protein interactions and higher binding (8). Higher interactions with arginine than serine may explain changes in PDE4D3 binding. Remarkably, serine to arginine mutation in CFTR gene had a phenotype of severe cystic fibrosis in an Italian patient (36). Hence, by affecting PED4D3 binding and subsequent PDE activity, the S1653R SNP may prove pathophysiologically important. Changing glutamic acid (hydrophilic and acidic) to glycine (hydrophobic) increases nonpolarity and changes the overall charge of the resulting protein. This may alter binding of PKA to mAKAP to some extent. Surprisingly, E1425G substitution in ankyrin-B protein leads to loss of function of ankyrin-B, resulting in a rare form of long QT syndrome (6). A mutation, E180G, in tropomyosin has been reported to cause familial hypertrophic cardiomyopathy in humans and mice with unique atrial hypertrophy (31). Therefore, by altering PKA binding and subsequent PKA activity, the E2124G SNP may have pathophysiological significance.
PKA-mediated phosphorylation of CREB at Ser133 has been associated with cardiac apoptosis, remodeling, and fibrosis (11). Our results showed abnormal changes in the phospho-CREB levels in S1653R and E2124G mAKAP mutant-expressing cells compared with WT before and after cell stimulation, which might alter normal cardiac cell signaling. Similarly, we observed higher phosphorylation of PKD and HDAC4 in S1653R mAKAP-expressing cells after cell stimulation (Fig. 6, B and C). PKD and HDAC4 are crucial transcription factors that are binding partners of mAKAP. Autophosphorylation of PKD at Ser916 activates PKD, which, in turn, phosphorylates HDAC4, derepressing hypertrophic gene expression (25). Hence, higher PKD and HDAC phosphorylation might be pathophysiologically crucial. It is also reported that PKD can phosphorylate CREB at Ser133 monitoring CRE-dependent transcription (12). Therefore, higher phosphorylation of PKD might be one of the reasons for higher CREB phosphorylation in S1653R mAKAP-expressing cells.
To conclude, we showed that human mAKAP polymorphisms, which were found in patient cohorts of CVDs, alter cAMP/PKA signaling, and, by doing so, they may influence the propensity of developing CVDs in humans (Fig. 8). Our data strongly support the clinical significance of PKA-mAKAP-PDE4D3 interactions, which could be a promising target to augment current treatment of CVDs, as shown by others (30). Future experiments in our laboratory are focused to prove whether these SNPs will increase and/or lower the risk of specific CVDs. Nonetheless, our data suggest that polymorphisms in mAKAP may play a crucial role in modifying the susceptibility of humans to CVDs.
Fig. 8.

Summary of the role of muscle-specific A-kinase anchoring protein (mAKAP) polymorphisms in the cAMP/PKA signaling pathway. A: the S1653R single-nucleotide polymorphism, named here as a mAKAP-phosphodiesterase (PDE) mutant, showed lower cAMP levels coupled with higher PDE4D3 binding at baseline. These changes might be the possible reasons for lower PKA activity. When stimulated, along with lower PDE4D3 binding, cAMP levels and PKA activity were found to be abruptly higher. B: E2124G, named here as a mAKAP-PKA mutant, showed lower PKA binding at baseline with no changes in cAMP levels and PKA activity. After stimulation, coupled with significantly higher PKA binding and abrupt cAMP increase, PKA activity was found to be significantly higher. PP2A, protein phosphatase 2A.
GRANTS
This work was supported by National Heart, Lung, and Blood Institute Grant R15-HL-124458 (to B. K. McConnell) and a grant from the Robert J. Kleberg, Jr. and Helen C. Kleberg Foundation (to B. K. McConnell). The data reported in this work are based on the dissertation thesis submitted in partial fulfillment of the requirements for a PhD (Pharmacology) at the University of Houston (S. V. Suryavanshi).
DISCLOSURES
No conflicts of interest, financial or otherwise, are declared by the authors.
AUTHOR CONTRIBUTIONS
S.V.S., P.K., O.L., and B.K.M. conceived and designed research; S.V.S., S.M.J., and K.L.A. performed experiments; S.V.S., S.M.J., K.L.A., and B.K.M. analyzed data; S.V.S., S.M.J., K.L.A., P.K., O.L., and B.K.M. interpreted results of experiments; S.V.S. and S.M.J. prepared figures; S.V.S. and B.K.M. drafted manuscript; S.V.S., S.M.J., P.K., O.L., and B.K.M. edited and revised manuscript; S.V.S., S.M.J., K.L.A., P.K., O.L., and B.K.M. approved final version of manuscript.
ACKNOWLEDGMENTS
An abstract demonstrating the research reported in this article was presented for a poster session in American Heart Association Scientific Sessions, 2017 (Suryavanshi S, Jadhav S, Anderson K, Katsonis P, Lichtarge O, and McConnell BK. Abstract 24010: muscle-specific A-kinase anchoring protein polymorphisms pre-dispose humans to cardiovascular diseases by affecting cyclic AMP/PKA Signaling. Circulation 136: A24010–A24010, 2017).
REFERENCES
- 1.Adzhubei I, Jordan DM, Sunyaev SR. Predicting functional effect of human missense mutations using PolyPhen-2. Curr Protoc Hum Genet Chapter 7: Unit7.20, 2013. doi: 10.1002/0471142905.hg0720s76. [DOI] [PMC free article] [PubMed] [Google Scholar]
- 2.Adzhubei IA, Schmidt S, Peshkin L, Ramensky VE, Gerasimova A, Bork P, Kondrashov AS, Sunyaev SR. A method and server for predicting damaging missense mutations. Nat Methods 7: 248–249, 2010. doi: 10.1038/nmeth0410-248. [DOI] [PMC free article] [PubMed] [Google Scholar]
- 3.Bidulescu A, Liu J, Musani SK, Fox ER, Samdarshi TE, Sarpong DF, Vaccarino V, Wilson PW, Arnett DK, Din-Dzietham R, Taylor HA, Gibbons GH. Association of adiponectin with left ventricular mass in blacks: the Jackson Heart Study. Circ Heart Fail 4: 747–753, 2011. doi: 10.1161/CIRCHEARTFAILURE.110.959742. [DOI] [PMC free article] [PubMed] [Google Scholar]
- 4.Cambien F, Tiret L. Genetics of cardiovascular diseases: from single mutations to the whole genome. Circulation 116: 1714–1724, 2007. doi: 10.1161/CIRCULATIONAHA.106.661751. [DOI] [PubMed] [Google Scholar]
- 5.Cooper GM, Stone EA, Asimenos G; NISC Comparative Sequencing Program, Green ED, Batzoglou S, Sidow A. Distribution and intensity of constraint in mammalian genomic sequence. Genome Res 15: 901–913, 2005. doi: 10.1101/gr.3577405. [DOI] [PMC free article] [PubMed] [Google Scholar]
- 6.Curran J, Mohler PJ. Coordinating electrical activity of the heart: ankyrin polypeptides in human cardiac disease. Expert Opin Ther Targets 15: 789–801, 2011. doi: 10.1517/14728222.2011.575363. [DOI] [PMC free article] [PubMed] [Google Scholar]
- 7.Dodge-Kafka KL, Bauman A, Mayer N, Henson E, Heredia L, Ahn J, McAvoy T, Nairn AC, Kapiloff MS. cAMP-stimulated protein phosphatase 2A activity associated with muscle A kinase-anchoring protein (mAKAP) signaling complexes inhibits the phosphorylation and activity of the cAMP-specific phosphodiesterase PDE4D3. J Biol Chem 285: 11078–11086, 2010. doi: 10.1074/jbc.M109.034868. [DOI] [PMC free article] [PubMed] [Google Scholar]
- 8.Gitlin I, Carbeck JD, Whitesides GM. Why are proteins charged? Networks of charge-charge interactions in proteins measured by charge ladders and capillary electrophoresis. Angew Chem Int Ed Engl 45: 3022–3060, 2006. doi: 10.1002/anie.200502530. [DOI] [PubMed] [Google Scholar]
- 9.Horikoshi M, Mӓgi R, van de Bunt M, Surakka I, Sarin AP, Mahajan A, Marullo L, Thorleifsson G, Hӓgg S, Hottenga JJ, Ladenvall C, Ried JS, Winkler TW, Willems SM, Pervjakova N, Esko T, Beekman M, Nelson CP, Willenborg C, Wiltshire S, Ferreira T, Fernandez J, Gaulton KJ, Steinthorsdottir V, Hamsten A, Magnusson PK, Willemsen G, Milaneschi Y, Robertson NR, Groves CJ, Bennett AJ, Lehtimӓki T, Viikari JS, Rung J, Lyssenko V, Perola M, Heid IM, Herder C, Grallert H, Müller-Nurasyid M, Roden M, Hypponen E, Isaacs A, van Leeuwen EM, Karssen LC, Mihailov E, Houwing-Duistermaat JJ, de Craen AJ, Deelen J, Havulinna AS, Blades M, Hengstenberg C, Erdmann J, Schunkert H, Kaprio J, Tobin MD, Samani NJ, Lind L, Salomaa V, Lindgren CM, Slagboom PE, Metspalu A, van Duijn CM, Eriksson JG, Peters A, Gieger C, Jula A, Groop L, Raitakari OT, Power C, Penninx BW, de Geus E, Smit JH, Boomsma DI, Pedersen NL, Ingelsson E, Thorsteinsdottir U, Stefansson K, Ripatti S, Prokopenko I, McCarthy MI, Morris AP; ENGAGE Consortium . Discovery and fine-mapping of glycaemic and obesity-related trait loci using high-density imputation. PLoS Genet 11: e1005230, 2015. doi: 10.1371/journal.pgen.1005230. [DOI] [PMC free article] [PubMed] [Google Scholar]
- 10.Humphries SE. Common variants for cardiovascular disease: clinical utility confirmed. Circulation 135: 2102–2105, 2017. doi: 10.1161/CIRCULATIONAHA.117.027798. [DOI] [PubMed] [Google Scholar]
- 11.Ichiki T. Role of cAMP response element binding protein in cardiovascular remodeling: good, bad, or both? Arterioscler Thromb Vasc Biol 26: 449–455, 2006. doi: 10.1161/01.ATV.0000196747.79349.d1. [DOI] [PubMed] [Google Scholar]
- 12.Johannessen M, Delghandi MP, Rykx A, Dragset M, Vandenheede JR, Van Lint J, Moens U. Protein kinase D induces transcription through direct phosphorylation of the cAMP-response element-binding protein. J Biol Chem 282: 14777–14787, 2007. doi: 10.1074/jbc.M610669200. [DOI] [PubMed] [Google Scholar]
- 13.Kathiresan S, Srivastava D. Genetics of human cardiovascular disease. Cell 148: 1242–1257, 2012. doi: 10.1016/j.cell.2012.03.001. [DOI] [PMC free article] [PubMed] [Google Scholar]
- 14.Katsonis P, Lichtarge O. A formal perturbation equation between genotype and phenotype determines the Evolutionary Action of protein-coding variations on fitness. Genome Res 24: 2050–2058, 2014. doi: 10.1101/gr.176214.114. [DOI] [PMC free article] [PubMed] [Google Scholar]
- 15.Katsonis P, Lichtarge O. Objective assessment of the evolutionary action equation for the fitness effect of missense mutations across CAGI-blinded contests. Hum Mutat 38: 1072–1084, 2017. doi: 10.1002/humu.23266. [DOI] [PMC free article] [PubMed] [Google Scholar]
- 16.Kritzer MD, Li J, Dodge-Kafka K, Kapiloff MS. AKAPs: the architectural underpinnings of local cAMP signaling. J Mol Cell Cardiol 52: 351–358, 2012. doi: 10.1016/j.yjmcc.2011.05.002. [DOI] [PMC free article] [PubMed] [Google Scholar]
- 17.Kritzer MD, Li J, Passariello CL, Gayanilo M, Thakur H, Dayan J, Dodge-Kafka K, Kapiloff MS. The scaffold protein muscle A-kinase anchoring protein β orchestrates cardiac myocyte hypertrophic signaling required for the development of heart failure. Circ Heart Fail 7: 663–672, 2014. doi: 10.1161/CIRCHEARTFAILURE.114.001266. [DOI] [PMC free article] [PubMed] [Google Scholar]
- 18.Lee Y, Choi J, Ha KH, Jue DM. Transient exposure to hydrogen peroxide inhibits the ubiquitination of phosphorylated IκBα in TNFα-stimulated HEK293 cells. Exp Mol Med 44: 513–520, 2012. doi: 10.3858/emm.2012.44.8.058. [DOI] [PMC free article] [PubMed] [Google Scholar]
- 19.Lek M, Karczewski KJ, Minikel EV, Samocha KE, Banks E, Fennell T, O’Donnell-Luria AH, Ware JS, Hill AJ, Cummings BB, Tukiainen T, Birnbaum DP, Kosmicki JA, Duncan LE, Estrada K, Zhao F, Zou J, Pierce-Hoffman E, Berghout J, Cooper DN, Deflaux N, DePristo M, Do R, Flannick J, Fromer M, Gauthier L, Goldstein J, Gupta N, Howrigan D, Kiezun A, Kurki MI, Moonshine AL, Natarajan P, Orozco L, Peloso GM, Poplin R, Rivas MA, Ruano-Rubio V, Rose SA, Ruderfer DM, Shakir K, Stenson PD, Stevens C, Thomas BP, Tiao G, Tusie-Luna MT, Weisburd B, Won HH, Yu D, Altshuler DM, Ardissino D, Boehnke M, Danesh J, Donnelly S, Elosua R, Florez JC, Gabriel SB, Getz G, Glatt SJ, Hultman CM, Kathiresan S, Laakso M, McCarroll S, McCarthy MI, McGovern D, McPherson R, Neale BM, Palotie A, Purcell SM, Saleheen D, Scharf JM, Sklar P, Sullivan PF, Tuomilehto J, Tsuang MT, Watkins HC, Wilson JG, Daly MJ, MacArthur DG; Exome Aggregation Consortium . Analysis of protein-coding genetic variation in 60,706 humans. Nature 536: 285–291, 2016. doi: 10.1038/nature19057. [DOI] [PMC free article] [PubMed] [Google Scholar]
- 20.Li Z, Singh S, Suryavanshi SV, Ding W, Shen X, Wijaya CS, Gao WD, McConnell BK. Force development and intracellular Ca2+ in intact cardiac muscles from gravin mutant mice. Eur J Pharmacol 807: 117–126, 2017. doi: 10.1016/j.ejphar.2017.04.020. [DOI] [PMC free article] [PubMed] [Google Scholar]
- 21.Liu H, Wang C, Xie N, Zhuang Z, Liu X, Hou J, Huang H. Activation of adrenergic receptor β2 promotes tumor progression and epithelial mesenchymal transition in tongue squamous cell carcinoma. Int J Mol Med 41: 147–154, 2018. doi: 10.3892/ijmm.2017.3248. [DOI] [PMC free article] [PubMed] [Google Scholar]
- 22.Lohmann SM, DeCamilli P, Einig I, Walter U. High-affinity binding of the regulatory subunit (RII) of cAMP-dependent protein kinase to microtubule-associated and other cellular proteins. Proc Natl Acad Sci USA 81: 6723–6727, 1984. doi: 10.1073/pnas.81.21.6723. [DOI] [PMC free article] [PubMed] [Google Scholar]
- 23.Matthiesen K, Nielsen J. Cyclic AMP control measured in two compartments in HEK293 cells: phosphodiesterase K(M) is more important than phosphodiesterase localization. PLoS One 6: e24392, 2011. doi: 10.1371/journal.pone.0024392. [DOI] [PMC free article] [PubMed] [Google Scholar]
- 24.Mauban JR, O’Donnell M, Warrier S, Manni S, Bond M. AKAP-scaffolding proteins and regulation of cardiac physiology. Physiology (Bethesda) 24: 78–87, 2009. doi: 10.1152/physiol.00041.2008. [DOI] [PMC free article] [PubMed] [Google Scholar]
- 25.Monovich L, Vega RB, Meredith E, Miranda K, Rao C, Capparelli M, Lemon DD, Phan D, Koch KA, Chapo JA, Hood DB, McKinsey TA. A novel kinase inhibitor establishes a predominant role for protein kinase D as a cardiac class IIa histone deacetylase kinase. FEBS Lett 584: 631–637, 2010. doi: 10.1016/j.febslet.2009.12.014. [DOI] [PubMed] [Google Scholar]
- 26.O’Donnell CJ, Nabel EG. Genomics of cardiovascular disease. N Engl J Med 365: 2098–2109, 2011. doi: 10.1056/NEJMra1105239. [DOI] [PubMed] [Google Scholar]
- 27.Okwuosa TM, Soliman EZ, Lopez F, Williams KA, Alonso A, Ferdinand KC. Left ventricular hypertrophy and cardiovascular disease risk prediction and reclassification in blacks and whites: the Atherosclerosis Risk in Communities Study. Am Heart J 169: 155–61.e5, 2015. doi: 10.1016/j.ahj.2014.09.013. [DOI] [PMC free article] [PubMed] [Google Scholar]
- 28.Pare GC, Bauman AL, McHenry M, Michel JJ, Dodge-Kafka KL, Kapiloff MS. The mAKAP complex participates in the induction of cardiac myocyte hypertrophy by adrenergic receptor signaling. J Cell Sci 118: 5637–5646, 2005. doi: 10.1242/jcs.02675. [DOI] [PubMed] [Google Scholar]
- 29.Park M, Reddy GR, Wallukat G, Xiang YK, Steinberg SF. β1-Adrenergic receptor O-glycosylation regulates N-terminal cleavage and signaling responses in cardiomyocytes. Sci Rep 7: 7890, 2017. doi: 10.1038/s41598-017-06607-z. [DOI] [PMC free article] [PubMed] [Google Scholar]
- 30.Passariello CL, Li J, Dodge-Kafka K, Kapiloff MS. mAKAP-a master scaffold for cardiac remodeling. J Cardiovasc Pharmacol 65: 218–225, 2015. doi: 10.1097/FJC.0000000000000206. [DOI] [PMC free article] [PubMed] [Google Scholar]
- 31.Prabhakar R, Petrashevskaya N, Schwartz A, Aronow B, Boivin GP, Molkentin JD, Wieczorek DF. A mouse model of familial hypertrophic cardiomyopathy caused by a alpha-tropomyosin mutation. Mol Cell Biochem 251: 33–42, 2003. doi: 10.1023/A:1025409227350. [DOI] [PubMed] [Google Scholar]
- 32.Rababa’h A, Craft JW Jr, Wijaya CS, Atrooz F, Fan Q, Singh S, Guillory AN, Katsonis P, Lichtarge O, McConnell BK. Protein kinase A and phosphodiesterase-4D3 binding to coding polymorphisms of cardiac muscle anchoring protein (mAKAP). J Mol Biol 425: 3277–3288, 2013. doi: 10.1016/j.jmb.2013.06.014. [DOI] [PMC free article] [PubMed] [Google Scholar]
- 33.Rababa’h A, Singh S, Suryavanshi SV, Altarabsheh SE, Deo SV, McConnell BK. Compartmentalization role of A-kinase anchoring proteins (AKAPs) in mediating protein kinase A (PKA) signaling and cardiomyocyte hypertrophy. Int J Mol Sci 16: 218–229, 2014. doi: 10.3390/ijms16010218. [DOI] [PMC free article] [PubMed] [Google Scholar]
- 34.Ramirez AH, Shaffer CM, Delaney JT, Sexton DP, Levy SE, Rieder MJ, Nickerson DA, George AL Jr, Roden DM. Novel rare variants in congenital cardiac arrhythmia genes are frequent in drug-induced torsades de pointes. Pharmacogenomics J 13: 325–329, 2013. doi: 10.1038/tpj.2012.14. [DOI] [PMC free article] [PubMed] [Google Scholar]
- 35.Roth GA, Johnson C, Abajobir A, Abd-Allah F, Abera SF, Abyu G, Ahmed M, Aksut B, Alam T, Alam K, Alla F, Alvis-Guzman N, Amrock S, Ansari H, Ärnlöv J, Asayesh H, Atey TM, Avila-Burgos L, Awasthi A, Banerjee A, Barac A, Bärnighausen T, Barregard L, Bedi N, Belay Ketema E, Bennett D, Berhe G, Bhutta Z, Bitew S, Carapetis J, Carrero JJ, Malta DC, Castañeda-Orjuela CA, Castillo-Rivas J, Catalá-López F, Choi JY, Christensen H, Cirillo M, Cooper L Jr, Criqui M, Cundiff D, Damasceno A, Dandona L, Dandona R, Davletov K, Dharmaratne S, Dorairaj P, Dubey M, Ehrenkranz R, El Sayed Zaki M, Faraon EJA, Esteghamati A, Farid T, Farvid M, Feigin V, Ding EL, Fowkes G, Gebrehiwot T, Gillum R, Gold A, Gona P, Gupta R, Habtewold TD, Hafezi-Nejad N, Hailu T, Hailu GB, Hankey G, Hassen HY, Abate KH, Havmoeller R, Hay SI, Horino M, Hotez PJ, Jacobsen K, James S, Javanbakht M, Jeemon P, John D, Jonas J, Kalkonde Y, Karimkhani C, Kasaeian A, Khader Y, Khan A, Khang YH, Khera S, Khoja AT, Khubchandani J, Kim D, Kolte D, Kosen S, Krohn KJ, Kumar GA, Kwan GF, Lal DK, Larsson A, Linn S, Lopez A, Lotufo PA, El Razek HMA, Malekzadeh R, Mazidi M, Meier T, Meles KG, Mensah G, Meretoja A, Mezgebe H, Miller T, Mirrakhimov E, Mohammed S, Moran AE, Musa KI, Narula J, Neal B, Ngalesoni F, Nguyen G, Obermeyer CM, Owolabi M, Patton G, Pedro J, Qato D, Qorbani M, Rahimi K, Rai RK, Rawaf S, Ribeiro A, Safiri S, Salomon JA, Santos I, Santric Milicevic M, Sartorius B, Schutte A, Sepanlou S, Shaikh MA, Shin MJ, Shishehbor M, Shore H, Silva DAS, Sobngwi E, Stranges S, Swaminathan S, Tabarés-Seisdedos R, Tadele Atnafu N, Tesfay F, Thakur JS, Thrift A, Topor-Madry R, Truelsen T, Tyrovolas S, Ukwaja KN, Uthman O, Vasankari T, Vlassov V, Vollset SE, Wakayo T, Watkins D, Weintraub R, Werdecker A, Westerman R, Wiysonge CS, Wolfe C, Workicho A, Xu G, Yano Y, Yip P, Yonemoto N, Younis M, Yu C, Vos T, Naghavi M, Murray C. Global, regional, and national burden of cardiovascular diseases for 10 causes, 1990 to 2015. J Am Coll Cardiol 70: 1–25, 2017. doi: 10.1016/j.jacc.2017.04.052. [DOI] [PMC free article] [PubMed] [Google Scholar]
- 36.Sangiuolo F, Novelli G, Murru S, Dallapiccola B. A serine-to-arginine (AGT-to-CGT) mutation in codon 549 of the CFTR gene in an Italian patient with severe cystic fibrosis. Genomics 9: 788–789, 1991. doi: 10.1016/0888-7543(91)90380-W. [DOI] [PubMed] [Google Scholar]
- 37.Seeling JM, Miller JR, Gil R, Moon RT, White R, Virshup DM. Regulation of beta-catenin signaling by the B56 subunit of protein phosphatase 2A. Science 283: 2089–2091, 1999. doi: 10.1126/science.283.5410.2089. [DOI] [PubMed] [Google Scholar]
- 38.Shukla AK, Violin JD, Whalen EJ, Gesty-Palmer D, Shenoy SK, Lefkowitz RJ. Distinct conformational changes in beta-arrestin report biased agonism at seven-transmembrane receptors. Proc Natl Acad Sci USA 105: 9988–9993, 2008. doi: 10.1073/pnas.0804246105. [DOI] [PMC free article] [PubMed] [Google Scholar]
- 39.Soni S, Scholten A, Vos MA, van Veen TA. Anchored protein kinase A signalling in cardiac cellular electrophysiology. J Cell Mol Med 18: 2135–2146, 2014. doi: 10.1111/jcmm.12365. [DOI] [PMC free article] [PubMed] [Google Scholar]
- 40.Stangherlin A, Zaccolo M. Phosphodiesterases and subcellular compartmentalized cAMP signaling in the cardiovascular system. Am J Physiol Heart Circ Physiol 302: H379–H390, 2012. doi: 10.1152/ajpheart.00766.2011. [DOI] [PubMed] [Google Scholar]
- 41.Suryavanshi SV, Jadhav SM, McConnell BK. Polymorphisms/mutations in A-kinase anchoring proteins (AKAPs): role in the cardiovascular system. J Cardiovasc Dev Dis 5: 7, 2018. doi: 10.3390/jcdd5010007. [DOI] [PMC free article] [PubMed] [Google Scholar]
- 42.Swerdlow DI, Humphries SE. Genetics of CHD in 2016: common and rare genetic variants and risk of CHD. Nat Rev Cardiol 14: 73–74, 2017. doi: 10.1038/nrcardio.2016.209. [DOI] [PubMed] [Google Scholar]
- 43.1000 Genomes Project Consortium; Auton A, Brooks LD, Durbin RM, Garrison EP, Kang HM, Korbel JO, Marchini JL, McCarthy S, McVean GA, Abecasis GR. A global reference for human genetic variation. Nature 526: 68–74, 2015. doi: 10.1038/nature15393. [DOI] [PMC free article] [PubMed] [Google Scholar]
- 44.van der Hagen EA, Tudpor K, Verkaart S, Lavrijsen M, van der Kemp A, van Zeeland F, Bindels RJ, Hoenderop JG. β1-Adrenergic receptor signaling activates the epithelial calcium channel, transient receptor potential vanilloid type 5 (TRPV5), via the protein kinase A pathway. J Biol Chem 289: 18489–18496, 2014. doi: 10.1074/jbc.M113.491274. [DOI] [PMC free article] [PubMed] [Google Scholar]
- 45.Welch EJ, Jones BW, Scott JD. Networking with AKAPs: context-dependent regulation of anchored enzymes. Mol Interv 10: 86–97, 2010. doi: 10.1124/mi.10.2.6. [DOI] [PMC free article] [PubMed] [Google Scholar]
- 46.Yue P, Melamud E, Moult J. SNPs3D: candidate gene and SNP selection for association studies. BMC Bioinformatics 7: 166, 2006. doi: 10.1186/1471-2105-7-166. [DOI] [PMC free article] [PubMed] [Google Scholar]