Abstract
Blocking the renin-angiotensin-aldosterone system (RAAS) remains a mainstay of therapy in hypertension and glomerular diseases. With the population aging, our understanding of renin-producing cells in kidneys with advanced age is more critical than ever. Accordingly, we administered tamoxifen to Ren1cCreERxRs-tdTomato-R mice to permanently fate map cells of renin lineage (CoRL). The number of Td-tomato-labeled CoRL decreased significantly in aged mice (24 mo of age) compared with young mice (3.5 mo of age), as did renin mRNA levels. To determine whether aged CoRL responded less to RAAS blockade, enalapril and losartan were administered over 25 days following uninephrectomy in young and aged mice. The number of CoRL increased in young mice in response to enalapril and losartan. However, this was significantly lower in aged mice compared with young mice due to limited proliferation, but not recruitment. Gene expression analysis of laser-captured CoRL showed a substantial increase in mRNA levels for proapoptotic and prosenescence genes, and an increase in a major prosenescence protein on immunostaining. These results show that CoRL are lower in aged mice and do not respond to RAAS inhibition to the same extent as young mice.
Keywords: apoptosis, glomerulus, juxta-glomerulus, proliferation, senescence
INTRODUCTION
Cells of renin lineage (CoRL), normally located in afferent arterioles of the juxta-glomerular compartment (JGC) (22, 38), are the major source of the body’s renin (2, 20, 21). Renin is the enzyme at the apex of the renin-angiotensin-aldosterone system (RAAS) (21), which has many critical biological functions under normal conditions, including blood pressure control, regulation of glomerular efferent arteriole tone, and tubular salt handling (42). In healthy young humans, rats, and mice, CoRL respond to cues such as reduced blood pressure, salt restriction (7, 30, 49), and intravascular volume depletion (29, 37) by increasing renin levels (41). Feedback loops secondary to lowering RAAS with angiotensin-converting enzyme (ACE) inhibitors and angiotensin receptor blockers increase renin production by CoRL in healthy, young humans and rodents. Patients of all ages with proteinuric glomerular diseases are typically administered RAAS inhibitors to lower proteinuria, an effect considered to be independent of their effects on blood pressure lowering, and likely also due to direct pleotropic effects on certain intrinsic glomerular cell types. We have shown that CoRL proliferate in response to RAAS inhibition (24). We chose doses of RAAS-inhibiting drugs that did not lower blood pressure to recapitulate clinical practices, where such agents are used to lower proteinuria independent of blood pressure effects.
Populations in the United States and other countries are living longer. Studies show several predictable age-associated changes to the kidney (15, 36), and aged kidneys are more vulnerable to injury than younger kidneys (9, 10, 20, 40). Although our understanding of the pathology and cellular changes in certain cells in the aging kidney are being better understood (14, 35, 39), the impact of age on the kidney’s renin-mediated RAAS endocrine system and the effects of commonly used medications on renin-producing cells with advancing age have not advanced much over the past two decades. Studies have described healthy aging as a hyporeninemic state, based on lower plasma renin activity in humans (1, 7, 25, 26, 28–30, 37, 45–49) and rats (5, 6, 13, 17, 23), reduced renin content in kidneys (5, 6, 13), and reduced responsiveness to certain stimuli known to increase renin (5, 7, 27, 29, 30, 37, 49). Although we recently reported that the number of cells of renin lineage was lower in middle-aged mice compared with a younger cohort (32), the majority of pioneering renin studies in aged kidneys were performed in the 1980s and 1990s when molecular and cellular biology methodologies were immature compared with today. Moreover, the mechanisms underlying these events are not well defined. Accordingly, the purposes of the current studies were to map the fate of a specific cohort of CoRL over the lifespan of mice, examine the responsiveness of CoRL to RAAS inhibition in aged kidneys, and to identify candidate mechanisms for changes in CoRL with advanced age.
METHODS
Animals and experimental design.
Only female Ren1cCreERxRs-tdTomato-R mice were used in this study to exclude sex differences. All mice were given tamoxifen (Sigma-Aldrich, St. Louis, MO) dissolved in vehicle corn oil (Sigma-Aldrich) at 100 mg/kg body wt ip injection 4 times, on alternate days, beginning at 8 wk of age to permanently label CoRL. Because of changes in kidney size with advancing age, and to measure changes in each mouse using their own “starting” tissue for comparison, each mouse underwent a survival uninephrectomy following a tamoxifen washout period of at least 4 wk in all animals. The uninephrectomy was performed at 3.5 mo in young mice and at 24 mo in aged mice. The removed kidney served as day 0 (D0) tissue for each individual mouse. After a 2-wk recovery from surgery, young mice were randomly separated into the following groups: group 1 (n = 4) received drinking water (the vehicle for hydralazine, enalapril, and losartan), group 2 (n = 6) received hydralazine (Sigma-Aldrich) (300 mg/l), group 3 (n = 6) received the ACE inhibitor enalapril (Sigma-Aldrich) (75 mg/l); and group 4 (n = 5) received the ARB losartan (Sigma-Aldrich) (100 mg/l). Aged mice were randomly separated into following groups: group 5 (n = 6) received drinking water; group 6 (n = 4) received hydralazine; group 7 (n = 6) received enalapril; and group 8 (n = 7) received losartan. These doses of RAAS-inhibiting drugs did not significantly alter blood pressure in these mice, to distinguish the direct effects of RAAS inhibiting drugs on cells of renin lineage. All mice were euthanized 25 days after the initiation of drug treatment, and the euthanized kidney served as day 25 (D25) tissue. Mice were bred and housed in the animal care facility at the University of Washington under specific pathogen-free conditions and provided ad libitum food and water. All studies were reviewed and approved by the University of Washington Institutional Animal Care and Use Committee protocol (2968-04).
Blood pressure measurement.
Blood pressures were measured with the use of the CODA 6 noninvasive tail-cuff system (Kent Scientific, Torrington, CT) on conscious and restrained mice, as previously described (12, 31). Measurements were taken in the mornings, before uninephrectomy, and at day 0, 7, 14, and 25 after drug treatment. At least 10 blood pressure readings were taken per mouse at each time point to determine the average for each individual, and these were used to calculate the average blood pressure per study cohort.
BrdU labeling of mice to assess proliferation.
To assess proliferation, 5 mg/ml 5-bromo-2-deoxyuridine (BrdU; Sigma-Aldrich) was administered to all animals via intraperitoneal injection at 10 µl/g body wt at the following times: twice, 48 h apart, the day before initial uninephrectomy, and twice, a week beginning the initial day of drug administration.
Immunofluorescence.
Mice were perfused with cold PBS, and kidneys were fixed with 10% neutral buffered formalin (Globe Scientific, Paramus, NJ) overnight at 4°C, dehydrated, and embedded in paraffin. The 4-µm-thick sections were deparaffinized and rehydrated. For renin or BrdU staining, antigen retrieval was performed by microwave heating in 1 mM EDTA, pH 8.0 or in 10 mM citric acid buffer, pH 6.0 for 10 min. Endogenous biotin activity and nonspecific binding were blocked using an avidin/biotin blocking kit (Vector Laboratories, Burlingame, CA) and Background Buster (Accurate Chemical and Scientific, Westbury, NY). For immunofluorescent staining of renin, a biotinylated sheep anti-renin antibody (1:200; Innovative Research, Novi, MI) was incubated overnight at 4°C, followed by streptavidin-conjugated Alexa Fluor 488 (1:200; Invitrogen, Grand Island, NY) for 30 min at room temperature. Antibodies were diluted in 1% IgG-free BSA (Sigma-Aldrich) in PBS. For immunofluorescent staining of BrdU, sections were incubated with Rodent Block M (Biocare Medical, Concord, CA) for 30 min at room temperature, followed by a mouse anti-BrdU antibody (1:200; GE Healthcare Life Sciences, Little Chalfont, UK) overnight at 4°C, a biotinylated horse anti-mouse antibody (1:500; Vector Laboratories, Burlingame, CA) for 30 min at room temperature, and streptavidin-conjugated Alexa Fluor 488 (1:200; Invitrogen, Grand Island, NY) for 30 min at room temperature. For double staining with the tdTomato reporter, DyLight 594 conjugated rabbit anti-red fluorescent protein (RFP) antibody (1:100; Rockland Immunochemicals for Research, Gilbertsville, PA) was incubated for 1 h at room temperature. The samples were mounted in Vectashield mounting medium with DAPI (Vector Laboratories).
Immunohistochemistry.
The 4-µm-thick sections were deparaffinized and rehydrated. Antigen retrieval was performed by microwave heating in 1 mM EDTA, pH 6.0 for 10 min. Endogenous peroxidase activity and nonspecific binding were blocked using 3% hydrogen peroxide and Background Buster (Accurate Chemical and Scientific). For staining of renin, a biotinylated sheep anti-renin antibody (1:200; Innovative Research) was incubated overnight at 4°C, followed by Vectastain ABC reagent (Vector Laboratories) for 30 min at room temperature. For staining of p16INK4a, sections were incubated with a rabbit anti-p16INK4a antibody (1:800; Lifespan Biosciences, Seattle, WA) overnight at 4°C, followed by an ImmPRESS Reagent anti-rabbit Ig (Vector Laboratories) for 1 h at room temperature. Staining was detected using diaminobenzidine (DAB; Thermo Fisher Scientific, Waltham, MA). Counterstaining was performed with hematoxylin (Sigma-Aldrich). Slides were dehydrated and mounted with Histomount (National Diagnostics, Atlanta, GA).
Quantification of CoRL tdTomato reporter and renin.
Double staining for renin and the CoRL reporter RFP was performed, and the number of renin-positive cells, RFP-positive cells, and renin+RFP+ double-positive cells, and positive for renin but not for RFP (renin+RFP−) cells in kidney cortex was counted. Lower-magnification imaging (×200) and quantification were performed using an EVOS FL Cell Imaging System (Life Technologies, Grand Island, NY) with ×20 objective (0.5 NA), and EVOS LED Light Cube GFP (AMEP4651), DAPI (AMEP4650), and Invitrogen Texas Red (AMEP4655). Kidney cortex was imaged, and the number of DAPI-positive cells in the kidney cortex was analyzed using ImageJ 1.46r software (National Institutes of Health), as previously described (24). Data were expressed as a percentage of renin-positive cells, RFP-positive cells, renin+RFP+ double-positive cells, and positive for renin but not for RFP (renin+RFP−) cells in kidney cortical area. Representative high-magnification images were taken using a Leica TCS SPE II laser scanning confocal microscope (Solms, Germany) with ×40 (1.3 NA) oil objective.
Quantification of BrdU.
Double staining for BrdU and the CoRL reporter RFP was performed, and the number of BrdU-positive cells in kidney cortex was counted. Data were expressed as a percentage of BrdU-positive cells in the kidney cortical area.
Quantitative real-time PCR for renin in kidney cortex.
Total RNA from kidney cortex was extracted using RNeasy mini kit (Qiagen, Germantown, MD), as described previously (24). On-column DNase digestion was performed using RNase Free DNase Set (Qiagen). Complementary DNA was synthesized using high-capacity RNA-to-cDNA kit (Applied Biosystems, Foster City, CA). Quantitative real-time PCR was performed using iTaq SYBR Green Supermix with ROX (Bio-Rad, Hercules, CA) and QuantStudio 6 Flex real-time PCR System (Applied Biosystems). Corresponding primers were shown as follows: Ren1 forward: AGAAGGCATTTTCTTGAGCG, Ren1 reverse: CTCTGGGCACTCTTGTTGCT, 18S forward: TAGAGGGACAAGTGGCGTTC, and 18S reverse: CGCTGAGCCAGTCAGTGT. Relative mRNA expression levels were normalized to 18S ribosomal RNA.
Processing kidney sections for laser capture microdissection.
Frozen tissue blocks were transferred on dry ice to the cryostat (Leica Microsystems, Wetzlar, Germany) that was preset to –20°C and allowed to equilibrate for at least 5 min before cutting. Five-micrometer sections were cut and mounted on RNase-free PEN-membrane slides (Leica) for use with the Leica instrument. RFP fluorescence was used to visualize the cells of renin lineage with a fluorescence microscope. After sections were mounted, the slides were dehydrated in the following solutions for 30 s each: 75% ethanol, 95% ethanol, and 2 × 100% ethanol. After dehydrating, all sample slides were dipped in xylene to remove residual ethanol and then incubated in an additional clean xylene solution for 5 min. All solutions were freshly prepared in RNase-free slide dishes (Tissue-Tek) with 200 ml of each solution. Tissue sections were microdissected using a Leica laser microdissection system LMD6500 & LMD7000 (Leica Microsystems, Buffalo Grove, IL) fitted with cap in which a transparent thermoplastic film (ethylene vinyl acetate polymer) was bonded to the underside. The caps containing the captured tissues were placed into a 500-µl microcentrifuge tube for molecular processing. Multiple JGC areas from 10 different samples of aged mice and young mice were individually microdissected and collected for a future RNA work.
RNA isolation from laser capture microdissection tissue and cDNA preparation.
RNA was extracted directly after dissection tissue using the RNeasy Micro (Qiagen), according to their specific protocol for extraction of genomic RNA from laser capture microdissection tissues. For each sample, 1 μg of total RNA was reverse transcribed and preamplified using the RT2 PreAMP cDNA synthesis kit (Qiagen). First-strand cDNA synthesis was performed at 42°C for 30 min followed by a termination step at 95°C for 5 min. During the amplification step, the RT2 PreAMP Pathway Primer Mix enables amplification of cDNA specific for the genes targeted by the RT2 Profiler PCR array. Each RT2 PreAMP pathway primer mix is specific for one RT2 Profiler PCR array. Following preamplification, the side reaction reducer eliminates residual primers.
qRT-PCR data analysis.
A mouse aging RT2 profiler PCR array profiles the expression of 84 genes altered during aging (Qiagen, see cat. no. PAMM-178Z). PCR was performed on 7900HT PCR system (Applied Biosystems), according to the manufacturerʼs instructions.
Statistical analyses.
Data were expressed as means ± SD. One-way ANOVA with Tukeyʼs multiple-comparisons test was applied for multiple comparisons and Studentʼs t-test was applied for comparisons between two groups using GraphPad Prism (version 7.0; GraphPad Software, La Jolla, CA). A P value <0.05 was considered significant.
RESULTS
Blood pressure does not change with advanced age or following RAAS inhibition in Ren1cCreERxRs-tdTomato-R mice.
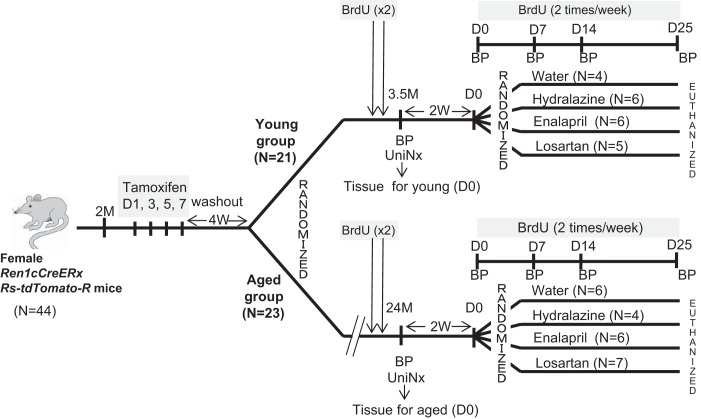
To investigate changes in renin expression and CoRL proliferation in young and aged mice, inducible Ren1cCreERxRs-tdTomato-R mice were generated as described previously (34) and subjected to uninephrectomy. The experimental design is shown in Fig. 1. Prior to uninephrectomy, there were no differences in mean blood pressure between young mice (3.5 mo of age) (97.2 ± 18.6 mmHg) and aged mice (24 mo of age) (92.5 ± 25.9 mmHg) (Fig. 2A). Next, young and aged mice underwent uninephrectomy, and the removed kidney was preserved as D0 tissue for each individual mouse. Two weeks following uninephrectomy, there was no change in mean blood pressure between young mice (99.3 ± 20.0 mmHg) and aged mice (97.3 ± 19.9 mmHg). Randomized mice received the vehicle water (Fig. 2B), hydralazine (Fig. 2C), enalapril (Fig. 2D), or losartan (Fig. 2E) at concentrations that were not intended to lower blood pressure. Blood pressure did not change significantly in the four groups over the treatment period when measured repeatedly at days 7, 14, and 25, and there were no differences between young and aged mice (Fig. 2, B–E). Taken together, the results described below must be interpreted within the context of not lowering the mean blood pressure.
Fig. 1.
Schema of experimental design. Two-month-old female Ren1cCreERxRS-tdTomato-R mice were given tamoxifen to permanently label cells of renin lineage with tdTomato for cell fate mapping. Following a 4-wk washout period, mice were randomized into two groups for study: a young group (n = 21) and an aged group (n = 23). In the young group, 3.5-mo-old mice underwent a uninephrectomy (UniNx), and the removed kidney was used as day 0 (D0) tissue in individual young mice. Mice were randomized following a 2-wk recovery period to receive water (n = 4), hydralazine (n = 6), enalapril (n = 6), or losartan (n = 5). Mice randomized to the aged group underwent uninephrectomy (UniNx) at age 24 m. The removed kidney was used as D0 tissue in individual aged mice. Two weeks later, aged mice were randomized to different treatment groups: water (n = 6), hydralazine (n = 4), enalapril (n = 6), or losartan (n = 7). 5-Bromo-2-deoxyuridine (BrdU) was given to all mice to measure proliferation, and blood pressure (BP) was measured at times shown.
Fig. 2.
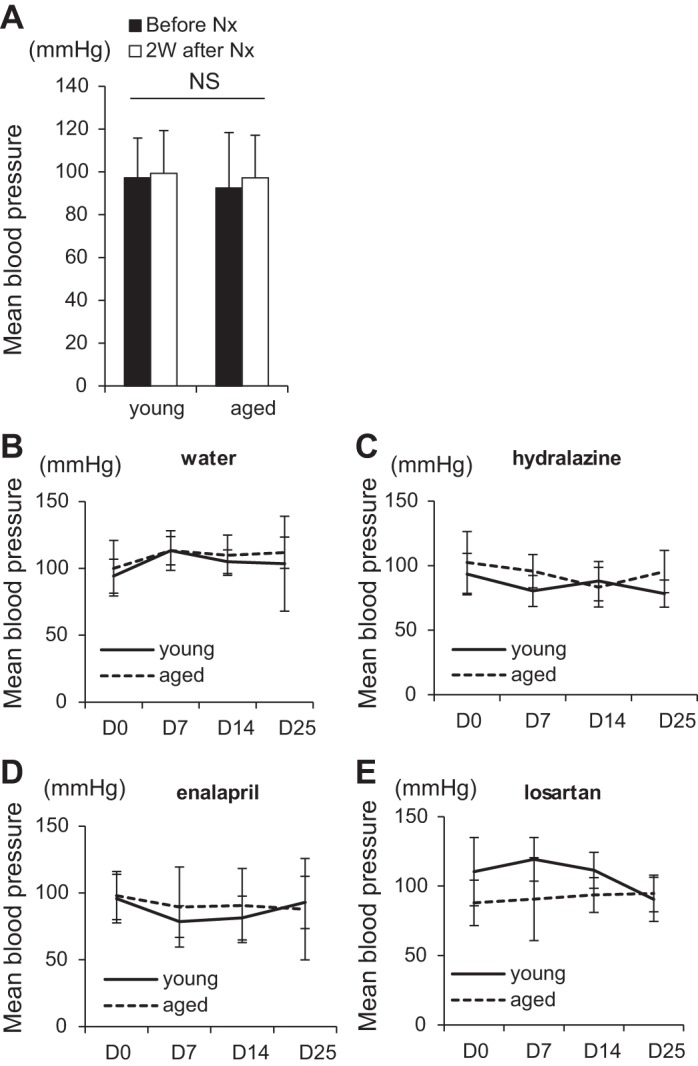
Mean blood pressures. A: mean blood pressure was similar in young (n = 21) and aged mice (n = 23) preuninephrectomy (solid bar) and postuninephrectomy (Nx) (open bar). Mean blood pressures were not different between young (solid line) and aged (dashed line) mice given water (n = 4 in young, n = 6 in aged) (B), hydralazine (n = 6 in young, n = 4 in aged) (C), enalapril (n = 6 in young, n = 6 in aged) (D), and losartan (n = 5 in young, n = 7 in aged) (E).
Permanently labeled cells of renin lineage are reduced in aged mice.
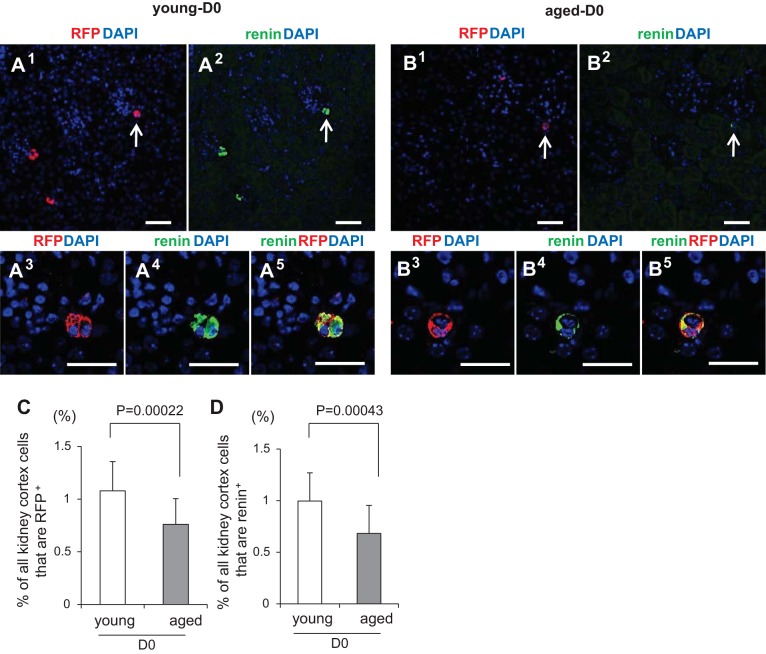
To permanently label CoRL, tamoxifen was given at the same time to all 44 of the 2-mo-old mice enrolled in the study, before their randomization into young and aged groups (Fig. 3). After a 4-wk tamoxifen washout period, 93.8% ± 3.27% of renin+ cells in the JGC coexpressed RFP in Ren1cCreERxRs-tdTomato-R mice, similar to our previous report (24). Kidney tissue obtained by uninephrectomy from young and aged mice was used as D0 tissue for quantification. All kidney cortical cells in the section were measured at D0 using DAPI nuclear staining and were stained for both RFP and renin, which colocalized near the glomerular tuft (Fig. 3, A and B). The percentage of RFP+ cells was significantly lower in aged mice (0.76% ± 0.24% vs. 1.08% ± 0.28%, P = 0.00022 vs. young) (Fig. 3C). Similarly, the percentage of renin+ cells was lower in aged mice (0.68% ± 0.27% vs. 1.00% ± 0.27%, P = 0.00043 vs. young) (Fig. 3D). No RFP+ or renin+ cells were detected inside the glomeruli at D0 (data not shown). Thus, lineage tracing methods showed that the percentage of renin+ cells decreased significantly between mice at 3 and 24 mo of age.
Fig. 3.
Red fluorescent protein+ (RFP+) and renin+ cells at D0. Representative images of double staining for RFP (red), renin (green), merged channels (yellow), as well as DAPI staining (blue) was performed in young (A) and aged (B) mice. Arrows in the lower magnification images (A, 1–2, B, 1–2) indicate the juxtaglomerular (JG) location in the high-magnification images (A, 3–5, B, 3–5). Scale bars represent 50 μm. C: graph of the percentage of RFP+ cells in young (n = 21, open bar) and aged (n = 23, solid bar) mice at D0. D: graph of the percentage of renin+ cells in young (n = 21, open bar) and aged (n = 23, solid bar) mice at D0.
To confirm that CoRL were only labeled following tamoxifen treatment and that RAAS inhibition alone did not RFP label CoRL by activating cre independent of tamoxifen, a separately housed group of mice were given corn oil (vehicle) without tamoxifen, on the same experimental schedule as those given tamoxifen. A 4-wk washout was followed by hydralazine, enalapril, and losartan treatment for 25 days. RFP expression was never detected under these conditions (data not shown). This was not a false negative, because renin staining was detected at expected levels in each experimental group. These results suggest that any cre leakage induced by RAAS inhibition therapies was highly unlikely in these mice.
The increase in labeled CoRL following RAAS inhibition is lower in aged mice.
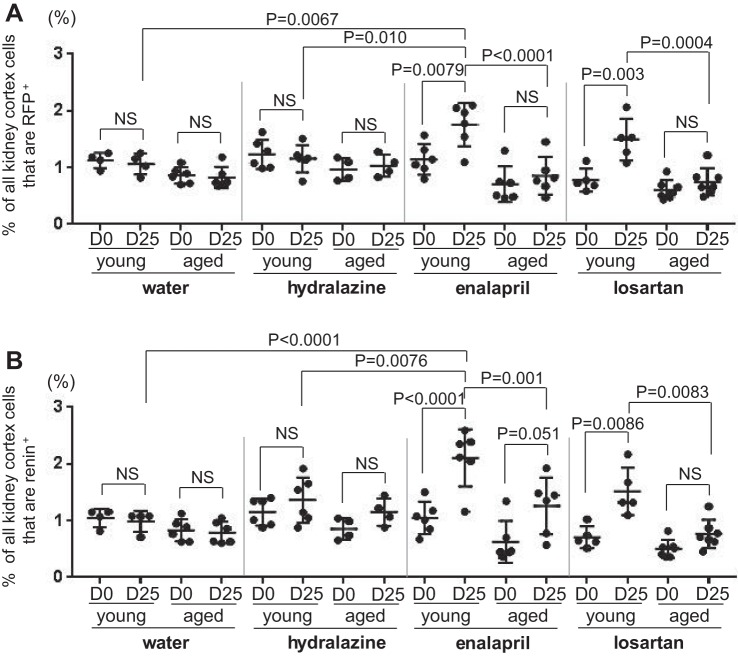
Because each mouse had a uninephrectomy that served as pretreatment (D0), changes in each individual mouse could be calculated following a 25-day treatment period (Fig. 1). In young mice, enalapril significantly increased the percentage of RFP+ cells from 1.14% ± 0.27% at D0 to 1.75% ± 0.38% at D25 (P = 0.0079) (Fig. 4A). In aged mice, the mean only increased from 0.71% ± 0.32% at D0 to 0.85% ± 0.33% at D25 following enalapril administration and was not statistically significant.
Fig. 4.
RFP+ and renin+ cells at D0 and D25. A: graph of the percentage of RFP+ cells for individual young and aged mice at D0 and D25 in water (n = 4 in young, n = 6 in aged), hydralazine (n = 6 in young, n = 4 in aged), enalapril (n = 6 in young, n = 6 in aged), and losartan (n = 5 in young, n = 7 in aged) treatment groups. B: graph of the percentage of renin+ cells for individual young and mice at D0 and D25 in water (n = 4 in young, n = 6 in aged), hydralazine (n = 6 in young, n = 4 in aged), enalapril (n = 6 in young, n = 6 in aged), and losartan (n = 5 in young, n = 7 in aged) treatment group. NS indicates not significant.
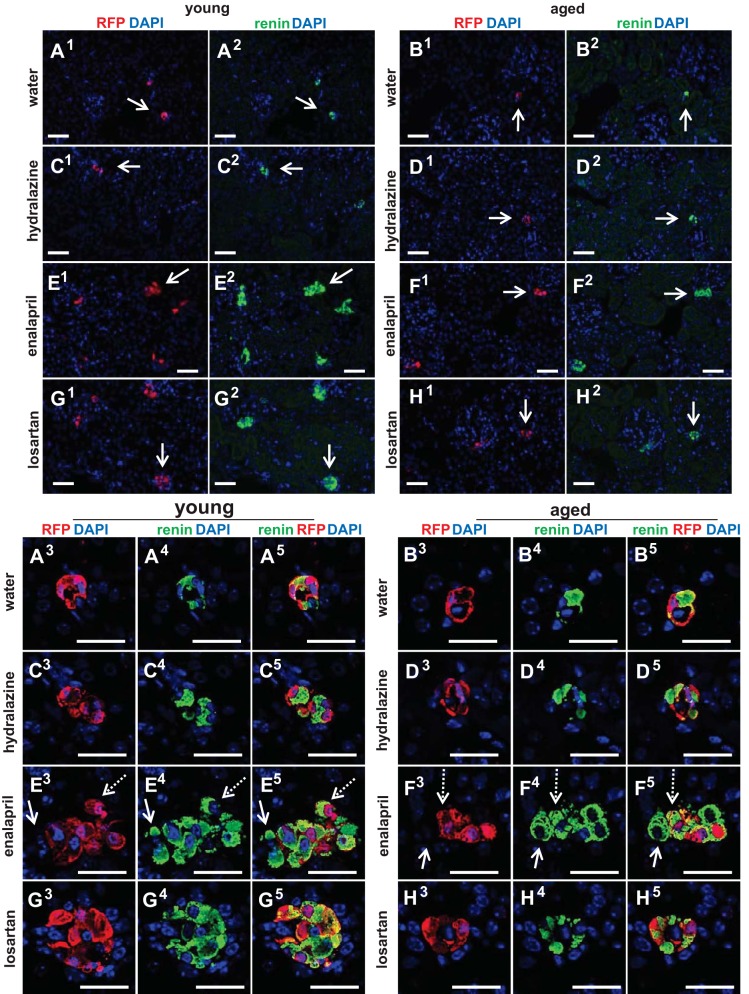
In young mice, losartan also significantly increased the percentage of RFP+ cells from 0.78% ± 0.20% at D0 to 1.49% ± 0.37% at D25 (P = 0.003). In aged mice, the mean only increased from 0.61% ± 0.17% at D0 to 0.75% ± 0.24% at D25 following losartan and was not statistically significant. As expected, administering water (vehicle) for 25 days had little impact on the mean percentage of RFP+ cells in both young mice (1.13% ± 0.13% at D0 to 1.06% ± 0.19% at D25) and aged mice (0.86% ± 0.14% at D0 to 0.82% ± 0.19% at D25). Similarly, administering hydralazine had no short-term impact on the percentage of RFP+ cells in both young (1.23% ± 0.26% at D0 to 1.16% ± 0.24% at D25) and aged mice (0.96% ± 0.20% at D0 to 1.03% ± 0.20% at D25). Representative images of RFP+ cells in young and aged mice following 25 days of treatment are shown in Fig. 5, A–H, 1 and 3. Taken together, these results showed that the increase in the percentage of reporter-labeled cells of renin lineage in young mice upon RAAS inhibition with either enalapril or losartan was significantly blunted in aged mice.
Fig. 5.
Representative images of staining for RFP+ and renin+ cells at D25. A–H: representative lower-magnification images for RFP (red) (A–H, 1) and renin (green) (A–H, 2) and high-magnification images for RFP (red) (A–H, 3), renin (green) (A–H, 4) and merged channels (yellow) (A–H, 5), as well as DAPI (blue) staining in young and aged mice with each treatment. Arrows in the lower magnification images (A–H, 1 and 2) indicate the JG location in the high-magnification images (A–H, 3–5). In young and aged mice given enalapril (E and F, 3–5), the majority of renin cells merged with RFP (example indicated by dashed arrows). However, some renin+RFP− cells (green only) (example indicated by solid arrow) were recruited from other sources. Scale bars = 50 μm.
Renin-expressing cells are lower in aged mice and have blunted response to RAAS inhibition.
Next, to determine the effects of RAAS inhibition on the number of renin-producing cells, we stained for renin, and then determined the percentage of all kidney cortex cells expressing renin by dividing by DAPI nuclear staining. In young mice, enalapril significantly increased the percentage of renin+ cells from 1.05% ± 0.28% at D0 to 2.11% ± 0.50% at D25 (P < 0.0001) (Fig. 4B). In aged mice, enalapril tended to increase the mean percentage of renin+ cells from 0.63% ± 0.37% at D0 to 1.26% ± 0.50% at D25 (P = 0.051).
In young mice, losartan also significantly increased the percentage of renin+ cells from 0.71 ± 0.19% at D0 to 1.52% ± 0.42% at D25 (P = 0.0086). In aged mice, the mean only increased from 0.50% ± 0.16% at D0 to 0.76% ± 0.25% at D25 following losartan administration and was not statistically significant. Administering water for 25 days had no impact on the mean percentage of cells expressing renin in both young mice (1.05% ± 0.16% at D0 to 0.99% ± 0.19% at D25) and aged mice (0.83% ± 0.20% at D0 to 0.79% ± 0.19% at D25). Hydralazine had minimal effect on the percentage of renin+ cells from 1.15% ± 0.23% at D0 to 1.36% ± 0.40% at D25 in young mice and 0.85% ± 0.19% at D0 to 1.15% ± 0.24% at D25 in aged mice, which did not reach significance. Representative images of renin+ cells in young and aged mice following 25 days of treatment are shown in Fig. 5, A–H, 2 and 4. In conclusion, RAAS inhibition stimulated the percentage of cells expressing renin more acutely in young mice, compared with aged mice.
Proliferation of CoRL was lower in aged mice following RAAS inhibition.
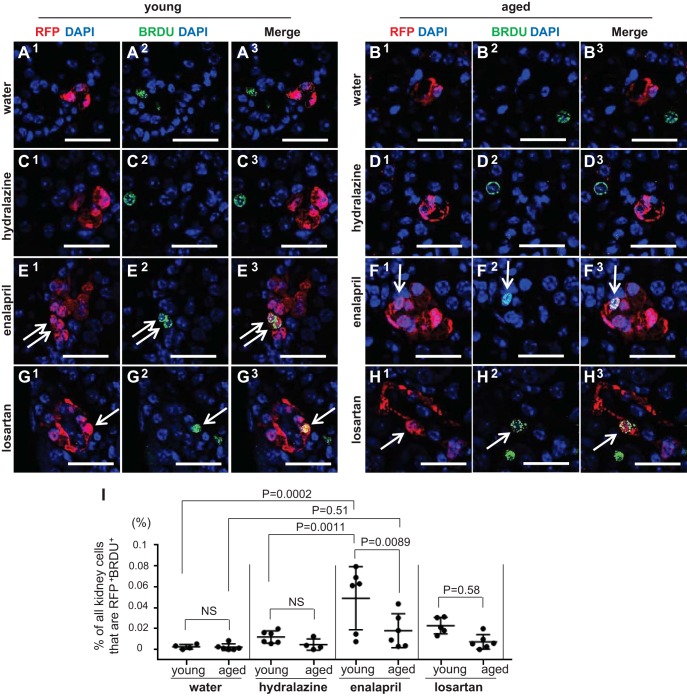
Having shown that both RFP-labeled CoRL and renin-expressing cells were lower in aged mice and that their response to RAAS inhibition was lower in aged mice compared with young mice, we took advantage of the inducible CoRL labeling methodology to tease out whether these changes were due to altered proliferation of existing cells (Fig. 6), and/or recruitment of renin cells (Fig. 7C) from vascular cells, as previously described (41).
Fig. 6.
Proliferation in labeled cells of renin lineage (CoRL). BrdU was administered twice weekly to measure cumulative proliferation. Double staining for BrdU (green) and RFP (red) was performed to measure the percentage of proliferating labeled CoRL (yellow from merge of colors). A–H: representative pictures of staining for BrdU, RFP, and DAPI in young and aged mice following 25 days of treatment. I: graph shows data for individual mice at D25 in water (n = 4 in young, n = 6 in aged), hydralazine (n = 6 in young, n = 4 in aged), enalapril (n = 6 in young, n = 6 in aged), and losartan (n = 5 in young, n = 7 in aged) treatment group. Scale bars = 50 μm.
Fig. 7.
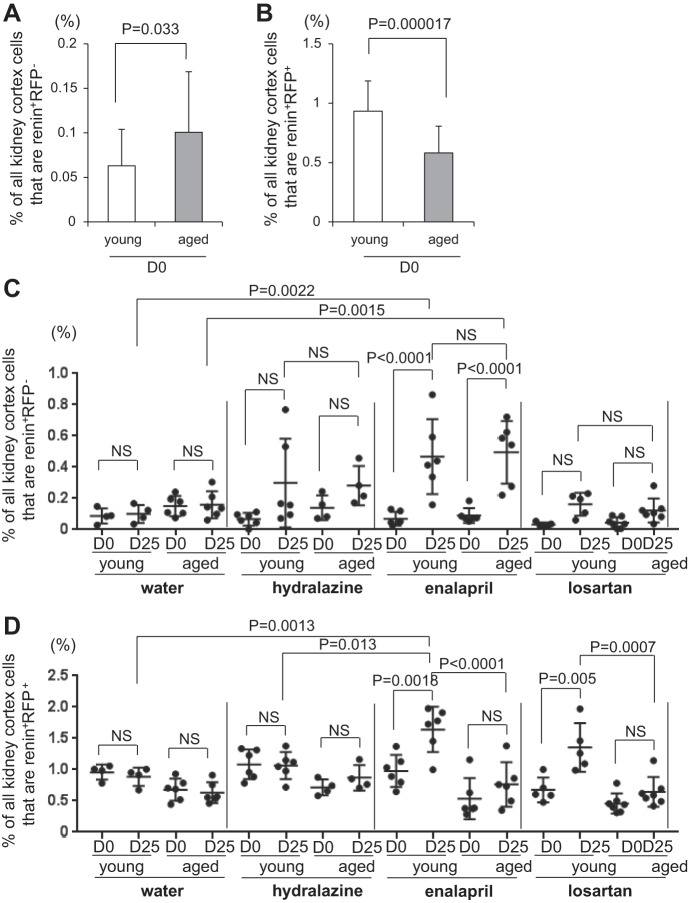
Recruitment and proliferation of CoRL. A: graph of the percentage of renin+ RFP− cells in young (n = 21, open bar) and aged (n = 23, solid bar) mice at D0. B: graph of the percentage of renin+ RFP+ cells in young (n = 21, open bar) and aged (n = 23, solid bar) mice at D0. C: graph of the percentage of renin+ RFP− cells for individual young and aged mice at D0 and D25 in water (n = 4 in young, n = 6 in aged), hydralazine (n = 6 in young, n = 4 in aged), enalapril (n = 6 in young, n = 6 in aged) and losartan (n = 5 in young, n = 7 in aged) treatment group. D: graph of the percentage of renin+ RFP+ cells for individual young and mice at D0 and D25 in water (n = 4 in young, n = 6 in aged), hydralazine (n = 6 in young, n = 4 in aged), enalapril (n = 6 in young, n = 6 in aged) and losartan (n = 5 in young, n = 7 in aged) treatment group.
To measure proliferation, BrdU was administered twice before uninephrectomy and twice weekly throughout the treatment period (Fig. 1). Representative images of RFP+BrdU+ cells in young and aged mice following 25 days of treatment are shown in Fig. 6, A–H. The percentage of RFP+ cells in the JGC that costained for BrdU was quantitated (Fig. 6I). As expected, the percentage of RFP+BrdU+ cells was very low after administering both water (0.0025% ± 0.0023% young mice vs. 0.0022% ± 0.0032% aged mice) and hydralazine (0.012% ± 0.0059% young mice vs. 0.0047% ± 0.0055% aged mice) for 25 days. Enalapril significantly increased the percentage of RFP+BrdU+ cells in the JGC in young mice (0.049% ± 0.030% enalapril vs. 0.0025% ± 0.0023% water, P = 0.0002), but not in aged mice (0.018% ± 0.016% enalapril vs. 0.0022% ± 0.0032% water, P = 0.51). Losartan did not increase the percentage of RFP+BrdU+ cells in either young or aged mice (0.023% ± 0.0079% young mice vs. 0.0073% ± 0.0070% aged mice). These results show that the increase in RFP+BrdU+ cells induced by enalapril in young mice was significantly blunted in aged mice.
Recruitment of renin-expressing cells following RAAS inhibition was similar in young and aged mice.
Results described earlier showed that the number of renin-expressing cells increased in response to RAAS inhibition in both young and aged mice, albeit the rate of increase was lower in aged animals. A major advantage of an inducible lineage tracing methodology with 93.8% labeling efficiency is that double staining for renin and RFP can be performed (Fig. 5, A–H), and together with RFP+BrdU+ results, we can calculate the relative contributions of each of the two mechanisms whereby renin cells increase. Thus, cells that stained positive for renin but not for RFP (renin+RFP−) marked the population that derived from recruitment (example indicated by solid arrow in Fig. 5, E and F, 3–5), whereas the population that derived from the proliferation of existing labeled CoRL cohort stained for both renin and RFP (renin+RFP+) (example indicated by dashed arrow in Fig. 5, E–F, 3–5). At D0, the percentage of renin+RFP− cells was a little higher in aged mice (0.10% ± 0.068% vs. 0.063% ± 0.041%, P = 0.033 vs. young) (Fig. 7A), and the percentage of renin+RFP+ cells was lower in aged mice (0.58% ± 0.23% vs. 0.93% ± 0.26%, P = 0.000017 vs. young) (Fig. 7B), similar to the percentage of renin+ (Fig. 3D) and RFP+ cells (Fig. 3C). Surprisingly, recruitment of renin-expressing cells (renin+RFP− cells) was similar between young and aged mice receiving enalapril, and the trend was also observed in mice receiving losartan and hydralazine (Fig. 7C), although not statistically significant. As for proliferation, enalapril and losartan stimulated the increase in the percentage of renin+RFP+ cells more acutely in young mice, compared with aged mice (Fig. 7D), as similar to the percentage of renin+ (Fig. 4B) and RFP+ cells (Fig. 4A). Taken together, when young and aged mice are given either enalapril or losartan, differences in the number of renin-expressing cells are more likely due to lower proliferation rates in aged mice, with similar rates of recruitment in young and aged mice.
Changes in apoptosis and senescent genes in CoRL with advanced age.
The decrease in td-tomato-labeled CoRL with age suggested a loss of these cells over time. To address the mechanisms underlying this loss, laser capture microscopy was performed to isolate the juxta-glomerular compartments containing td-tomato-labeled CoRL from young and aged mice and an aging profiler PCR array, including 84 genes was performed (Table 1). mRNA levels for Programmed Cell Death 6 (Pdcd6), a gene active in apoptosis, increased 24.4- fold in aged mice compared with young mice.
Table 1.
Aging profiler PCR array
| Gene | Fold Change vs. Young | Gene | Gene | |||
|---|---|---|---|---|---|---|
| Lmna | 38.9 ± 19.5 | (P = 0.034 vs. young) | C1s | ND | Panx1 | ND |
| Ndufb11 | 28.1 ± 8.80 | (P = 0.010 vs. young) | C3ar1 | ND | Phf3 | ND |
| Pdcd6 | 24.4 ± 6.85 | (P = 0.0072 vs. young) | C4b | ND | Polrmt | ND |
| Pot1a | 19.5 ± 10.6 | (P = 0.042 vs. young) | Casp1 | ND | Rap1a | ND |
| Lmnb2 | 19.1 ± 8.44 | (P = 0.0427 vs. young) | Cd14 | ND | Rnf144b | ND |
| Calb1 | 14.6 ± 10.9 | (P = 0.095 vs. young) | Cdkn1c | ND | S100a8 | ND |
| Txnip | 10.6 ± 4.65 | (P = 0.023 vs. young) | Cfh | ND | S100a9 | ND |
| Fbxl16 | 5.84 ± 4.84 | (P = 0.16 vs. young) | Cfhr1 | ND | Scn2b | ND |
| Arl6ip6 | 2.64 ± 2.18 | (P = 0.26 vs. young) | Clu | ND | Sirt1 | ND |
| Gfap | 2.40 ± 0.46 | (P = 0.10 vs. young) | Cx3cl1 | ND | Sirt3 | ND |
| Zfp9 | 2.16 ± 0.61 | (P = 0.040 vs. young) | Cxcl16 | ND | Sirt6 | ND |
| Elavl1 | 2.07 ± 1.17 | (P = 0.19 vs. young) | Elp3 | ND | Smad2 | ND |
| C4a | 1.81 ± 0.90 | (P = 0.19 vs. young) | Eml1 | ND | Snap23 | ND |
| Zbtb10 | 1.71 ± 0.53 | (P = 0.11 vs. young) | Ep300 | ND | Terf1 | ND |
| Angel2 | 1.70 ± 0.54 | (P = 0.095 vs. young) | Fcer1g | ND | Tfam | ND |
| Bub1b | 1.70 ± 0.53 | (P = 0.086 vs. young) | Fcgbp | ND | Tfb1m | ND |
| C1qc | 1.69 ± 1.03 | (P = 0.36 vs. young) | Fcgr1 | ND | Tfb2m | ND |
| Vps13c | 1.68 ± 1.35 | (P = 0.49 vs. young) | Fcgr2b | ND | Tinf2 | ND |
| Anxa3 | 1.67 ± 0.38 | (P = 0.039 vs. young) | Fcgr3 | ND | Tlr2 | ND |
| C1qa | 1.60 ± 0.10 | (P = 0.030 vs. young) | Foxo1 | ND | Tlr4 | ND |
| C3 | 1.44 ± 0.68 | (P = 0.69 vs. young) | Gsta1 | ND | Tmem135 | ND |
| Terf2 | 1.32 ± 0.63 | (P = 0.57 vs. young) | Hsf1 | ND | Tmem33 | ND |
| C1qb | 1.14 ± 0.19 | (P = 0.81 vs. young) | Jakmip3 | ND | Tollip | ND |
| Ccr1 | 0.71 ± 0.58 | (P = 0.49 vs. young) | Lmnb1 | ND | Tpp1 | ND |
| C5ar1 | 0.70 ± 0.64 | (P = 0.74 vs. young) | Lsm5 | ND | Vwa5a | ND |
| Cd163 | 0.39 ± 0.079 | (P = 0.49 vs. young) | Ltf | ND | Wrn | ND |
| Anxa5 | ND | Mbp | ND | Zfr | ND | |
| Arid1a | ND | Mrpl43 | ND | Zmpste24 | ND | |
Laser capture microscopy was used to remove red fluorescent protein (RFP)-labeled cells of renin lineage in the juxtaglomerular compartment from young and aged mice for RNA extraction. The results of an Aging Profiler PCR array, including 84 genes represent the fold change in mRNA in aged mice over young mice. Statistical significance of P < 0.05 is indicated in bold. ND indicates not detected.
Because CoRL proliferation was markedly blunted in aged CoRL in response to enalapril and losartan, compared with the robust increase in young mice, we examined genes that govern senescence. A 38.9-fold increase in Lamin A (Lmna), and a 19.1-fold increase in Lamin B2 (Lmnb2) was observed in untreated aged mice, compared with untreated young mice. Interestingly, the gene Protection of Telomeres 1 (Pot1a) was also increased 19.5-fold in aged CoRL. Additionally, the negative cell cycle regulator Thioredoxin-interacting protein 1(Txnip) increased 10.6-fold in aged CoRL.
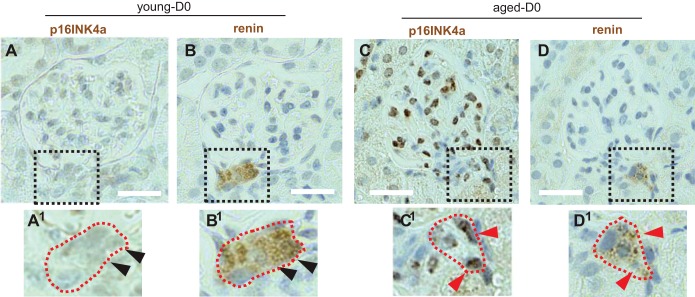
Immunoperoxidase staining was performed for the prosenescent protein p16INK4a, and for renin in serial sections (Fig. 8, A–D). Staining for p16INK4a was not detected in renin-staining cells in young mice (Fig. 8, A and B). In contrast, p16INK4a staining was readily detected in renin-staining cells in aged mice (Fig. 8, C and D). These results suggest that apoptosis might explain, in part, the age-related decline in CoRL and that both senescence and cell cycle regulation are candidate mechanisms explaining the lower rates of proliferation in aged mice in response to RAAS inhibition.
Fig. 8.
Immunoperoxidase staining for the prosenescent protein p16INK4a. Images of serial sections stained for p16INK4a (A) and renin (B) at D0. The dashed square indicates the region viewed at higher magnification. The juxtaglomerular compartment (JGC) cells do not stain for p16INK4a (A1) but do stain for renin (B1) (arrowheads represent same nuclei on serial sections). In aged mice, p16INK4a (C) overlaps with renin staining (D) and is present in glomerular cells. The dashed square indicates the region viewed at higher magnification for p16INK4a (C1) and renin (D1) (arrowheads represent same nuclei on serial sections). Scale bars = 20 μm.
Renin mRNA levels are lower in aged kidneys.
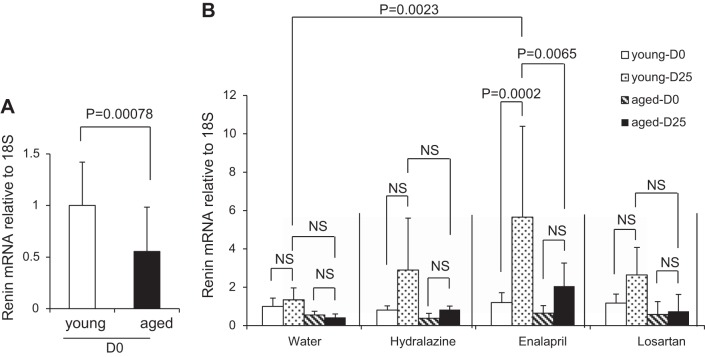
Although results showed that out of all kidney cortex cells, the percentage contributed to by renin-expressing cells was lower in aged mice, we asked whether those aged cells remaining were able to mount the same increase in renin transcription as young mice in the setting of RAAS inhibition. Kidney cortex renin mRNA levels were lower in aged mice at D0 when normalized for total mRNA loading (0.55 ± 0.43 vs. 1.00 ± 0.42, P = 0.00078 vs. young) (Fig. 9A). We next sought to determine whether the expected increase in renin mRNA following RAAS inhibition was also altered in aged mice. Renin mRNA levels were not changed in young or aged mice given water (Fig. 9B). Enalapril increased renin mRNA levels in young mice by five-fold (P = 0.0002 vs. D0), but it did not significantly increase renin mRNA in aged mice. Renin mRNA levels at D25 was significantly higher in young mice (P = 0.0065 vs. aged). Losartan showed a slight increase in renin mRNA levels in young mice, but the increase did not reach statistical significance. Losartan did not increase in renin mRNA levels in aged mice. Likewise, hydralazine showed a slight increase in renin mRNA levels in young mice, but the increase did not reach statistical significance. These results show that at D0, renin mRNA levels were lower in aged mice and that the increase in renin mRNA following RAAS inhibition in the absence of significant decreases in blood pressure was lower in aged mice compared with young mice.
Fig. 9.
Renin mRNA levels. A: graph of renin mRNA levels normalized to 18S ribosomal RNA at D0 in young (n = 21) and aged mice (n = 23), relative to young mice at D0. B: graph of renin mRNA levels normalized to 18S ribosomal RNA at D0 and D25 in water (n = 4 in young, n = 6 in aged), hydralazine (n = 6 in young, n = 4 in aged), enalapril (n = 6 in young, n = 6 in aged), and losartan (n = 5 in young, n = 7 in aged) treatment group, relative to young water group mice at D0.
DISCUSSION
With the population living longer, a better understanding of kidney structure and function during aging is required. Renin has a vital endocrine-like function in the kidney, being the critical enzyme initiating the RAAS, which is essential for blood pressure control, regulation of glomerular hemodynamics, and electrolyte homeostasis through tubular sodium and potassium handling (42). More recently, studies have shown that CoRL also have additional biological functions where they serve as progenitors in experimental disease states for adult podocytes (19, 24, 32–34), mesangial cells (24, 43), glomerular parietal epithelial cells (24, 34), and pericytes (33, 44). In the current studies, we focused on changes in CoRL number and their responses under healthy aging conditions in mice. Our results show that with advanced age in mice, CoRL number decreases. Notably, the number of CoRL can be increased in response to feedback cues following the administration of the ACE inhibitor enalapril and the angiotensin receptor blocker losartan. However, the expected increase in CoRL number was lower in aged mice than in young mice, indicating that additional factors need to be considered.
The first finding in the current study was a temporal decrease in the actual number of cells of renin lineage in the kidney over time with advanced age. Previous reports studying renin in advanced age have been almost exclusively performed in humans and rats, with only one report in mice to our knowledge (16). Our results showed that following the administration of tamoxifen in inducible Ren1cCreERxRs-tdTomato-R reporter mice, 93.8% of renin-expressing cells in the JGC were permanently labeled with tdTomato, detected by measuring red fluorescent protein. Thus, the vast majority of renin-producing cells labeled temporally by tamoxifen could be fate mapped over the life span of a healthy aging mouse. The results show that when a cohort of CoRL were permanently labeled at 2 mo of age (equivalent to human aged ~20 yr), their number decreased by 29.6% when aged 24 mo (equivalent to human aged 70 yr) (8). The percentage of cells staining for renin decreased similarly over the same time period. Neither renin nor RFP were detected in glomeruli of young or aged mice. Notably, the lineage-tracing technique used in this study relies upon direct quantification of CoRL in kidney tissue sections, rather than surrogate measures, such as plasma renin activity or renin content, methods used decades ago in trying to unravel the impact of aging on renin. Indeed, studies in humans have focused on plasma renin activity, showing that it is reduced with advanced age, is lower with age in response to various challenges, such as salt reduction, and is lower in aged hypertensive patients (1, 7, 25, 26, 28–30, 37, 45–49). Similarly, several studies show a decrease in plasma renin concentration and activity in rats (5, 6, 13, 17, 23). However, some studies did not show a decrease in aged rats (18). Studies examining the kidneys for cells of renin lineage with age are limited, showing that renin content in rats is reduced (5, 6, 13). In the current study, we showed that renin mRNA levels were lower in kidneys from aged mice compared with young mice. This is similar to a study using Northern blot analysis in mice (16) and in rats (18). Kidney renin mRNA did not decrease in one aging rat study (5). Taken together, the current study is the first to show the temporal decrease in the actual number of cells of renin lineage in the kidney over time with advanced age.
By increasing the number of renin-expressing cells in the kidney, renin is increased through feedback mechanisms under certain conditions such as salt deprivation, intravascular volume depletion, and RAAS blockade with ACE inhibitors and angiotensin receptor blockers (27). The second major finding in the current study was that administering enalapril or losartan, at doses purposefully not sufficient to lower systemic blood pressure, significantly increased the number of renin-expressing cells to a significantly lesser extent in aged mice compared with young mice. Furthermore, we showed that the age-related differences were due to differences in CoRL proliferation but not CoRL recruitment. The latter is considered a major mechanism, whereby smooth muscle vascular cells transdifferentiate toward a renin phenotype (3, 4, 11, 41). We recently showed that CoRL can, indeed, also proliferate following the administration of enalapril or losartan in experimental glomerular disease (24). The current study suggests that the increase in renin-expressing cells induced by RAAS inhibition was due to differences in proliferation, being lower in aged mice compared with young mice. In contrast, levels of recruitment of renin-expressing cells were similar between young and aged mice. A major strength to the experimental design was the use of a nephrectomy to obtain D0 tissue, which was then compared in each individual mouse given treatment to the remaining kidney taken at sacrifice. Unlike the current study, previous studies did not examine the number of renin-producing cells following a challenge, but focused on plasma renin activity, noting that increases in plasma renin activity are blunted in human aging following sodium restriction (7, 30, 49), and receiving Lasix (29, 37), and that plasma renin activity is reduced in aged rats given ACE inhibitors (27) or salt restriction (5). However, factors beyond the number of cells expressing renin regulate the activity of renin, and the current study was not designed to test any causal link between number of renin cells and plasma renin activity.
Having shown that the number of CoRL decrease with advanced age in mice, we next sought to better understand possible mechanisms for future studies. One explanation for this decrease in number is due to cell death. Because there is a high false negative rate detecting these short-lived apoptotic events over the life span of a mouse, we measured mRNA levels of proapoptotic genes in labeled CoRL in the JGC of young and aged mice by laser capture microscopy. This led to a third major finding, that proapoptotic and cell senescence genes are substantially upregulated in CoRL of aged mice over young mice. Another mechanism underlying a lower proliferative capacity is cell cycle inhibition. Our results showed increased transcription of Thioredoxin-interacting protein in aged CoRL, a gene that serves as a transcriptional repressor, which induces G0/G1 cell cycle arrest and suppression of tumor cell growth. Taken together, it is likely that the decrease in CoRL with advanced aging includes apoptosis-mediated and cell senescence events. Interestingly, mRNA levels for the gene Protection of Telomeres 1 was also increased in aged CoRL, suggesting that attempts are being made to maintain CoRL telomere length.
As this study is the first to directly study CoRL in mice of advanced age, there are some limitations. First, only female mice were used, thereby limiting extrapolation to male mice. Thus, interpretations have to be limited to female mice. Very old male mice are typically a challenge to house as they fight and oftentimes have low-grade inflammation secondary to wounds, which can impact their normal physiology. Second, the chronology of the decline in CoRL was not studied. That said, we have reported that mice aged 15 mo show reduced CoRL number (32). Third, although we did not study whether lowering blood pressure would have different impacts on CoRL responses, we deliberately chose doses of ACE inhibition and angiotensin receptor blockade that would not lower blood pressure, to mimic clinical practice in states of proteinuria. Although repeated weekly measures were performed, we recognize that telemetry blood pressure measurement might be more exact and that larger numbers of animals may have revealed differences. Fourth, because of advanced age of these mice and the limited interventional tools at our disposal, our molecular analysis was limited to gene expression studies. Although these provide insight into the general state of aged CoRL, we recognize that further studies are required to prove that the dysregulated genes in this study are actually mechanistic. Finally, we have not studied the impact of age-associated reduced CoRL number on regeneration, as we and others have described in young mice (24, 43). We have to speculate that lower renin cell number with aging and their reduced responsiveness to RAAS inhibition has clinical implications, and one wonders whether dose adjustments are needed in elderly patients to get the response one expects. Notably, RAAS inhibition did induce proliferative responses in aged cells, albeit to a more limited degree. Treatments that protect CoRL from senescence and apoptosis may, therefore, act synergistically with RAAS inhibition, resulting in better outcomes in the aged patient population.
In summary, fate mapping studies showed that the number of cells of renin lineage decreases with advanced age in mice, which we propose coincides with upregulation of an important proapoptotic gene (Fig. 10). In addition to a lower CoRL reserve with advanced age, their proliferative response to RAAS inhibition was blunted, which is accompanied by genes mediating senescence and blocking cell cycle progression.
Fig. 10.
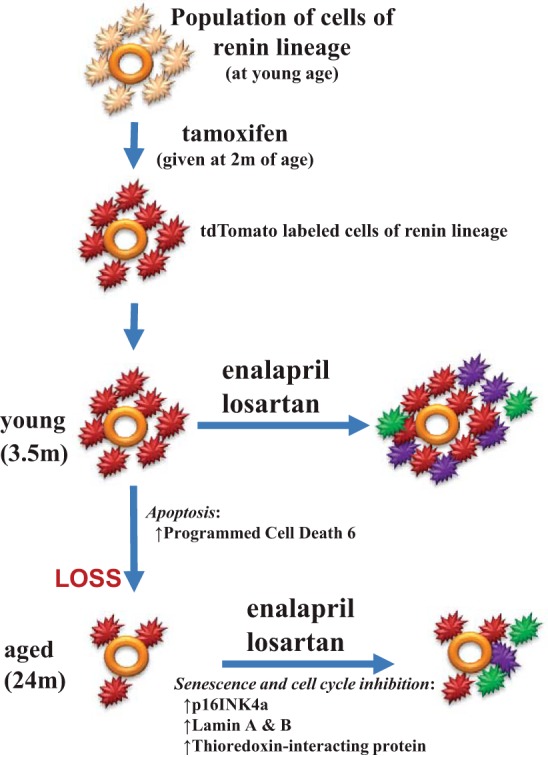
Proposed schema representing changes to CoRL during healthy aging. CoRL (light orange) surrounding the afferent arteriole (depicted by orange circle) in the juxtaglomerular compartment in young mice were permanently labeled with td-tomato (red) following the administration of tamoxifen at a young age. In young mice, total CoRL number increased following renin-angiotensin-aldosterone system inhibition with enalapril or losartan, due to both proliferation (purple) and recruitment (green). CoRL number decreased between the ages of 3.5 mo ( = age 20 yr in humans) and 24 m ( = age 70 yr in humans), accompanied by, and perhaps due to, increased apoptotic genes such as programmed cell death 6. In aged mice given enalapril or losartan, CoRL recruitment was detected (green), but proliferation was barely detected (just one purple cell), leading to a smaller increase in the overall CoRL population. We propose that the lack of proliferation in aged CoRL might be due to CoRL senescence with increased prosenescent genes (p16INK4a, Lamin A and B), and reduced proliferation due to increased cell cycle inhibition by thioredoxin-interacting protein.
GRANTS
This article was supported by the National Institutes of Health Grants 5 R01 DK-056799–10, 5 R01 DK-056799–12, 1 R01 DK-097598–01A1, 5UH2 DK-107343 02 5 K01 DK-102826, HL-48459, and P30CA-016056.
DISCLOSURES
No conflicts of interest, financial or otherwise, are declared by the authors. The results presented in this paper have not been published previously, in whole or in part.
AUTHOR CONTRIBUTIONS
H.H., D.G.E., and N.V.K. performed experiments; H.H., N.V.K., J.W.P., and S.J.S. analyzed data; H.H., K.W.G., B.F., J.W.P., and S.J.S. interpreted results of experiments; H.H. prepared figures; H.H., J.W.P., and S.J.S. drafted manuscript; D.G.E., J.W.P., and S.J.S. conceived and designed research; K.W.G., B.F., J.W.P., and S.J.S. edited and revised manuscript; S.J.S. approved final version of manuscript.
REFERENCES
- 1.Sambhi MP; Clinical conference . Clinical conference: essential hypertension: new concepts about mechanisms. Ann Intern Med 79: 411–424, 1973. doi: 10.7326/0003-4819-79-3-411. [DOI] [PubMed] [Google Scholar]
- 2.Celio MR, Inagami T. Renin in the human kidney. Histochemistry 72: 1–10, 1981. doi: 10.1007/BF00496773. [DOI] [PubMed] [Google Scholar]
- 3.Chen L, Kim SM, Oppermann M, Faulhaber-Walter R, Huang Y, Mizel D, Chen M, Lopez ML, Weinstein LS, Gomez RA, Briggs JP, Schnermann J. Regulation of renin in mice with Cre recombinase-mediated deletion of G protein Gsα in juxtaglomerular cells. Am J Physiol Renal Physiol 292: F27–F37, 2007. doi: 10.1152/ajprenal.00193.2006. [DOI] [PubMed] [Google Scholar]
- 4.Chevalier RL, Gomez RA, Carey RM, Peach MJ, Linden JM. Renal effects of atrial natriuretic peptide infusion in young and adult rats. Pediatr Res 24: 333–337, 1988. doi: 10.1203/00006450-198809000-00012. [DOI] [PubMed] [Google Scholar]
- 5.Corman B, Barrault MB, Klingler C, Houot AM, Michel JB, Della Bruna R, Pinet F, Soubrier F. Renin gene expression in the aging kidney: effect of sodium restriction. Mech Ageing Dev 84: 1–13, 1995. doi: 10.1016/0047-6374(95)01630-I. [DOI] [PubMed] [Google Scholar]
- 6.Corman B, Michel JB. Renin-angiotensin system, converting-enzyme inhibition and kidney function in aging female rats. Am J Physiol Regul Integr Comp Physiol 251: R450–R455, 1986. [DOI] [PubMed] [Google Scholar]
- 7.Crane MG, Harris JJ. Effect of aging on renin activity and aldosterone excretion. J Lab Clin Med 87: 947–959, 1976. [PubMed] [Google Scholar]
- 8.Fox JG, Barthold S, Davisson M, Newcomer CE, Quimby FW, Smith A. The Mouse in Biomedical Research: Normative Biology. Husbandry, and Models. New York: Elsevier, 2006. [Google Scholar]
- 9.Ge S, Nie S, Liu Z, Chen C, Zha Y, Qian J, Liu B, Teng S, Xu A, Bin W, Xu X, Xu G. Epidemiology and outcomes of acute kidney injury in elderly Chinese patients: a subgroup analysis from the EACH study. BMC Nephrol 17: 136, 2016. doi: 10.1186/s12882-016-0351-2. [DOI] [PMC free article] [PubMed] [Google Scholar]
- 10.Glassock RJ, Rule AD. The implications of anatomical and functional changes of the aging kidney: with an emphasis on the glomeruli. Kidney Int 82: 270–277, 2012. doi: 10.1038/ki.2012.65. [DOI] [PMC free article] [PubMed] [Google Scholar]
- 11.Gomez RA, Chevalier RL, Everett AD, Elwood JP, Peach MJ, Lynch KR, Carey RM. Recruitment of renin gene-expressing cells in adult rat kidneys. Am J Physiol Renal Physiol 259: F660–F665, 1990. [DOI] [PubMed] [Google Scholar]
- 12.Guo S, Kowalewska J, Wietecha TA, Iyoda M, Wang L, Yi K, Spencer M, Banas M, Alexandrescu S, Hudkins KL, Alpers CE. Renin-angiotensin system blockade is renoprotective in immune complex-mediated glomerulonephritis. J Am Soc Nephrol 19: 1168–1176, 2008. doi: 10.1681/ASN.2007050607. [DOI] [PMC free article] [PubMed] [Google Scholar]
- 13.Hayashi M, Saruta T, Nakamura R, Kitajima W, Kato E. Effect of aging on single nephron renin content in rats. Ren Physiol 4: 17–21, 1981. [DOI] [PubMed] [Google Scholar]
- 14.Hodgin JB, Bitzer M, Wickman L, Afshinnia F, Wang SQ, O’Connor C, Yang Y, Meadowbrooke C, Chowdhury M, Kikuchi M, Wiggins JE, Wiggins RC. Glomerular aging and focal global glomerulosclerosis: a podometric perspective. J Am Soc Nephrol 26: 3162–3178, 2015. doi: 10.1681/ASN.2014080752. [DOI] [PMC free article] [PubMed] [Google Scholar]
- 15.Hommos MS, Glassock RJ, Rule AD. Structural and functional changes in human kidneys with healthy aging. J Am Soc Nephrol 28: 2838–2844, 2017. doi: 10.1681/ASN.2017040421. [DOI] [PMC free article] [PubMed] [Google Scholar]
- 16.Hung L, Richardson A. The effect of aging on the genetic expression of renin by mouse kidney. Aging (Milano) 5: 193–198, 1993. [DOI] [PubMed] [Google Scholar]
- 17.Jover B, Dupont M, Geelen G, Wahba W, Mimran A, Corman B. Renal and systemic adaptation to sodium restriction in aging rats. Am J Physiol Regul Integr Comp Physiol 264: R833–R838, 1993. [DOI] [PubMed] [Google Scholar]
- 18.Jung FF, Kennefick TM, Ingelfinger JR, Vora JP, Anderson S. Down-regulation of the intrarenal renin-angiotensin system in the aging rat. J Am Soc Nephrol 5: 1573–1580, 1995. [DOI] [PubMed] [Google Scholar]
- 19.Kaverina NV, Kadoya H, Eng DG, Rusiniak ME, Sequeira-Lopez ML, Gomez RA, Pippin JW, Gross KW, Peti-Peterdi J, Shankland SJ. Tracking the stochastic fate of cells of the renin lineage after podocyte depletion using multicolor reporters and intravital imaging. PLoS One 12: e0173891, 2017. doi: 10.1371/journal.pone.0173891. [DOI] [PMC free article] [PubMed] [Google Scholar]
- 20.Kremers WK, Denic A, Lieske JC, Alexander MP, Kaushik V, Elsherbiny HE, Chakkera HA, Poggio ED, Rule AD. Distinguishing age-related from disease-related glomerulosclerosis on kidney biopsy: the aging kidney anatomy study. Nephrol Dial Transplant 30: 2034–2039, 2015. doi: 10.1093/ndt/gfv072. [DOI] [PMC free article] [PubMed] [Google Scholar]
- 21.Kurtz A. Renin release: sites, mechanisms, and control. Annu Rev Physiol 73: 377–399, 2011. doi: 10.1146/annurev-physiol-012110-142238. [DOI] [PubMed] [Google Scholar]
- 22.Lacasse J, Ballak M, Mercure C, Gutkowska J, Chapeau C, Foote S, Ménard J, Corvol P, Cantin M, Genest J. Immunocytochemical localization of renin in juxtaglomerular cells. J Histochem Cytochem 33: 323–332, 1985. doi: 10.1177/33.4.3884706. [DOI] [PubMed] [Google Scholar]
- 23.Lartaud I, Makki T, Bray-des-Boscs L, Niederhoffer N, Atkinson J, Corman B, Capdeville-Atkinson C. Effect of chronic ANG I-converting enzyme inhibition on aging processes. IV. Cerebral blood flow regulation. Am J Physiol Regul Integr Comp Physiol 267: R687–R694, 1994. doi: 10.1152/ajpregu.1994.267.3.R687. [DOI] [PubMed] [Google Scholar]
- 24.Lichtnekert J, Kaverina NV, Eng DG, Gross KW, Kutz JN, Pippin JW, Shankland SJ. Renin-angiotensin-aldosterone system inhibition increases podocyte derivation from cells of renin lineage. J Am Soc Nephrol 27: 3611–3627, 2016. doi: 10.1681/ASN.2015080877. [DOI] [PMC free article] [PubMed] [Google Scholar]
- 25.Luft FC, Fineberg NS, Weinberger MH. The influence of age on renal function and renin and aldosterone responses to sodium-volume expansion and contraction in normotensive and mildly hypertensive humans. Am J Hypertens 5: 520–528, 1992. doi: 10.1093/ajh/5.8.520. [DOI] [PubMed] [Google Scholar]
- 26.Messerli FH, Ventura HO, Glade LB, Sundgaard-Riise K, Dunn FG, Frohlich ED. Essential hypertension in the elderly: haemodynamics, intravascular volume, plasma renin activity, and circulating catecholamine levels. Lancet 322: 983–986, 1983. doi: 10.1016/S0140-6736(83)90977-7. [DOI] [PubMed] [Google Scholar]
- 27.Michel JB, Heudes D, Michel O, Poitevin P, Philippe M, Scalbert E, Corman B, Levy BI. Effect of chronic ANG I-converting enzyme inhibition on aging processes. II. Large arteries. Am J Physiol Regul Integr Comp Physiol 267: R124–R135, 1994. doi: 10.1152/ajpregu.1994.267.1.R124. [DOI] [PubMed] [Google Scholar]
- 28.Mulkerrin E, Epstein FH, Clark BA. Aldosterone responses to hyperkalemia in healthy elderly humans. J Am Soc Nephrol 6: 1459–1462, 1995. [DOI] [PubMed] [Google Scholar]
- 29.Nakamaru M, Ogihara T, Higaki J, Hata T, Maruyama A, Mikami H, Naka T, Iwanaga K, Kumahara Y, Murakami K. Effect of age on active and inactive plasma renin in normal subjects and in patients with essential hypertension. J Am Geriatr Soc 29: 379–382, 1981. doi: 10.1111/j.1532-5415.1981.tb01245.x. [DOI] [PubMed] [Google Scholar]
- 30.Noth RH, Lassman MN, Tan SY, Fernandez-Cruz A Jr, Mulrow PJ. Age and the renin-aldosterone system. Arch Intern Med 137: 1414–1417, 1977. doi: 10.1001/archinte.1977.03630220056014. [DOI] [PubMed] [Google Scholar]
- 31.Pichaiwong W, Hudkins KL, Wietecha T, Nguyen TQ, Tachaudomdach C, Li W, Askari B, Kobayashi T, O’Brien KD, Pippin JW, Shankland SJ, Alpers CE. Reversibility of structural and functional damage in a model of advanced diabetic nephropathy. J Am Soc Nephrol 24: 1088–1102, 2013. doi: 10.1681/ASN.2012050445. [DOI] [PMC free article] [PubMed] [Google Scholar]
- 32.Pippin JW, Glenn ST, Krofft RD, Rusiniak ME, Alpers CE, Hudkins K, Duffield JS, Gross KW, Shankland SJ. Cells of renin lineage take on a podocyte phenotype in aging nephropathy. Am J Physiol Renal Physiol 306: F1198–F1209, 2014. doi: 10.1152/ajprenal.00699.2013. [DOI] [PMC free article] [PubMed] [Google Scholar]
- 33.Pippin JW, Kaverina NV, Eng DG, Krofft RD, Glenn ST, Duffield JS, Gross KW, Shankland SJ. Cells of renin lineage are adult pluripotent progenitors in experimental glomerular disease. Am J Physiol Renal Physiol 309: F341–F358, 2015. doi: 10.1152/ajprenal.00438.2014. [DOI] [PMC free article] [PubMed] [Google Scholar]
- 34.Pippin JW, Sparks MA, Glenn ST, Buitrago S, Coffman TM, Duffield JS, Gross KW, Shankland SJ. Cells of renin lineage are progenitors of podocytes and parietal epithelial cells in experimental glomerular disease. Am J Pathol 183: 542–557, 2013. doi: 10.1016/j.ajpath.2013.04.024. [DOI] [PMC free article] [PubMed] [Google Scholar]
- 35.Roeder SS, Stefanska A, Eng DG, Kaverina N, Sunseri MW, McNicholas BA, Rabinovitch P, Engel FB, Daniel C, Amann K, Lichtnekert J, Pippin JW, Shankland SJ. Changes in glomerular parietal epithelial cells in mouse kidneys with advanced age. Am J Physiol Renal Physiol 309: F164–F178, 2015. doi: 10.1152/ajprenal.00144.2015. [DOI] [PMC free article] [PubMed] [Google Scholar]
- 36.Rule AD, Amer H, Cornell LD, Taler SJ, Cosio FG, Kremers WK, Textor SC, Stegall MD. The association between age and nephrosclerosis on renal biopsy among healthy adults. Ann Intern Med 152: 561–567, 2010. doi: 10.7326/0003-4819-152-9-201005040-00006. [DOI] [PMC free article] [PubMed] [Google Scholar]
- 37.Saruta T, Suzuki A, Hayashi M, Yasui T, Eguchi T, Kato E. Mechanism of age-related changes in renin and adrenocortical steroids. J Am Geriatr Soc 28: 210–214, 1980. doi: 10.1111/j.1532-5415.1980.tb00521.x. [DOI] [PubMed] [Google Scholar]
- 38.Sauter A, Machura K, Neubauer B, Kurtz A, Wagner C. Development of renin expression in the mouse kidney. Kidney Int 73: 43–51, 2008. doi: 10.1038/sj.ki.5002571. [DOI] [PubMed] [Google Scholar]
- 39.Schmitt R, Melk A. Molecular mechanisms of renal aging. Kidney Int 92: 569–579, 2017. doi: 10.1016/j.kint.2017.02.036. [DOI] [PubMed] [Google Scholar]
- 40.Schneider RR, Eng DG, Kutz JN, Sweetwyne MT, Pippin JW, Shankland SJ. Compound effects of aging and experimental FSGS on glomerular epithelial cells. Aging (Albany NY) 9: 524–546, 2017. doi: 10.18632/aging.101176. [DOI] [PMC free article] [PubMed] [Google Scholar]
- 41.Sequeira López ML, Pentz ES, Nomasa T, Smithies O, Gomez RA. Renin cells are precursors for multiple cell types that switch to the renin phenotype when homeostasis is threatened. Dev Cell 6: 719–728, 2004. doi: 10.1016/S1534-5807(04)00134-0. [DOI] [PubMed] [Google Scholar]
- 42.Sparks MA, Crowley SD, Gurley SB, Mirotsou M, Coffman TM. Classical renin-angiotensin system in kidney physiology. Compr Physiol 4: 1201–1228, 2014. doi: 10.1002/cphy.c130040. [DOI] [PMC free article] [PubMed] [Google Scholar]
- 43.Starke C, Betz H, Hickmann L, Lachmann P, Neubauer B, Kopp JB, Sequeira-Lopez ML, Gomez RA, Hohenstein B, Todorov VT, Hugo CP. Renin lineage cells repopulate the glomerular mesangium after injury. J Am Soc Nephrol 26: 48–54, 2015. doi: 10.1681/ASN.2014030265. [DOI] [PMC free article] [PubMed] [Google Scholar]
- 44.Stefanska A, Eng D, Kaverina N, Pippin JW, Gross KW, Duffield JS, Shankland SJ. Cells of renin lineage express hypoxia inducible factor 2α following experimental ureteral obstruction. BMC Nephrol 17: 5, 2016. doi: 10.1186/s12882-015-0216-0. [DOI] [PMC free article] [PubMed] [Google Scholar]
- 45.Takeda R, Morimoto S, Uchida K, Miyamori I, Hashiba T. Effect of age on plasma aldosterone response to exogenous angiotensin II in normotensive subjects. Acta Endocrinol (Copenh) 94: 552–558, 1980. [DOI] [PubMed] [Google Scholar]
- 46.Thomas GW, Ledingham JG, Beilin LJ, Stott AN. Reduced plasma renin activity in essential hypertension: effects of blood pressure, age and sodium. Clin Sci Mol Med Suppl 3: 185s–188s, 1976. [DOI] [PubMed] [Google Scholar]
- 47.Tsunoda K, Abe K, Goto T, Yasujima M, Sato M, Omata K, Seino M, Yoshinaga K. Effect of age on the renin-angiotensin-aldosterone system in normal subjects: simultaneous measurement of active and inactive renin, renin substrate, and aldosterone in plasma. J Clin Endocrinol Metab 62: 384–389, 1986. doi: 10.1210/jcem-62-2-384. [DOI] [PubMed] [Google Scholar]
- 48.Weidmann P, de Chatel R, Schiffmann A, Bachmann E, Beretta-Piccoli C, Reubi FC, Ziegler WH, Vetter W. Interrelations between age and plasma renin, aldosterone and cortisol, urinary catecholamines, and the body sodium/volume state in normal man. Klin Wochenschr 55: 725–733, 1977. doi: 10.1007/BF01476959. [DOI] [PubMed] [Google Scholar]
- 49.Weidmann P, De Myttenaere-Bursztein S, Maxwell MH, de Lima J. Effect on aging on plasma renin and aldosterone in normal man. Kidney Int 8: 325–333, 1975. doi: 10.1038/ki.1975.120. [DOI] [PubMed] [Google Scholar]


