

Many archaea are extremophiles, able to thrive in habitats of extreme salinity, pH and temperature. These biological properties are ideal for applications in biotechnology. However, limited knowledge of archaeal metabolism is a bottleneck that prevents the broad use of archaea as microbial factories for industrial products. Here, we characterize how sugar uptake and use are regulated in a species that lives in high salinity. We demonstrate that a key sugar regulatory protein in this archaeal species functions using molecular mechanisms conserved with distantly related bacterial species.
KEYWORDS: transcription factor, glycerol, fructose metabolism, catabolite repression, glucose metabolism, archaea
ABSTRACT
DeoR-type helix-turn-helix (HTH) domain proteins are transcriptional regulators of sugar and nucleoside metabolism in diverse bacteria and also occur in select archaea. In the model archaeon Haloferax volcanii, previous work implicated GlpR, a DeoR-type transcriptional regulator, in the transcriptional repression of glpR and the gene encoding the fructose-specific phosphofructokinase (pfkB) during growth on glycerol. However, the global regulon governed by GlpR remained unclear. Here, we compared transcriptomes of wild-type and ΔglpR mutant strains grown on glycerol and glucose to detect significant transcript level differences for nearly 50 new genes regulated by GlpR. By coupling computational prediction of GlpR binding sequences with in vivo and in vitro DNA binding experiments, we determined that GlpR directly controls genes encoding enzymes involved in fructose degradation, including fructose bisphosphate aldolase, a central control point in glycolysis. GlpR also directly controls other transcription factors. In contrast, other metabolic pathways appear to be under the indirect influence of GlpR. In vitro experiments demonstrated that GlpR purifies to function as a tetramer that binds the effector molecule fructose-1-phosphate (F1P). These results suggest that H. volcanii GlpR functions as a direct negative regulator of fructose degradation during growth on carbon sources other than fructose, such as glucose and glycerol, and that GlpR bears striking functional similarity to bacterial DeoR-type regulators.
IMPORTANCE Many archaea are extremophiles, able to thrive in habitats of extreme salinity, pH and temperature. These biological properties are ideal for applications in biotechnology. However, limited knowledge of archaeal metabolism is a bottleneck that prevents the broad use of archaea as microbial factories for industrial products. Here, we characterize how sugar uptake and use are regulated in a species that lives in high salinity. We demonstrate that a key sugar regulatory protein in this archaeal species functions using molecular mechanisms conserved with distantly related bacterial species.
INTRODUCTION
Many archaea are extremophiles, able to thrive in habitats of extreme salinity, pH, and temperature. These biological properties are ideal for applications in biotechnology. However, widespread use of archaea in the bioconversion process is limited by gaps in knowledge of the metabolism and associated regulatory networks of these microorganisms. Haloferax volcanii, first isolated from the Dead Sea, is obligately halophilic, requiring at least 0.7 M NaCl for growth, but surviving up to 5 M (1, 2). Among the archaea, this organism is highly tractable genetically (3), making it an excellent model organism to lay the groundwork for future success in metabolic engineering of extremophiles.
H. volcanii catabolizes a wide variety of carbon sources, including glycerol, fructose, glucose, xylitol, and chitin, among others (4). Fructose, glucose, and glycerol are taken up and degraded via three different metabolic pathways. A bacterium-like phosphoenolpyruvate (PEP)-dependent phosphotransferase system (PTS) specifically and actively transports fructose into the cell (Fig. 1) (5). Upon concomitant uptake and phosphorylation of fructose to F1P, the catabolism of fructose proceeds by a modified Embden-Meyerhof-Parnas (EMP) pathway, where F1P is converted by a series of enzymatic reactions to dihydroxyacetone phosphate (DHAP) and glyceraldehyde phosphate (GAP) (4, 5). In contrast to fructose, glucose is oxidized via an unusual archaeon-specific semiphosphorylated Entner-Doudoroff (spED) variant pathway (4, 6) (Fig. 1). Glycerol uptake by H. volcanii is hypothesized to occur through a putative glycerol facilitator (7). Once glycerol enters the cell, glycerol kinase (8, 9) phosphorylates glycerol to form glycerol-3-phosphate, which is transformed to GAP via the DHAP intermediate (7). All three carbon source pathways funnel GAP into the common lower shunt of the EMP pathway to form pyruvate (4).
FIG 1.

Schematic of carbon source uptake and degradation pathways in H. volcanii. The semiphosphorylative Entner-Doudoroff pathway for glucose degradation is shown at the left (green box), the modified Embden-Meyerhoff pathway for fructose use is shown in the center (blue box), and glycerol degradation (purple box) is shown at the right. The thick gray line represents the membrane boundary between the outside and inside of the cell. Numbered reactions correspond to genes and enzymes with corresponding references to experimental evidence in the table at the bottom. Reactions with multiple arrows represent pathways with multiple reactions not of focus in this study. PEP, phosphoenolpyruvate; PTSFRU, fructose-specific phosphotransferase transport system; F1P, fructose-1-phosphate; FBP, fructose-1,6-bisphosphate; GAP, glyceraldehyde-3-phosphate; 1,3BPG, 1,3-bisphosphoglycerate; 3PG, 3-phosphoglycerate; DHAP, dihydroxyacetone phosphate; KDG, 2-keto-3-deoxy-gluconate; EIIC, enzyme IIC; NA, not applicable.
Selective degradation of glycerol over glucose is regulated by catabolite repression in H. volcanii (9) and appears to be regulated in part by GlpR, a member of the DeoR family of transcription factors (10). While rare in archaea, DeoR homologs are widespread in bacteria and commonly function as specific regulators of carbon source uptake and catabolism, often playing a role in catabolite repression. Examples include catabolism of deoxyribonucleoside (DeoR), glycerol (GlpR), xylitol (XytR), and maltose (DeoT) in Gram-negative bacteria (11–15), as well as lactose (LacR), fructose (SugR), and mannitol (MtlR) in Gram-positive bacteria (16–18). Frequently, a phosphorylated catabolic intermediate relieves repression by dissociating the transcription factor from C/A-rich DNA operator binding sites (11, 12, 16, 18, 19). Although DeoR homologs typically function as tetramers (20), the pattern of cooperative binding to operators is complex and differs across organisms. The regulator can bind to multiple widely separated operators with a dyadic symmetry, while in other cases, the DeoR-type regulators bind adjacent operators with tandem symmetry (12, 13, 21, 22). For example, in Escherichia coli, GlpR binds up to four operators in the promoter and open reading frame of the gene encoding glycerol 3-phosphate dehydrogenase, each bound with differing affinity (22). Binding to multiple operators strongly represses transcription, facilitated by DNA looping and bending by the nucleoid-associated protein HU (22).
Our previous work demonstrated that GlpR of H. volcanii represses fructose and glucose catabolic enzyme-coding genes during growth on glycerol (10). The regulated enzymes include phosphofructokinase 1 (pfkB product) and 2-keto-3-deoxyglucokinase (kdgK1 product), which play key roles in fructose and glucose catabolism, respectively (5, 10) (Fig. 1). The genes of the glpR-pfkB operon are cotranscribed (5, 10). In contrast, studies in the closely related species Haloferax mediterranei have demonstrated that GlpR is an indispensable activator of the phosphoenolpyruvate-dependent phosphotransferase system (PTS) gene cluster for fructose utilization when grown on nutrient-rich medium and then supplemented with fructose (23). F1P is the hypothesized effector molecule of GlpR in both Haloferax species (10, 23), but this has not been demonstrated by experimental evidence. The complete regulon of GlpR and its function during growth on glucose also remain unclear. Here, we use a combination of in vivo, in vitro, and in silico methods to determine the effector molecule for H. volcanii GlpR, the global regulon of genes directly bound and regulated, and the consensus DNA binding motif.
RESULTS
Genome-wide expression analysis suggests a specific function for GlpR in the regulation of carbohydrate degradation.
To determine the global GlpR regulon and how it responds to various nutrients, H. volcanii parent and ΔglpR mutant strains were grown on substrates of two distinct pathways, glycerol (to analyze a C3 substrate) and glucose (to analyze a spED substrate). Total RNA was isolated from log-phase cells, and the transcriptomes were analyzed by microarray hybridization. Differential gene expression was deemed significant by statistical analysis of the detected transcripts, as outlined in Materials and Methods.
We first determined the response of wild-type cells (parent strain H26) to an carbon/energy source. Over 600 genes were found to be differentially expressed in a comparison of the two distinct growth substrates of glucose and glycerol (see Table ST1 in the supplemental material). These 600 genes were significantly enriched in gene functions for certain archaeal clusters of orthologous gene (arCOG) categories (Wolf et al. [24]). In particular, the arCOG category of carbohydrate transport and metabolism (G) was significantly enriched, consistent with the shift in carbon/energy source (Fig. 2). Signal transduction (e.g., histidine kinases of two-component systems), noncarbohydrate transporter (e.g., cation ABC transporters), and transcription (e.g., Lrp and TATA-binding protein [TBP] families) were also found to be arCOG categories that were overrepresented among the differentially expressed genes. These results reveal the global transcript changes that occur in cells using substrates of the spED (glucose) versus glycerol metabolic pathways are primarily associated with metabolism and regulation (Table ST2 and Fig. 2).
FIG 2.

Statistical enrichment of differentially expressed genes in archaeal clusters of orthologous genes (arCOG) categories. Enriched arCOG categories are listed on the y axis. The x axis depicts the inverse log P value of significance of enrichment in each functional category according to the hypergeometric distribution. Genes differentially expressed in the parent strain in response to glucose versus glycerol are represented by the black bars; those differentially expressed in the ΔglpR mutant strain are in gray. Full annotations are given in Table ST2.
To determine the global impact of GlpR on the cell, transcript levels in the parent and ΔglpR mutant strains were directly compared by statistical analysis (see Materials and Methods). Genes regulated by GlpR were identified (48 total) and found to be enriched only in carbohydrate transport and metabolism functions (arCOG category G [Fig. 2]), suggesting a specific role for GlpR in these processes. Further clustering of these 48 differentially expressed genes according to expression on the two different carbon sources revealed five patterns of GlpR-dependent gene regulation (clusters 1 to 5 [Fig. 3 and Table ST3]). Genes in cluster 1 were repressed in a GlpR-dependent manner during growth on glycerol but relatively unaffected by the deletion of glpR on glucose (Fig. 3, purple branches on dendrogram). Genes in cluster 1 encode putative functions in peptide transport and succinate dehydrogenase. Genes in cluster 2 were mildly activated by GlpR on glycerol and glucose (Fig. 3, blue branches). Cluster 2 included the glycerol kinase gene (glpK) and the spED pathway enzyme 2-keto-3-deoxygluconate kinase gene (kdgK2) (6). Genes in clusters 3 and 4 were activated by GlpR during growth on glucose (Fig. 3). Nearly half of the genes in cluster 3, including a putative transcription factor (HVO_0219), were also overexpressed in the ΔglpR background during growth on glycerol (Table ST3). Cluster 4 included genes encoding homologs of the TrmB transcription factor and a putative branched-chain amino acid transporter. Genes in cluster 5 were repressed by GlpR under both glycerol and glucose conditions. Genes in this cluster encoded fructose uptake and degradation functions (Fig. 3) (5). Together, these clustering results suggest bifunctional and multifactorial regulation by GlpR.
FIG 3.

GlpR activates and represses genes in response to sugar. The heat map represents the results of hierarchical clustering of genes differentially expressed in the glpR deletion strain versus the parent strain. Each row represents mean and variance scaled expression values for each gene with significant differential expression in response to glpR deletion. Each gene is labeled at the right side of the heat map with its unique identifier in gray text and common name in bold black text. Each column represents the expression for that gene in each strain and under each growth condition. The dendrogram at the left is colored and numbered according to the clusters of coexpressed genes. The scale bar at the lower right indicates the colors that represent the log10 gene expression levels. Clustering details and full gene annotations for each cluster are listed in Table ST3.
Of the 48 genes identified by microarray analysis to be differentially expressed in a GlpR-dependent manner, members of only a few transcriptional units were up- or downregulated ≥2-fold due to the glpR deletion under either glucose or glycerol conditions (Fig. 4). These transcripts included the monocistron lctP, which was predicted to encode a permease for the uptake of carboxylic acids (e.g., succinate, malate, and lactate) based on homology and structural modeling (Fig. SF1). The remaining operons were associated with (i) fructose metabolism and transport (pfkB-ptfCA-ptsH1I-ptfB-fba), (ii) the common trunk of carbohydrate metabolism (gap-pgk), and (iii) glycerol uptake and degradation (glpA1B1C1-glpK-glpF-ptsH2) (Fig. 4). Under the conditions tested, the expression of genes required for glycerol metabolism was mildly affected by the deletion of glpR, as the ΔglpR-based differential expression of glpA1B1C1 (encoding glycerol dehydrogenase) barely met the 2-fold cutoff criterion, while that of glpK (encoding glycerol kinase) was statistically significant but did not meet the 2-fold cutoff (Fig. 4 and Table ST1). In contrast, the fructose metabolism and transport operon was strongly regulated. The members of this operon were also the only differentially expressed genes in genomic synteny with glpR itself. The magnitude of GlpR-mediated regulation during growth on glucose was generally greater than that for glycerol, although gene expression behavior in the ΔglpR mutant under both conditions was strongly correlated ( = 0.914) (Fig. 4). Taken together, these data suggest that during growth on glucose and glycerol (all in the absence of fructose), (i) the primary role of GlpR is to repress genes encoding functions associated with the uptake and metabolism of fructose and (ii) GlpR plays a minor role in regulating glycerol and di-/monocarboxylic acid pathways (Fig. 4).
FIG 4.

At least a 2-fold change in gene expression for fructose and glycerol degradation pathways is observed in ΔglpR mutant cells. Bars represent the log10 fold change (mean from three biological replicates) in gene expression in ΔglpR mutant versus parent strain cells during growth on glycerol (yellow) versus glucose (blue). Arrows represent genes expressed in operons, with multiheaded arrows representing experimentally observed differential transcripts (5, 7, 10). Gene names in black text represent those at least 2-fold differentially expressed. Those in gray text did not meet the 2-fold cutoff but are expressed in operons with those expressed at least 2-fold. Full annotations and gene unique identifiers are given in Tables ST1 and ST3.
GlpR purifies as a tetramer stabilized by fructose-1-phosphate binding.
To examine GlpR properties in vitro, GlpR was fused to a C-terminal His6 tag and purified to homogeneity from H. volcanii by tandem Ni2+ affinity and gel filtration chromatography (see Materials and Methods). A high salt concentration (2 M NaCl) was used in the purification scheme to maintain halophilic protein structure. The purity of the preparation was based on total protein staining (Sypro Ruby and Coomassie blue) and anti-His tag immunoblotting analysis of GlpR separated by SDS-PAGE (Fig. 5A). GlpR was found to be associated as a homotetramer of 121 kDa, as observed by gel filtration chromatography, compared to the theoretical mass of 29 kDa for the subunit based on amino acid sequence (Fig. 5B).
FIG 5.
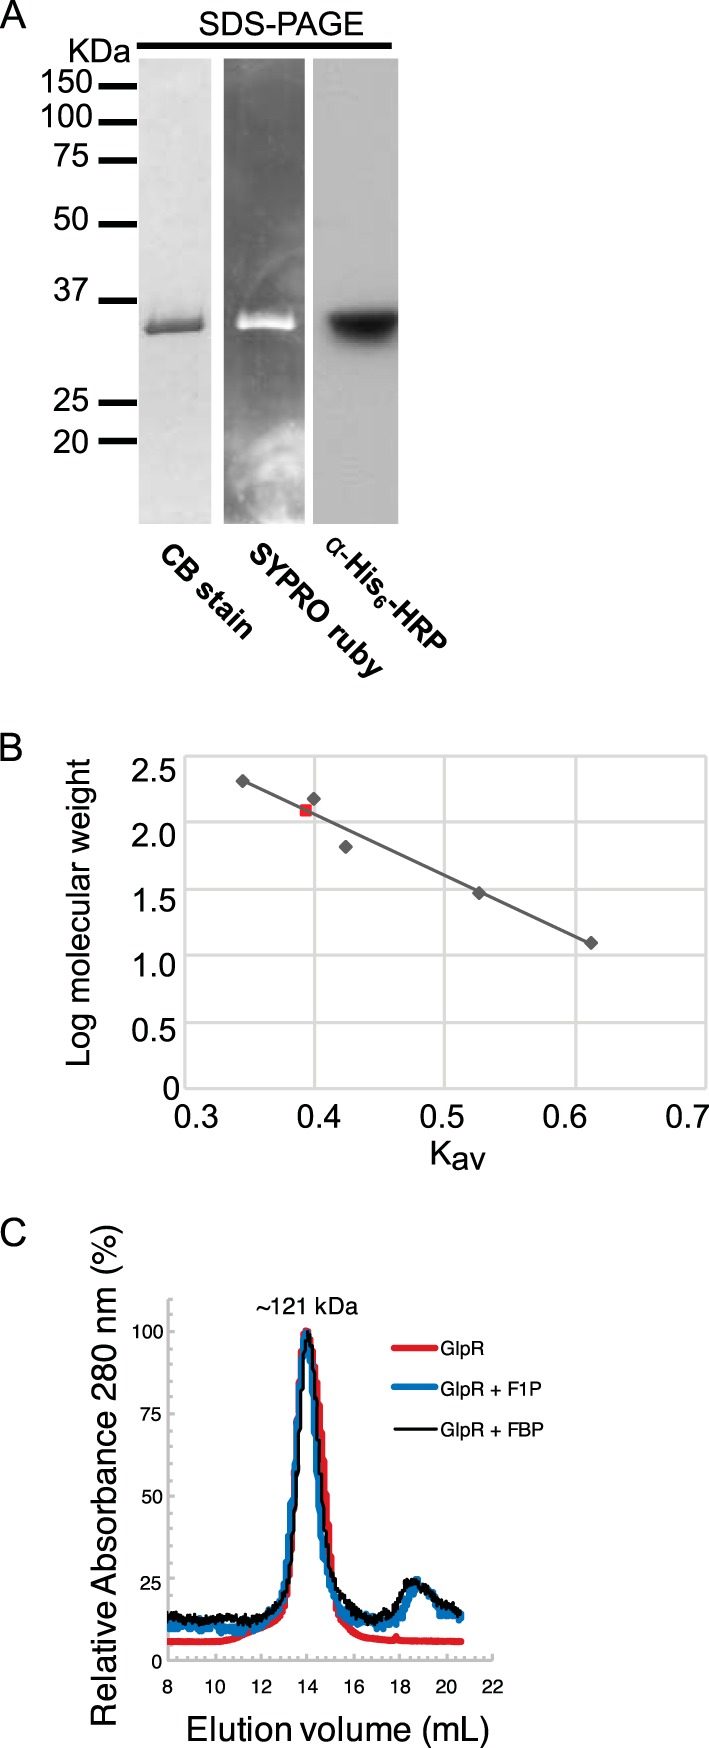
GlpR purifies as a tetramer. (A) Preparations of GlpR protein are pure and migrate close to the predicted monomeric molecular mass of ∼29 kDa under denaturing conditions. Molecular weight ladder is shown at right. Staining methods are labeled beneath each lane (CB, Coomassie blue; α-His6-HRP, horseradish peroxidase-conjugated His tag antibody no. HRP-66005 from Proteintech). (B) Gel filtration chromatography standard curve of GlpR under native conditions. The red square represents GlpR tetramer (∼121 kDa); gray diamonds represent the standard curve. Regression line shows R2 = 0.96976; y = −4.6131x + 3.9009. (C) Gel filtration chromatography profile of GlpR under native conditions (red line, where 100% A280 is 0.213) and native conditions supplemented with F1P (blue line) or FBP (black line) (where 100% A280 is 0.015).
To determine the effector molecule for the GlpR mechanism of action, the purified GlpR was examined for ligand interactions that promote protein stability by differential scanning fluorimetry (DSF). In the absence of a small-molecule ligand, the GlpR melting temperature (Tm) was 65°C (Table 1). In contrast, upon incubation of GlpR with fructose-1-phosphate (F1P), a metabolite in fructose degradation, the GlpR Tm increased 4°C ± 0.1°C, suggesting that F1P significantly stabilized the tertiary structure of GlpR (Table 1). The 13 other small molecules tested displayed minimal, if any, stabilization of the tertiary structure of GlpR (Table 1). The quaternary structure of the GlpR homotetramer was relatively stable during gel filtration in the presence of F1P and fructose-1,6-bisphosphate (FBP) (Fig. 5C). Together, these results suggest that GlpR functions as a stable homotetramer, with F1P as a specific ligand. Together with the in vivo expression data, these in vitro data are consistent with the model that, upon the addition of fructose to glycerol- and glucose-grown cells, F1P levels would elevate, bind GlpR, and alter the DNA binding activity of this transcription factor. As in the case of FBA (the first metabolic step after group translocation of fructose by the PTS system), fba promoter (Pfba) transcription would be primarily stimulated by the derepression of GlpR.
TABLE 1.
DSF screen used to identify low-molecular-weight ligands that bind and stabilize purified 1 μM GlpR-His6a

The melting temperature of native GlpR-His6 with no ligand was 65°C.
bValues represent the mean of the results from at least 3 biological replicate trials ± standard deviation.
GlpR binds the promoter regions of genes associated with carbon metabolic enzyme-coding genes.
Genes differentially expressed in response to glpR deletion are presumed to include those directly bound by GlpR and those regulated indirectly. To identify direct targets, promoters of genes differentially expressed due to the deletion of glpR (Fig. 3 and 4) and of a gene previously shown to be GlpR regulated (kdgK1 [10]) were selected and tested for GlpR binding assays in vitro and in vivo. Titration gel shift assays indicated that 75 nM purified GlpR was sufficient to shift DNA sequences from the PglpR-pfkB region, with 200 nM GlpR enabling a complete bandshift (Fig. 6A). As expected from previous evidence (7), binding was not observed for the PkdgK2 region (Fig. 6A). However, PkdgK1 binding was unexpectedly not observed (Fig. 7), despite previous evidence that the ΔglpR mutation is required for its repression (7), suggesting indirect regulation of this promoter. GlpR binding to PglpR-pfkB was abrogated in the presence of a 60-fold excess of unlabeled competitor DNA (Fig. 6B), which together with the absence of binding at PkdgK1 and PkdgK2, suggests a specific interaction between GlpR and its own promoter. F1P was found to reduce the level of GlpR binding to the PglpR-pfkB promoter, supporting the model that fructose metabolism and transport genes are derepressed upon GlpR binding to this ligand (Fig. SF2).
FIG 6.

GlpR-promoter binding is specific. (A) Electrophoretic mobility shift assays (EMSA) with biotin-labeled PglpR-pfkB promoter DNA (left) or PkdgK2 (right) incubated in the absence (−) or presence of increasing concentrations of GlpR (triangles; each lane corresponds to 25, 50, 75, 100, 150, 200 nM GlpR). F, free DNA; B, bandshift. (B) Binding of GlpR to the PglpR-pfkB region is specific. PglpR-pfkB DNA was incubated in the presence (rectangle) and absence (−) of GlpR and increasing concentrations of unlabeled competitor probe (triangle; 0 to 120 nM). F, free DNA; B1, bandshift 1; B2, bandshift 2; B3, bandshift 3.
FIG 7.

GlpR binds directly to enzyme-coding gene promoters. DNA from the promoter regions indicated at top were incubated with (+) or without (−) purified GlpR in EMSA reactions. These reaction mixtures were incubated in the absence of other additives. PglpR-pfkB and PkdgK2 reactions were run on each gel as a positive and negative control, respectively. F, free DNA; B, bandshift.
Gel shift binding assays demonstrated that GlpR also bound to seven additional promoter regions of genes that were differentially expressed upon the deletion of glpR, including regions upstream of PTS system genes (ptfC), fba, lctP, and glpK and other transcription factors (Fig. 7). Binding at four of these promoters was corroborated in vivo during growth on various sugars by chromatin immunoprecipitation (ChIP) coupled to PCR (Fig. SF3). Control experiments and structural modeling indicated that the epitope tagging of GlpR used for these in vivo binding assays did not impact the activity of the protein (Fig. SF4). Together with the gene expression data, these in vitro and in vivo binding assays suggest a specific binding interaction between GlpR and target promoters, and hence direct regulation of the expression of operons involved in carbohydrate metabolism and transcriptional regulation.
Multiple C/A-rich motifs are detectable upstream of GlpR-regulated genes.
In electrophoretic mobility shift assay (EMSA) experiments, we observed up to three shifted GlpR-DNA complexes, suggesting multiple GlpR binding sites within the PglpR-pfkB promoter region (Fig. 6B and 7). Multiple GlpR binding sites in target promoters have also been observed in other organisms, where GlpR also functions as a tetramer (18, 20). To determine a consensus binding sequence for GlpR, two strategies of de novo motif prediction were performed. In one search, sequences from GlpR-regulated promoters conserved across species of the Haloferax genus were used as input (e.g., Pfba and PglpR; see Materials and Methods [25]). In the second search, sequences upstream of genes differentially expressed in the H. volcanii ΔglpR mutant strain were used as input (Tables ST1 and ST4). In the two searches, highly similar C/A-rich motifs were identified throughout the genome, with the first search identifying a 26-bp motif that encompassed the motif identified in the second search (Fig. 8A and Table ST4). Putative binding motifs were detected upstream of eight of the genes that were differentially expressed in response to glpR deletion (Fig. 3, 4, and 8B). GlpR also bound to DNA regions upstream of seven of these eight genes in vitro and/or in vivo (Fig. 6, 7, 8B, and SF3). Most of these direct GlpR targets with binding motifs were located within the glpR-to-fba gene cluster (Fig. 8C). Within intergenic regions upstream of glpR, ptfC, and fba, multiple binding motifs flanked the putative BRE/TATA promoter sequences (Fig. 8C), corroborating the microarray evidence for GlpR repression of these genes during glycerol and glucose growth (Fig. 3 and 4). Interestingly, sites within the ptfC and ptfB coding regions were also detected, suggestive of repression, and consistent with reports in bacteria of DNA wrapping by tetrameric GlpR at multiple binding sites within gene bodies (22). Together, these motif data suggest that GlpR directly regulates genes encoding functions in fructose degradation and uptake, perhaps by binding to multiple C/A-rich motifs for transcriptional repression.
FIG 8.

GlpR binds a C/A-rich motif located upstream of genes involved in fructose uptake and degradation as well as transcription. (A) Motif logo for computationally identified GlpR binding site (see Table ST4 for a full listing of motifs identified across the genome). (B) Venn diagram representing the number of genes differentially expressed (DEG) in the ΔglpR knockout mutant whose upstream regions are also directly bound by GlpR and contain the identified binding motif sequence upstream. The identities of the 7 genes in the three-way intersection of the diagram are given in the table at the right. ID, identification. (C) Locations of motifs identified in the glpR-fba operon. The scale bar indicates the distance from the start of the region of interest (400 bp upstream of glpR). See the key at the bottom right for colors and shapes. Wider pink binding-site boxes represent the full 26-bp motif, while the narrower boxes represent the shorter motif.
Reporter assays verify that C/A-rich motifs are required for GlpR-mediated regulation.
Guided by the microarray results and computational motif detection, we reasoned that the C/A-rich motif may serve as a GlpR cis-regulatory binding recognition sequence to repress target genes in the absence of fructose. To test this hypothesis, we performed reporter assays with wild-type and mutagenized Pfba translationally/transcriptionally fused to β-galactosidase (Fig. 9A). The expression of fusions encompassing the full Pfba promoter region (pJAM140) was significantly higher in the H26 parent control strain grown on fructose than that grown on glucose or glycerol (Fig. 9B; P values of significance listed in Table ST5). Consistent with a GlpR repression mechanism, the expression of Pfba from pJAM140 was significantly higher in the ΔglpR mutant than in the parent (H26) and GlpR-HA (JM2) control strains when grown on glycerol or glucose (Fig. 9B). Furthermore, Pfba expression from pJAM140 during growth on fructose was not significantly different between the ΔglpR mutant and control strains (Fig. 9B). Across conditions, Pfba activity from pJAM140 was indistinguishable in the ΔglpR mutant strain (Table ST5) and was not significantly different between the parent (H26) and control (JM2) strains (Table ST5). Together, these data suggest that GlpR is required for the repression of Pfba during growth on glucose and glycerol. This repression is relieved in a fructose-dependent manner.
FIG 9.

A conserved GlpR-dependent operator motif identified upstream of Haloferax fba (encoding fructose bisphosphate aldolase) is required for repression on glucose and glycerol. (A) Multiple-DNA-sequence alignment of the intergenic region 3′ of Haloferax fba genes and the corresponding plasmids used to examine H. volcanii fba expression in a β-galactosidase reporter gene assay. A sequence logo representation of the consensus sequence of the GlpR-dependent operator region identified by computational analysis (see also Fig. 8) is indicated at the bottom. Database identifiers for the Haloferax fba genes are indicated on the right (homolog or accession number), including H. volcanii DS2 (HVO_1494), H. gibbonsii ARA6 (ABY42_RS07265), H. mediterranei ATCC 33500 (HFX_RS07625), H. massiliensis (CQR50001), Haloferax sp. strain SB3 (KTG13893), H. denitrificans ATCC 35960 (EMA01358), H. sulfurifontis ATCC BAA-897 (ELZ97756), Haloferax sp. strain ATB1 (WP_042664492), Haloferax sp. strain Q22 (WP_058827302), H. prahovense DSM 18310 (ELZ71125), and H. elongans ATCC BAA-1513 (ELZ86126). Conserved nucleotides are highlighted: black (general), green (TFB-responsive element BRE, CRnAAT consensus), purple (TATA box, TTTAWA consensus), blue (translation start codon), or red (stop codon of upstream gene), where W is A or T, R is A or G, and n is any nucleotide base. Inverted repeat elements predicted using the RNAfold web server (http://rna.tbi.univie.ac.at/cgi-bin/RNAWebSuite/RNAfold.cgi) are indicated by arrows and parentheses. Plasmids pJAM3405 and pJAM3407 have site-directed mutations, as indicated by C→T (blue dots) or A→T (red dots). Plasmid pJAM140 carries Pfba DNA corresponding to GenBank accession no. CP001956.1 (positions 1364060 to 1364252). (B) Bar plot of GlpR-dependent Pfba expression based on β-galactosidase reporter (bgaH) gene assay. H. volcanii parent (H26, dark-gray bars), GlpR-HA control strain (JM2, light-gray bars), and KS8 (ΔglpR mutant, white bars) strains ectopically expressed the reporter gene from the full-length H. volcanii Pfba promoter region (pJAM140), as indicated in panel A. Strains were grown to log phase in glycerol, fructose, or glucose minimal medium, lysed, and analyzed for β-galactosidase activity, as indicated. Each bar reports normalized β-galactosidase activity (least-square means, log transformed). Error bars represent the standard error of the mean. Overbars report P values of significance from Tukey post hoc tests (see Materials and Methods). All pairwise significance tests were performed but not shown for simplicity. P values of all tests and raw data (including basal expression levels from empty vector control plasmid pJAM2715) are given in Table ST5. (C) Bar plot and significance of ectopic expression of the reporter gene from various Pfba promoter region fragments (pJAM140, pJAM3405, and pJAM3407 [see also panel A]) across strains. Each bar reports normalized β-galactosidase activity (least-square means, log transformed). Error bars represent the standard error of the mean. Raw data, including basal expression levels from empty vector control plasmid (pJAM2715), are given in Table ST5.
The effect of promoter mutations on GlpR-dependent repression were compared to Pfba expression driven by the full promoter region (pJAM140) during growth on glycerol across the ΔglpR mutant, H26, and JM2 strains. Repression was partially relieved by the deletion of promoter distal sequences (pJAM3404) (Fig. 9A), although the expression of Pfba from pJAM3404 was still significantly higher in the ΔglpR mutant background than in the parent H26 strain (Fig. 9C and Table ST5). In contrast, site-directed mutagenesis of specific conserved C and A residues in the promoter distal C/A motif (pJAM3405) led to significant derepression of Pfba in H26 and JM2 control strain backgrounds, such that expression differences between the ΔglpR mutant and control strains were no longer detectable (Fig. 9A and C). Site-directed mutagenesis of the downstream half-site had no additional effect on activity (expression in pJAM3405 versus pJAM3407 was not significantly different regardless of strain background; Table ST5). Pfba activity was significantly different between pJAM3404 and pJAM3407 constructs in the ΔglpR mutant background but not between pJAM3405 and pJAM3407. Furthermore, activity was indistinguishable between the parent (H26) and control (JM2) strains across plasmids (Table ST5), providing an additional control for the assay. Taken together, these data suggest that GlpR represses the Pfba promoter during growth on glycerol by binding to the C/A-rich motif. The promoter is derepressed in a GlpR- and fructose-dependent manner. These data support our model that (i) GlpR is a repressor of fructose metabolism when fructose is not present in the environment and (ii) the two C/A-rich motifs of the fba promoter region are required for GlpR-dependent regulation.
DISCUSSION
Our previous work identified the GlpR transcription factor as a putative regulator of carbohydrate utilization pathways in the archaeal model organism H. volcanii (10). Here, we integrated evidence from gene expression and DNA binding experiments with computational motif detection and metabolic network analysis to demonstrate how GlpR may control these pathways (Fig. 10). Taken together, these data suggest that GlpR directly regulates genes encoding enzymes that function in fructose and glycerol uptake and degradation in response to nutrient availability (Fig. 10). In addition, GlpR may regulate other pathways through the direct regulation of other transcription factors. Specifically, our microarray and in vitro binding assays reveal that GlpR binds and regulates the promoter regions of genes copG and trmB, encoding putative transcription factors (Fig. 3, 4, and 7; also see Table ST1 in the supplemental material). A putative GlpR binding motif is also detected in the trmB promoter (Fig. 8B). The TrmB family of transcriptional regulators is conserved among archaea and has been shown to regulate genes involved in maltose, trehalose, and glucose uptake and metabolism (26–28). TrmB of Halobacterium salinarum regulates central metabolism and other pathways in response to nutrient availability, particularly glucose (28–30). By homology, trmB (HVO_1272) of H. volcanii might play a role in transcriptional regulation of genes encoding metabolic enzymes or other cellular functions indirectly regulated by GlpR.
FIG 10.

Metabolic reconstruction integrated with the GlpR regulatory network. Pathways for fructose, glucose, and glycerol degradation are shown overlaid with differential gene expression data in the ΔglpR mutant background and GlpR binding data (see key at bottom right). Abbreviations are as in Fig. 1. G6P, glucose-6-phosphate; Pgi, phosphoglucose isomerase; Fbp, fructose bisphosphatase.
In H. volcanii and possibly other sugar-degrading halophiles, fructose is degraded via a modified EMP pathway, glucose is oxidized via the spED pathway, and glycerol is degraded via glycerol-3-P and DHAP (Fig. 1) (4). Fructose bisphosphate aldolase (FBA) is thought to act as a central control point in the gluconeogenesis and fructose degradation pathways (4, 5), and here, we have identified a new GlpR-regulated promoter (Pfba) that is distinct from previously identified promoters expressing the glpR-pfkB-ptfCA-ptsH1I-ptfB operon (Fig. 8 and 9) (5). In H. volcanii, GlpR regulation of carbon source degradation/uptake pathways appears to end at 3-phosphoglycerate (3PG; Fig. 10), suggesting constitutive or alternative regulation of the lower shunt of glycolysis in response to the carbon source. Thus, the data reported here are consistent with the hypothesis that GlpR regulates the expression of genes encoding enzymes in the uptake and early steps of degradation of alternative carbon sources during growth on glucose or glycerol (Fig. 10). This expands our knowledge regarding the regulation of central metabolism in archaea.
The function of GlpR in H. volcanii appears to differ from that of the GlpR homolog in H. mediterranei, a closely related species (23, 25). Cai and colleagues (23) performed a global analysis of GlpR function after growth of H. mediterranei on complex medium supplemented with fructose or glucose. By this approach, GlpR was found to be required to activate transcript levels of glpR-pfkB and ptfCA-ptsH1I-ptfB (and not fba) in the presence of fructose. Among these genes, only the promoter upstream of ptfCA-ptsH1I-ptfB (PptfC) was directly activated by GlpR during growth on fructose. In contrast, in H. volcanii, our study found that GlpR is a direct repressor of several genes encoding enzymes in the fructose uptake and degradation pathway during growth on glucose and glycerol, including fba.
Specifically, here, we provide in vivo and in vitro evidence that GlpR directly represses genes encoding fructose uptake and degradation (encoded by glpR-pfkB, ptfC, fba, [5]) and the transport of alternative carbon sources (lctP) but directly activates genes in glycerol metabolism (glpK [7]). lctP, which forms an apparent operon with the adenine phosphoribosyltransferase gene hpt, encodes a putative permease that bears structural similarity to 1-carboxylate permeases from bacteria (Fig. SF1). LctP is likely important for metabolism. Although GlpR regulation most strongly influences the expression levels of the fructose pathway and lctP genes (Fig. 3 and 4), our in vitro gel shift assays and motif analysis corroborate the binding of GlpR to promoter regions encoding the glycerol pathway (e.g., glpK) (Fig. 7, 8, and 10). We conclude that GlpR is a direct regulator of multiple carbohydrate utilization pathways.
We provide evidence for the mechanism by which GlpR accomplishes this regulation. GlpR purifies as a tetramer (Fig. 5), which may bind to C/A-rich motifs in vivo, repressing genes encoding fructose uptake and degradation functions (e.g., FBA) during growth on glucose and glycerol (Fig. 3, 4, 8, and 9). GlpR binds F1P in vitro as the specific small-molecule effector (Fig. 5 and Table 1), which likely disengages GlpR from DNA (Fig. SF2), relieving repression when F1P becomes available in the presence of fructose (Fig. 4 and 9). A homotetrameric arrangement is common for bacterial DeoR-type regulators (20, 31, 32). The F1P effector is a metabolic intermediate of fructose catabolism at an important regulatory point of the modified EMP pathway in halophilic archaea (4). In vitro, F1P may dissociate GlpR-DNA complexes at fructose metabolic operator regions (glpR-pfkB) (Fig. SF2). In vivo, growth on fructose derepresses Pfba in a GlpR- and C/A sequence-dependent manner. Together, these data are consistent with the bacterial DeoR family mechanism in which a phosphorylated sugar intermediate dissociates the transcription factor (TF) from DNA (11, 12, 16, 18, 19). For example, in the Gram-positive bacterium Corynebacterium glutamicum, F1P binds the DeoR-type transcription factor SugR, causing derepression of the PTS system for uptake of fructose and sucrose (18, 33). F1P is an effector that governs central metabolism and redox control in a variety of bacteria (33, 34). In summary, the results presented here suggest that H. volcanii GlpR functions as a direct transcriptional regulator of carbohydrate metabolic pathways using a mechanism conserved with bacterial DeoR family transcription factors.
MATERIALS AND METHODS
Strains, media, and plasmids.
The strains and plasmids used in this study are summarized in Table ST6 in the supplemental material. The oligonucleotide primers used for PCR are listed Table ST7. Escherichia coli TOP10 was used for routine recombinant DNA experiments. E. coli GM2163 was used for isolation of the plasmid DNA transformed into H. volcanii strains according to standard methods (35). The GlpR-hemagglutinin (HA) epitope-tagged strain (JM2) was constructed from the H26 parent strain using the pyrE2-based “pop-in/pop-out” method (36, 37). The HA tag was inserted in frame at the 3′ end of the glpR (HVO_1501) gene locus in the H. volcanii chromosome. Structural modeling, control Western blots, and promoter-reporter fusion assays were used to indicate that the HA tag did not interfere with wild-type activity of GlpR (Fig. SF4 and 9). E. coli strains were grown at 37°C in Luria-Bertani medium supplemented with ampicillin (100 μg · ml−1) and kanamycin (50 μg · ml−1) as needed to maintain the plasmids. H. volcanii strains were grown at 42°C in Casamino Acids (CA), ATCC 974 (tryptone-yeast extract) medium, and minimal medium (MM) with glycerol, glucose, or fructose, as indicated in the text and figures. Medium formulae were according to The Halohandbook (35), with the following exception: glycerol, glucose, or fructose was the sole carbon source at 20 mM. H. volcanii media were supplemented with novobiocin (0.1 μg · ml−1), 5-fluoroorotic acid (5-FOA; 50 μg · ml−1), and uracil (10 and 50 μg · ml−1 for growth in the presence and absence of 5-FOA, respectively) as needed. Uracil and 5-FOA were solubilized in 100% (vol/vol) dimethyl sulfoxide (DMSO) at 50 mg · ml−1 prior to addition to the growth medium. Solid medium included agar at 15% (wt/vol). All liquid cultures were aerated with orbital shaking at 200 rpm. Cells were freshly inoculated in ice from −80°C glycerol stocks onto solid medium using a toothpick. Isolated colonies were used for inoculum into initial liquid cultures. Cells were subcultured twice to logarithmic-growth phase prior to culture for RNA extraction. Cell growth was monitored by an increase in optical density at 600 nm (OD600; where 1 OD600 unit equals approximately 1 × 10⁹ CFU · ml−1 for all strains used in this study). All experiments were performed at least in triplicate.
Microarray hybridization.
H26 and KS8 (H26 ΔglpR) were grown aerobically in glycerol MM or glucose MM in 10-ml cultures at 42°C and 200 rpm shaking to logarithmic-growth phase (OD600, 0.3 to 0.5). Total RNA was extracted from three biological replicate cultures, each from three pooled 10-ml technical replicate cultures, under each condition using TRI-reagent (Sigma-Aldrich), according to the manufacturer's instructions. RNA quality was ensured using an Agilent Bioanalyzer 2100. Double-stranded cDNA libraries were created from the extracted RNA using the Superscript cDNA synthesis kit, according to the manufacturer's instructions (Invitrogen). One microgram of cDNA from each biological replicate was labeled with Cy3 dye and hybridized to NimbleGen 12 × 135-k feature single-color custom microarray slides (Roche NimbleGen, Inc.), with each 135-k array containing 98% of the annotated genes in the H. volcanii genome (56). Microarray hybridization and scanning were conducted at a FSU-NimbleGen-certified facility (The Florida State University, Tallahassee, FL). For each gene, 96 replicate data points were measured (32 replicate probes per gene per array, with 3 biological replicate hybridizations per sample).
Microarray data analysis.
Raw spot intensities were first normalized within arrays using RMA (38) and then normalized to quantiles of the distribution across arrays using the ANAIS online server (http://anais.versailles.inra.fr/normalization.html) (39). The four replicate probes corresponding to the same gene were averaged following normalization using the R limma package (40). Processed data were analyzed for significant differential expression using 2-factor analysis of variance (ANOVA) comparing expression between (i) strains (wild type [WT] versus ΔglpR mutant) and (ii) growth conditions (glycerol versus glucose). Genes with a P value ≤0.01 were considered significant in differential expression in response to the glpR deletion, carbon source, or both. Intensity data are reported for biological triplicate experiments, which were averaged for each gene. Log10 expression ΔglpR-to-WT ratios are reported in Table ST1.
Normalized intensities (mean = 0 and standard deviation = 1 for each gene across strains and conditions) are reported in Fig. 3. Differentially expressed gene lists were subjected to hierarchical clustering using Pearson complete linkage correlation and the tree cut at five branches. The clustering results are presented in the heat map in Fig. 3. These analyses were conducted in the R statistical coding environment using the packages stats (41), dendextend (42), and gplots (43). Gene annotations (24, 44, 56) for members of each cluster are presented in Table ST3. Significant enrichment in gene functional categories according to the archaeal clusters of orthologous genes (arCOG) ontology (24) was determined using the hypergeometric test in the R statistical analysis environment, as previously described (45, 46), with the code freely available at https://github.com/amyschmid/histone_arCOG.
Computational prediction of GlpR binding sequence.
GlpR-regulated genes were tested for a binding motif in two orthogonal searches. In the first search, protein homologs of H. volcanii FBA (HVO_1494), GlpR (HVO_1501), and PtfC (HVO_1499) were retrieved for members of the Haloferax genus by the Basic Local Alignment Search Tool using BLASTP (protein-protein BLAST) (47). The DNA sequences in the 5′ direction of the genes encoding these homologs were retrieved using the graphics tool within the NCBI nucleotide portal (https://www.ncbi.nlm.nih.gov/nuccore/). In the second search, 400-bp sequences upstream of H. volcanii genes differentially expressed in response to glpR deletion (Table ST1) and bound directly by GlpR in binding assays (Fig. 6, 7, SF2, and SF3) were used as input. In both searches, de novo motif detection was performed using the MEME Suite version 4.12.0 (48), with the following parameters: any number of repeats, max width of 20 to 26 bp, and 3 output motifs. The strongest resultant motif (the motif from the second search is encompassed by the first) is reported in Fig. 8A. Compared to shuffled sequences, this motif was highly significant (Wilcoxon signed-rank test, P < 5.291 × 10⁻¹⁴). MAST and FIMO algorithms from the MEME Suite were used to scan the H. volcanii genome (uid12524 version 210 within the GenBank Bacteria Genomes and Proteins database) for additional putative targets of GlpR binding. The results of genome scanning are given in Table ST4.
Transcriptional reporter construction, assay, and statistical analysis.
A plasmid-based reporter system was used to analyze transcription from promoter regions of Pfba and control promoters by fusion to the Haloferax alicantei-derived bgaH encoding β-galactosidase (10). All plasmids used in this study are listed in Table ST6, and all primers are listed in Table ST7. For the construction of pJAM140, the region of interest was amplified from H. volcanii DS70 genomic DNA by PCR. PCR products were fused to bgaH using XbaI and NdeI sites of plasmid pJAM2678. Plasmid pJAM3404 was generated by PCR using pJAM140 as the template. PCR based site-directed mutagenesis was applied to generate the plasmids pJAM3405 and pJAM3407 containing the variants of Pfba. In brief, pJAM3404 was used as the template to construct the plasmids by reverse PCR. The PCR amplicon was treated with DpnI restriction enzyme (NEB) followed by T4 polynucleotide kinase, as recommended by the supplier (NEB). The product was circularized by T4 ligase (NEB) and transformed into E. coli TOP10 competent cells. The constructed plasmids were confirmed by PCR method and sequencing (Eton Bioscience, San Diego, CA).
The β-galactosidase activity of each construct was assayed quantitatively in logarithmic-growth phase, as described in reference 49. The resultant activity values were normalized to protein concentration as estimated by the Bradford assay (50) and background values, in which no substrate (o-nitrophenyl-β-d-galactopyranoside [ONPG]) was added to the reaction mixture. For each strain across plasmids and conditions, 7 to 19 biological replicate trials were performed.
The resultant data were subjected to log transformation, then analyzed for statistical significance in two separate two-factor ANOVAs, each with an underlying linear regression model. Post hoc analysis of residuals indicated that log transformation was necessary to uphold normality and homoscedasticity assumptions of ANOVA. In the first test, β-galactosidase activity (dependent variable) from the pJAM140 plasmid was compared across strains (JM2, KS8, and H26; first independent variable) and across conditions (glucose, glycerol, fructose; second independent variable). In the second test, β-galactosidase activity was compared across plasmids (pJAM140, pJAM3405, and pJAM3407) and strains under glycerol conditions. P values from pairwise Tukey post hoc tests of significant differences between means of groups determined by ANOVA to have main effects on the dependent variable are reported in Fig. 9 and Table ST5. Given the unbalanced nature of the underlying data (i.e., different numbers of replicates across groups), least-square means of log-transformed data are reported in Fig. 9. Analyses were conducted in the R coding environment using the packages car (51), Rmisc, and lsmeans (52). Bar graphs were generated using the package ggplot2 (53).
Protein purification.
A His6 tag fusion strategy was used that incorporated tandem Ni2+-affinity and size-exclusion chromatography. High salt concentration (2 M NaCl) was maintained throughout the purification to maintain halophilic protein structure. The purity of the preparation was based on total protein staining (Sypro Ruby and Coomassie blue) and anti-His tag immunoblotting of the GlpR protein separated by reducing SDS-PAGE. H. volcanii KS8-pJAM124 strain (ΔglpR mutant carrying glpR-His6 gene in trans) was grown to stationary phase (4 × 1-liter cultures in 2.8-liter Fernbach flasks). Cells were harvested by centrifugation (6,700 × g for 10 min, 4 °C). Cell pellets were resuspended in 60 ml Tris-salt-low-imidazole buffer (2 M NaCl, 50 mM Tris-HCl [pH 8.0], 40 mM imidazole). The cells were lysed by passage through a French press (4×, 2,000 lb/in2). Cell lysate was clarified by centrifugation (20,000 × g for 30 min, 4°C) and sequential filtration through 0.8-μm and 0.45-μm cellulose acetate filters (Fisher Scientific). Sample was applied at a flow rate of 5 ml · min−1 to a HisTrap high-performance (HP) column (5 ml; GE Healthcare) equilibrated with Tris-salt-low-imidazole buffer and washed with ∼5 column volumes of the same buffer. GlpR-His6 was eluted from the column with high-imidazole buffer (2 M NaCl, 50 mM Tris-HCl [pH 8.0], 500 mM imidazole) at a flow rate of 1 ml · min−1, and 1-ml eluate fractions were collected. Fractions (9 to 13) containing GlpR-His6 were combined and concentrated with Amicon Ultra 15-ml centrifugal filters (10-kDa molecular weight cutoff [MWCO]; Merck Millipore) by centrifugation at 3,900 × g in a swinging bucket rotor (75 min total, 4°C). The concentrated protein sample was filtered (0.45 μm), and sample (500 μl) was injected onto a gel filtration column (Superdex 200 HR 10/30; GE Healthcare) equilibrated with Tris-salt buffer (2 M NaCl, 50 mM Tris-HCl [pH 8.0]). Eluate was collected in 0.5-ml fractions at a flow rate of 0.3 ml · min−1. Fractions (29 to 34) containing GlpR-His6 were pooled, concentrated, filtered, and reinjected onto the gel filtration column, as mentioned above. Protein quantification was performed using a bicinchoninic acid (BCA) assay, according to the supplier (Pierce, Rockford, IL). GlpR-His6 purity was assessed by SDS-PAGE under reducing conditions and subsequent Coomassie blue staining.
Differential scanning fluorimetry.
DSF was adapted from Niesen et al. (54), with the following modifications. Purified GlpR-His6 (1 μM) was mixed with 0.1 mM small molecule (Table 1) in Tris-salt buffer (2 M NaCl, 50 mM Tris-HCl [pH 8.0]) with 1× Sypro Orange (Invitrogen). The mixtures with Sypro Orange were maintained in the dark. Aliquots of the mixtures (40 μl) were transferred to a 96-well PCR microplate and incubated for 10 min at room temperature, followed by a temperature gradient of 22 to 95°C at 1°C · min−1 using a C1000 thermal cycler (Bio-Rad CX96 real-time system). Fluorescence was scanned for 5 s at temperature increments of 0.2°C. Protein melting temperatures were calculated by melting curve fitting using CFX Manager 2.1 (Bio-Rad). The organic compounds examined for influence on GlpR by DSF included d-fructose 1-phosphate barium salt trihydrate (F1P; catalog no. S408697; Aldrich), d-(−)-fructose (catalog no. CAS 57-48-7; Acros Organics), d-fructose 1,6-bisphosphate tetra(cyclohexylammonium) salt (FBP; catalog no. F0752; Sigma), d-glucose 6-phosphate dipotassium salt hydrate (F6P; catalog no. F1502; Sigma), d-(+)-glucose (catalog no. CAS 50-99-7; Acros Organics), d-gluconic acid sodium salt (gluconate; catalog no. G9005; Sigma), 2-keto-d-gluconic acid hemicalcium salt hydrate (KDG; catalog no. K6250; Sigma), 3-deoxy-2-keto-6-phosphogluconic acid lithium salt (KDGP; catalog no. 79156; Sigma), glycerol (catalog no. G5516; Sigma), sn-glycerol 3-phosphate bis(cyclohexylammonium) salt (G3P; catalog no. G7886; Sigma), dihydroxyacetone phosphate dilithium salt (DHAP; catalog no. D7137; Sigma), d-glyceraldehyde 3-phosphate solution (GAP; catalog no. 39705; Sigma), and sodium pyruvate (pyruvate, catalog no. P2256; Sigma).
Electrophoretic mobility shift DNA binding assays.
DNA probes for EMSAs were generated by PCR using oligonucleotides, as indicated in Table ST7, where one of the primers was 5′ end biotinylated (Integrated DNA Technologies). Prior to use, the 5′-end-labeled probes were purified by DNA agarose gel electrophoresis using a QIAquick gel extraction kit. GlpR-His6 at the indicated concentrations (Fig. 6 and 7; Fig. SF2) was incubated with 1 nM 5′-biotinylated probe in binding buffer (2 M NaCl, 20 mM Tris-acetate [pH 6.0], 2 mM EDTA, 2 mM dithiothreitol [DTT], 15 mM MgCl2, 100 μg · ml−1 bovine serum albumin [BSA], 57 mM 2-mercaptoethanol, 10% [wt/vol] sorbitol) for 30 min at 42°C. After incubation, the reactions were run on a nondenaturing 0.8% (wt/vol) agarose gel in high-salt TBE buffer (pH 6.0; 220 mM Tris base, 945 mM boric acid, 5 mM EDTA) for 34 min at 140 V. After cooling and 30-min equilibration in two changes of ice-cold 0.5× TBE buffer (pH 8.3), DNA and nucleoprotein complexes were transferred to a nylon membrane (BrightStar Plus; Ambion) using the Trans Blot system (Bio-Rad) at 150 V for 6 h. DNA and nucleoprotein complexes were cross-linked to the membrane via UV radiation (UV Stratalinker 2400; Stratagene) and visualized using Phototope-Star (New England BioLabs). The sources of the metabolites used in EMSAs are detailed in “Differential scanning fluorimetry,” above.
Accession number(s).
The microarray platform used in this study was deposited in the NCBI Gene Expression Omnibus (GEO) (55) under accession number GPL21414. Raw and normalized microarray data generated in this study are freely available through NCBI GEO at accession number GSE77589.
Supplementary Material
ACKNOWLEDGMENTS
We acknowledge funding awarded through the U.S. Department of Energy, Office of Basic Energy Sciences, Division of Chemical Sciences, Geosciences and Biosciences, Physical Biosciences Program (grant DE-FG02-05ER15650) to J.A.M.-F.; the National Institutes of Health (grant R01 GM57498) to J.A.M.-F.; and the National Science Foundation (grants MCB-1615685, MCB-1417750, and MCB-1651117) to A.K.S.
We thank S. Shanker at the UF ICBR Genomics Core for Sanger DNA sequencing, Steven Miller at the USF microarray facility for technical assistance with transcriptomics data, and Peter Tonner for statistical advice.
We declare no conflicts of interest.
Footnotes
Supplemental material for this article may be found at https://doi.org/10.1128/JB.00244-18.
REFERENCES
- 1.Mullakhanbhai MF, Larsen H. 1975. Halobacterium volcanii spec. nov., a Dead Sea halobacterium with a moderate salt requirement. Arch Microbiol 104:207–214. doi: 10.1007/BF00447326. [DOI] [PubMed] [Google Scholar]
- 2.Jantzer K, Zerulla K, Soppa J. 2011. Phenotyping in the archaea: optimization of growth parameters and analysis of mutants of Haloferax volcanii. FEMS Microbiol Lett 322:123–130. doi: 10.1111/j.1574-6968.2011.02341.x. [DOI] [PubMed] [Google Scholar]
- 3.Leigh JA, Albers SV, Atomi H, Allers T. 2011. Model organisms for genetics in the domain Archaea: methanogens, halophiles, Thermococcales and Sulfolobales. FEMS Microbiol Rev 35:577–608. doi: 10.1111/j.1574-6976.2011.00265.x. [DOI] [PubMed] [Google Scholar]
- 4.Bräsen C, Esser D, Rauch B, Siebers B. 2014. Carbohydrate metabolism in Archaea: current insights into unusual enzymes and pathways and their regulation. Microbiol Mol Biol Rev 78:89–175. doi: 10.1128/MMBR.00041-13. [DOI] [PMC free article] [PubMed] [Google Scholar]
- 5.Pickl A, Johnsen U, Schönheit P. 2012. Fructose degradation in the haloarchaeon Haloferax volcanii involves a bacterial type phosphoenolpyruvate-dependent phosphotransferase system, fructose-1-phosphate kinase, and class II fructose-1,6-bisphosphate aldolase. J Bacteriol 194:3088–3097. doi: 10.1128/JB.00200-12. [DOI] [PMC free article] [PubMed] [Google Scholar]
- 6.Sutter JM, Tastensen JB, Johnsen U, Soppa J, Schonheit P. 2016. Key enzymes of the semiphosphorylative Entner-Doudoroff pathway in the haloarchaeon Haloferax volcanii: characterization of glucose dehydrogenase, gluconate dehydratase, and 2-keto-3-deoxy-6-phosphogluconate aldolase. J Bacteriol 198:2251–2262. doi: 10.1128/JB.00286-16. [DOI] [PMC free article] [PubMed] [Google Scholar]
- 7.Rawls KS, Martin JH, Maupin-Furlow JA. 2011. Activity and transcriptional regulation of bacterial protein-like glycerol-3-phosphate dehydrogenase of the haloarchaea in Haloferax volcanii. J Bacteriol 193:4469–4476. doi: 10.1128/JB.00276-11. [DOI] [PMC free article] [PubMed] [Google Scholar]
- 8.Ouellette M, Makkay AM, Papke RT. 2013. Dihydroxyacetone metabolism in Haloferax volcanii. Front Microbiol 4:376. doi: 10.3389/fmicb.2013.00376. [DOI] [PMC free article] [PubMed] [Google Scholar]
- 9.Sherwood KE, Cano DJ, Maupin-Furlow JA. 2009. Glycerol-mediated repression of glucose metabolism and glycerol kinase as the sole route of glycerol catabolism in the haloarchaeon Haloferax volcanii. J Bacteriol 191:4307–4315. doi: 10.1128/JB.00131-09. [DOI] [PMC free article] [PubMed] [Google Scholar]
- 10.Rawls KS, Yacovone SK, Maupin-Furlow JA. 2010. GlpR represses fructose and glucose metabolic enzymes at the level of transcription in the haloarchaeon Haloferax volcanii. J Bacteriol 192:6251–6260. doi: 10.1128/JB.00827-10. [DOI] [PMC free article] [PubMed] [Google Scholar]
- 11.Amouyal M, Mortensen L, Buc H, Hammer K. 1989. Single and double loop formation when deoR repressor binds to its natural operator sites. Cell 58:545–551. doi: 10.1016/0092-8674(89)90435-2. [DOI] [PubMed] [Google Scholar]
- 12.Zeng G, Ye S, Larson TJ. 1996. Repressor for the sn-glycerol 3-phosphate regulon of Escherichia coli K-12: primary structure and identification of the DNA-binding domain. J Bacteriol 178:7080–7089. doi: 10.1128/jb.178.24.7080-7089.1996. [DOI] [PMC free article] [PubMed] [Google Scholar]
- 13.Larson TJ, Cantwell JS, van Loo-Bhattacharya AT. 1992. Interaction at a distance between multiple operators controls the adjacent, divergently transcribed glpTQ-glpACB operons of Escherichia coli K-12. J Biol Chem 267:6114–6121. [PubMed] [Google Scholar]
- 14.Sakakibara Y, Saha BC. 2008. Isolation of an operon involved in xylitol metabolism from a xylitol-utilizing Pantoea ananatis mutant. J Biosci Bioeng 106:337–344. doi: 10.1263/jbb.106.337. [DOI] [PubMed] [Google Scholar]
- 15.Elgrably-Weiss M, Schlosser-Silverman E, Rosenshine I, Altuvia S. 2006. DeoT, a DeoR-type transcriptional regulator of multiple target genes. FEMS Microbiol Lett 254:141–148. doi: 10.1111/j.1574-6968.2005.00020.x. [DOI] [PubMed] [Google Scholar]
- 16.van Rooijen RJ, de Vos WM. 1990. Molecular cloning, transcriptional analysis, and nucleotide sequence of lacR, a gene encoding the repressor of the lactose phosphotransferase system of Lactococcus lactis. J Biol Chem 265:18499–18503. [PubMed] [Google Scholar]
- 17.Peng X, Okai N, Vertès AA, Inatomi K, Inui M, Yukawa H. 2011. Characterization of the mannitol catabolic operon of Corynebacterium glutamicum. Appl Microbiol Biotechnol 91:1375–1387. doi: 10.1007/s00253-011-3352-x. [DOI] [PubMed] [Google Scholar]
- 18.Gaigalat L, Schlüter JP, Hartmann M, Mormann S, Tauch A, Pühler A, Kalinowski J. 2007. The DeoR-type transcriptional regulator SugR acts as a repressor for genes encoding the phosphoenolpyruvate:sugar phosphotransferase system (PTS) in Corynebacterium glutamicum. BMC Mol Biol 8:104. doi: 10.1186/1471-2199-8-104. [DOI] [PMC free article] [PubMed] [Google Scholar]
- 19.Hirooka K, Kodoi Y, Satomura T, Fujita Y. 2015. Regulation of the rhaEWRBMA operon involved in l-rhamnose catabolism through two transcriptional factors, RhaR and CcpA, in Bacillus subtilis. J Bacteriol 198:830–845. doi: 10.1128/JB.00856-15. [DOI] [PMC free article] [PubMed] [Google Scholar]
- 20.Larson TJ, Ye SZ, Weissenborn DL, Hoffmann HJ, Schweizer H. 1987. Purification and characterization of the repressor for the sn-glycerol 3-phosphate regulon of Escherichia coli K12. J Biol Chem 262:15869–15874. [PubMed] [Google Scholar]
- 21.Mortensen L, Dandanell G, Hammer K. 1989. Purification and characterization of the deoR repressor of Escherichia coli. EMBO J 8:325–331. [DOI] [PMC free article] [PubMed] [Google Scholar]
- 22.Yang B, Larson TJ. 1996. Action at a distance for negative control of transcription of the glpD gene encoding sn-glycerol 3-phosphate dehydrogenase of Escherichia coli K-12. J Bacteriol 178:7090–7098. doi: 10.1128/jb.178.24.7090-7098.1996. [DOI] [PMC free article] [PubMed] [Google Scholar]
- 23.Cai L, Cai S, Zhao D, Wu J, Wang L, Liu X, Li M, Hou J, Zhou J, Liu J, Han J, Xiang H. 2014. Analysis of the transcriptional regulator GlpR, promoter elements, and posttranscriptional processing involved in fructose-induced activation of the phosphoenolpyruvate-dependent sugar phosphotransferase system in Haloferax mediterranei. Appl Environ Microbiol 80:1430–1440. doi: 10.1128/AEM.03372-13. [DOI] [PMC free article] [PubMed] [Google Scholar]
- 24.Wolf YI, Makarova KS, Yutin N, Koonin EV. 2012. Updated clusters of orthologous genes for Archaea: a complex ancestor of the Archaea and the byways of horizontal gene transfer. Biol Direct 7:46. doi: 10.1186/1745-6150-7-46. [DOI] [PMC free article] [PubMed] [Google Scholar]
- 25.Becker EA, Seitzer PM, Tritt A, Larsen D, Krusor M, Yao AI, Wu D, Madern D, Eisen JA, Darling AE, Facciotti MT. 2014. Phylogenetically driven sequencing of extremely halophilic archaea reveals strategies for static and dynamic osmo-response. PLoS Genet 10:e1004784. doi: 10.1371/journal.pgen.1004784. [DOI] [PMC free article] [PubMed] [Google Scholar]
- 26.Kanai T, Akerboom J, Takedomi S, van de Werken HJ, Blombach F, van der Oost J, Murakami T, Atomi H, Imanaka T. 2007. A global transcriptional regulator in Thermococcus kodakaraensis controls the expression levels of both glycolytic and gluconeogenic enzyme-encoding genes. J Biol Chem 282:33659–33670. doi: 10.1074/jbc.M703424200. [DOI] [PubMed] [Google Scholar]
- 27.Lee SJ, Engelmann A, Horlacher R, Qu Q, Vierke G, Hebbeln C, Thomm M, Boos W. 2003. TrmB, a sugar-specific transcriptional regulator of the trehalose/maltose ABC transporter from the hyperthermophilic archaeon Thermococcus litoralis. J Biol Chem 278:983–990. doi: 10.1074/jbc.M210236200. [DOI] [PubMed] [Google Scholar]
- 28.Schmid AK, Reiss DJ, Pan M, Koide T, Baliga NS. 2009. A single transcription factor regulates evolutionarily diverse but functionally linked metabolic pathways in response to nutrient availability. Mol Syst Biol 5:282. doi: 10.1038/msb.2009.40. [DOI] [PMC free article] [PubMed] [Google Scholar]
- 29.Todor H, Gooding J, Ilkayeva OR, Schmid AK. 2015. Dynamic metabolite profiling in an archaeon connects transcriptional regulation to metabolic consequences. PLoS One 10:e0135693. doi: 10.1371/journal.pone.0135693. [DOI] [PMC free article] [PubMed] [Google Scholar]
- 30.Todor H, Sharma K, Pittman AM, Schmid AK. 2013. Protein-DNA binding dynamics predict transcriptional response to nutrients in archaea. Nucleic Acids Res 41:8546–8558. doi: 10.1093/nar/gkt659. [DOI] [PMC free article] [PubMed] [Google Scholar]
- 31.Garces F, Fernández FJ, Gómez AM, Pérez-Luque R, Campos E, Prohens R, Aguilar J, Baldomà L, Coll M, Badía J, Vega MC. 2008. Quaternary structural transitions in the DeoR-type repressor UlaR control transcriptional readout from the l-ascorbate utilization regulon in Escherichia coli. Biochemistry 47:11424–11433. doi: 10.1021/bi800748x. [DOI] [PubMed] [Google Scholar]
- 32.Ray WK, Larson TJ. 2004. Application of AgaR repressor and dominant repressor variants for verification of a gene cluster involved in N-acetylgalactosamine metabolism in Escherichia coli K-12. Mol Microbiol 51:813–826. doi: 10.1046/j.1365-2958.2003.03868.x. [DOI] [PubMed] [Google Scholar]
- 33.Wang Z, Chan SHJ, Sudarsan S, Blank LM, Jensen PR, Solem C. 2016. Elucidation of the regulatory role of the fructose operon reveals a novel target for enhancing the NADPH supply in Corynebacterium glutamicum. Metab Eng 38:344–357. doi: 10.1016/j.ymben.2016.08.004. [DOI] [PubMed] [Google Scholar]
- 34.Kochanowski K, Gerosa L, Brunner SF, Christodoulou D, Nikolaev YV, Sauer U. 2017. Few regulatory metabolites coordinate expression of central metabolic genes in Escherichia coli. Mol Syst Biol 13:903. doi: 10.15252/msb.20167402. [DOI] [PMC free article] [PubMed] [Google Scholar]
- 35.Dyall-Smith M. 2009. The halohandbook: protocols for halobacterial genetics, version 7.2. http://www.haloarchaea.com/resources/halohandbook/Halohandbook_2009_v7.2mds.pdf.
- 36.Allers T, Ngo HP, Mevarech M, Lloyd RG. 2004. Development of additional selectable markers for the halophilic archaeon Haloferax volcanii based on the leuB and trpA genes. Appl Environ Microbiol 70:943–953. doi: 10.1128/AEM.70.2.943-953.2004. [DOI] [PMC free article] [PubMed] [Google Scholar]
- 37.Bitan-Banin G, Ortenberg R, Mevarech M. 2003. Development of a gene knockout system for the halophilic archaeon Haloferax volcanii by use of the pyrE gene. J Bacteriol 185:772–778. doi: 10.1128/JB.185.3.772-778.2003. [DOI] [PMC free article] [PubMed] [Google Scholar]
- 38.Irizarry RA, Hobbs B, Collin F, Beazer-Barclay YD, Antonellis KJ, Scherf U, Speed TP. 2003. Exploration, normalization, and summaries of high density oligonucleotide array probe level data. Biostatistics 4:249–264. doi: 10.1093/biostatistics/4.2.249. [DOI] [PubMed] [Google Scholar]
- 39.Simon A, Biot E. 2010. ANAIS: analysis of NimbleGen arrays interface. Bioinformatics 26:2468–2469. doi: 10.1093/bioinformatics/btq410. [DOI] [PubMed] [Google Scholar]
- 40.Ritchie ME, Phipson B, Wu D, Hu Y, Law CW, Shi W, Smyth GK. 2015. limma powers differential expression analyses for RNA-sequencing and microarray studies. Nucleic Acids Res 43:e47. doi: 10.1093/nar/gkv007. [DOI] [PMC free article] [PubMed] [Google Scholar]
- 41.R Core Development Team. 2016. R: A language and environment for statistical computing. The R Foundation, Vienna, Austria: https://www.r-project.org/. [Google Scholar]
- 42.Galili T. 2015. dendextend: an R package for visualizing, adjusting and comparing trees of hierarchical clustering. Bioinformatics 31:3718–3720. doi: 10.1093/bioinformatics/btv428. [DOI] [PMC free article] [PubMed] [Google Scholar]
- 43.Warnes GR, Bolker B, Bonebakker L, Gentleman R, Liaw WHA, Lumley T, Maechler M, Magnusson A, Moeller S, Schwartz M, Venables B. 2016. gplots: various R programming tools for plotting data, version 3.0.1. https://cran.r-project.org/package=gplots.
- 44.Pfeiffer F, Broicher A, Gillich T, Klee K, Mejia J, Rampp M, Oesterhelt D. 2008. Genome information management and integrated data analysis with HaloLex. Arch Microbiol 190:281–299. doi: 10.1007/s00203-008-0389-z. [DOI] [PMC free article] [PubMed] [Google Scholar]
- 45.Darnell CL, Schmid AK. 2015. Systems biology approaches to defining transcription regulatory networks in halophilic archaea. Methods 86:102–114. doi: 10.1016/j.ymeth.2015.04.034. [DOI] [PubMed] [Google Scholar]
- 46.Dulmage KA, Todor H, Schmid AK. 2015. Growth-phase-specific modulation of cell morphology and gene expression by an archaeal histone protein. mBio 6:e00649-15. doi: 10.1128/mBio.00649-15. [DOI] [PMC free article] [PubMed] [Google Scholar]
- 47.Altschul SF, Gish W, Miller W, Myers EW, Lipman DJ. 1990. Basic local alignment search tool. J Mol Biol 215:403–410. doi: 10.1016/S0022-2836(05)80360-2. [DOI] [PubMed] [Google Scholar]
- 48.Bailey TL, Johnson J, Grant CE, Noble WS. 2015. The MEME Suite. Nucleic Acids Res 43:W39–W49. doi: 10.1093/nar/gkv416. [DOI] [PMC free article] [PubMed] [Google Scholar]
- 49.Holmes ML, Dyall-Smith ML. 2000. Sequence and expression of a halobacterial β-galactosidase gene. Mol Microbiol 36:114–122. doi: 10.1046/j.1365-2958.2000.01832.x. [DOI] [PubMed] [Google Scholar]
- 50.Bradford MM. 1976. A rapid and sensitive method for the quantitation of microgram quantities of protein utilizing the principle of protein-dye binding. Anal Biochem 72:248–254. doi: 10.1016/0003-2697(76)90527-3. [DOI] [PubMed] [Google Scholar]
- 51.Fox J, Weisberg S. 2011. An R companion to applied regression, 2nd ed Sage Publications, Thousand Oaks, CA. [Google Scholar]
- 52.Lenth RV. 2016. Least-squares means: the R packages lsmeans. J Stat Softw 69:1–33. doi: 10.18637/jss.v069.i01. [DOI] [Google Scholar]
- 53.Wickham H. 2009. ggplot2: elegant graphics for data analysis. Springer-Verlag, New York, NY. [Google Scholar]
- 54.Niesen FH, Berglund H, Vedadi M. 2007. The use of differential scanning fluorimetry to detect ligand interactions that promote protein stability. Nat Protoc 2:2212–2221. doi: 10.1038/nprot.2007.321. [DOI] [PubMed] [Google Scholar]
- 55.Barrett T, Wilhite SE, Ledoux P, Evangelista C, Kim IF, Tomashevsky M, Marshall KA, Phillippy KH, Sherman PM, Holko M, Yefanov A, Lee H, Zhang N, Robertson CL, Serova N, Davis S, Soboleva A. 2013. NCBI GEO: archive for functional genomics data sets–update. Nucleic Acids Res 41:D991–D995. doi: 10.1093/nar/gks1193. [DOI] [PMC free article] [PubMed] [Google Scholar]
- 56.Hartman A, Norais C, Badger J, Delmas S, Haldenby S, Madupu R, Robinson J, Khouri H, Ren Q, Lowe T, Maupin-Furlow J, Pohlschroder M, Daniels C, Pfeiffer F, Allers T, Eisen J. 2010. The complete genome sequence of Haloferax volcanii DS2, a model archaeon. PLoS One 5:e9605. doi: 10.1371/journal.pone.0009605. [DOI] [PMC free article] [PubMed] [Google Scholar]
Associated Data
This section collects any data citations, data availability statements, or supplementary materials included in this article.