Abstract
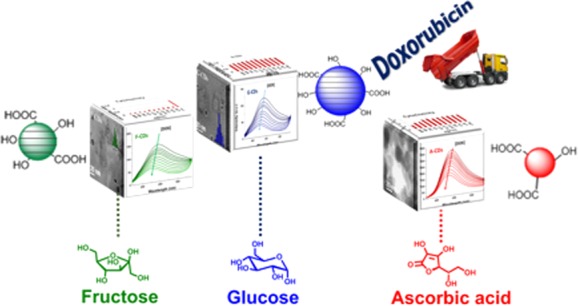
There is the need for reproducible, simple, high-yielding synthetic protocols aimed at obtaining carbon dots (CDs) with controlled fluorescence, photothermal and photochemical behavior, surface properties, biocompatibility, tumor targeting ability, drug absorption biodistribution, and tumor uptake. This Letter describes a systematic study on the effect of glucose, fructose, and ascorbic acid as starting materials for the preparation of highly luminescent CDs, characterized by a blue emission. Their composition and morphology are investigated by titration of OH surface groups, spectroscopic techniques, and high-resolution transmission electron microscopy (HR-TEM), and their toxicity was tested toward HeLa cells. CDs made using fructose were toxic, while those made from glucose and ascorbic acid showed good biocompatibility. The reproducible and simple synthetic procedure yields luminescent biomass-derived CDs for combined cancer therapy and diagnostics. Their doxorubicin (DOX) drug uptake was measured by spectrofluorimetry, indicating a crucial role of the morphologies of the CDs in controlling DOX loading. The glucose derived CDs showed up to 28% w/w of DOX loading.
Keywords: Carbon dots, monosaccharides, biocompatible, nanocarriers, drug loading, doxorubicin
Based on their optical, physical, chemical, and biological properties, carbon dots (CDs) have been proposed as nanotheranostic agents for combined cancer therapy and diagnostics.1,2 Specifically, their high water solubility, biocompatibility, low toxicity, good cell permeability, excellent fluorescent imaging sensitivity, and easy conjugation with therapeutics indicate that CDs are ideal candidates as bioimaging probes and theranostic nanocarriers. Tailoring their design for clinical implementation implies the ability to control fluorescence, photothermal and photochemical behavior, biocompatibility, and drug absorption biodistribution and tumor uptake.3−8 Before that, other issues that need to be carefully addressed are related to their synthesis and include batch-to-batch reproducibility, control of surface properties, purification, and characterization as we recently pointed out in this journal and elsewhere.5,9,10 Full control and understanding of these features implies therefore a solid chemical background obtained by performing a systematic study of the starting materials, synthetic parameters, and of structure–property relationships. In this Letter, we took on this challenge and carried out the hydrothermal syntheses of CDs starting from a set of different reagents, followed by their morphological, chemical, and toxicological characterization and some preliminary structure–activity relationships as drug nanocarriers.
The method of our choice to produce CDs is hydrothermal;11−13 it consists in heating an organic precursor in water, at high temperature and for a long time. With this method, it is possible to synthesize carbon nanoparticles from a variety of starting reagents: orange juice,14 tea5 or chocolate,15 and protein16 but also from other renewable resource like lignin,17 willow bark18 or cellulose, and waste paper.19 Monosaccharides are another cheap, abundant, and biocompatible resource that can be used to obtain carbon dots with a high number of carboxylic groups on the surface, that in turn represent an important starting point for the development of efficient drug delivery systems. Very recently, by using doxorubicin (DOX) as a model anticancer drug, it has been demonstrated that noncovalent interactions (such as electrostatic interaction, hydrophobic interaction, π– π stacking, and hydrogen bonding) are responsible for the binding of DOX to the CDs nanostructure.20 Among the others, an important role is played by the native carboxyl groups on the CDs surface, which, by interaction with the amine moiety of DOX, led to the formation of pH responsive nanoaggregates employed for cancer-specific localized drug release.6 A number of hydrothermal procedures for the synthesis of sugar-based CDs have been reported in the last decades, mainly in the presence of both passivating or doping agents like N or P.21 Yang et al. synthesized CDs starting from glucose using PEG–200 as passivating agent achieving a nanomaterial with remarkable quantum yield (QY) of 6.3%.22 Travas-Sejdic et al. reported a synthesis of CDs by simply refluxing glucose in sulfuric acid, forming carbon nanoparticles with poor QY (1%), which, by adding a passivating agent, could be raised up to 13%.23 Wang et al. developed a synthesis of glucose-based CDs by using monopotassium phosphate as a dehydrating inorganic base to favor the formation of the nanoparticles.24
To favor the formation of biocompatible nanostructures suitable for medical applications and to avoid the formation of harmful chemical compounds, in this work we describe the hydrothermal synthesis of CDs starting from fructose, glucose, and ascorbic acid, without any passivating or doping additives. The as-synthesized CDs are here characterized from a morphological, chemical, and toxicological point of view and their potential application as drug nanocarriers are tested using DOX as a model drug. There are only few similar examples: for glucose and fructose, a microwave approach was reported,25 while in the case of ascorbic acid, ethanol was added as a cosolvent.26
The G–CDs, F–CDs, and A–CDs were synthesized by thermolysis of an aqueous solution of glucose, fructose, or ascorbic acid at 200 °C for 24 h in autoclave (see Supporting Information (SI) for details). The morphology and structural features of the CDs were investigated by NMR, mass spectrometry (GC–MS), Fourier transform infrared spectroscopy (FT–IR), UV–vis spectroscopy, and high-resolution-transmission electron microscopy (HR-TEM). 1H and 13C{1H} NMR spectra (Figure S1–3) reveal the disappearance of the reagent and the formation of NMR-active compounds, indicative of the presence of both alkyl and/or aromatic functionalities. For the F–CDs, furan-like molecules such as hydroxymethylfurfural 1 and 2,5-furandicarboxaldehyde 2 were identified by GC–MS (Figures S4–S6) and 1H and the 13C NMR (Figure S7). Dehydration to yield furan-like molecules in the thermal degradation of carbohydrates is well-known.27−29 Furanics are carcinogenic, this must be kept in mind when considering CDs for biomedical purposes. Instead, silent GC–MS spectra were observed for both G–CDs and A–CDs.
Diffusion-ordered NMR spectroscopy (DOSY) was used to estimate the size of the CDs. By assuming spherical ideal structures, by comparison with a known reference, and according to the Stokes–Einstein equation and Graham’s law of diffusion, the diffusion coefficient (Δ) estimated using DOSY allows to calculate a relative volume (ε̅) and mass (M̅) and, thus to estimate the MW of the CDs (see SI for more details).30−32 In Figure 1 (see also Figures S8–10), the DOSY spectra of the three CDs are reported in comparison with the ones of the organic precursors, which have been used as reference. Interestingly, the analyses reveal that the CDs are effectively larger than the corresponding precursors, and despite the identical hydrothermal conditions applied during the synthesis, their actual dimension depends on the reagent used, being G–CDs larger than the F–CDs and A–CDs. As reported in Table 1 (see also Table S1 for more details), F–CDs and G–CDs are up to 25−60 times larger and 9−15 times heavier than their respective precursors fructose/glucose. Their calculated MW are in the range between 2700 and 1500 Da, which is consistent with the formation of extended carbon nanostructures. For A–CDs, the higher Δ value obtained is reasonably ascribed to the presence in solution of small oligomeric structures. Typically, DOSY is used to study well-defined molecular-like species,33−35 while the present solutions contain highly complex systems formed by a mixture of different carbogenic frameworks, rather than a single molecule. For this reason, the present data for such “nonideal” samples is purely indicative of the average molecular weight of the CDs and is underestimated due to the fact that DOSY provides a weighted average of the mass of the 1H NMR active species.
Figure 1.
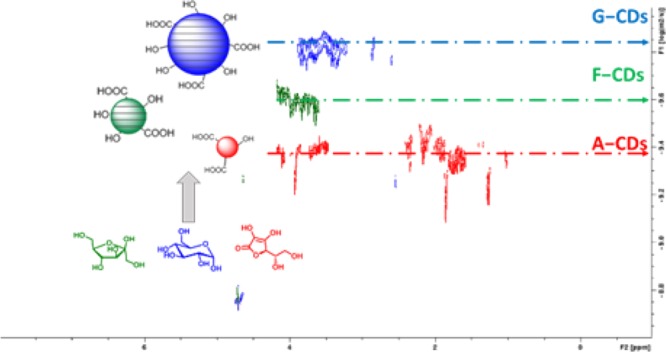
DOSY spectra in D2O at pD = 7 of the G–CDs, F–CDs, and A–CDs [5 mg/mL].
Table 1. Average
Volume (ε̅), Mass
Ratios (M̅), and Estimated Molecular Mass ( ) of the
CDsa.
| CDs | ε̅ | M̅ |  |
|---|---|---|---|
| G-CDs | 55.7 | 14.6 | 2600 ± 120 |
| F-CDs | 22.0 | 7.8 | 1400 ± 160 |
| A-CDs | 13.4 | 5.6 | 990 ± 70 |
Normalized to the corresponding substrate (c.f.r. Supporting Info).
The CDs were then characterized by FT–IR (Figure S11). All three samples showed intense adsorption bands indicative of C=C conjugated aromatics,36 C=O bonds, OH groups, C–H bonds, and C–O–C moieties.37 High-resolution transmission electron microscopy (HR-TEM) of the G–CDs and F–CDs revealed the presence of homogeneous and well-dispersed populations of small quasi-spherical nanoparticles with an average size of 9–10 nm with a polydispersity index (PDI) of 0.025–0.03 indicative of monodisperse systems (Figure 2). Furthermore, the HR-TEM images of the G–CDs and F–CDs showed the presence of lattice fringes with an interlayer spacing of 2.4 Å, confirming their graphitic nature. Instead, the A–CDs showed amorphous and poorly defined structures confirming their molecular-like nature in agreement with the DOSY results.
Figure 2.
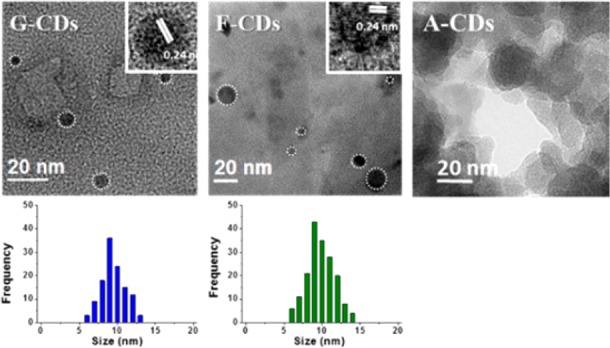
HR-TEM of the as-synthesized G–CDs, F–CDs, and A–CDs.
To shed light on the surface structure of the CDs, a titration38 of the hydroxyl groups was carried out. The hydroxyl value (HV), i.e., the grams of KOH required to neutralize 1 g of CDs (c.f.r. SI), was measured for the three different CDs. The results are reported in Figure S12. Both F–CDs and G–CDs showed a similar HV ≈ 1500, corresponding to 26.8 mol(OH)/g(CD). This is not surprising since the chemical structure of the precursors and their derived CDs are very similar. This low HV was explained by the observation that the hydrothermal degradation of glucose and fructose produced large amounts of CO2 and H2O, with concurrent formation of extended carbogenic structures. The higher HV ≈ 5000 of the A–CDs, corresponding to 89.3 mol(OH)/g(CD), reflects instead the low degree of carbonization and the consequent presence of free carboxyl-rich molecules in solution. Based on these observation, an investigation of the surface charge of the nanoparticles was carried out by electrophoresis. The images are shown in Figure 3. It is readily apparent that in the pH range 4–10, all the CDs were negatively charged in agreement with the presence of hydroxyl and carboxylic groups on the surface. The HV values of each sample correlate with the electrophoresis: the higher the negative surface charge, the faster the migration toward the positive electrode.
Figure 3.
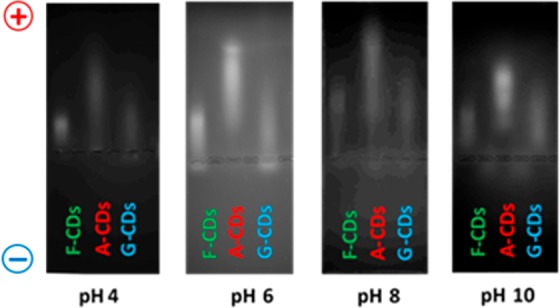
Electrophoresis experiment performed on the G–CDs, F–CDs, and A–CDs at different pHs.
The optical properties of the carbon dots were investigated by UV–Vis absorption spectroscopy and by recording the photoluminescence (PL) spectra (Figure 4). UV–Vis spectra showed a common absorption band for the three different CDs in the region of 225–235 nm ascribed to the π–π* transition of the sp2 C=C conjugated system. The G–CDs and F–CDs showed absorption peaks also at 265 and 280 nm, respectively, ascribed to the n−π* transition of the C=O groups on the surface.39 Moreover, the F–CDs showed an absorption peak at 360 nm for the transition associated with the trapping of excited-state energy by the surface state.40 As shown in Figure 4, in all three samples, the emission spectra were analyzed at different excitation wavelengths: 330–380 nm. Despite the similarity of the starting materials, not all samples showed emission dependence from the excitation wavelength. Indeed, when the excitation wavelength was shifted from 330 to 380 nm, the emission peaks of A–CDs and G–CDs were red-shifted from 440 to 460 nm and from 435 to 450 nm, respectively. While no appreciable variation on the emission peaks were observed for F–CDs. This phenomenon could be ascribed to a size-dependent emission,41 or to the presence of fluorophores or structural defects on the surface.42−44 The QYs of the CDs, calculated using quinine sulfate as standard, were 1.8%, 0.3%, and 1.5% for the G–CDs, F-CDs, and A–CDs, respectively. As expected, low QY were measured in all cases due to the absence of doping atoms (e.g., N or P)45 and of passivation agents as well as to the presence of defects and conjugated carbon core domains, which favor nonradiative electron–hole recombination pathways.46
Figure 4.
UV–vis spectra and PL spectra at different excitation wavelength of G–CDs, F–CDs, and A–CDs (50 μg/mL).
The carbon nanoparticles were then tested for their toxicity toward HeLa cells in view of a potential use in the nanomedical field. The cell viability was measured at different CDs concentrations with respect to a control suspension; the results are summarized in Figure 5. The G–CDs showed good viability at all the concentrations tested. Instead, the A–CDs showed biocompatibility only at relatively low concentration (<250 μg/mL). The F–CDs exhibited high toxicity also at low concentrations, explained by the presence of the furanics identified earlier in the F–CDs mixture, which are known to be carcinogenic.47,48
Figure 5.
Cell viability ratio of the CDs.
The interactions of the three different CDs with DOX were measured by fluorescence quenching in view of the future development of new biocompatible delivery systems. DOX was gradually added to a solution of CDs (0.25 mg/mL) while keeping the CDs concentration constant. The results shown in Figure 6 clearly demonstrate that the gradual addition of DOX (from 1 × 10⁻⁶ to 1 × 10⁻⁵ M) induces a progressive decrease of the fluorescence intensity that can be attributed to dynamic or static interactions between the CDs and DOX.49,50 The blue-shift of the emission peak indicates a strong interaction.51 The CDs–DOX association constants (Ksv), calculated with the Stern–Volmer plots shown in Figure 7 (c.f.r. SI), exhibit linear relationships meaning that dynamic quenching process are involved. F–CDs and G–CDs show a similar Ksv, while the A–CDs exhibit an interaction half of that. The high HV value of the A–CDs could have been expected to favor association with DOX by electrostatic interactions. The Stern–Volmer plots indicate the opposite, i.e, that noncovalent interactions are controlling the adsorption of the drug. A role may be played by π–π stacking between the graphitic carbon core in the F–CDs and G–CDs, with the aromatic moiety of DOX.17 DOX uptake by G–CDs, chosen for its high drug affinity and low toxicity, was estimated by constructing a Job plot of the fluorescence emission quenching (λex = 340 nm, λem = 441 nm) as a function of DOX relative mass fraction (mDOX/[mDOX + mCDs]) (Figure 8). The plot reveals a binding stoichiometry G–CDs/DOX of ca. 3.5:1 that leads to a calculated drug loading of 28%w/w, comparable or higher than the most efficient doped or functionalized analogs.52,53
Figure 6.
Emission spectra of CDs (0.25 mg/mL) recorded at different addition of DOX (from 1 × 10⁻⁶ to 1 × 10⁻⁵ M).
Figure 7.
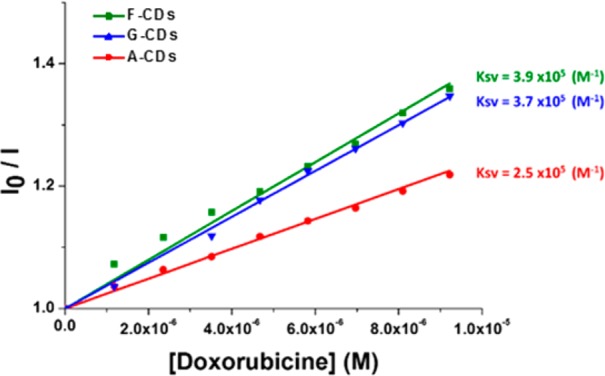
Stern–Volmer plots of the relative emission intensities (λex = 340 nm λem = 441 nm) of CDs (0.25 mg/mL) as a function of the DOX concentration.
Figure 8.
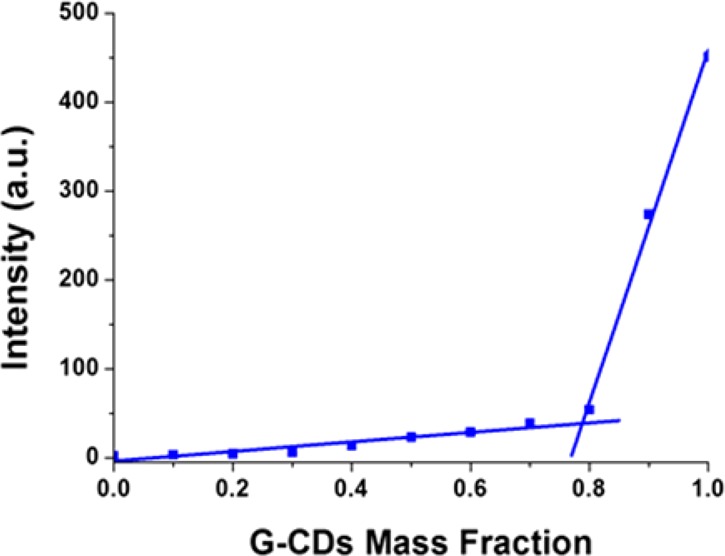
Job plot of the fluorescence decay (λex = 340 nm λem = 440 nm) of G-CDs with DOX.
In conclusion, we have shown how the choice of the reagents influences the morphology, structure, and properties of the obtained CDs and how these correlate with the drug loading capabilities. In particular, the fluorescence quenching measurements revealed the importance of the graphitic core domains in achieving high CDs–DOX affinity as evinced by the binding trend. Drug delivery test are currently being performed.
Acknowledgments
E.A. thanks the European Social Fund for a scholarship.
Supporting Information Available
The Supporting Information is available free of charge on the ACS Publications website at DOI: 10.1021/acsmedchemlett.8b00240.
Materials and instrumentations, syntheses of the carbon dots, hydroxyl value (HV) quantification, CDs–doxorubicin interaction quenching, 1H and 13C NMR spectra and DOSY of CDs, IR characterization and HV values, and polydispersity index (PDF)
Author Contributions
A.P., E.A., and S.C. conceived the experiments and wrote the paper. S.C. and E.P. performed the experiments; M.F., M.S., F.R., P.R., G.T., and A.B. contributed to the interpretation of results.
The authors declare no competing financial interest.
Supplementary Material
References
- Lim S. Y.; Shen W.; Gao Z. Carbon quantum dots and their applications. Chem. Soc. Rev. 2015, 44, 362–381. 10.1039/C4CS00269E. [DOI] [PubMed] [Google Scholar]
- Wang Y.; Hu A. Carbon quantum dots: synthesis, properties and applications. J. Mater. Chem. C 2014, 2, 6921. 10.1039/C4TC00988F. [DOI] [Google Scholar]
- Zhao A.; Chen Z.; Zhao C.; Gao N.; Ren J.; Qu X. Recent advances in bioapplications of C-dots. Carbon 2015, 85, 309–327. 10.1016/j.carbon.2014.12.045. [DOI] [Google Scholar]
- Feng T.; Ai X.; An G.; Yang P.; Zhao Y. Charge-Convertible Carbon Dots for Imaging-Guided Drug Delivery with Enhanced in Vivo Cancer Therapeutic Efficiency. ACS Nano 2016, 10, 4410–4420. 10.1021/acsnano.6b00043. [DOI] [PubMed] [Google Scholar]
- Bayda S.; Hadla M.; Palazzolo S.; Kumar V.; Caligiuri I.; Ambrosi E.; Pontoglio E.; Agostini M.; Tuccinardi T.; Benedetti A.; Riello P.; Canzonieri V.; Corona G.; Toffoli G.; Rizzolio F. Bottom-up synthesis of carbon nanoparticles with higher doxorubicin efficacy. J. Controlled Release 2017, 248, 144–152. 10.1016/j.jconrel.2017.01.022. [DOI] [PubMed] [Google Scholar]
- Zeng Q.; Shao D.; He X.; Ren Z.; Ji W.; Shan C.; Qu S.; Li J.; Chen L.; Li Q. Carbon dots as a trackable drug delivery carrier for localized cancer therapy in vivo. J. Mater. Chem. B 2016, 4, 5119–5126. 10.1039/C6TB01259K. [DOI] [PubMed] [Google Scholar]
- Wang Q.; Huang X.; Long Y.; Wang X.; Zhang H.; Zhu R.; Liang L.; Teng P.; Zheng H. Hollow luminescent carbon dots for drug delivery. Carbon 2013, 59, 192–199. 10.1016/j.carbon.2013.03.009. [DOI] [Google Scholar]
- Mosconi D.; Mazzier D.; Silvestrini S.; Privitera A.; Marega C.; Franco L.; Moretto A. Synthesis and Photochemical Applications of Processable Polymers Enclosing Photoluminescent Carbon Quantum Dots. ACS Nano 2015, 9, 4156–4164. 10.1021/acsnano.5b00319. [DOI] [PubMed] [Google Scholar]
- Kumar V.; Toffoli G.; Rizzolio F. Fluorescent Carbon Nanoparticles in Medicine for Cancer Therapy. ACS Med. Chem. Lett. 2013, 4, 1012–1013. 10.1021/ml400394a. [DOI] [PMC free article] [PubMed] [Google Scholar]
- Rani R.; Kumar V.; Rizzolio F. Fluorescent Carbon Nanoparticles in Medicine for Cancer Therapy: An Update. ACS Med. Chem. Lett. 2018, 9, 4–5. 10.1021/acsmedchemlett.7b00523. [DOI] [PMC free article] [PubMed] [Google Scholar]
- Jiang K.; Sun S.; Zhang L.; Lu Y.; Wu A.; Cai C.; Lin H. Red, Green, and Blue Luminescence by Carbon Dots: Full-Color Emission Tuning and Multicolor Cellular Imaging. Angew. Chem., Int. Ed. 2015, 54, 5360–5363. 10.1002/anie.201501193. [DOI] [PubMed] [Google Scholar]
- Sun Y.-P.; Zhou B.; Lin Y.; Wang W.; Fernando K. A. S.; Pathak P.; Meziani M. J.; Harruff B. A.; Wang X.; Wang H.; Luo P. G.; Yang H.; Kose M. E.; Chen B.; Veca L. M.; Xie S.-Y. Quantum-Sized Carbon Dots for Bright and Colorful Photoluminescence. J. Am. Chem. Soc. 2006, 128, 7756–7757. 10.1021/ja062677d. [DOI] [PubMed] [Google Scholar]
- Yang Z.; Li Z.; Xu M.; Ma Y.; Zhang J.; Su Y.; Gao F.; Wei H.; Zhang L. Controllable Synthesis of Fluorescent Carbon Dots and Their Detection Application as Nanoprobes. Nano-Micro Lett. 2013, 5, 247–259. 10.1007/BF03353756. [DOI] [Google Scholar]
- Sahu S.; Behera B.; Maiti T. K.; Mohapatra S. Simple one-step synthesis of highly luminescent carbon dots from orange juice: application as excellent bio-imaging agents. Chem. Commun. 2012, 48, 8835–8837. 10.1039/c2cc33796g. [DOI] [PubMed] [Google Scholar]
- Liu Y.; Zhou Q.; Li J.; Lei M.; Yan X. Selective and sensitive chemosensor for lead ions using fluorescent carbon dots prepared from chocolate by one-step hydrothermal method. Sens. Actuators, B 2016, 237, 597–604. 10.1016/j.snb.2016.06.092. [DOI] [Google Scholar]
- Zhang Z.; Hao J.; Zhang J.; Zhang B.; Tang J. Protein as the source for synthesizing fluorescent carbon dots by a one-pot hydrothermal route. RSC Adv. 2012, 2, 8599–8601. 10.1039/c2ra21217j. [DOI] [Google Scholar]
- Chen W.; Hu C.; Yang Y.; Cui J.; Liu Y. Rapid Synthesis of Carbon Dots by Hydrothermal Treatment of Lignin. Materials 2016, 9, 184. 10.3390/ma9030184. [DOI] [PMC free article] [PubMed] [Google Scholar]
- Qin X.; Lu W.; Asiri A. M.; Al-Youbi A. O.; Sun X. Green, low-cost synthesis of photoluminescent carbon dots by hydrothermal treatment of willow bark and their application as an effective photocatalyst for fabricating Au nanoparticles-reduced graphene oxide nanocomposites for glucose detection. Catal. Sci. Technol. 2013, 3, 1027–1035. 10.1039/c2cy20635h. [DOI] [Google Scholar]
- Adolfsson K. H.; Hassanzadeh S.; Hakkarainen M. Valorization of cellulose and waste paper to graphene oxide quantum dots. RSC Adv. 2015, 5, 26550–26558. 10.1039/C5RA01805F. [DOI] [Google Scholar]
- Peng Z.; Han X.; Li S.; Al-Youbi A. O.; Bashammakh A. S.; El-Shahawi M. S.; Leblanc R. M. Carbon dots: Biomacromolecule interaction, bioimaging and nanomedicine. Coord. Chem. Rev. 2017, 343, 256–277. 10.1016/j.ccr.2017.06.001. [DOI] [Google Scholar]
- Hill S.; Galan M. C. Fluorescent carbon dots from mono- and polysaccharides: synthesis, properties and applications. Beilstein J. Org. Chem. 2017, 13, 675–693. 10.3762/bjoc.13.67. [DOI] [PMC free article] [PubMed] [Google Scholar]
- Zhu H.; Wang X.; Li Y.; Wang Z.; Yang F.; Yang X. Microwave synthesis of fluorescent carbon nanoparticles with electrochemiluminescence properties. Chem. Commun. 2009, 34, 5118. 10.1039/b907612c. [DOI] [PubMed] [Google Scholar]
- Peng H.; Travas-Sejdic J. Simple Aqueous Solution Route to Luminescent Carbogenic Dots from Carbohydrates. Chem. Mater. 2009, 21, 5563–5565. 10.1021/cm901593y. [DOI] [Google Scholar]
- Yang Z.-C.; Wang M.; Yong A. M.; Wong S. Y.; Zhang X.-H.; Tan H.; Chang A. Y.; Li X.; Wang J. Intrinsically fluorescent carbon dots with tunable emission derived from hydrothermal treatment of glucose in the presence of monopotassium phosphate. Chem. Commun. 2011, 47, 11615–11617. 10.1039/c1cc14860e. [DOI] [PubMed] [Google Scholar]
- Tang L.; Ji R.; Cao X.; Lin J.; Jiang H.; Li X.; Teng K. S.; Luk C. M.; Zeng S.; Hao J.; Lau S. P. Deep Ultraviolet Photoluminescence of Water-Soluble Self-Passivated Graphene Quantum Dots. ACS Nano 2012, 6, 5102–5110. 10.1021/nn300760g. [DOI] [PubMed] [Google Scholar]
- Zhang B.; Liu C. y.; Liu Y. A Novel One-Step Approach to Synthesize Fluorescent Carbon Nanoparticles. Eur. J. Inorg. Chem. 2010, 2010, 4411–4414. 10.1002/ejic.201000622. [DOI] [Google Scholar]
- Fan X.; Huang L.; Sokorai K. J. B. Factors Affecting Thermally Induced Furan Formation. J. Agric. Food Chem. 2008, 56, 9490–9494. 10.1021/jf801612c. [DOI] [PubMed] [Google Scholar]
- Ames J. M. Control of the Maillard reaction in food systems. Trends Food Sci. Technol. 1990, 1, 150–154. 10.1016/0924-2244(90)90113-D. [DOI] [Google Scholar]
- Laroque D.; Inisan C.; Berger C.; Vouland É.; Dufossé L.; Guérard F. Kinetic study on the Maillard reaction. Consideration of sugar reactivity. Food Chem. 2008, 111, 1032–1042. 10.1016/j.foodchem.2008.05.033. [DOI] [Google Scholar]
- Cohen Y.; Avram L.; Frish L. Diffusion NMR Spectroscopy in Supramolecular and Combinatorial Chemistry: An Old Parameter—New Insights. Angew. Chem., Int. Ed. 2005, 44, 520–554. 10.1002/anie.200300637. [DOI] [PubMed] [Google Scholar]
- Fielden J.; Long D.-l.; Slawin A. M. Z.; Kögerler P.; Cronin L. Ligand and Counterion Control of Ag(I) Architectures: Assembly of a {Ag8} Ring Cluster Mediated by Hydrophobic and Ag···Ag Interactions. Inorg. Chem. 2007, 46, 9090–9097. 10.1021/ic700872b. [DOI] [PubMed] [Google Scholar]
- Macchioni A.; Ciancaleoni G.; Zuccaccia C.; Zuccaccia D. Determining accurate molecular sizes in solution through NMR diffusion spectroscopy. Chem. Soc. Rev. 2008, 37, 479–489. 10.1039/B615067P. [DOI] [PubMed] [Google Scholar]
- Consiglio G.; Failla S.; Finocchiaro P.; Oliveri I. P.; Purrello R.; Di Bella S. Supramolecular Aggregation/Deaggregation in Amphiphilic Dipolar Schiff-Base Zinc(II) Complexes. Inorg. Chem. 2010, 49, 5134–5142. 10.1021/ic100284r. [DOI] [PubMed] [Google Scholar]
- Consiglio G.; Failla S.; Finocchiaro P.; Oliveri I. P.; Bella S. D. Aggregation properties of bis(salicylaldiminato)zinc(ii) Schiff-base complexes and their Lewis acidic character. Dalton T 2012, 41, 387–395. 10.1039/C1DT11295C. [DOI] [PubMed] [Google Scholar]
- Pilone A.; Lamberti M.; Mazzeo M.; Milione S.; Pellecchia C. Ring-opening polymerization of cyclic esters by phenoxy-thioether complexes derived from biocompatible metals. Dalton T 2013, 42, 13036–13047. 10.1039/c3dt51219c. [DOI] [PubMed] [Google Scholar]
- Loo A. H.; Sofer Z.; Bouša D.; Ulbrich P.; Bonanni A.; Pumera M. Carboxylic Carbon Quantum Dots as a Fluorescent Sensing Platform for DNA Detection. ACS Appl. Mater. Interfaces 2016, 8, 1951–1957. 10.1021/acsami.5b10160. [DOI] [PubMed] [Google Scholar]
- Wang H.; Lu Q.; Hou Y.; Liu Y.; Zhang Y. High fluorescence S, N co-doped carbon dots as an ultra-sensitive fluorescent probe for the determination of uric acid. Talanta 2016, 155, 62–69. 10.1016/j.talanta.2016.04.020. [DOI] [PubMed] [Google Scholar]
- Hartman L.; Lago R. C. A.; Azeredo L. C.; Azeredo M. A. A. Determination of hydroxyl value in fats and oils using an acid catalyst. Analyst 1987, 112, 145–147. 10.1039/an9871200145. [DOI] [Google Scholar]
- Xue M.; Zhang L.; Zhan Z.; Zou M.; Huang Y.; Zhao S. Sulfur and nitrogen binary doped carbon dots derived from ammonium thiocyanate for selective probing doxycycline in living cells and multicolor cell imaging. Talanta 2016, 150, 324–330. 10.1016/j.talanta.2015.12.024. [DOI] [PubMed] [Google Scholar]
- Gong Y.; Yu B.; Yang W.; Zhang X. Phosphorus, and nitrogen co-doped carbon dots as a fluorescent probe for real-time measurement of reactive oxygen and nitrogen species inside macrophages. Biosens. Bioelectron. 2016, 79, 822–828. 10.1016/j.bios.2016.01.022. [DOI] [PubMed] [Google Scholar]
- Zhao Q.-L.; Zhang Z.-L.; Huang B.-H.; Peng J.; Zhang M.; Pang D.-W. Facile preparation of low cytotoxicity fluorescent carbon nanocrystals by electrooxidation of graphite. Chem. Commun. 2008, 5116–5118. 10.1039/b812420e. [DOI] [PubMed] [Google Scholar]
- Sciortino A.; Marino E.; Dam B. v.; Schall P.; Cannas M.; Messina F. Solvatochromism Unravels the Emission Mechanism of Carbon Nanodots. J. Phys. Chem. Lett. 2016, 7, 3419–3423. 10.1021/acs.jpclett.6b01590. [DOI] [PubMed] [Google Scholar]
- Ju B.; Nie H.; Liu Z.; Xu H.; Li M.; Wu C.; Wang H.; Zhang S. X.-A. Full-colour carbon dots: integration of multiple emission centres into single particles. Nanoscale 2017, 9, 13326–13333. 10.1039/C7NR04576J. [DOI] [PubMed] [Google Scholar]
- Pan L.; Sun S.; Zhang A.; Jiang K.; Zhang L.; Dong C.; Huang Q.; Wu A.; Lin H. Truly Fluorescent Excitation-Dependent Carbon Dots and Their Applications in Multicolor Cellular Imaging and Multidimensional Sensing. Adv. Mater. 2015, 27, 7782–7787. 10.1002/adma.201503821. [DOI] [PubMed] [Google Scholar]
- Zhou J.; Zhou H.; Tang J.; Deng S.; Yan F.; Li W.; Qu M. Carbon dots doped with heteroatoms for fluorescent bioimaging: a review. Microchim. Acta 2017, 184, 343–368. 10.1007/s00604-016-2043-9. [DOI] [Google Scholar]
- Fang Q.; Dong Y.; Chen Y.; Lu C.-H.; Chi Y.; Yang H.-H.; Yu T. Luminescence origin of carbon based dots obtained from citric acid and amino group-containing molecules. Carbon 2017, 118, 319–326. 10.1016/j.carbon.2017.03.061. [DOI] [Google Scholar]
- Huang X.; Duan H.; Barringer S. A. Effects of buffer and temperature on formation of furan, acetic acid and formic acid from carbohydrate model systems. LWT - Food Science and Technology 2011, 44, 1761–1765. 10.1016/j.lwt.2011.03.016. [DOI] [Google Scholar]
- Tong X.; Ma Y.; Li Y. Biomass into chemicals: Conversion of sugars to furan derivatives by catalytic processes. Appl. Catal., A 2010, 385, 1–13. 10.1016/j.apcata.2010.06.049. [DOI] [Google Scholar]
- Valeur B.; Berberan-Santos M. N.. Effects of Intermolecular Photophysical Processes on Fluorescence Emission. In Molecular Fluorescence; Wiley-VCH Verlag GmbH & Co. KGaA: 2012; pp 141–179. [Google Scholar]
- Lakowicz J.Principles of Fluorescence Spectroscopy; Springer: 2006; Vol. 1. [Google Scholar]
- Song Y.; Zhu S.; Xiang S.; Zhao X.; Zhang J.; Zhang H.; Fu Y.; Yang B. Investigation into the fluorescence quenching behaviors and applications of carbon dots. Nanoscale 2014, 6, 4676–4682. 10.1039/c4nr00029c. [DOI] [PubMed] [Google Scholar]
- Gong X.; Zhang Q.; Gao Y.; Shuang S.; Choi M. M. F.; Dong C. Phosphorus and Nitrogen Dual-Doped Hollow Carbon Dot as a Nanocarrier for Doxorubicin Delivery and Biological Imaging. ACS Appl. Mater. Interfaces 2016, 8, 11288–11297. 10.1021/acsami.6b01577. [DOI] [PubMed] [Google Scholar]
- Wang H.; Di J.; Sun Y.; Fu J.; Wei Z.; Matsui H.; Alonso A. d. C.; Zhou S. Biocompatible PEG-Chitosan@Carbon Dots Hybrid Nanogels for Two-Photon Fluorescence Imaging, Near-Infrared Light/pH Dual-Responsive Drug Carrier, and Synergistic Therapy. Adv. Funct. Mater. 2015, 25, 5537–5547. 10.1002/adfm.201501524. [DOI] [Google Scholar]
Associated Data
This section collects any data citations, data availability statements, or supplementary materials included in this article.


