Abstract
Background:
Granular cell tumor (GCT) is a relatively uncommon tumor that may affect the skin. The tumor can develop anywhere on the body, although it is predominately seen in oral cavities and in the head and neck regions. Here, we present the results of optical coherence tomography (OCT) imaging of a large GCT located on the abdomen of a patient. We also present an analytical method to differentiate between healthy tissue and GCT tissues.
Materials and methods:
A multibeam, Fourier domain, swept source OCT was used for imaging. The OCT had a central wavelength of 1305 ± 15 nm and lateral and axial resolutions of 7.5 and 10 µm, respectively. Qualitative and quantitative analyses of the tumor and healthy skin are reported.
Results:
Abrupt changes in architectures of the dermal and epidermal layers in the GCT lesion were observed. These architectural changes were not observed in healthy skin.
Discussion:
To quantitatively differentiate healthy skin from tumor regions, an optical attenuation coefficient analysis based on single-scattering formulation was performed. The methodology introduced here could have the capability to delineate boundaries of a tumor prior to surgical excision.
Keywords: Optical coherence tomography, tumor border detection, granular cell tumor, image processing, image analysis, attenuation coefficient
Introduction
Granular cell tumor
Granular cell tumor (GCT), also known as Abrikossoff tumor, is an uncommon soft tissue neoplasm that is generally benign. The tumor mostly presents in women and in dark-skinned individuals. Granular cell tumor rarely affects children,1,2 although this tumor can develop at any age.1–3 Granular cell tumor is mostly known to appear in the oral cavity but can also be present in other sites of the body. Most cases of GCT are benign, with malignancy occurring in less than 1% to 2% of cases.4 Currently, there are no medicinal treatments for GCT and the only option is surgical excision.3,5 Necessity of excision is based on histological analysis of the tumor. Thus, a biopsy must be performed to correctly evaluate the morphology and extension of the tumor.2 Hematoxylin-eosin (H&E) staining and immunohistological staining are commonly used to assess the tumor. Histologically, the tumorous lesion consists of well-demarcated dermal proliferation of polygonal or circular cells with a small centrally located nucleus and granular eosinophilic cytoplasm. The characteristic wide cytoplasmic granules are named pustulo-ovoid bodies. The granules are PAS (Periodic Acid-Schiff) positive; however, they are diastasis resistant. The epithelium that covers the tumor shows pseudoepitheliomatous hyperplasia. This feature of the tumor mandates inclusion of squamous cell carcinoma in the differential diagnosis. Complications with biopsies are rare, but possible complications include pain, local bleeding, local bruising, infection, allergic reaction to the medicine used in the procedure, or damage to the structures beneath the biopsy site.6
Optical coherence tomography of GCT
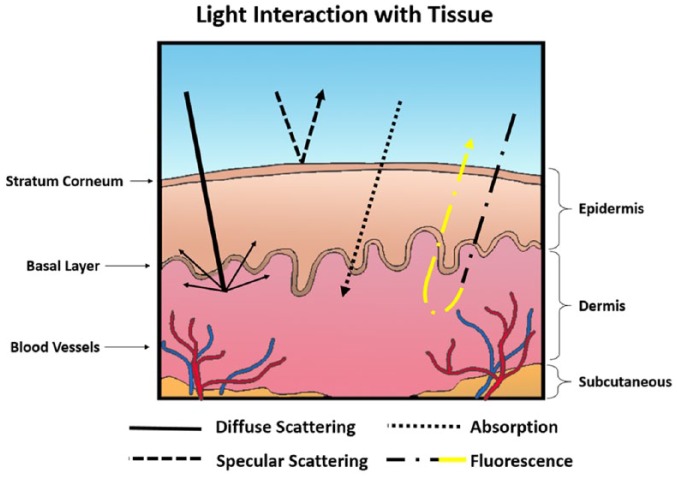
The technology currently available to physicians has remarkably changed the way skin lesions can be evaluated.7 Certainly, the advancement of imaging modalities in the past 35 years has allowed physicians to detect skin abnormalities more precisely at earlier stages. To that end, GCTs have been imaged using computed tomography, magnetic resonance imaging, and positron emission tomography.8–11 Considering light as a form of electromagnetic radiation, its spectrum extends from low-energy waves with long wavelengths to high-energy waves with short wavelengths. Because of light’s unique energy levels, each region interacts with tissue compartments differently. Ultraviolet, visible, and near-infrared optical imaging techniques are potentially sensitive to pathophysiological and morphologic changes in skin disease and may provide a noninvasive, nonionizing method of diagnosis. Optical imaging systems are based on the interactions of light with the tissue compartments. They measure the optical properties of the tissue, such as the absorption coefficient, the scattering coefficient, and the anisotropy factor. The most important events that govern light and tissue interaction (Figure 1) include diffuse scattering, specular scattering, absorption, and fluorescence.7 In diffuse scattering, incident photons undergo multiple scattering at different refractive indices of biological compartments in the tissue before they are absorbed. Specular scattering occurs when light is reflected with the same incident angle relative to the normal orientation. Absorption of light is caused by biological chromophores and fluorophores, where the energy absorbed may result in heat or luminescent emission from the tissue. Fluorescence is the most prominent form of luminescence, where energy is reemitted as light. The optical properties of biological tissue can be considerably altered during carcinogenesis and neoplastic tissue progression due to changes affecting endogenous chromophores, blood content, and tissue oxygenation that alter light absorption and scattering.7,12,13 This is the principle of optical differential diagnosis imaging.
Figure 1.
Interaction of light with tissue compartments. Here, we demonstrate 4 events that can occur including diffuse scattering, specular scattering, absorption, and florescence.
Optical coherence tomography (OCT) is an emerging imaging modality that is capable of acquiring high-resolution cross-sectional images of a tissue.14,15 Optical coherence tomography is a similar modality to ultrasound; however, infrared waves are used instead of sound waves. Compared with the existing optical imaging methods, such as confocal microscopy, OCT provides high-resolution images with a large penetration depth (>1.5 mm).14 Optical coherence tomography relies on a low-coherent light source and interferometry.14,16,17 The most basic OCT scheme is a time domain OCT in which a Michelson interferometer is used.14 The amplitude of electromagnetic radiation in this interferometer is divided into 2 parts by a beam splitter: as the electromagnetic field of the light beam directed into a reference mirror and as the one illuminated by the sample and is back-reflected by its structural elements which is a superposition of waves arriving with different delays. The more advanced scheme of OCT is Fourier domain OCT (FD-OCT). There are 2 ways for developing FD-OCT. The first one is called spectral (spectral domain) OCT, in which the detection of the interferometric signal is made by a spectrometer equipped with a high-speed line scan detector, eg, a charge-coupled device or complementary metal oxide semiconductor.18–22 The second one is called swept source OCT (SS-OCT), which uses high-speed tunable lasers.22–30 In SS-OCT, the spectral interferogram can be described in terms of wavenumber as31 follows:
| (1) |
where is the intensity spectrum of the light, is the backscattering coefficient, is measured from the origin of coordinates in the sample arm (ie, at sample reference), is the backscattering coefficient distribution, is the wavenumber, and is the refractive index of the sample. The final retrieved signal detected in SS-OCT is expressed as31 follows:
| (2) |
where is the line width and is the tuning mode-hop for compensation of changes in cavity length. The axial resolution in OCT is determined by the coherence time or the coherence length ∆l of the light source and can be expressed by equation (3):
| (3) |
where describes the central wavelength, and is the full width at half-maximum of the spectral profile. Similar to the confocal microscopy, the transversal resolution in OCT is determined by the size of the focused spot of the scanning beam.32
Optical coherence tomography, with an intermediate resolution (<10 µm) and penetration depth (~1.5-2 mm), has become a popular diagnostic-assistant imaging modality in dermatology in the past decade. Tissue contrast in OCT images is generated by the intrinsic scattering characteristics of tissues which are proportional to the density, size, and shape of the tissue microstructures. Because tumor cells have a different refractive indices and absorption characteristics than normal cells, OCT images are expected to discriminate tumor tissues from normal tissues and benign neoplasms. Such a differentiation can be difficult to determine as it is based solely on the tissue microstructures visualized in the OCT image. Several groups, including us, have studied OCT image enhancement as well as texture analysis of OCT images to improve skin cancer detection; however, the resultant specificity was still low—around 80%. It is our belief that the specificity of OCT imaging used to differentiate tumor tissue from healthy skin could be improved using the quantitative analysis of OCT images.
Methodology
OCT system configuration
The OCT system used in this study is an SS-OCT from Michelson Diagnostic. This system functions using a tunable laser source with the confined central wavelength of 1305 nm and a laser wavelength sweep range of 150 nm. This system is based on a multibeam technology, similar to dynamic focus technology,33 using a scheme involving 4 consecutive confocal gates each of approximately 0.25 mm width. Using the multibeam technology, the images obtained from the 4 channels are averaged. In the SS-OCT, the reflectivity profile is termed as an axial scan (A-scan or A-line). By grouping together several A-lines for different transversal positions of the incident beam on the sample, a cross-sectional image or a B-scan is generated.17 C-scan depicts the object’s top view that can be at a specific depth. The images obtained with this OCT system are B-scan images with a size of 6 mm × 2 mm and software-inferred en face images with a size of 6 mm × 6 mm. In the OCT system, the lateral resolution is measured as 7.5 µm and the axial resolution is measured as 10 µm. The penetration depth of our OCT system is about 2 mm. In Figure 2, a typical OCT image of healthy skin from the dorsal hand of a volunteer is presented.
Figure 2.
A typical optical coherence tomography image of the dorsal hand skin. The multiple layers of the skin (stratum corneum, epidermis, and dermis) are clearly visible and are labeled. The scale of the image has been modified to match the size of the page.
The appearance of the skin with OCT is determined by its optical properties. Cellular structures within the tissue affect the absorbance and scatting of light, both of which affect the reflectance and attenuation of light.34 Understanding the appearance of healthy skin on OCT is necessary to identify morphological changes in diseased skin.19 In healthy skin, the stratum corneum is a low-absorbing medium and appears as a highly reflective region on the OCT B-scan.35 The epidermis and dermis appear as relatively lower reflective regions as they propagate, absorb, and scatter light.36 The events in the epidermis are a result of the melanin content and in the dermis are mainly due to collagen fibers.36 The epidermis-dermis junction is quite visible and is readily distinguishable by the lower contrast area in between the two. The dermis visibly extends from the junction to where a signal no longer exists. Other structures in skin, such as blood vessels, hair follicles, and hair bulbs, can be identified as hyporeflective regions.35 The OCT image pixels show the forms of the skin’s microstructure based on their size, refractive index, and shape.
Attenuation coefficient analysis
Due to the scattering and absorbing structures, light is attenuated when it travels within a tissue.37 Beer-Lambert law, which is governed by exponential decay, can help explain this attenuation using the single-scattering model of the skin (equation (4)). Attenuation coefficient can be considered the method of choice because of its successful use in characterizing tissue in the literature.16–18,38 Characterization of the tissue can consequently provide information about structural changes in the tissue. Recently, Vermeer et al17 developed a simple method to estimate the attenuation coefficients locally where every pixel in the OCT data set is converted into a corresponding optical absorption coefficient (OAC) pixel. This produces accurate results for both homogeneous and heterogeneous tissues and does not require presegmenting or preaveraging of data. The attenuation coefficient analysis method was evaluated as a diagnostic tool. The single-scattering equation is determined as follows:
| (4) |
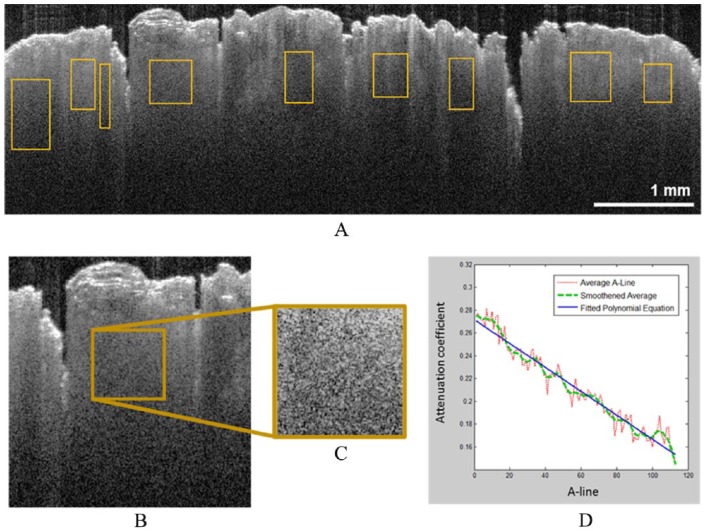
where represents the value of the detected intensity, is the intensity of incident light, is the backscattering coefficient, µ is the attenuation coefficient, and is the depth. The factor of 2 comes from the fact that light travels round trip within the tissue. The common way to calculate an attenuation coefficient is by fitting an exponential curve to the above equation (equation (4)), on which the decay constant can be extracted. The resulted values are then averaged, smoothened, and fitted into a polynomial equation. The slope of the equation thus yields an attenuation coefficient of the region. This method of analysis was applied in this study, as outlined in Figure 3. An attenuation coefficient calculator was implemented in MATLAB following the backscattering equation (equation (4)) for all the regions. A single-dimensional normalized histogram was computed using all attenuation coefficients in the images and regions for healthy and GCT skin. Descriptive analysis was performed for the distribution of attenuation coefficients. All data processing was performed using R (version 3.3.2, 2016, The R Foundation for Statistical Computing).
Figure 3.
Attenuation coefficient calculation in OCT images: (A) regions of interest in an OCT image, (B and C) one enlarged region of interest determined in (A) and outlined in brown. (D) Plots from the enlarged region of interest in (B): the average of 100+ A-lines, smoothed average A-line, and the polynomial linear line that is fitted to them. In (D), the OCT signal axis has been normalized, and the depth is represented relative to the true scale of the OCT image in (A). OCT indicates optical coherence tomography.
Patient imaging
All imaging procedures and experimental protocols were approved and conducted in accordance with the guidelines stipulated by the US National Institutes of Health. Approval to conduct the experiment was obtained from Wayne State University’s Institutional Review Board and an informed consent was secured from all subjects before enrollment in the study. Images of skin conditions were collected in Wayne State University.
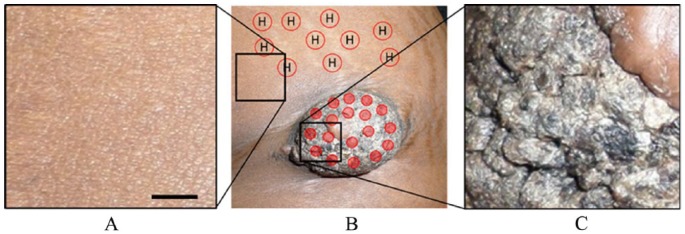
An African American woman (dark-skinned) of age 25 presented with a skin-colored papulonodule with overlying hyperkeratosis in the left iliac area (Figure 4B and C). The red dots in Figure 4B represented the imaging sites on GCT lesion, and the red circle with “H” represented the imaging sites on healthy skin. The lesion was approximately 7 cm in length and 5 cm in width. The patient showed no sign of pain unless pressure was applied, especially on the lower border of the lesion.
Figure 4.
Photograph showing the GCT lesion in the left iliac region with some healthy regions around it. Photograph of the (A) healthy region indicated in (B) with the black square in left, (B) GCT and some surrounding healthy regions, (C) a part of the GCT indicated in (B) with the right black square. Solid red dots in (B) are the imaging location on the lesion while circles with an “H” represent the healthy skin chosen as a reference. The scale bar is 23 mm. GCT indicates granular cell tumor.
Our goal was to image the lesion and surrounding healthy tissue and then compare the image with histological data. The areas of interest were scanned from top to bottom and left to right covering all the lesions and some of the surrounding skin. Healthy skin from around the area, about 10 cm away from the lesion, was also imaged to be used later as the “healthy skin reference” during analysis. The probe moved vertically while the scanning beam traveled horizontally and orthogonally to the direction of the probe’s movement.
Results
Patient imaging
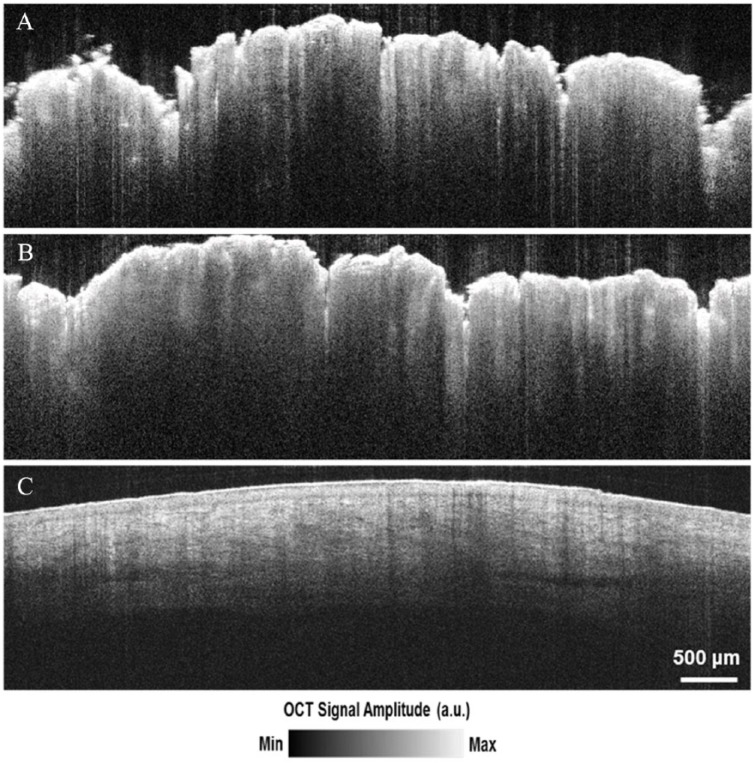
In total, 27 areas were imaged on the patient. Each scanned area yielded an image stack with 170 tomographic B-scan images from the OCT that could be used for analysis and interpretation. Figure 5A and B shows some of the OCT images selected for the attenuation coefficient calculation, and Figure 5C is an OCT image of the healthy tissue near the lesion site for comparison. The OCT images of the GCT demonstrate verrucous epidermal hyperplasia, seen as the hyperreflective, uneven surface of the tissue. The dermo-epidermal junction is obscured in the OCT images of GCT while it is discernible in the adjacent healthy skin. Blood vessels can be seen in the dermis of healthy skin but not in the images of GCT. For the area of healthy and the area of diseased tissue, 163 regions from B-scan images were selected for calculation of the attenuation coefficient. Within each B-scan image, multiple regions of interest with different dimensions and locations were determined randomly, as outlined in Figure 3A. Each region of interest is outlined in brown (Figure 3A).
Figure 5.
OCT images of (A and B) GCT lesion, and (C) healthy skin. Irregularity of epidermis (A and B) caused by verrucous seborrheic keratosis lying on top of the GCT lesion. GCT indicates granular cell tumor; OCT, optical coherence tomography.
In total, 163 regions of interest from B-scan images were analyzed: 82 regions were analyzed from a total of 9 different GCT area images and 81 regions from 7 different healthy skin area images. The summary of this data analysis can be found in Figure 6. The comparison between the attenuation coefficients of GCT and healthy tissue reveals a quantifiable difference in the skin. As demonstrated in Figure 6, the attenuation coefficients in GCT are on average much higher but with similar variation compared with healthy skin. The average attenuation coefficient for GCT was −0.00139 with a standard deviation of 0.00043. In healthy skin, the average value was −0.00217 with a standard deviation of 0.000485. This indicates a lower attenuation coefficient value for healthy skin, signifying a greater penetration depth for light into healthy skin. The median fitted polynomial equation for GCT was found to be y = −0.0014x + 0.288 and for healthy skin y = −0.0022x + 0.444. In healthy skin, the slope is steeper compared with GCT, but the value appeared to attenuate from a much higher OCT signal value. In GCT, the intercept value of the fitted equation is much lower, suggesting that the region is already hypodense or has lower OCT signal intensity due to attenuation.
Figure 6.
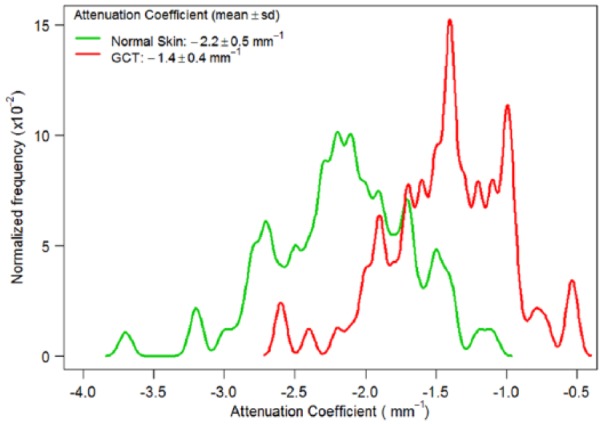
Density plot of attenuation coefficients calculated for healthy skin and GCT. GCT indicates granular cell tumor.
GCT histology
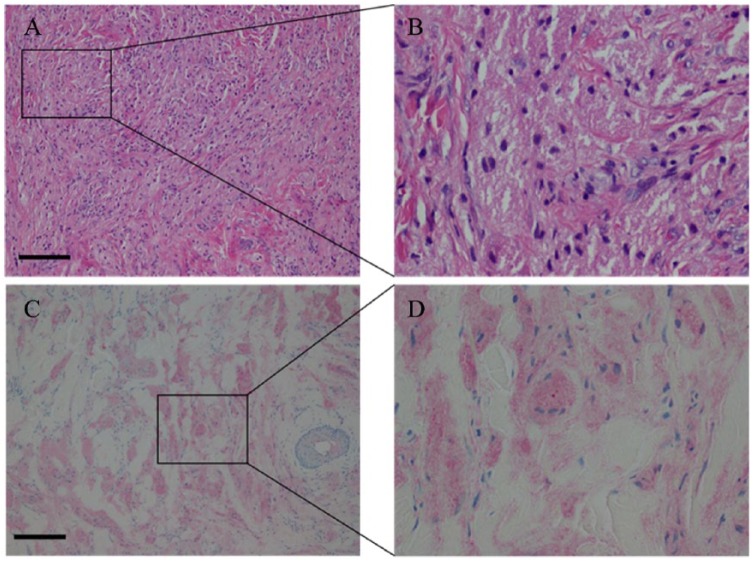
Granular cell tumors are composed of sheets of large polyhedral cells, irregularly arranged, containing a hyperchromatic nucleus and abundant cytoplasm that is fine to coarsely granular. The nuclei are small and round and each can contain either 1 or 2 nucleoli. Basal lamina surrounds the tumor cells and elastosis in the stroma of the tumors is common. The cytoplasm is abundant in granules, typically phagolysosomes, of varying shapes and sizes, and the cytoplasmic borders are not always well defined.39 Granular cell tumors can contain S-100 protein, neuron-specific enolase, PGP9.5, and NKI/C-3. The cells are positive for esterase and acid phosphatase.39 Well-defined criteria to differentiate benign and malignant tumors do not exist. However, size larger than 5 cm, rapid growth, vascular invasion, and necrosis can all be indicative of malignancy.39 CD34 is the hematopoietic progenitor cell antigen, and stains to detect this can reveal the growth of vascular structures or blood vessel invasion referred, which can signify potential malignancy.39,40 Our patient’s biopsy demonstrated many characteristics typical of GCT. The H&E-stained samples and S-100 immunohistological stained samples can be seen in Figure 7. The dermis contains a proliferation of cells with abundant cytoplasm with tiny eosinophilic cytoplasmic granules as well as a perivascular lymphocytic infiltrate. The S-100 immunohistochemical stain demonstrates cytoplasmic and nuclear positivity (Figure 7C and D). This stain is indicative of nerve sheath differentiation, adding support to the Schwann cell origins of GCT. The Factor XIIIa stain highlights a minority of the lesional cells. No features of malignancy were found in the sections examined. There was no vascular invasion, necrosis, significant cytologic atypia, or significant spindling present. The CD34 immunohistochemical stain is also negative in the lesional cells.
Figure 7.
Histological images of the granular cell tumor corresponding to the lesion depicted in Figure 3. (A) hematoxylin-eosin stain at ×100 magnification, also outlining the region (B) at 400× magnification. The lesional cells containing abundant cytoplasm with tiny eosinophilic cytoplasmic granules and perivascular lymphocytic infiltrate is seen. (C) S-100 stain at ×100 magnification of the same sample, also outlining the region (D) at ×400 magnification. The S-100 stain demonstrates cytoplasmic and nuclear positivity. The scale bar is 65 µm.
Discussion
In this study, we demonstrated a quantifiable relationship of the changes in tissue due to GCT and the effects on the optical properties of the skin on OCT imaging. Interpreting A-line scans from B-scan images revealed an increased attenuation coefficient in the GCT compared with normal skin (Figures 3 and 6). The difference in attenuation coefficient reflects a change in the penetration depth of light, with a lower attenuation coefficient representing deeper penetration of light in normal skin.41 The impedance of light penetration in GCT can be attributed to the presence of tumor cells in the dermis. Mourant et al42 previously determined that most of the scattering takes place due to light interactions with organelles within the cell and concluded that cell shape and size have little effect on scattering properties. One such organelle that could possibly cause such significant effects is the nucleus. Because diseased cells divide more rapidly than healthy cells, they will contain greater amounts of nuclear proteins.43 In GCT, cytoplasmic borders are difficult to delineate and elastosis in the stroma of the tumors is common, resulting in alterations to the collagen fibers normally present in healthy tissue. The histology images of GCT illustrate the abundance of nuclei that occupy the many irregularly arranged cells. The presence of cytoplasmic granules characteristic of GCT also seen in the histology images has an effect on optical properties of the lesion. Smaller organelles, such as lysosomes, have also been suggested to be a likely cause for scattering at large angles.42 The alteration to the extracellular membrane between cells and the change in cell geometry may also contribute to the changes in the tissue’s optical properties.
Most of the absorption of light is attributed to the melanin in skin. Melanin is synthesized and punctated into the internal walls of melanosome, which is a 1-µm-diameter organelle.26 The amount of melanin within melanosomes can have 10-fold variation. For light-skinned whites, the volume fraction of melanosomes is about 1% to 3%; for the darkly pigmented Africans, it is about 18% to 43%.44 Accordingly, attenuation coefficient of skin may also vary. The attenuation coefficient is about 0.028 mm−1 for a moderately pigmented adult with 10% volume fraction of melanosomes.45
One reason that different attenuation values are seen is due to the method of calculation of the attenuation coefficient as previously described. The averaged A-line values were based on subsurface scattering and ignored skin surface scattering that could alter results. In addition, of the random regions of interest assessed, the 163 regions of interest chosen to use were those with uniform homogeneity of the OCT signal. In the healthy OCT images, there are more diverse regions of homogeneity to choose from in terms of signal intensity. Because of this, the detected signal intensities in the regions of interest for unhealthy skin have a lower range of values compared with those of healthy skin. Another observation suggests that the OCT signal of GCT attenuates more rapidly near the surface of the skin, as suggested by the surface hyperreflections, whereas the signal in healthy skin experiences gradual and increasing attenuation throughout the tissue layers. Granular cell tumor has a recurrence rate of 20% in benign tumors when the surgical margins are positive.1 In the future, OCT imaging of GCT could perhaps provide a novel way to accurately delineate tumor margins to plan surgical excision to prevent further GCT recurrence. Using OCT image enhancement methods,46–54 the OAC algorithm may be improved. Other emerging imaging modalities, eg, photoacoustic imaging, may also be combined with OCT to improve the diagnosis of GCT.50
Conclusions
A GCT lesion and its surrounding healthy skin were imaged using an SS-OCT. The optical attenuation coefficient analysis on the tumorous and healthy areas showed a quantifiable difference between their optical properties. This study demonstrates that analysis of attenuation coefficient on OCT imaging can delineate abnormal skin, in this case, GCT and normal skin. Further study is necessary to determine whether attenuation coefficient values correlate with specific skin abnormalities, producing a means to objectively differentiate and diagnose various skin diseases with OCT. With the implementation of an OCT with a longer scanning range, it may be possible to image the border of large tumors. This could lead to more accurate delineation of tumor margins with which to plan surgical excisions.
Acknowledgments
The authors would like to thank their industrial partner, Michelson Diagnostics in the United Kingdom and The Office of Research at Wayne State University for their support. They also acknowledge the ACS-IRG grant from Karmanos Cancer Institute.
Footnotes
Funding:The author(s) received no financial support for the research, authorship, and/or publication of this article.
Declaration of conflicting interests:The author(s) declared no potential conflicts of interest with respect to the research, authorship, and/or publication of this article.
Author Contributions: MA designed the research. AM gave clinical input and provided the case; SD and AT provided clinical input, DT, AA, MZ, LH, AF, QX, AT, TB, SD, WC, LH and MA conducted in vivo and computer simulations and wrote the draft of manuscript. All authors participated in paper revisions.
References
- 1. Adeniran A, Al-Ahmadie H, Mahoney MC, Robinson-Smith TM. Granular cell tumor of the breast: a series of 17 cases and review of the literature. Breast J. 2004;10:528–531. doi: 10.1111/j.1075-122X.2004.21525.x. [DOI] [PubMed] [Google Scholar]
- 2. Gogas J, Markopoulos C, Kouskos E, et al. Granular cell tumor of the breast: a rare lesion resembling breast cancer. Eur J Gynaecol Oncol. 2002;23:333–334. http://www.ncbi.nlm.nih.gov/pubmed/12214737. Accessed September 9, 2017. [PubMed] [Google Scholar]
- 3. De Simone N, Aggon A, Christy C. Granular cell tumor of the breast: clinical and pathologic characteristics of a rare case in a 14-year-old girl. J Clin Oncol. 2011;29:e656–e657. doi: 10.1200/JCO.2011.35.9448. [DOI] [PubMed] [Google Scholar]
- 4. McGuire L, Yakoub D, Möller M. Malignant granular cell tumor of the back: a case report and review of the literature. Case Rep Med. 2014;2014:794648 https://www.hindawi.com/journals/crim/2014/794648/abs/. Accessed September 9, 2017. [DOI] [PMC free article] [PubMed] [Google Scholar]
- 5. Brinster N, Liu V, Diwan H, McKee P. Dermatopathology: A Volume in the High Yield Pathology Series. Philadelphia, PA: Elsevier; 2011. [Google Scholar]
- 6. Zuber TJ. Punch biopsy of the skin. Am Fam Physician. 2002;65:1167–1168. [PubMed] [Google Scholar]
- 7. Pratavieira S, Andrade C, Salvio A, Bagnato VS, Kurachi C. Optical imaging as auxiliary tool in skin cancer diagnosis. In: Skin Cancers—Risk Factors, Prevention and Therapy. https://www.intechopen.com/download/pdf/23034. Published 2011. Accessed September 9, 2017.
- 8. Hoess C, Freitag K, Kolben M, Allgayer B. FDG PET evaluation of granular cell tumor of the breast. J Nucl Med. 1998;39:1398–1401. [PubMed] [Google Scholar]
- 9. Cohen-Gadol AA, Pichelmann MA, Link MJ, et al. Granular cell tumor of the sellar and suprasellar region: clinicopathologic study of 11 cases and literature review. Mayo Clin Proc. 2003;78:567–573. doi: 10.4065/78.5.567. [DOI] [PubMed] [Google Scholar]
- 10. Kudawara I, Ueda T, Yoshikawa H. Granular cell tumor of the subcutis: CT and MRI findings. A report of three cases. Skeletal Radiol. 1999;28:96–99. http://www.springerlink.com/index/GWMYJ4NCM1DM4167.pdf. Accessed September 9, 2017. [DOI] [PubMed] [Google Scholar]
- 11. Scaranelo A, Bukhanov K, Crystal P, Mulligan AM, O’Malley FP. Granular cell tumour of the breast: MRI findings and review of the literature. Br J Radiol. 2007;80:970–974. http://www.birpublications.org/doi/abs/10.1259/bjr/95130566. Accessed September 9, 2017. [DOI] [PubMed] [Google Scholar]
- 12. Kwasniak L, Garcia Zuazaga J. Basal cell carcinoma: evidence-based medicine and review of treatment modalities. Int J Dermatol. 2011;50:645–658. http://onlinelibrary.wiley.com/doi/10.1111/j.1365-4632.2010.04826.x/full. Accessed September 9, 2017. [DOI] [PubMed] [Google Scholar]
- 13. Pavlova I, Williams M, El-Naggar A. Understanding the biological basis of autofluorescence imaging for oral cancer detection: high-resolution fluorescence microscopy in viable tissue. Clin Cancer. 2008;14:2396–2404. http://clincancerres.aacrjournals.org/content/14/8/2396.short. Accessed September 9, 2017. [DOI] [PMC free article] [PubMed] [Google Scholar]
- 14. Huang D, Swanson E, Lin C, Schuman J. Optical coherence tomography. Science (New York). 1991;254:1178–1181. https://www.ncbi.nlm.nih.gov/pmc/articles/PMC4638169/. Accessed September 9, 2017. [DOI] [PMC free article] [PubMed] [Google Scholar]
- 15. Adabi S, Turani Z, Fatemizadeh E. Optical coherence tomography technology and quality improvement methods for optical coherence tomography images of skin: a short review. Biomed Eng Comput Biol. 2017;8:1–5. http://insights.sagepub.com/redirect_file.php?fileId=8805&filename=10.1177_1179597217713475.pdf&fileType=pdf. Accessed September 9, 2017. [DOI] [PMC free article] [PubMed] [Google Scholar]
- 16. Gong P, McLaughlin RA, Liew YM, Munro PRT, Wood FM, Sampson DD. Assessment of human burn scars with optical coherence tomography by imaging the attenuation coefficient of tissue after vascular masking. J Biomed Opt. 2013;19:21111. doi: 10.1117/1.JBO.19.2.021111. [DOI] [PubMed] [Google Scholar]
- 17. Vermeer K, Mo J, Weda J, Lemij H. Depth-resolved model-based reconstruction of attenuation coefficients in optical coherence tomography. Biomed Opt Express. 2014;5:322–337. https://www.osapublishing.org/abstract.cfm?uri=boe-5-1-322. Accessed September 9, 2017. [DOI] [PMC free article] [PubMed] [Google Scholar]
- 18. Xu C, Schmitt J, Carlier S. Characterization of atherosclerosis plaques by measuring both backscattering and attenuation coefficients in optical coherence tomography. J Biomed Opt. 2008;13:034003 http://biomedicaloptics.spiedigitallibrary.org/article.aspx?articleid=1102667. Accessed September 9, 2017. [DOI] [PubMed] [Google Scholar]
- 19. Wojtkowski M. High-speed optical coherence tomography: basics and applications. Appl Opt. 2010;49:D30–D61. https://www.osapublishing.org/abstract.cfm?uri=ao-49-16-d30. Accessed September 9, 2017. [DOI] [PubMed] [Google Scholar]
- 20. Potsaid B, Gorczynska I, Srinivasan VJ, et al. Ultrahigh speed spectral/Fourier domain OCT ophthalmic imaging at 70,000 to 312,500 axial scans per second. Opt Express. 2008;16:15149–15169. doi: 10.1364/OE.16.015149. [DOI] [PMC free article] [PubMed] [Google Scholar]
- 21. Grulkowski I, Gora M, Szkulmowski M, et al. Anterior segment imaging with Spectral OCT system using a high-speed CMOS camera. Opt Express. 2009;17:4842–4858. doi: 10.1364/OE.17.004842. [DOI] [PubMed] [Google Scholar]
- 22. Fercher AF. Optical coherence tomography. J Biomed Opt. 1996;1:157–173. [DOI] [PubMed] [Google Scholar]
- 23. Chinn SR, Swanson EA, Fujimoto JG. Optical coherence tomography using a frequency-tunable optical source. Opt Lett. 1997;22:340–342. doi: 10.1364/OL.22.000340. [DOI] [PubMed] [Google Scholar]
- 24. Huang S, Aguirre A, Huber R, Adler D. Swept source optical coherence microscopy using a Fourier domain mode-locked laser. Opt Express. 2007;15:6210–6217. https://www.osapublishing.org/abstract.cfm?uri=oe-15-10-6210. Accessed September 9, 2017. [DOI] [PubMed] [Google Scholar]
- 25. Huber R, Adler D, Srinivasan V, Fujimoto J. Fourier domain mode locking at 1050 nm for ultra-high-speed optical coherence tomography of the human retina at 236,000 axial scans per second. Opt Lett. 2007;32:2049–2051. https://www.osapublishing.org/abstract.cfm?uri=ol-32-14-2049. Accessed September 9, 2017. [DOI] [PubMed] [Google Scholar]
- 26. Huber R, Wojtkowski M, Fujimoto J, Jiang J. Three-dimensional and C-mode OCT imaging with a compact, frequency swept laser source at 1300 nm. Opt Express. 2005;13:10523–10538. https://www.osapublishing.org/abstract.cfm?uri=oe-13-26-10523. Accessed September 9, 2017. [DOI] [PubMed] [Google Scholar]
- 27. Huber R, Wojtkowski M, Taira K, Fujimoto J. Amplified, frequency swept lasers for frequency domain reflectometry and OCT imaging: design and scaling principles. Opt Express. 2005;13:3513–3528. https://www.osapublishing.org/abstract.cfm?uri=OE-13-9-3513. Accessed September 9, 2017. [DOI] [PubMed] [Google Scholar]
- 28. Fercher AF, Drexler W, Hitzenberger CK, Lasser T. Optical coherence tomography—principles and applications. Reports Prog Phys. 2003;66:239. [Google Scholar]
- 29. Yun S, Boudoux C, Tearney G, Bouma B. High-speed wavelength-swept semiconductor laser with a polygon-scanner-based wavelength filter. Opt Lett. 2003;28:1981–1983. https://www.osapublishing.org/abstract.cfm?uri=ol-28-20-1981. Accessed September 9, 2017. [DOI] [PubMed] [Google Scholar]
- 30. Yun S, Tearney G, Bouma B, Park B. High-speed spectral-domain optical coherence tomography at 1.3 µm wavelength. Opt Express. 2003;11:3598–3604. https://www.osapublishing.org/abstract.cfm?id=78225. Accessed September 9, 2017. [DOI] [PMC free article] [PubMed] [Google Scholar]
- 31. Brezinski ME. Optical Coherence Tomography: Principles and Applications. New York, NY: Elsevier; 2006. [Google Scholar]
- 32. Drexler W, Fujimoto JG. Optical Coherence Tomography: Technology and Applications. Berlin: Springer; 2008. [Google Scholar]
- 33. Avanaki M, Podoleanu A. En-face time-domain optical coherence tomography with dynamic focus for high-resolution imaging. J Biomed Opt. 2017;22:056009 http://biomedicaloptics.spiedigitallibrary.org/article.aspx?articleid=2630298. Accessed September 9, 2017. [DOI] [PubMed] [Google Scholar]
- 34. Hojjatoleslami A, Avanaki M. OCT skin image enhancement through attenuation compensation. Appl Opt. 2012;51:4927–4935. https://www.osapublishing.org/abstract.cfm?uri=ao-51-21-4927. Accessed September 9, 2017. [DOI] [PubMed] [Google Scholar]
- 35. Meyers A. Optical Detection of Cancer. World Scientific Publishing Company; 2012. [Google Scholar]
- 36. Krishnaswamy A, Baranoski GVG. A biophysically-based spectral model of light interaction with human skin. Comput Graph Forum. 2004;23:331–340. doi: 10.1111/j.1467-8659.2004.00764.x. [DOI] [Google Scholar]
- 37. Krishnaswamy A, Baranoski G. A Study on Skin Optics. Natural Phenomena Simulation Group; 2004. http://www.imt.liu.se/edu/courses/TBMT36/pdf/Text4.pdf. Accessed September 9, 2017. [Google Scholar]
- 38. Srinivasan V, Mandeville E, Can A, Blasi F. Multiparametric, longitudinal optical coherence tomography imaging reveals acute injury and chronic recovery in experimental ischemic stroke. PLoS ONE. 2013;8:e71478 http://journals.plos.org/plosone/article?id=10.1371/journal.pone.0071478. Accessed September 9, 2017. [DOI] [PMC free article] [PubMed] [Google Scholar]
- 39. Weedon D, Strutton G. Skin Pathology. London, England: Churchill Livingstone; 2002. [Google Scholar]
- 40. Goldblum J, Weiss S, Folpe A. Enzinger and Weiss’s Soft Tissue Tumors. New York, NY: Elsevier; 2013. [Google Scholar]
- 41. Drexler W, Fujimoto JG. Optical Coherence Tomography: Technology and Applications. 2nd ed. Berlin: Springer; 2015. [Google Scholar]
- 42. Mourant J, Freyer J, Hielscher A, Eick A. Mechanisms of light scattering from biological cells relevant to noninvasive optical-tissue diagnostics. Appl Opt. 1998;37:3586–3593. https://www.osapublishing.org/abstract.cfm?uri=ao-37-16-3586. Accessed September 9, 2017. [DOI] [PubMed] [Google Scholar]
- 43. Alberts B. Molecular Biology of the Cell. Vol 1 New York, NY: Garland Publishing; 1989. [Google Scholar]
- 44. Jacques S. Origins of tissue optical properties in the UVA, visible, and NIR regions. In: Advances in Optical Imaging and Photon Migration. 1996. https://www.researchgate.net/profile/Steven_Jacques/publication/247084833_Origins_of_tissue_optical_properties_in_the_uva_visible_and_nir_regions/links/54ede8a30cf2e55866f19991/Origins-of-tissue-optical-properties-in-the-uva-visible-and-nir-regions.pdf. Accessed September 9, 2017.
- 45. Maeda T, Arakawa N, Takahashi M, Aizu Y. Monte Carlo simulation of spectral reflectance using a multilayered skin tissue model. Opt Rev. 2010;17:223–229. http://www.springerlink.com/index/GQ472678Q1678361.pdf. Accessed September 9, 2017. [Google Scholar]
- 46. Hojjatoleslami S, Avanaki M, Podoleanu A. Image quality improvement in optical coherence tomography using Lucy-Richardson deconvolution algorithm. Appl Opt. 2013;52:5663–5670. https://www.osapublishing.org/abstract.cfm?uri=ao-52-23-5663. Accessed September 10, 2017. [DOI] [PubMed] [Google Scholar]
- 47. Avanaki M, Laissue P, Eom T. Speckle reduction using an artificial neural network algorithm. Appl Opt. 2013;52:5050–5057. https://www.osapublishing.org/abstract.cfm?uri=ao-52-21-5050. Accessed September 10, 2017. [DOI] [PubMed] [Google Scholar]
- 48. Avanaki M, Podoleanu A, Schofield J. Quantitative evaluation of scattering in optical coherence tomography skin images using the extended Huygens-Fresnel theorem. Appl Opt. 2013;52:1574–1580. https://www.osapublishing.org/abstract.cfm?uri=ao-52-8-1574. Accessed September 10, 2017. [DOI] [PubMed] [Google Scholar]
- 49. Adabi S, Conforto S, Clayton A. An intelligent speckle reduction algorithm for optical coherence tomography images. Paper presented at: 4th International Conference on Photonics, Optics and Laser Technology (PHOTOPTICS); February 27-29, 2016; Rome. http://ieeexplore.ieee.org/abstract/document/7951262/. Accessed September 10, 2017.
- 50. Nasiriavanaki M, Xia J, Wan H. High-resolution photoacoustic tomography of resting-state functional connectivity in the mouse brain. Proc Natl Acad Sci U S A. 2014;111:21–26. http://www.pnas.org/content/111/1/21.short. Accessed September 10, 2017. [DOI] [PMC free article] [PubMed] [Google Scholar]
- 51. O’Leary S, Fotouhi A, Turk D, et al. OCT image atlas of healthy skin on sun-exposed areas [published online ahead of print March 25, 2018]. Skin Res Technol. doi: 10.1111/srt.12468. [DOI] [PubMed] [Google Scholar]
- 52. Adabi S, Rashedi E, Clayton A, et al. Learnable despeckling framework for optical coherence tomography images. J Biomed Opt. 2018;23:1–12. [DOI] [PubMed] [Google Scholar]
- 53. Adabi S, Hosseinzadeh M, Noei S, et al. Universal in vivo textural model for human skin based on optical coherence tomograms. Sci Rep. 2017;7:17912. [DOI] [PMC free article] [PubMed] [Google Scholar]
- 54. Adabi S, Fotouhi A, Xu Q, et al. An overview of methods to mitigate artifacts in optical coherence tomography imaging of the skin. Skin Res Technol. 2018;24:265–273. [DOI] [PubMed] [Google Scholar]


