Abstract
Objective:
The main objective in studying large-scale cancer omics is to identify molecular mechanisms of cancer and discover novel biomedical targets. This work not only discovers the cancer subtypes in genome scale data by using clustering and classification but also measures their accuracy.
Methods:
Initially, candidate cancer subtypes are recognized by max-flow/min-cut graph clustering. Finally, prognosis-enhanced neural network classifier is proposed for classification. We analyzed the heterogeneity and identified the subtypes of glioblastoma multiforme, an aggressive adult brain tumor, from 215 samples with microRNA expression (12 042 genes). The samples were classified into 4 different classes such as mesenchymal, classical, proneural, and neural subtypes owing to mutations and gene expression. The results are measured using the metrics such as silhouette width, biological stability index, clustering accuracy, precision, recall, and f-measure.
Results:
Max-flow/min-cut clustering produces higher clustering accuracy of 88.93% for 215 samples. The proposed prognosis-enhanced neural network classifier algorithm produces higher accuracy results of 89.2% for 215 samples efficiently.
Conclusion:
From the experimental results, the proposed prognosis-enhanced neural network classifier is seen as an alternative, which is full of promise for cancer subtype prediction in genome scale data.
Keywords: multidimensional data, genome scale data, cancer subtypes, sparse reduced-rank regression, graph clustering, prognosis-enhanced neural network, classifier
Introduction
In recent days, genomic profiling has acquired a lot of data types in a similar set of tumors. Breast cancer research combined with the DNA copy of various gene expressions1 approximated that 62% of highly increased genes display fairly or highly exalted gene expression. Also the DNA copy of various aberrations has ∼10% to 12% of the universal gene expression modifications at the messenger RNA (mRNA) level. In breast cancer cell lines, the exact outcomes were observed by Hyman et al.2 MicroRNAs (miRNAs) is a small noncoding RNAs which conceal the gene expression by consolidating the mRNA target transcripts. It provides a supplementary method of gene expression regulation. More than 1000 miRNAs are imagined to live in humans, and they are conjectural to target one-third of the entire genes in the genome.3 A coordinated effort is made to bring out the entire spectrum of genomic modifications in human cancer. This is being done through the National Cancer Institute/National Human Genome Research Institute (NHGRI)-sponsored The Cancer Genome Atlas (TCGA) pilot project, in order to acquire an integrated vision of those interplays. The novel study of DNA sequencing, copy number, gene expression, and DNA methylation data has been published in a huge set of glioblastomas (TCGA4).
In this research work, any genomic data set contributed for encompassing the abovementioned data type deliberated in the identical set of tumors as multiple genomic platform (MGP) data. Identifying the tumor subtypes by subsequently analyzing the MGP data is a great dispute. The current technique works on subtype identification crosswise, and various types were grouped each type independently and then they physically include them in the outcomes. A perfect integrative clustering technique allows joint inference from MGP data and generates an individually integrated cluster assignment by subsequently obtaining patterns of genomic alterations that are (1) reliable across various data types, (2) specific to individual data types, or (3) are weak yet constant across data sets which brings out only as an output of merging levels of evidence.
For a truly integrative technique, we have 2 primary challenges to tackle. Initially, high-dimensional data generally have certain characteristics where the sample volume is moderately smaller when distinguished with the gene volume. The earlier deterministic methodology rectified this problem. For example, Huang et al 5 utilizes independent component analysis-based penalized discriminant methodology to generate an entire usage of the high-order statistical details. Zheng et al 6 provides a novel sparse representation–based methodology for cancer classification by using the gene expression data. Only for a single data type, these techniques work fine. In addition to this, the subsequent dimension reduction in various integrated data sets is at the distance from the capabilities of these techniques. Secondly, diverse kinds of data sets have to be synthesized and associated with the details in order to acquire useful biological principles altogether. Lot of the earlier deterministic clustering techniques shouldn’t be simply adapted similarly. For example, Qin7 proceeded with a hierarchical clustering of the correlation matrix amid gene expression and microRNA data.
Similarly, Lee et al 8 utilized a biclustering technique on the correlation matrix to integrate the DNA copy number and gene expression data. In both conditions, the aim was to identify the correlated patterns of alteration given with 2 sets of data types. Although identifying the correlated patterns is enough for learning the regulatory method of gene expression via the copy number modifications or epigenomic alterations, it isn’t suitable for integrative tumor subtype examination. Here, both concordant and specific modification patterns might be important in explaining the disease of subgroups. The goal is to identify groups of samples sharing identical expression patterns that could bring about the detection of novel cancer subtypes. This type of examination was initially used in the study by Pusztai et al and Lenz et al.9,10 Since then, clustering techniques have gained a great deal of consideration in the scientific community.11 Bioinformaticians have been presenting new clustering techniques that consider intrinsic features of gene expression data, for instance, noise and high dimensionality, to progress the clusters.12,13
Nevertheless, this examination can’t acquire the persistent output owing to low signal to noise ratio at the time of the initial clustering. So, a few methods have to be established for the concordant formations to integrate the diverse varieties of data. For instance, iCluster denotes a Gaussian latent variable model for integrative clustering.14 Though it is successful, it has few problems in the data preprocessing, which affects the performance of iCluster. To rectify both the problem, one latest data integration technique is brought in, which informs how to use correlation amid the problem of selecting priori gene. Similarity network fusion (SNF)15 develops the appropriate cancer sample-by-sample network and intermixes these networks by an iterative technique. Finally, the resulting network is grouped by spectral clustering.
Wu et al 16 presents novel vigorous gene expression-based techniques to identify these subtypes. They clarify the subsequent network structures and identify the cancer-associated biomarkers ably. This research represents a penalized model-based Student t clustering with unconstrained covariance to identify the cancer subtypes with cluster-specific network. It considers gene dependencies comprising sturdiness in opposition to outliers. In the meantime, biomarker detection and network reformation are acquired by imposing an adaptive penalty on the means as well as the inverse scale matrices. The expectation maximization algorithm fixes this by utilizing the graphical lasso. Here, a network-based gene selection condition identifies the biomarkers not as individual genes but as subnetworks. This allows bringing in low discriminative biomarkers that play a primary role in the subnetwork by interrelating various diversely expressed genes, otherwise it has cluster-specific basic network structures.
Detection of pancreatic ductal adenocarcinoma (PDA) molecular subtypes17 has been aggravated through scarcity of tumor specimens present in research. They overcome this problem by united study of transcriptional profiles of principal PDA samples from several studies in conjunction with human and mouse PDA cell lines. Then, 3 PDA subtypes were identified. For example, classical, quasi-mesenchymal, exocrine-like, and current proof for clinical output and therapeutic reaction dissimilarities amid them. Furthermore, it explains the gene signatures for these subtypes that help stratifying patients for treatment and bring in the preclinical model systems. These systems are used to identify the novel subtype-specific therapies. Nonnegative matrix factorization (NMF) analysis is proceeded with consensus clustering to identify the subtypes of the syndrome. This study is backed up to 3 subtypes (cophenetic coefficient > 0.99). Then a novel gene signature is constructed by using the subtypes with NMF study of the combined clinical data sets. It manages the significance analysis of microarray study with false discovery rate below 0.001. This brings a 62 gene signature, nominated PDA signer.
Genomic and proteomic data sets (biomarkers) of non-small cell lung cancer (NSCLC)18 and its 2 significant subtypes, squamous cell cancer and adenocarcinoma, are analyzed in this study. The biomarkers constitute genomic and proteomic data sets, which are miRNAs, genes, and their proteins. On these biomarkers of NSCLC cancers for generating the guesses, an incorporated classification decision tree induction algorithm19 is utilized. The study constitutes constructing the decision tree by using the J48 Weka tool for lung cancer subtypes and predicts the lung cancer variety for unfamiliar class. Secondly, the output from J48 algorithm is built up. The average correction classification accuracy is almost 99.7%. Nevertheless, most of the rules made of user’s option are economized. The classification rules acquired by improving the decision tree depend on the option of the user to draw limitless rules based on the attribute values. The improved decision tree has described a superior enhancement of J48 algorithm.
Sadanandam et al 20 examined gene expression profiles from 1290 colorectal cancer (CRC) tumors by consensus-based unsupervised clustering. The output clusters depend on the therapeutic response data to the epidermal growth factor receptor-targeted drug cetuximab in 80 patients. The output of these examinations explains 6 clinically based CRC subtypes. Each subtype shares resemblances to diverse cell types inside the normal colon crypt and explains the diverging degrees of “stemness” and Wnt signaling. Subtype-specific gene signatures identify these subtypes. Three subtypes have clearly proved to be superior to disease-free survival after surgical resection. They approve these patients conceived as secured from the unpleasant situation of chemotherapy while they are considered as localized diseases.
A novel unsupervised clustering is provided by Budinska et al,21 which is based on the gene modules. Consider to comprehend, no less than 5 dissimilar gene expression CRC subtypes, which are labeled as surface crypt-like, lower crypt-like, CpG island methylator phenotype-H-like, mesenchymal and mixed. A gene set enhanced by the study of literature search of gene module members accepted as diverse biological patterns in diverse subtypes. The subtypes which aren’t acquired from the result, however, displayed dissimilarities in prediction. Well-established gene copy number deviations and variations in key cancer-related genes differed in amid subtypes. Nevertheless, the subtypes denote the molecular details which are far from the confined variables. Morphological characteristics desirably differ from the amid subtypes.
Amin et al 19 used formal concept analysis (FCA) for taking out the hypomethylated genes among breast cancer tumors. A formal conception lattice is constructed with significant hypomethylated genes for every breast cancer subtypes. The constructed lattice replicates the biological associations among breast cancer tumor subtypes. The presented filter technique comprises 2 phases: nonspecific filter and specific filters. The former step identifies the hypomethlated CPGs by computing the dissimilarity among the mean of methylation level for the consecutive problems. The next stage (specific filtering) acquires the output of the first stage as input and proceeds to 1-sample Kolmogorov-Smirnov test to assure the normality of each breast cancer subtype. The paired t test is enforced, if the specified data set goes behind the normal distribution, or Wilcoxon signed ranked is utilized. The filtering of hypomethylated genes is achieved after FCA is utilized to find the breast cancer subtypes.
Keller et al 22 illustrates the use of FCA for the detection of disease likeness. They recognized formal conceptions by gene–disease relationships that point to unseen association among diseases. They contain identical set of related genes and genes that are related to identical set of diseases. The FCA technique has benefits over network analysis method, for instance (1) FCA lets depiction of associations among numerous diseases, (2) it gives outcomes in algebraic form letting to think association among conceptions, and (3) further gene annotation could be included to improve conceptions that aid the recognition of functional gene associations within disease groups. Formal concept analysis has been used on renal disease data set that identifies unanticipated associations among diseases that are hopeful. However, it experiences some drawbacks. The trouble with FCA is that most of the formal conceptions might not be helpful as very few formal conceptions point to associations.
Planey and Gevaert23 suggest a new framework known as Clustering Intra and Inter Datasets to identify the vigorous patient subtypes or meta-clusters, crossways several data sets. Clustering Intra and Inter Datasets is built on the in-group-proportion metric that measures the replicability of individual subtypes. This is utilized to an individual external data set. Clustering Intra and Inter Datasets doesn’t need batch correction methods, since it lengthens the meta-analysis technique to identify the consensus crosswise single clustering’s from each data set, rather than an individual concatenated matrix. A high-class database collection is suggested for 24 breast cancer gene expression data sets which include 15 studies with corresponding output and treatment information as a second R package. Clustering Intra and Inter Data sets approves the well-established breast cancer subtypes and identifies ovarian cancer subtypes with extrapolative importance and novel hypothesized therapeutic targets, crosswise numerous data sets.
A systematic method is reported by Chen et al 24 to mechanize the detection of cancer subtypes and candidate drivers. Particularly, an iterative algorithm is suggested to substitute among the gene expression clustering and gene signature selection. It enforces the method to data sets of the pediatric cerebellar tumor medulloblastoma (MB). The subtyping algorithm usually gathers the various data sets of MB and the converged signatures and copy number landscapes are also identified to be highly reproducible over the data sets. According to the identified subtypes, a PCA-based approach is established for subtype-specific identification of cancer drivers. The top-ranked driver candidates are identified to be improved with known pathways in specific subtypes of MB. This discloses the subtypes.
A dimension reduction and data integration technique is suggested by Ge et al 25 for identifying the cancer subtypes, which is known as Scluster. Initially, Scluster denotes the diverse of original data into the principal subspaces by an adaptive sparse reduced-rank regression (S-RRR) technique. Next, a fused patient-by-patient network is obtained for these subgroups through a scaled exponential similarity kernel technique. Finally, candidate cancer subtypes are approved by spectral clustering technique. The ability of the Scluster technique is shown by 3 cancers by mutually analyzing mRNA expression, miRNA expression, and DNA methylation data. Scluster is proved to be effective by comparison of outcomes and examinations for predicting the survival and identifying the new cancer subtypes of large-scale multiomics data. Alternatively, the survival risk prediction and biological significance of the diverse clusters yield to be a highly complex work.
In this article, a new data integration technique is proposed for cancer subtypes detection, known as Prognosis Enhanced Neural Network (PENN) classifier. The presented technique comprises 4 major phases: initially, the original multiomics data, respectively, refers to the principal subspaces by utilizing an adaptive S-RRR technique. Sparse reduced-rank regression technique is a high-tech multiple response linear regression technique that simply manages the high-dimensional statistical data underneath the Gaussian variable model. Next, a fused patient-by-patient network, cancer subtype-by-cancer subtype network, is obtained for these subgroups through a scaled exponential similarity kernel technique. Finally, the candidate cancer subtypes are identified by graph clustering. Lastly, PENN classifier is provided perfectly to guesstimate survival.
Materials and Methods
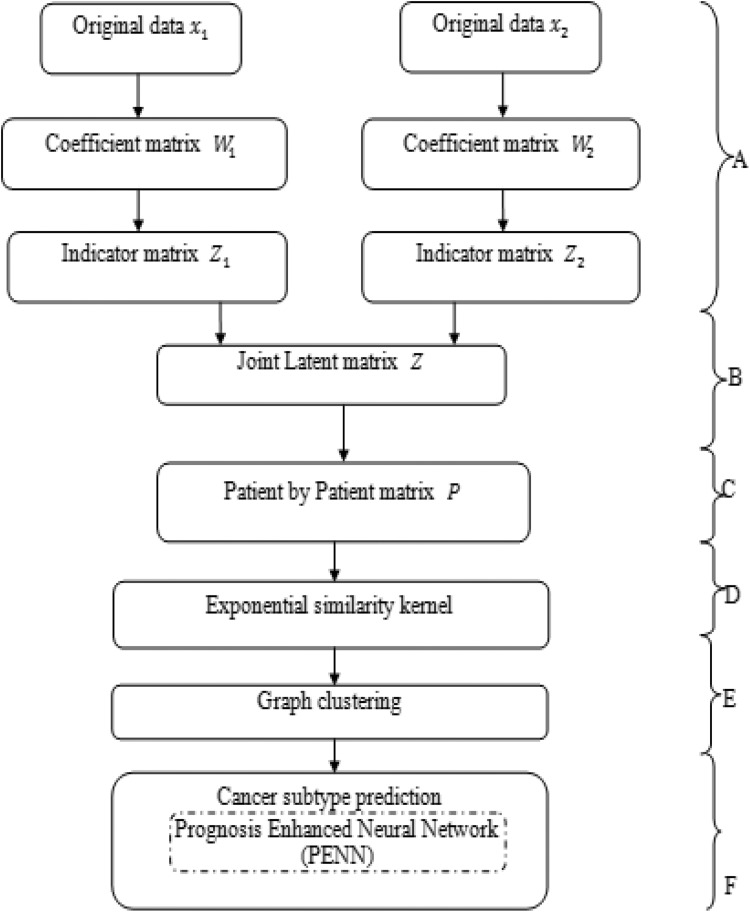
The research model begins with 2 or more kinds of data from a similar group of patients. Presented is PENN classifier where a dimension reduction technique is utilized to find the effectual low-dimensional subspaces and data integration technique for identifying the cancer subtypes. Exhaustively, the initial stage uses an improved principal component analysis (PCA) to compute a coefficient matrix for each available type of data. This coefficient matrix could represent a sample gene space of the original data into eigen array × eigengene subspace. The consequent stage (Figure 1A) uses an adaptive S-RRR technique26 to compute the indicator matrix of each dissimilar data type. Thirdly, these matrices are linked into a joint latent multiple genomic variable and then constructed a sample-by-sample matrix and cancer subtype by cancer subtype matrix by a scaled exponential correspondence to kernel technique27 (Figure 1B, C, and D). Fourth, candidate cancer subtypes are approved by graph clustering technique (Figure 1E). Lastly, PENN classifier (Figure 1F) is represented perfectly to estimate the survival. A similar group of tumor samples is provided, which consists of 2 diverse varieties of data. They compute a set of coefficient matrix by the best feasible PCA technique indicated for these indicator matrices by adaptive S-RRR techniques, respectively. B: Associating these indicator matrices into a joint latent matrix. C: Generate a sample-by-sample matrix P. D: Identify the candidate cancer subtypes. The solid lines symbolize the various methodologies that are used.
Figure 1.
Working procedure of prognosis-enhanced neural network (PENN) classifier.
Solution of the Indicator Matrix
To acquire an exact low-dimensional estimation for dissimilar biological data, an adaptive S-RRR technique is implemented. It uses the subspace-assisted regression with row sparsity method to compute the solution of the subspace Z.26 This technique is built in a Gaussian linear regression model:
| 1 |
Here, X is the diverse biological data of dimension p × n which consist of rows as genes and columns as samples. Z is termed as the indicator matrix of dimension l × n with rows as reduce dimension scales. W is termed as the coefficient matrix of dimension p × l and τ is known as a set of independent error terms. Both Z and τ should fulfill the normal distribution, that is, Z ∼ N (0, I) as well as τ ∼ N (0, ψ) here = diag (ϕ1,…ϕp). W acquired by the first l eigenvectors of X is used for a pivoted QR decomposition28 that is the projection matrix. It projects sample × gene space of the original data onto eigen array × eigengene subspace. In this work, the primary features are considered adequately, the first l principal directions with the range of [0.15n, 0.25n] are chosen as the closed-form solution of the coefficient matrix. The sample biological data matrix is represented as
To estimate the indicator matrix Z quickly, a right bias variance trade-off function is based on the properties of orthonormal matrix with reduced-rank term designating the variance part and sparse lasso term designating the bias part is created:
| 2 |
Here, B is termed as the reduced rank matrix and λ is called as the penalty level. An orthonormal matrix V is termed as the right singular subspace of Z, ρ(B; λ) is the sparse group lasso penalty term. Here, ρ(B; λ) is indicated as
| 3 |
Here, each row of the B is considered as a set with the similar size and states the l 1 norm of the vector, comprising l 2 norms of r groups. B is specified in this way,
| 4 |
Here r ≤ min (p, n) is termed as the reduced rank. Finally, we could slightly acquire a closed-form solution of Z based upon the Equations 2 and 4.
Patient-by-Patient Network
With the aim of integrating these low-dimensional subspaces all at once, combine the diverse subspaces and then build a patient-by-patient network P to group the cancer patients. The term P(i, j) represents the similarity among the patients xi and xj. To generate the similar cluster comprising of strong similarity, here we use a scaled exponential similarity kernel to identify the weight of every pair of patients:
| 5 |
Here, δ(xi, xj) is termed as the Euclidean distance among the patients, xi and xj, μ is called as a hyperparameter between [0.3,0.8], and, ϑi , j is used to eliminate the scaling problem which brings the local affinity. ϑi , j is indicated here as:
| 6 |
Here, mean (δ(xi, Ni)) is termed as the average value of the distances amid xi and every adjacent “i.”
Graph Clustering
This article presents a graph clustering technique that uses a max-flow/min-cut28 algorithm. Specifically, discover the min-weight cut to partition a graph into disconnected components. This kind of graph clustering greatly uses previous max-flow/min-cut algorithms to find out the finest divides. On the other hand, 1 general situation to occur is the partition into a singular isolated node and the leftover part of the graph. The solution to this issue is the normalized cut.
Normalized cut
Rather than reducing the weight of the cut as the enhancement of every round, enhance the cut’s influence on the 2 segregated components. This minimizes the inclination to cut small secluded nodes separately for the reason that the Ncut value will forever be superior as the number of edges linked to small secluded nodes will bring about a cut fraction.
| 7 |
| 8 |
| 9 |
Here, tc = target class (cancer subtype), xi, xj = 2 patients data matrix, cut (xi, xj)—cut value among 2 patients data matrix, assoc(xi, V)—associative value among the patient data matrix. The algorithm begins by resolving (D−W)x = λDx for eigen vectors with the least eigen values, here “D” is the degree matrix of the graph. The eigenvector with the second minimum eigen value is solution. After that recurse till the number of k clusters is attained. The eigensolver used by the algorithm is the Lanczos methodology that minimizes the runtime of the eigenvector issue.29 The Lanczos algorithm is a straight method that is an adjustment of power techniques to discover the most functional eigen values and eigenvectors of an nth order linear system with a restricted number of operations m, here, m is much less compared to n. For the duration of the process of using the power technique, while obtaining the ultimate eigenvector An −1 v, we as well obtained a series of vectors Ajv, j = 0,…, n−2, which were ultimately removed. Since these values are fairly huge, this could bring about a huge amount of removed information. The mth step of the algorithm transforms the matrix A into a tridiagonal matrix Tmm, which is equivalent to the dimension of A, and is alike A. In order to compute the tridiagonal and symmetric matrix , the diagonal elements are represented by αj = tjj and the off-diagonal elements are represented by βj = tj −1,j. Note that tj −1,j = tj ,j−1, because of its evenness. Subsequent to the eigensolver and eigen vector are identified afterward final partition matrix P, found K cluster samples. Those outcomes are denoted as to signify a clustering scheme. In case patient xi be in the kth subtype, then yi (k) = 1, else yi (k) = 0.
Prognosis-Enhanced Neural Network
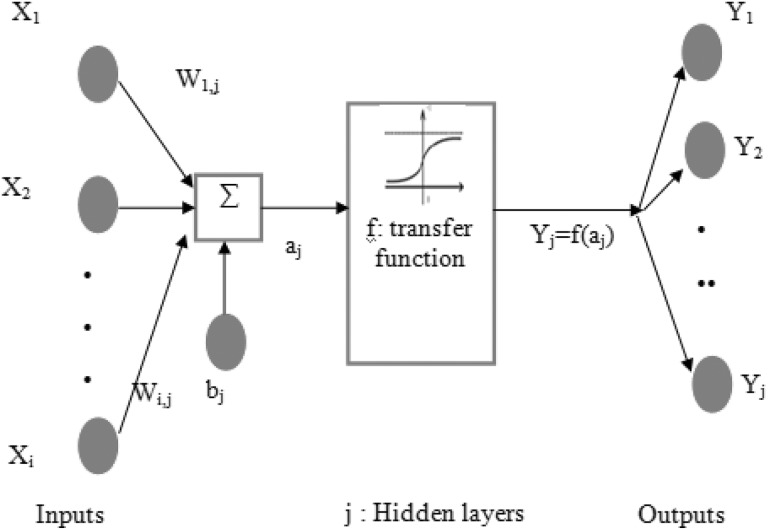
A neural network (NN) is a computational formation, comprising greatly interrelated processing units known as neurons.30 The multilayered NN structural design is usually made up of 3 layers and they are inputs, hidden, and outputs layers, as depicted in Figure 1. This NN formation is capable of finishing the estimation tasks of any nonlinear function.30 The Xi clustered gene data set sample layers obtain the input data from a training data set, and afterwards it is multiplied by the weight Wi,j and added to the bias to give the j hidden layers, as depicted in Figure 2. The transfer function in the hidden layer is utilized to guesstimate the output Yj = cancer subtypes with 2 classes called cancer and noncancer of the neuron. The mathematical NN formulation is specified as Equations (10) and (11).
Figure 2.
Multilayer neural network structures.
| 10 |
| 11 |
Weights and Biases Initialization
The primary weight and bias have an effect on the convergence of NNs. So, Nguyen-Widrow represented a technique to load the weights and biases effectively for the time period of the NN training process.4 The preliminary weights were selected as Wi = 0.7Hi to hasten the convergence of NN.29 Here, Hi the hidden nodes, bj bias initializations are uniform random numbers amid −Wi and Wi.
Transfer function
The transfer function is used to change the possessions of the weighted inputs and biases into output layers. The hard limit, linear, tanh-sigmoid and log-sigmoid transfer functions are most commonly utilized, as indicated in Table 1.30
Table 1.
Common Transfer Function in Neural Networks.
| Transfer Function | Equation | Range |
|---|---|---|
| Hard limit | f(x) = {0, if x < 0 or 1 if x} | 0 to 1 |
| Tanh-sigmoid | f(x) = (ex − e−x) (ex + e−x) | −1 to 1 |
Enhanced Backpropagation NN
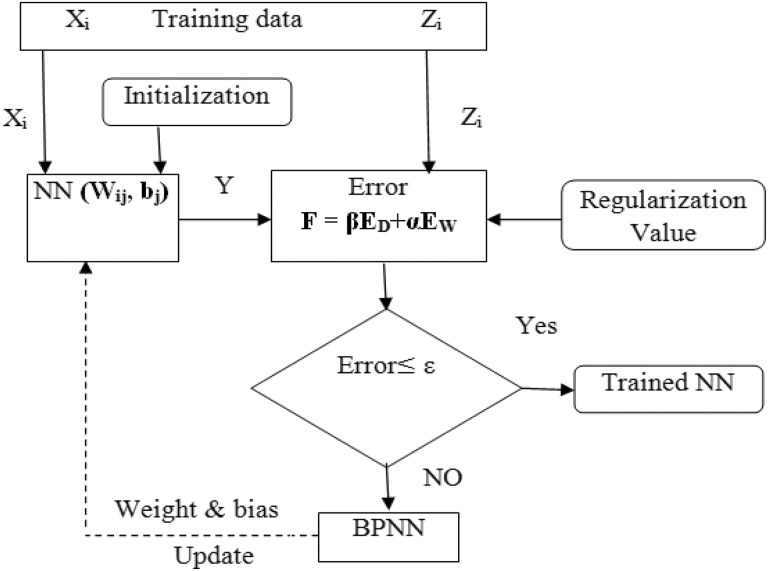
With the training data set or supervised learning techniques, enhanced NNs (ENNs) are initiated. The initialization of weights and bias are based on the Nguyen-Widrow method31 to quicken the convergence of networks, as described in Figure 3. The Bayesian learning technique is incorporated into a backpropagation NN.32 It is used to safeguard the overfitting and provide good generalization, as described in Figure 3. Normally, the training intends to lessen the modified error function formed by the summation of squared errors and network weights, as depicted in Equation 12:
Figure 3.
Enhanced neural networks (ENN) and Bayesian learning integration.
| 12 |
| 13 |
| 14 |
The regularization value is fixed at 0.85 by taking the consequence of the network weights and bias error in the modified error function. It is depicted in Equation 12 to avoid overfitting in the trained networks, where α and β are “black box” parameters, ED—is the sum of square errors by Equation 13, and EW—is the sum of squares of the network weights by Equation 14. In case the error is not fulfilled, the backpropagation algorithm is utilized to adjust the weight and bias in the NN models, as depicted in Figure 3. In Equation 13, Yj is to estimate the output results, Zj is the testing result. Subsequently, the error fulfills the tolerance; the trained networks are acquired to give the optimizer module. All at once while doing classification process, the decision-making is further done by taking the prognosis factor as well. Therefore, prediction outcome is enhanced for the cancer subtype study. In Figure 3, the ε is the error threshold.
Prognosis Factor
Prognosis is a main driver of clinical decision-making. On the other hand, existing prognostication tools have inadequate accuracy and erratic levels of validation. Notwithstanding the accessibility of validated prognostic factors and tools, a lot of health-care experts trust in clinician prophecy of survival to guesstimate prognosis. The reason is that clinician prediction of survival is instant, expedient, and simple to recognize. Even though clinician prediction of survival frequently integrates a lot of well-known prognostic factors in its purpose, each might be allotted a variable weight by diverse health-care experts. Prognostication, as discussed in Table 2, is a procedure rather than an event. A patient’s prognosis might be dependent upon treatment response, improvement of acute oncological complications (for example, spinal cord compression, hypercalcemia, and pulmonary embolism), or competing comorbidities (for instance, heart failure). By disparity, prognostic variables in patients with distant sophisticated disease normally contain patient-related factors, for instance, dyspnea, performance status, delirium, and cancer anorexia/cachexia.
Table 2.
Prognostic Models for Patients With Advanced Cancer (International Prognostic Index [IPI]) .
| Models | Variables | Scoring | Survival Interpretation |
|---|---|---|---|
| Palliative Prognostic Score (PPS) | Clinical prediction of survival (0-8.5) Karnofsky performance scale ≥50% (2.5) Anorexia (1.5) Dyspnea (1) Leukocytosis (0-1.5) |
Total score 0-17.5 points Higher score = worse survival |
Risk group A (0-5.5 points): months of survival Risk group B (5.6-11 points): weeks of survival Risk group C (11.1-17.5 points): days of survival |
The convergence criteria are set to finish the network training process. To evade overfitting of the training data, the regularization value is fixed. Additionally, the training data are split into the training data and validation data.
Results
To show the advantage of the integrative method, it is compared with 3 state-of-the-art integrative methods, that is, k means clustering, SNF, and iCluster. Because of the high computational complexity of iCluster, preselection of the features was necessary. Chosen an appropriate cohort of GBM, an aggressive adult brain tumor,25 miRNA expression (534 genes) of 215 patients from Wang et al,15 to compare Scluster with iCluster and SNF. The GBM data set is downloaded from the cBio Cancer Genomis Portal (http://www.cbioportal.org/). In the implementation point of view, 200 samples are used which is divided into training and testing samples, whereas 75% of samples are used for training and 25% of samples are used for testing phase. Table 3 shows the values of the data set samples with 4 different gene symbols such as ebv-miR-BART10, ebv-miR-BART11-3p, ebv-miR-BART12, and ebv-miR-BART13, and their corresponding gene expressions are TCGA-06-0676-01-11A-02 T, TCGA-08-0625-01-11A-01 T TCGA-12-0772-01-01A-01 T, TCGA-06-0744-01-01A-01 T, TCGA-06-0678-01-11A-01 T.
Table 3.
Data Set Samples for Cancer Discovery.
| Hugo_Symbol | TCGA-06-0676-01- 11A-02T | TCGA-08-0625-01- 11A-01T | TCGA-12-0772-01- 01A-01T | TCGA-06-0744-01- 01A-01T | TCGA-06-0678-01- 11A-01T |
|---|---|---|---|---|---|
| ebv-miR-BART10 | 5.926 | 6.019 | 5.986 | 5.981 | 5.960 |
| ebv-miR-BART11-3p | 6.193 | 6.037 | 6.302 | 6.202 | 6.149 |
| ebv-miR-BART12 | 5.862 | 5.850 | 5.903 | 5.915 | 5.894 |
| ebv-miR-BART13 | 7.757 | 7.99 | 8.74 | 9.549 | 7.501 |
Depending on the previous data integration methods, different results of identified subclasses were obtained. From Verhaak et al’s 33 work, the subtypes of GBM are found as mesenchymal, classical, proneural, and neural subtypes due to changes in the gene expression of NF1, EGFR, PDGFRA/IDH1, and NEFL/GABRA1/SYT1/SLC12A5.
This work used 4 evaluation metrics to determine the result ing(1) silhouette width, (2) Biological Stability Index (BSI), (3) clustering accuracy, and (4) survival probability.
Silhouette Width
Silhouette width is the way of measuring the strength of clusters or how well one element is clustered with each other.
| 15 |
where ai is the average value of varying degrees between i and all the other samples of the same subtypes, bi is the average value of varying degrees i and all the other samples of the different subtypes, and i is a random sample. If silhouette score is close to 1, then it means the data were appropriately clustered.
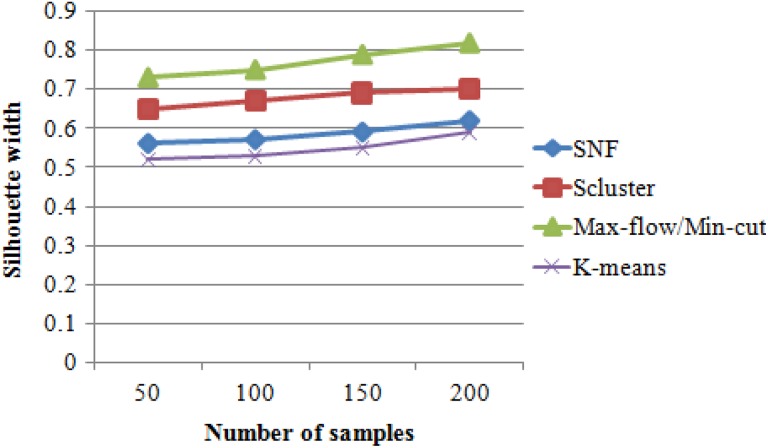
Figure 4 shows the performance comparison results of the clustering algorithms such as k means clustering, SNF, iCluster, and max-flow/min-cut clustering algorithms. Figure 4 implies that the proposed max-flow/min-cut clustering algorithms produce higher silhouette results of 0.82 for 200 samples, whereas the other clustering algorithms such as SNF and Scluster produce silhouette width results of 0.62 and 0.7 values, respectively, as shown in Table 4.
Figure 4.
Silhouette width versus methods.
Table 4.
Silhouette Width Versus Number of Samples.
| No. of Samples | Silhouette Width | |||
|---|---|---|---|---|
| K-Means | SNF | Scluster | Max-Flow/Min-Cut | |
| 50 | 0.52 | 0.56 | 0.65 | 0.73 |
| 100 | 0.53 | 0.57 | 0.67 | 0.75 |
| 150 | 0.55 | 0.59 | 0.69 | 0.79 |
| 200 | 0.59 | 0.62 | 0.7 | 0.82 |
Abbreviation: SNF, similarity network fusion.
Biological Stability Index
The stability of a clustering algorithm is analyzed by inspecting the consistency of the biological results produced when the expression profile is reduced by 1 observational unit. This stability measure is unrelated to the one introduced,34 which compared the clusters without regard to biological relevance. Each gene has an expression profile that can be thought of as a multivariate data value in ℝp, for some P > 1. For example, in a time course microarray study, P could be the number of time points at which expression readouts were taken. In a 2 sample comparison, P could be the total (pooled) sample size, and so on. For each i = 1, 2,…, P, repeat the clustering algorithm for each of the p data sets in ℝp − 1, obtained by deleting the observations at the ith position of the expression profile vectors. For each gene g, let Dg,i denote the cluster containing gene g in clustering based on the reduced expression profile. Let Dg,0 be the cluster containing gene g using the full expression profile. Thus, the clusters using full and reduced data, respectively, containing 2 functionally similar genes should have substantial overlaps. This is captured by the following stability measure and larger values of this index indicate more consistent answers:
| 16 |
A successful clustering is characterized by high values of indices.
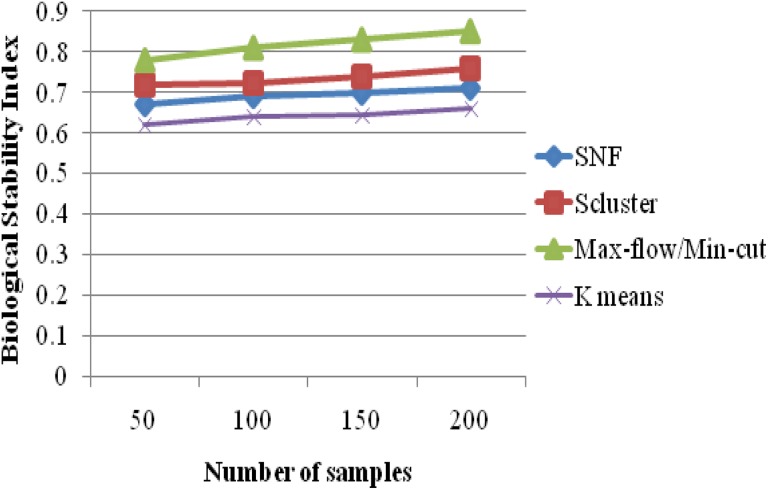
For a given clustering algorithms and an expression data set, BSI measures the consistency of the clustering algorithm’s ability to produce biologically meaningful clusters when applied repeatedly to similar data sets. A good clustering algorithm should have high BSI. Figure 5 evaluates the performance of 4 k means clustering, SNF, iCluster, and max-flow/min-cut clustering algorithms on GBM data sets with miRNA expression. Figure 5 clarifies that the proposed max-flow/min-cut clustering algorithms produce higher BSI results of 0.85 for 200 samples, whereas the other clustering algorithms such as SNF, iCluster, and k means clustering produce BSI results of 0.71, 0.76 and 0.66 values, respectively, as shown in Table 5.
Figure 5.
Biological stability index versus clustering algorithms.
Table 5.
Biological Stability Index Versus Number of Samples.
| No. of Samples | Biological Stability Index | |||
|---|---|---|---|---|
| K Means | SNF | Scluster | Max-Flow/Min-Cut | |
| 50 | 0.62 | 0.67 | 0.72 | 0.78 |
| 100 | 0.64 | 0.69 | 0.723 | 0.81 |
| 150 | 0.645 | 0.698 | 0.74 | 0.83 |
| 200 | 0.66 | 0.71 | 0.76 | 0.85 |
Abbreviation: SNF, similarity network fusion.
Clustering Accuracy
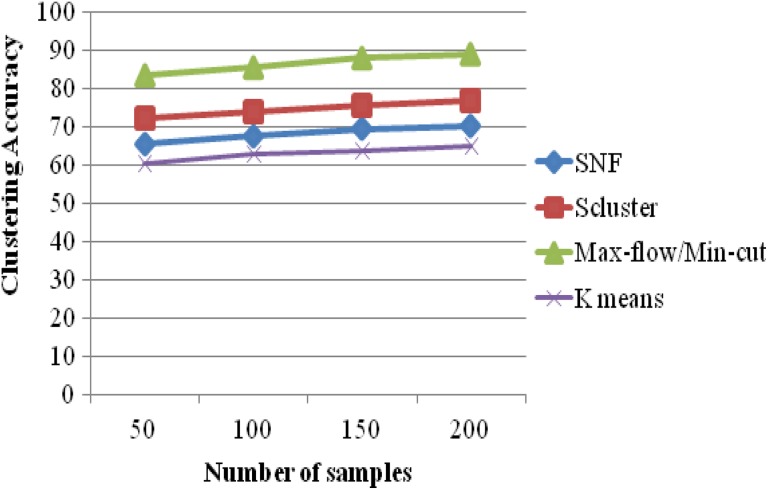
In Figure 6, the clustering accuracy results of 4 k means , SNF, iCluster, and max-flow/min-cut clustering algorithms on GBM data sets with miRNA expression are evaluated. It makes it clear that the proposed max-flow/min-cut clustering algorithms produce higher accuracy results of 88.93% for 215 samples, whereas the other clustering algorithms such as k means, SNF, and iCluster produce accuracy results of 64.89%, 71.42%, and 77.52% values, respectively, as seen in Table 6. The clustering accuracy results of the proposed system are high for clustering gene samples.
Figure 6.
Clustering accuracy versus clustering algorithms.
Table 6.
Clustering Accuracy Versus Number of Samples.
| No. of Samples | Clustering Accuracy (%) | |||
|---|---|---|---|---|
| K-Means | SNF | Scluster | Max-Flow/Min-Cut | |
| 50 | 60.25 | 65.32 | 72.36 | 83.23 |
| 100 | 62.82 | 67.45 | 74.15 | 85.36 |
| 150 | 63.51 | 69.51 | 75.68 | 87.89 |
| 200 | 64.89 | 70.25 | 76.93 | 88.93 |
Abbreviation: SNF, similarity network fusion.
Survival Probability
The survival probability at any particular time is calculated by the formula given below:
| 17 |
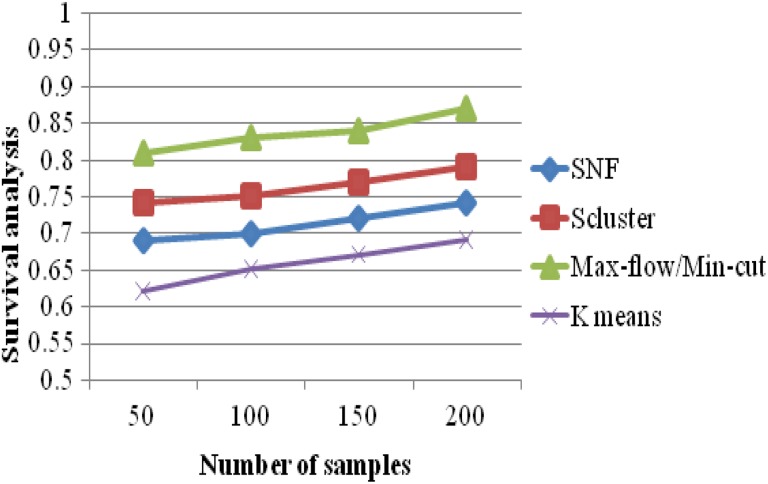
The survival probability results of 4 k means clustering, SNF, iCluster, and max-flow/min-cut clustering algorithms are evaluated in Figure 7. It becomes clear that the proposed max-flow/min-cut clustering algorithms produce higher accuracy results of 0.87 for 215 samples, whereas the other clustering algorithms such as k means, SNF, and iCluster produce accuracy results of 0.69, 0.74, and 0.79 values, as furnished in Table 7.
Figure 7.
Survival analysis versus clustering algorithms.
Table 7.
Survival Analysis Versus Number of Samples.
| No. of Samples | Survival Analysis | |||
|---|---|---|---|---|
| K-Means | SNF | Scluster | Max-Flow/Min-Cut | |
| 50 | 0.62 | 0.69 | 0.74 | 0.81 |
| 100 | 0.65 | 0.7 | 0.75 | 0.83 |
| 150 | 0.67 | 0.72 | 0.77 | 0.84 |
| 200 | 0.69 | 0.74 | 0.79 | 0.87 |
Abbreviation: SNF, similarity network fusion.
Clustering Results
Table 8 shows the number of clusters and the distribution of samples among the clusters for their gene expression subtypes. It is found that the number of clusters k = 3 is appropriate number of clusters to use.
Table 8.
Clusters Versus Gene Expression Subtypes.
| Clusters | Gene Expression Subtypes | |||
|---|---|---|---|---|
| Mesenchymal | Classical | Neural | Proneural | |
| Cluster 1 | 54 | 49 | 34 | 26 |
| Cluster 2 | 11 | 8 | 5 | 6 |
| Cluster 3 | 6 | 2 | 7 | 7 |
Classification Results
In a classification task, the precision for a class is the number of true positives (TPs; ie, the number of items correctly labeled as belonging to the positive class) divided by the total number of elements labeled as belonging to the positive class (ie, the sum of TPs and false positives [FPs]). These are items incorrectly labeled as belonging to the class. Recall in this context is defined as the number of TPs divided by the total number of elements that actually belong to the positive class.
| 18 |
| 19 |
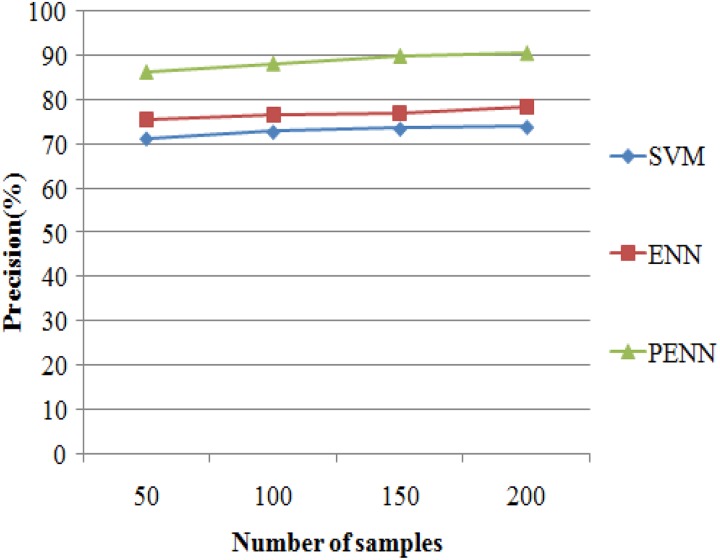
The precision results of 3 algorithms such as support vector machine (SVM), ENN, and probabilistic-enhanced NN (PENN) are evaluated in Figure 8. It exemplifies that the proposed PENN algorithm produces higher accuracy results of 90.58% for 215 samples, whereas the other classification algorithms such as SVM and ENN produce precision results of 73.93% and 78.51% values. The results are presented in Table 9.
Figure 8.
Precision versus classification algorithms.
Table 9.
Precision Results Versus Number of samples
| No. of Samples | Precision (%) | ||
|---|---|---|---|
| SVM | ENN | PENN | |
| 50 | 71.32 | 75.63 | 86.38 |
| 100 | 72.82 | 76.58 | 88.25 |
| 150 | 73.52 | 77.15 | 89.93 |
| 200 | 73.93 | 78.51 | 90.58 |
Abbreviations: ENN, enhanced neural network; PENN, Prognosis Enhanced Neural Network; SVM, support vector machine.
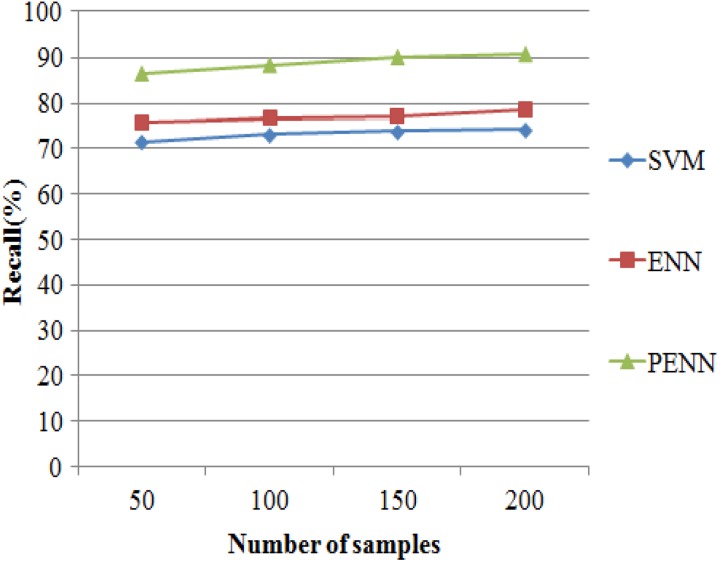
The recall results of 3 classification algorithms such as SVM, ENN, and PENN are evaluated in Figure 9. It makes evident that the proposed PENN algorithm produces higher accuracy results of 92.14% for 215 samples, whereas the other classification algorithms such as SVM and ENN produce recall results of 79.25% and 83.52% values that are shown in Table 10.
Figure 9.
Recall versus classification algorithms.
Table 10.
Recall Results Versus Number of Samples.
| No. of Samples | Recall (%) | ||
|---|---|---|---|
| SVM | ENN | PENN | |
| 50 | 75.78 | 80.63 | 89.78 |
| 100 | 77.63 | 81.87 | 90.51 |
| 150 | 78.42 | 82.34 | 91.54 |
| 200 | 79.25 | 83.52 | 92.14 |
Abbreviations: ENN, enhanced neural network; PENN, Prognosis Enhanced Neural Network; SVM, support vector machine.
Accuracy is also used as a statistical measure of how well a binary classification test correctly identifies or excludes a condition. That is, the accuracy is the proportion of true results (both TPs and true negatives among the total number of cases examined).
| 20 |
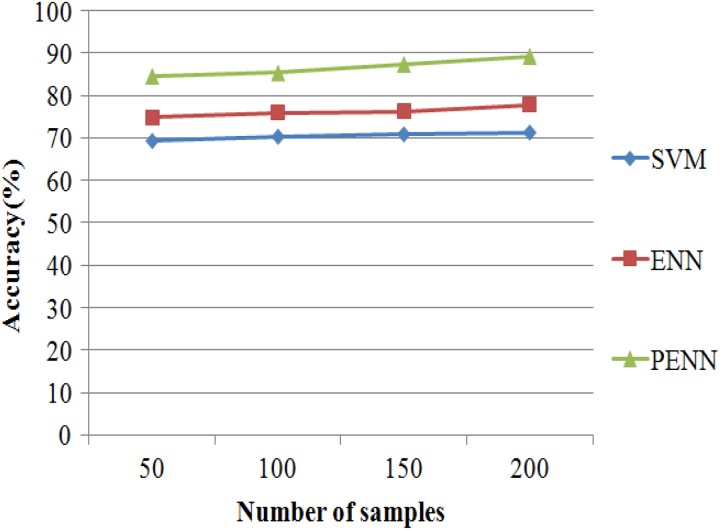
The accuracy results of 3 classification algorithms such as SVM, ENN, and PENN are evaluated in Figure 10. It shows clearly that the proposed PENN algorithm produces higher accuracy results of 89.2% for 215 samples, whereas the other classification algorithms such as SVM and ENN that produce accurate results of 71.23% and 77.81% values are discussed in Table 11.
Figure 10.
Accuracy versus classification algorithms.
Table 11.
Accuracy Results Versus Number of Samples.
| No. of Samples | Accuracy (%) | ||
|---|---|---|---|
| SVM | ENN | PENN | |
| 50 | 69.23 | 74.78 | 84.58 |
| 100 | 70.25 | 75.93 | 85.36 |
| 150 | 70.81 | 76.25 | 87.32 |
| 200 | 71.23 | 77.81 | 89.2 |
Abbreviations: ENN, enhanced neural network; PENN, Prognosis Enhanced Neural Network; SVM, support vector machine.
Receiver Operating Characteristic Curve
In statistics, a receiver operating characteristic (ROC) curve is a graphical plot that illustrates the diagnostic ability of a binary classifier system as its discrimination threshold is varied. The ROC curve is created by plotting the TP rate (TPR) against the FP rate at various threshold settings.
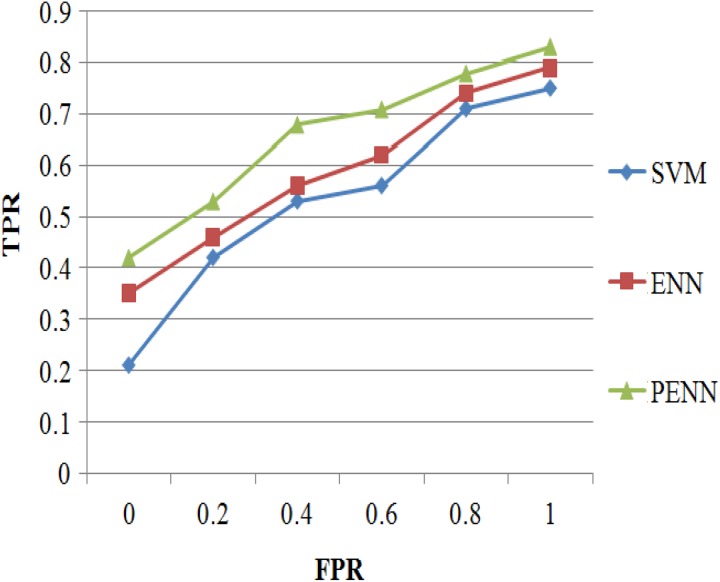
Figure 11 shows the ROC curve analysis results of 3 classification algorithms such as SVM, ENN, and PENN; it concludes that the proposed PENN algorithm produces higher TPR results of 83% for 200 samples, whereas the other classification algorithms such as SVM and ENN produces TPR results of 75% and 79% values that are discussed in Table 12.
Figure 11.
Receiver operating characteristic (ROC) curve versus classification algorithms.
Table 12.
ROC Curve Versus Classification Algorithms.
| FPR | TPR | ||
|---|---|---|---|
| SVM | ENN | PENN | |
| 0 | 0.21 | 0.35 | 0.42 |
| 0.2 | 0.42 | 0.46 | 0.53 |
| 0.4 | 0.53 | 0.56 | 0.68 |
| 0.6 | 0.56 | 0.62 | 0.71 |
| 0.8 | 0.71 | 0.74 | 0.78 |
| 1 | 0.75 | 0.79 | 0.83 |
Abbreviations: ENN, enhanced neural network; FPR, false-positive rate; PENN, Prognosis Enhanced Neural Network; ROC, receiver-operating characteristic; SVM, support vector machine; TPR, true-positive rate.
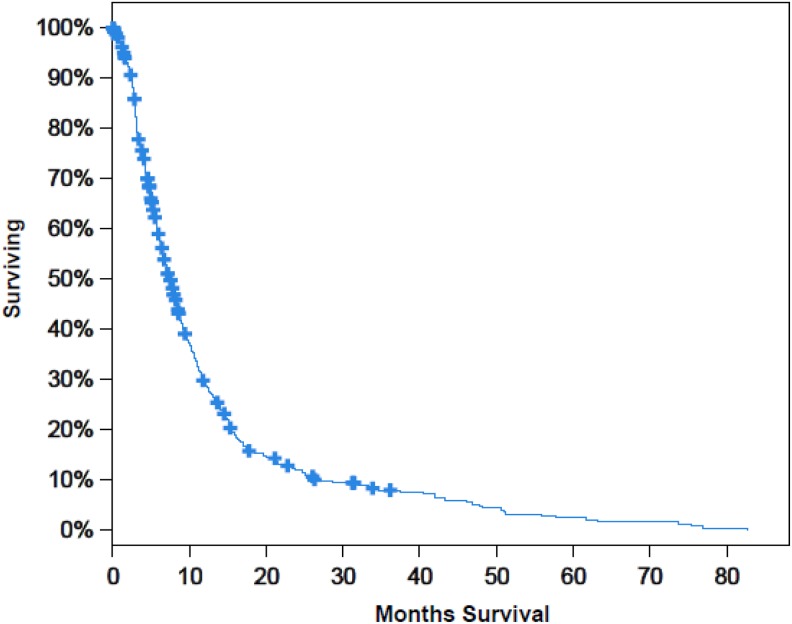
Figure 12 shows the survival curve of patients in terms of the percentage with respect to the number of months of survival in the interval of 10 to 80 months. From the curve, we can analyze that 40% of patients survive for 10 months. And as month increases, the survival rate decreases which can be viewed from the curve that only 5% patients survive in 50 months of time.
Figure 12.
Survival analysis versus number of months.
Discussion
The proposed max-flow/min-cut clustering algorithm produces average silhouette width results of 0.7725, which is 0.225, 0.1875, and 0.095 values higher when compared to k means, SNF, and Scluster methods, respectively. Similarly, the proposed clustering produces average BSI results of 0.8175, which is 0.17625, 0.1255, and 0.08175 higher when compared to k means clustering, SNF, and Scluster methods, respectively. Similarly, it also produces higher results for clustering accuracy and the survival analysis are illustrated in Figures 6 and 7. The proposed PENN algorithm produces average accuracy results of 86.615%, which is 16.235% and 10.4225% higher when compared to SVM and ENN methods, respectively.
Conclusion
Discovering diverse cancer classes or subclasses with a huge amount of diverse biological measurements provides a tough challenge and has significant implication in cancer analysis and treatment. Clustering dependent upon multigenomic data has been represented to be a dominant technique in cancer class detection. To completely consider different varieties of data (DNA methylation, mRNA expression, miRNA expression, and so on), a few unsupervised clustering techniques that incorporate the specified data to take out major characteristics simultaneously have been presented. Graph clustering has the supremacy of various data sets to give new techniques for unsupervised clustering over various data sets. Graph clustering has the capability of identifying both the replicable and prognostically significant subtypes devoid of any extra data set-specific transformations, unlike the currently developed technique of concatenation. Bringing in an adaptive S-RRR technique to identify an effective low-dimensional subspace of each biological data afterward incorporated these biological subspaces into a patient-by-patient similarity matrix. The PENN classifier on the GBM data set is effectual for predicting the survival, while matched up with other previous classifiers for forecast. The experimentation outcomes on GBM point out that research methodology could confine biology feature and discover classifications of subtypes impressively, dependent upon gene expression data and DNA methylation data. The work can be further extended by implementing semi-supervised clustering by which the accuracy can be improved.
Abbreviations
- BSI
biological stability index
- CRC
colorectal cancer
- ENNs
enhanced neural networks
- FCA
formal concept analysis
- FPs
false positives
- GBM
glioblastoma multiforme
- MB
medulloblastoma
- MGP
multiple genomic platform
- miRNA
microRNA
- mRNA
messenger RNA
- NMF
nonnegative matrix factorization
- NN
neural network
- NSCLC
non-small cell lung cancer
- PCA
principal component analysis
- PDA
pancreatic ductal adenocarcinoma
- PENN
Prognosis Enhanced Neural Network
- ROC
receiver-operating characteristic
- SARRS
subspace-assisted regression with row sparsity
- SNF
similarity network fusion
- S-RRR
sparse-reduced rank regression
- SVM
support vector machine
- TPR
true-positive rate
- TPs
true positives
Footnotes
Declaration of Conflicting Interests: The author(s) declared no potential conflicts of interest with respect to the research, authorship, and/or publication of this article.
Funding: The author(s) received no financial support for the research, authorship, and/or publication of this article.
ORCID iD: Prasanna Vasudevan, ME  http://orcid.org/0000-0001-6170-1976
References
- 1. Menezes RX, Boetzer M, Sieswerda M, Van Ommen GJ, Boer JM. Integrated analysis of DNA copy number and gene expression microarray data using gene sets. BMC Bioinformatics. 2009;10(1):203. [DOI] [PMC free article] [PubMed] [Google Scholar]
- 2. Hyman E, Kauraniemi P, Hautaniemi S, et al. Impact of DNA amplification on gene expression patterns in breast cancer. Cancer Res. 2002;62(21):6240–6245. [PubMed] [Google Scholar]
- 3. Lewis BP, Burge CB, Bartel DP. Conserved seed pairing, often flanked by adenosines, indicates that thousands of human genes are microRNA targets. Cell. 2005;120(1):15–20. [DOI] [PubMed] [Google Scholar]
- 4. Cancer Genome Atlas Research Network. Comprehensive genomic characterization defines human glioblastoma genes and core pathways. Nature. 2008;455(7216):1061–1068. [DOI] [PMC free article] [PubMed] [Google Scholar]
- 5. Huang DS, Zheng CH. Independent component analysis-based penalized discriminant method for tumor classification using gene expression data. Bioinformatics. 2006;22(15):1855–1862. [DOI] [PubMed] [Google Scholar]
- 6. Zheng CH, Zhang L, Ng TY. Meta sample-based sparse representation for tumor classification. IEEE/ACM Trans Comput Biol Bioinform. 2011;8(5):1273–1282. [DOI] [PubMed] [Google Scholar]
- 7. Qin LX. An integrative analysis of microRNA and mRNA expression—a case study. Cancer Inform. 2008;6:369–379. [DOI] [PMC free article] [PubMed] [Google Scholar]
- 8. Lee H, Kong SW, Park PJ. Integrative analysis reveals the direct and indirect interactions between DNA copy number aberrations and gene expression changes. Bioinformatics. 2008;24(7):889–896. [DOI] [PMC free article] [PubMed] [Google Scholar]
- 9. Pusztai L, Mazouni C, Anderson K, Wu Y, Symmans WF. Molecular classification of breast cancer: limitations and potential. Oncologist. 2006;11(8):868–877. [DOI] [PubMed] [Google Scholar]
- 10. Lenz G, Wright GW, Emre NT, et al. Molecular subtypes of diffuse large B-cell lymphoma arise by distinct genetic pathways. Proc Natl Acad Sci U S A. 2008;105(36):13520–13525. [DOI] [PMC free article] [PubMed] [Google Scholar]
- 11. De Souto MC, Costa IG, De Araujo DS, Ludermir TB, Schliep A. Clustering cancer gene expression data: a comparative study. BMC Bioinformatics. 2008;9(1):497. [DOI] [PMC free article] [PubMed] [Google Scholar]
- 12. Brunet JP, Tamayo P, Golub TR, Mesirov JP. Metagenes and molecular pattern discovery using matrix factorization. Proc Natl Acad Sci U S A. 2004;101(12):4164–4169. [DOI] [PMC free article] [PubMed] [Google Scholar]
- 13. Liu L, Hawkins DM, Ghosh S, Young SS. Robust singular value decomposition analysis of microarray data. Proc Natl Acad Sci U S A. 2003;100(23):13167–13172 [DOI] [PMC free article] [PubMed] [Google Scholar]
- 14. Shen R, Olshen AB, Ladanyi M. Integrative clustering of multiple genomic data types using a joint latent variable model with application to breast and lung cancer subtype analysis. Bioinformatics. 2009;25(22):2906–2912. [DOI] [PMC free article] [PubMed] [Google Scholar]
- 15. Wang B, Mezlini AM, Demir F, et al. Similarity network fusion for aggregating data types on a genomic scale. Nat Methods. 2014;11(3):333–337. [DOI] [PubMed] [Google Scholar]
- 16. Wu MY, Dai DQ, Zhang XF, Zhu Y. Cancer subtype discovery and biomarker identification via a new robust network clustering algorithm. PLoS One. 2013;8(6):e66256. [DOI] [PMC free article] [PubMed] [Google Scholar]
- 17. Zhang W, Wei Y, Ignatchenko V, et al. Proteomic profiles of human lung adeno and squamous cell carcinoma using super-SILAC and label-free quantification approaches. Proteomics. 2014;14(6):795–803. [DOI] [PubMed] [Google Scholar]
- 18. Collisson EA, Sadanandam A, Olson P, et al. Subtypes of pancreatic ductal adenocarcinoma and their differing responses to therapy. Nat Med. 2011;17(4):500–503. [DOI] [PMC free article] [PubMed] [Google Scholar]
- 19. Amin I, Kassim SK, Hassanien A, Hefny HA. Using formal concept analysis for mining hyomethylated genes among breast cancer tumors subtypes. IIEEE 12th International Conference on Intelligent Systems Design and Applications (ISDA), Mysore, India 2012;764–769. [Google Scholar]
- 20. Sadanandam A, Lyssiotis CA, Homicsko K, et al. A colorectal cancer classification system that associates cellular phenotype and responses to therapy. Nat Med. 2013;19(5):619–625. [DOI] [PMC free article] [PubMed] [Google Scholar]
- 21. Budinska E, Popovici V, Tejpar S, et al. Gene expression patterns unveil a new level of molecular heterogeneity in colorectal cancer. J Pathol. 2013;231(1):63–76. [DOI] [PMC free article] [PubMed] [Google Scholar]
- 22. Keller BJ, Eichinger F, Kretzler M. Formal concept analysis of disease similarity. AMIA Jt Summits Transl Sci Proc. 2012;2012:42–51. [PMC free article] [PubMed] [Google Scholar]
- 23. Planey CR, Gevaert O. CoINcIDE: a framework for discovery of patient subtypes across multiple datasets. Genome Med. 2016;8(1):27. [DOI] [PMC free article] [PubMed] [Google Scholar]
- 24. Chen P, Fan Y, Man TK, Hung YS, Lau CC, Wong ST. A gene signature based method for identifying subtypes and subtype-specific drivers in cancer with an application to medulloblastoma. BMC Bioinformatics. 2013;14(suppl 18):S1. [DOI] [PMC free article] [PubMed] [Google Scholar]
- 25. Ge SG, Xia J, Sha W, Zheng CH. Cancer subtype discovery based on integrative model of multigenomic data. IEEE/ACM Trans Comput Biol Bioinform. 2017;14(5):1115–1121. [DOI] [PubMed] [Google Scholar]
- 26. Ma Z, Sun T. Adaptive sparse reduced-rank regression. arXiv Preprint;1922.
- 27. Lin DD, He H, Li L. Network-based investigation of genetic modules associated with functional brain networks in schizophrenia. Proc IEEE Int Conf Bioinf Biomed, 2013;9–16. [Google Scholar]
- 28. Choong MY, Kow WY, Khong WL, Liau CF, Teo KTK. An image segmentation using normalised cuts in multistage approach. Image. 2012;5(6):10–16. [Google Scholar]
- 29. Ding C, He X. K-means clustering via principal component analysis. Proceedings of the Twenty-First International Conference on Machine Learning, New York, NY: ACM, 2004;1–8. [Google Scholar]
- 30. Demuth HB, Beale MH, De Jess O, Hagan MT. Neural Network Design. 2014.
- 31. Hyder M, Shahid M, Kashem M, Islam M. Initial weight determination of a MLP for faster convergence. JECS. 2009;1–6. [Google Scholar]
- 32. Neal RM. Bayesian learning for neural networks Springer Science & Business Media. Springer; 2012. [Google Scholar]
- 33. Verhaak RG, Hoadley KA, Purdom E. Integrated genomic analysis identifies clinically relevant subtypes of glioblastoma characterized by abnormalities in PDGFRA, IDH1, EGFR, and NF1. Cancer Cell. 2010;17(1):98–110. [DOI] [PMC free article] [PubMed] [Google Scholar]
- 34. Datta S, Datta S. Comparisons and validation of statistical clustering techniques for microarray gene expression data. Bioinformatics. 2003;19(4):459–466. [DOI] [PubMed] [Google Scholar]


