

Abstract
Motivational increases due to exposure to alcohol-paired Conditioned Stimuli (CS) are central to some accounts of alcoholism. However, few studies isolate a stimulus’s function as a CS from its other potential functions. Pavlovian-Instrumental-Transfer (PIT) procedures isolate a stimulus’s function as a CS from its other functions. Though there are several relevant studies using PIT, knowledge gaps exist. Particularly, it is not clear that an alcohol-paired CS will increase alcohol seeking compared to the same stimulus in a Truly-Random-Control group, nor whether such increases are specific to alcohol seeking. To address these knowledge gaps in Experiment 1, rats responded for ethanol (0.1 ml 8% w/v) under an RI 30-sec schedule, then the lever was removed and half the rats had ethanol delivered during occasional 120-sec light presentations, while the remainder had ethanol and the light presented under independent RT schedules. Later the lever was returned and the light was presented during responding in extinction (PIT test). Following this test, levers were again removed and the light was presented without ethanol (light extinction), following again by a PIT test. Responding in the two groups during light presentations did not differ in either PIT test. Experiment 2 repeated Experiment 1 using food instead of ethanol. In Experiment 2, responding during light presentations increased in the paired group. In Experiment 3, rats were trained on a concurrent FR schedule of food and ethanol delivery. Ethanol was delivered following 5 responses and the response requirement for food adjusted so that similar numbers of food and ethanol deliveries were obtained. Subsequently, rats underwent conditioning, control and testing procedures identical to those in Experiment 1. In Experiment 3, the ethanol-paired CS increased ethanol-responding, but not food-responding. These results are most easily interpreted as changes in responding resulting from CS-elicited behavior rather than motivational changes. This interpretation is more compatible with some descriptions of the role of an alcohol-paired CS in alcoholism than others.
Keywords: Pavlovian Conditioning, Pavlovian-Instrumental-Transfer, Ethanol Self-administration, Rat, Truly-Random-Control, Associative Learning, Addiction, Alcoholism, Craving
Graphical abstract
Introduction
Associative learning is widely believed to play an important role in alcoholism and addiction, particularly relapse (Wikler 1948; de Wit & Stewart 1981; Koob et al 1989; Robinson & Berridge 1993; Tomie 1995; Hogarth et al 2013). This role is difficult to study directly in humans. So, preclinical research is often used to examine this role. However, there are several important knowledge gaps in what can be taken away from the existing preclinical literature on the role of associative learning in addiction (Lamb et al 2016a). Stimuli paired with the effects of an abused drug can come to elicit conditioned responses (CR) that for the most part resemble the actions of the drug (see Eikelboom & Stewart 1984). Thus, drug-paired stimuli can become conditioned stimuli (CS) that elicit conditioned responses (CR) resembling the unconditioned response (UR) to the drug, the unconditioned stimulus (US). A drug-paired stimulus can also elicit approach towards the stimulus (e.g., Cunningham & Patel 2007; Uslaner at al 2006; Peters & de Vries 2014; Srey et al 2015) and presentation of this stimulus can reinforce behavior (Davis & Smith 1976; Shahan 2002; Woods & Winger 2002). These later two functions of a drug-paired stimulus are two of the three attributes of a drug-paired stimulus Robinson & Berridge use to define incentive salience (Berridge & Robinson 2003). The third attribute is the facilitation of instrumental responding for drug by the drug-paired CS. This is generally studied using Pavlovian-Instrumental-Transfer (PIT) procedures, which train the CS-drug (US) relationship separately from the response contingent drug delivery relationship. Subsequently, the effect of the CS on responding, which no longer results in drug delivery, is examined. PIT is present when the CS increases responding.
Seven studies have examined the ability of drug-paired stimuli to produce PIT: Five with ethanol (Corbit & Janak 2007; Glasner et al 2005; Krank 2003; Krank et al 2008; Milton et al 2012) and two with cocaine (Kuzich et al 2001; LeBlanc et al 2012). Six of these studies found PIT and one did not. The only study not finding PIT was also the only study using a Truly-Random-Control procedure for its comparison condition (Kuzich et al 2001). This is important because the Truly-Random-Control procedure is generally considered the most appropriate control for demonstrating that the effect observed resulted from associative learning (Rescorla 1967), i.e., an effect of the stimulus serving as a CS. This finding that a drug-paired stimulus does not increase responding for drug when compared to the effects of the same stimulus in a Truly-Random-Control group suggests that the findings from the other six studies might have resulted from processes other than the CS increasing responding. However, this seems unlikely to be true; and there are factors in the design of the one study failing to find PIT that may limit the generality of this finding. In particular, the two elements of a compound stimulus used as a CS were presented according to independent schedules in the Truly- Random-Control group (Kuzich et al 2001) and this may have made the compound stimulus relatively novel in the control group and the comparison between the Truly- Random-Control group and the experimental group inappropriate. To further examine whether drug-paired stimuli can facilitate responding for drug through associative learning, we report experiments in which the effects of an ethanol-paired stimulus on responding that had been maintained by ethanol are compared to the effects of the same stimulus in another group in which the stimulus and ethanol are presented on independent random time schedules.
Another gap in our understanding of the effects of drug-paired CS in a PIT procedure is the specificity of this effect. Most descriptions of the role of drug-paired CSs in addiction implicitly assume that a drug-paired CS increases responding for drug, but not other behavior (but see Hogarth et al 2013). However, the two studies that have examined this issue actually find the opposite effect (Glasner et al 2005; Corbit & Janak 2007). In these two studies an ethanol-paired CS not only increased responding for ethanol, but also similarly increased responding that was maintained by another reinforcer. In neither of these studies, however, were the rats allowed to respond for ethanol and the other reinforcer at the same time during training. So, the rats were never required to learn that pressing one lever led to ethanol and that pressing another lever led to the other reinforcer, as both reinforcers were delivered to the same magazine and only one lever was ever present in the chamber at anyone time during training. Further, while during CS-US training a different sound was paired with the delivery of each reinforcer, both reinforcers were delivered to the same magazine. Thus, it is difficult to know whether the sounds were differentially associated with a particular reinforcer. Therefore, elements of the experimental design may have contributed to the lack of selectivity; however, Corbit & Janak (2007) did demonstrate the same design could result in selectivity with a reinforcer other than ethanol. To further explore selectivity, we report an experiment in which rats were trained to respond concurrently for ethanol and food on different levers and the response requirement on the food lever adjusted so that similar numbers of ethanol and food deliveries occurred during each session. Subsequently, a light was paired with non-contingent ethanol delivery. After this training, the effects of the CS on responding for food and ethanol were examined while responding was in extinction.
Materials and Methods
Subjects
All procedures conducted on the rats were approved by the local Institutional Animal Care and Use Committee and were in accordance with the NIH Guide for the Care and Use of Laboratory Animals (2013). Male Lewis rats weighing between 260 and 285 grams were purchased from Charles River. Rats were individually housed, and for approximately two-weeks were allowed unrestricted access to food and water. After this, food was restricted to 12 to 15 gram per day, but water was freely available except as noted below.
In Experiment 1, rats were divided into two experimental groups of 8 rats each by random assignment. Group sizes of 8 were based upon an expected effect size of d=1.9 (d=mean difference divided by the standard deviation) that was based upon some preliminary experimentation, and is loosely consistent with the effect size of other studies using ethanol (approximately 0.8 to 1.8 in Krank 2003; Glasner et al 2005; Corbit & Janak 2007; Krank et al 2008; Milton et al 2012). An effect size of 1.9 results in power of 95% with a two-tailed Type 1 error rate of 5% for group sizes of 8. Rats were randomly assigned to receive either pairing of a stimulus with ethanol delivery or to a Truly Random Control condition in which the stimulus and ethanol delivery were uncorrelated. Randomization occurred according to the following rules: (1) as eight rats were run at any one time of the day, 4 were assigned to each group; (2) each set of eight rats were divided into half according to the amount of ethanol earned in the week before randomization; and then (3) within each set of four, rats were assigned to one condition or the other by coin flip until two rats were assigned to a condition, after which the remaining rat(s) were assigned to the other condition.
In Experiment 2, rats were divided into two experimental groups of 8 rats each by random assignment. Rats were randomly assigned, according to the rules outlined above, to receive either pairing of a stimulus with food delivery or to a truly random control condition in which the stimulus and food delivery were uncorrelated.
In Experiment 3, rats were divided into two experimental groups of 16 rats each by random assignment. Group sizes of 16 were based upon an expected effect size of f=0.42 (based on the results of a preliminary experiment; f= standard deviation of the means divided by the standard deviation and is the appropriate effect size measure when multiple mean values might be compared), which would result in a power of 82% with a Type 1 error rate of 5%. Rats were randomly assigned to receive either pairing of a stimulus with ethanol delivery or to a Truly Random Control condition in which the stimulus and ethanol delivery were uncorrelated. Randomization occurred according to the following rules: (1) as eight rats were run at any one time of the day, 4 were assigned to each group; (2) each set of eight rats were divided into half according to the ratio of dipper presentations to food pellet deliveries in the week before randomization; and then (3) within each set of four, rats were assigned to one condition or the other by coin flip until two rats were assigned to a condition, after which the remaining rat(s) were assigned to the other condition. There was one exception to this. Two rats had low levels of ethanol self-administration and they formed their own strata. The first being assigned to one group via a coin flip and the other rat assigned to the other group.
Apparatus
Experiments occurred in eight commercially available operant chambers (ENV-008, Med-Associates, Georgia, VT) with two levers arranged on either side of one wall with a light above each and a houselight above the chamber on the opposite wall. A trough was positioned between the levers where rats could access food pellets (45 mg chow flavored, BioServ, Frenchtown, NJ) and solutions (via a 0.1 mL dipper mechanism) when they were delivered. Chambers were also equipped with a speaker connected to a tone generator (ANL-926, Med-Associates, Georgia, VT). Stimuli presentation, reinforcement delivery, and response recording were controlled using a program written and executed with commercially available software (Med-PC IV, Med-Associates, Georgia, VT). Operant chambers were housed in ventilated, light and sound attenuating cubicles (ENV-022V, Med-Associates, Georgia, VT). Pink noise was generated in the room housing operant equipment to further isolate tones within the operant chamber.
Induction of Ethanol Drinking
At mid-day rats in ethanol self-administration studies were fed their daily food ration. Two hours prior, drinking water was removed and one hour before feeding another bottle containing an ethanol solution was placed in the cage and remained available for two hours (i.e., until one hour after food was presented). Over sessions, which were conducted each weekday, the ethanol concentration was gradually increased from 0% to 12% and then reduced back to 8% (w/v). This took 53 sessions for the rats used in Experiment 1 and 64 sessions for the rats used in Experiment 3.
Experiment 1
Ethanol Self-administration
Self-administration sessions lasted one hour. Initially, in the presence of an 8 kHZ tone that served as a discriminative stimulus each lever press resulted in a 10 s presentation of 0.1 ml dipper containing 8%(w/v) ethanol during which time the tone was turned off. If rats did not rapidly acquire lever-pressing, a Random Time (RT) schedule of ethanol delivery in conjunction with the Fixed Ratio (FR) 1 schedule of ethanol delivery was run occasionally.
Once responding for ethanol was acquired, the response requirement was increased to 3 lever presses per dipper delivery. Once rats responded under an FR 3 schedule, they were moved onto a Random Interval (RI) 10 sec schedule of ethanol delivery (and dipper up times were decreased to 3 s) and over sessions this was increased to an RI 120 s schedule. To increase responding the schedule was reduced first to an RI 60 s and then to an RI 30 s schedule of ethanol delivery for the last 13 sessions. Ethanol self-administration training took 65 sessions.
Pavlovian Conditioning & Truly Random Control
Ten sessions were conducted during this phase and during these sessions the response levers were removed from the experimental chambers. Pavlovian conditioning sessions were 60 min long. Every third minute there was a 50% probability of turning on the cue light located over where the ethanol lever had been for 2 minutes. While this light was lit, 4- sec presentations of ethanol occurred under an RT 25 s schedule (with the RT schedule not operating during the dipper presentation and the probability query window set to 1 sec). During the Truly Random Control condition light presentations occurred under the same schedule, but ethanol deliveries occurred under a RT 80 s schedule (with the RT schedule operating during dipper presentations, but the query window set to 5 sec). This resulted in the same pattern of light presentations in both conditions, but in the Pavlovian Conditioning condition all ethanol presentations occurred during the 2 min light presentations, while in the Truly Random Control condition a similar number of ethanol presentations were delivered during the session with these deliveries distributed throughout the experimental session without regard to whether the light was on or not.
Test Session
Following the ten Pavlovian Conditioning or Truly Random Control sessions, the levers were returned to the experimental chambers and on the first day rats were run on an RI 120 s schedule of ethanol delivery and on the following day on an RI 30 s schedule of ethanol delivery. Following this, a test session was conducted. In the 28 min test sessions, the tone sounded constantly. After 4 min, the light above the ethanol lever came on for 2 min. This cycle repeated itself 4 times and then 4 min of the tone alone occurred after which the test session ended. This test occurred in extinction, i.e., ethanol was not presented.
Extinction
Following the first test session, 3 extinction sessions were conducted. These were identical to the Pavlovian Conditioning sessions, except that no ethanol was delivered. On the day subsequent to this, the levers were again returned to the experimental chamber and another Test session was conducted.
Experiment 2
Food-Maintained Behavior
Sessions lasted one hour. Initially, in the presence of an 8 kHZ tone that served as a discriminative stimulus, each lever press resulted in delivery of a 45-mg food pellet (Research Diets Inc; New Brunswick, NJ) and a 0.2-sec Time-Out during which time the tone was turned off and responding had no consequence. If rats did not rapidly acquire lever-pressing, a RT schedule of pellet delivery in conjunction with the FR 1 schedule of pellet delivery was run occasionally. Once, responding for food was acquired, the response requirement was increased to 2 lever presses per pellet delivery. Once rats responded under an FR 2 schedule, they were moved onto an RI 10 sec schedule of pellet delivery and over sessions this was increased to an RI 30 s schedule. Training took 28 sessions.
Pavlovian Conditioning & Truly Random Control
Ten sessions were conducted during this phase and during these sessions the response levers were removed from the experimental chambers. Pavlovian conditioning sessions were 60 min long. Every third minute there was a 50% probability of turning on the cue light located over were the food lever had been. While this light was lit, pellet delivery occurred under an RT 25 s schedule. During the Truly Random Control condition light presentations occurred under the same schedule, but pellet deliveries occurred under a RT 80 s schedule. This resulted in the same pattern of light presentations in both conditions, but in the Pavlovian Conditioning condition all pellet deliveries occurred during the 2 min light presentations, while in the Truly Random Control condition a similar number of pellet deliveries occurred during the session with these deliveries distributed throughout the experimental session without regard to whether the light was on or not.
Test Session
Test sessions were conducted identically to Experiment 1.
Extinction
Extinction sessions were conducted identically to Experiment 1.
Experiment 3
Ethanol- and Food-maintained behavior
Sessions lasted 30 min. Initially, in the presence of an 8 kHZ tone that served as a discriminative stimulus each lever press resulted in a 10 s presentation of 0.1 ml dipper containing 8%(w/v) ethanol during which time the tone was turned off. If rats did not rapidly acquire lever-pressing, a RT schedule of ethanol delivery in conjunction with the FR 1 schedule of ethanol delivery was run occasionally. Once responding for ethanol was acquired, the response requirement was increased over days to 5 lever presses per dipper delivery. During this time only the right-side lever was present. Once rats responded under an FR 5 schedule for ethanol, on alternate days the right-side lever was removed and the left-side lever placed in the chamber. Responses on this lever delivered a 45-mg food pellet. Over sessions the response requirement on the food-lever was increased to 10. Once responding was stable, both levers were left in the chamber and response requirement on the food lever adjusted to equalize pellet and dipper presentations. Training took about 200 sessions.
Pavlovian Conditioning & Truly Random Control
Pavlovian Conditioning and Truly Random Control sessions were conducted identically to Experiment 1.
Test Session
Test sessions were conducted identically to Experiment 1.
Extinction
Extinction sessions were conducted identically to in Experiment 1.
Analytic Approach
The main experimental question in these experiments was whether the CS increased responding for the US. Changes in responding were measured using change scores: (number of responses during the 120-sec light presentations) minus (number of responses during the 120 sec that preceded light presentations). Increases in responding for the US was tested in two comparisons: (1) whether the change score was greater than zero in the experimental group, i.e., whether the Paired group responded more during the light presentations than period preceding light presentations; and most importantly (2) whether the change scores for responding for the US were greater in the Paired group than in the Truly Random Control group. For Experiment 3, there was the additional question of whether the ethanol-paired CS increased ethanol responding more than it increased food responding. This was addressed both by conducting the analysis described above for both ethanol and food change scores, and more directly by comparing change scores for ethanol and food responding.
The second experimental question of interest was whether the CS increased entries into the magazine to which ethanol or food was delivered. This was assessed similarly to the question of whether the CS increased ethanol responding. Another question of interest was whether there was any relationship between changes in the number of magazine entries and changes in responding following CS presentation. This question was addressed by regressing the two variables, and comparing these regressions obtained in the Paired and Control groups.
The final experimental question of interest was whether these effects were altered by extinction. This was addressed by conducting the above analyses following extinction, and also comparing the values obtained before and after extinction.
Baseline responding between groups was also assessed to insure the adequacy of randomization at equalizing baseline responding. The pattern of results for magazine entries during conditioning and extinction are described to illustrate that these were in the expected directions with the caveat that these results do not establish magazine entries as a CR to the light CS, as dipper deliveries occurred throughout the time the light was lit.
Results
Experiment 1: Effects of an ethanol-paired CS on responding for ethanol
Ethanol Self-Administration
Responding for ethanol was similar in the Paired and Truly Random Control groups.
The mean number of responses for ethanol in the Paired group over the last five days before pairing ranged from 27.0 to 85.6 with a group mean of 48.6 (median = 51.3). In the Control group, number of responses ranged from 40.8 to 87.8 with a group mean of 56.1 (median = 52.4). The mean number of ethanol presentations earned in the Paired group ranged from 18.8 to 43.0 with a group mean of 26.9 (median = 24.5). In the Control group, number of ethanol presentations earned ranged from 19.4 to 46.0 with a group mean of 28.6 (median = 25.8). Thus, rats in the Paired group earned an average of 0.67 g/kg of ethanol (SD=0.18; median=0.63) and the Control group 0.70 (SD=0.20; median=0.64).
Pavlovian Conditioning
Learning in the Paired group cannot be tracked using magazine entries as dipper presentations occurred throughout the CS presentation. Thus, magazine entries might result from the CS eliciting a magazine entry CR or from approach following a dipper presentation. However, fewer entries by the Paired group when the light was lit would indicate a lack of conditioning. This was not the case.
On ten of 10 days, the Paired group made more entries when the light was lit than the Control group. Further, on 8 of 10 days, the Paired group made more entries when the light was lit than when it was not lit and on 9 of 10 days, fewer entries when the light was not lit than the Control group. In contrast, the Control group made more entries when the light was not lit than when it was lit on 10 of 10 days, which is to be expected given the light is not lit most of the time.
Pavlovian-Instrumental-Transfer
There was no evidence in this experiment that presentation of the light previously paired with ethanol delivery increased responding previously resulting in ethanol delivery or entries into the magazine to which ethanol was delivered.
Change Scores for Ethanol Responses
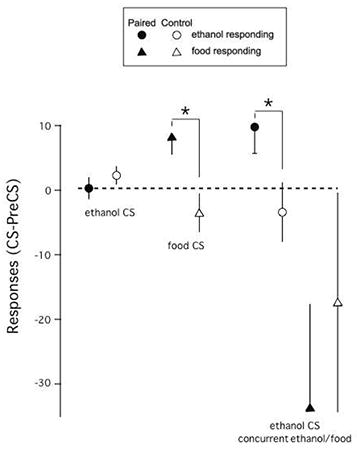
In the Paired group (Figure 1: left set of filled circles between the two scatter plots), 4 rats responded more during the 2-minute light presentations than in the 2 minutes preceding these presentations, 1 rat responded the same amount and 3 rats responded less. The median of these change scores in the Paired group was 0.5 with a range of -5 to 8, and a mean of 0.3 with a standard deviation of 4.4. This mean was not reliably different from zero (t(7)=0.2, p=0.88). Further, these values were similar to those in the Control group (open circles). In Control group, change scores were greater than zero in 5, zero in 1 and less than zero in 2 rats. The median of these change scores was 2 (-2 – 8) with a mean of 2.3 (3.6). Mean change scores in the Paired and Control groups were not reliably different (t(14)=-1.0, p=0.34).
Figure 1.
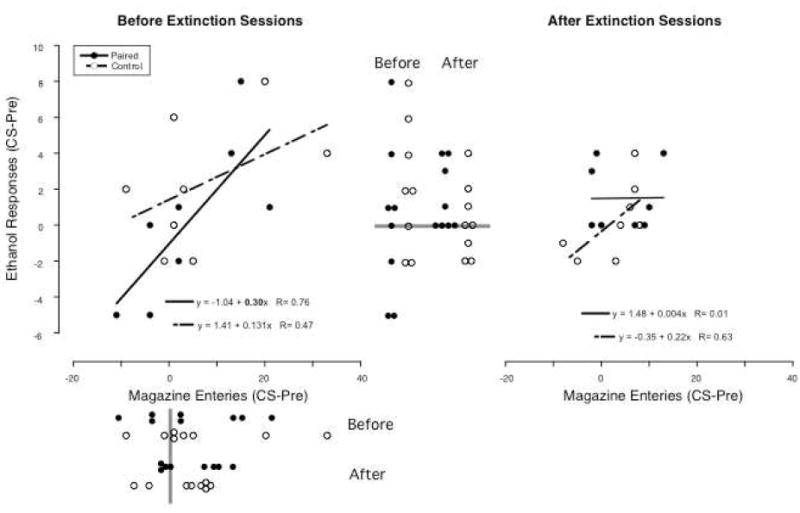
In the Paired group 2-minute light presentations were paired with ethanol presentations (filled circles) and in the Truly Random Control group both light and ethanol presentations were delivered under independent random time schedules (open circles). The effects of these light presentations on responding for ethanol that was in extinction and on entries into the magazine in which ethanol was delivered is shown in the right panel with ethanol responses on the Y-axis and magazine entries on the X-axis. Both responses and entries are plotted as change scores (responding during the 2-minute light presentations minus responding in the 2-minute period preceding light presentations). In the right panel, the same effects are shown following 3 sessions in which the light was presented as it was during conditioning, but ethanol is no longer presented. For convenience, lines representing the regression between responses and entries are plotted and the resulting regression values given (slopes significantly different from zero with P<0.05 are in bold). Also, dot plots of the ethanol responses are presented between the two scatter plots with the points on the left representing values before extinction and those on the right representing values after extinction. Dot plots of the magazine entries are presented below the X-axis of the right scatter plot with points on top representing values before extinction and those below representing values after extinction. The gray bars are drawn at zero. If any the mean value of any series of dots is significantly different from zero (P<0.05), this would be marked with an asterisk (*) and if the Paired and Control values within a condition differed significantly, or the values differ following extinction this would be marked with brackets and a pound sign (#) connecting the sets of dots.
Change Scores for Magazine Entries
In the Paired group (Figure 1: upper set of filled circles below the left scatter plot), change scores for magazine entries were positive for 5, and negative for 3 rats compared to 6 with a positive and 2 with a negative change score in the Control group (open circles). The medians were 2 (range: -11 – 21) and 2 (-9 - 33) in the Paired and Control groups respectively. Means were 4.3 (SD: 11.0) and 6.6 (13.4) and did not reliably differ (t(14)=0.4, p=0.70). Also, neither mean reliably differed from zero (Paired: t(7)=1.1, p=0.31; Control: t(7)=1.4, p=0.20).
Relationship between Change Scores for Ethanol Responses and Magazine Entries
Linear regression of change scores for responses on change scores for entries resulted in a slope significantly different from zero in the Paired (0.302, P=0.03; Figure 1, left panel), but not in the Control group (0.126. P=0.24). However, the two slopes were not reliably different (the slope of the Paired group was within the 95% confidence limits of the slope for the Control group, -0.112 – 0.365).
Extinction
Over the three extinction sessions, magazine entries declined in both the Paired and Control groups. This decline, at least in part, represents the absence of dipper deliveries, but may also reflect a change in learning in the Paired group.
In the Paired group when the light was lit, the mean number of entries across the three extinction sessions was 42.6, 38.1 & 21.9, and individual values were lower in extinction session 3 than extinction session 1, in 7 of 8 rats. In the Control group, means across the three extinction sessions were 32.6, 27.8 & 13.3, and individual values were lower in extinction session 3 than extinction session 1, in 7 or 8 rats.
Pavlovian-Instrumental-Transfer after Extinction
Extinction did not clearly affect changes scores for ethanol responses or magazine entries in either the Paired or Control groups. Except that following extinction, there was no reliable relationship between change scores for magazine entries and ethanol responses in either the Paired or Control groups.
Change Scores for Ethanol Responses after Extinction
Mean change scores for ethanol responding after extinction were not different from the means before extinction (Paired: t(7)=0.8, p=0.47; Control: t(7)=1.2, p=0.27).
In the Paired group (Figure 1: right set of filled circles between the two scatter plots), 4 rats had change scores for ethanol responding of zero and 4 rats had positive scores. In the Control group (open circles), 3 had positive, 2 zero and 3 negative change scores. The median change score was 0.5 (0 - 4) in the Paired and 0 (-2 – 4) in the Control group with means of 1.5 (1.9) and 0.3 (2.1), which were not reliably different (t(14)=-1.3, p=0.22). Also, neither mean was reliably different from zero (Paired: t(7)=2.3, p=0.06; Control: t(7)=0.3, p=0.74).
Change Scores for Magazine Entries after Extinction
Mean change scores for magazine entries after extinction were not different from the means before extinction (Paired: t(7)=0.0, p=1.00; Control: t(7)=0.8, p=0.44).
In the Paired group (Figure 1: lower set of filled circles below the left scatter plot), 4 rats had positive, 1 rat zero and 3 negative change scores compared to 6 positive and 2 negative in the Control group. Median changes scores were 3.5 (-2 – 13) and 5 (-8 – 8) in the Paired and Control groups respectively, with mean scores of 4.3 (6.1) and 2.8 (6.0), which were not reliably different (t(14)=-0.5, p=0.63). Also, neither mean was reliably different from zero (Paired: t(7)=-2.0, p=0.09; Control: t(7)=-1.3, p=0.25).
Relationship between Change Scores for Ethanol Responses and Magazine Entries after Extinction
The slope for the Paired group after extinction (0.004) was below the 95% CL of the slope obtained before extinction (0.043 – 0.562), but this is not the case in the Truly Random Control group.
The slope of the regression line (Figure 1, right panel) relating entries to responses after extinction was not different from zero in either the Paired (0.004, p=0.98) or Control groups (0.217, p=0.09). Also, the slope for the Paired group was within the 95% confidence limits of the slope for the Control group (-0.05 – 0.48).
Experiment 2: Effects of a food-paired CS on responding for food
Food Maintained Behavior
The two groups responded for food similarly, but the paired group earned fewer food deliveries.
The mean number of responses for food in the Paired group over the last five days before pairing ranged from 177.4 to 525.4 with a group mean of 269.9 (median = 267.1). In the Control group, number of responses ranged from 273.2 to 471.4 with a group mean of 344.2 (median = 336.3). The mean number of food deliveries earned in the Paired group ranged from 53.8 to 94.2 with a group mean of 74.5 (median = 78.3). In the Control group, number of food deliveries ranged from 84.4 to 98.6 with a group mean of 88.1 (median = 86.9). The difference between the Paired and Control groups in the number of food deliveries reached statistical significance (t(14)=2.52, P=0.02).
Pavlovian Conditioning
On ten of 10 days, the Paired group made more magazine entries when the light was lit than the Control group. Further on 5 of 10 days (including the last four conditioning days), the Paired group made more entries when the light was lit than when it was not lit, and on 10 of 10 days, fewer entries when the light was not lit than the Control group. In contrast to the Paired group, the Control group made more entries when the light was not lit than when it was lit on 10 of 10 days.
Pavlovian-Instrumental-Transfer
Unlike with ethanol, there is clear evidence that presentation of the light previously paired with food delivery increased responding that had previously resulted in food delivery.
Change Scores for food responses
In the Paired group (Figure 2: left set of filled circles between the two scatter plots), all 8 rats had positive change scores, while in the Control group (open circles), change scores were positive for 3 rats and negative for 5 rats. Mean change score was reliably greater than zero in the Paired group (t(7)=3.1, p=0.02), but not in the Control group (t(7)=-1.2, p=0.27). The mean change score in the Paired group was 8.3 (SD=7.6; median=5.5, range 1-23), while in the Control group it was -3.5 (SD=8.3; median =-2, range -19 – 7). The difference between the two groups was statistically reliable (t(14)=-3.0, p=0.01).
Figure 2.
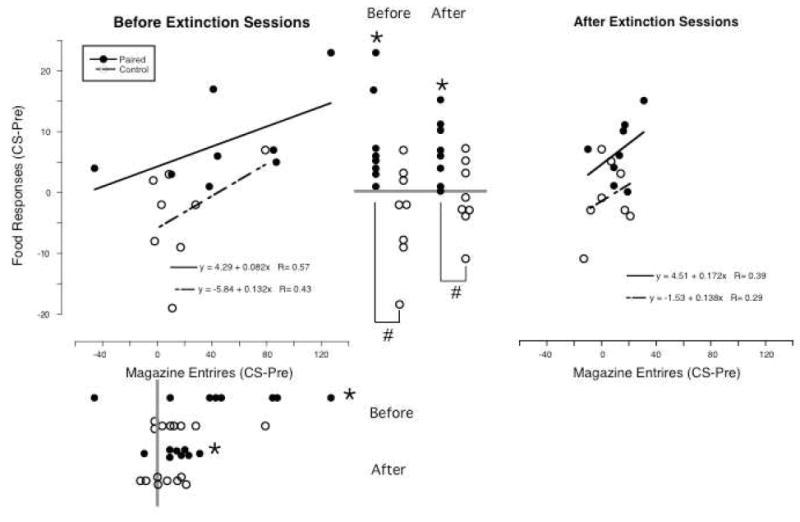
In the Paired group 2-minute light presentations were paired with food deliveries (filled circles) and in the Truly Random Control group both light and food were delivered under independent random time schedules (open circles). The effects of these light presentations on responding for food that was in extinction and on entries into the magazine to which food was delivered is shown in the left panel with food responses on the Y-axis and magazine entries on the X-axis. Both responses and entries are plotted as change scores (responding during the 2-minute light presentations minus responding in the 2-minute period preceding light presentations). In the right panel, the same effects are shown following 3 sessions in which the light was presented as it was during conditioning, but food is no longer presented. For convenience, lines representing the regression between responses and entries are plotted and the resulting regression values given (slopes significantly different from zero with P<0.05 would be in bold). Also, dot plots of the food responses are presented between the two scatter plots with the points on the left representing values before extinction and those on the right representing values after extinction. Dot plots of the magazine entries are presented below the X-axis of the right scatter plot with points on top representing values before extinction and those below representing values after extinction. The gray bars are drawn at zero. If any the mean value of any series of dots is significantly different from zero (P<0.05), this is marked with an asterisk (*) and if the Paired and Control values within a condition differed significantly, or the values differ following extinction this is marked with brackets and a pound sign (#) connecting the sets of dots.
Change Scores for Magazine Entries
In the Paired group (Figure 2: upper set of filled circles below the left scatter plot), 7 rats had positive change scores and 1 a negative change score compared to 6 positive and 2 negative change scores in the Control group. The mean change score in the paired group was 48.1 (SD=53.0, median=42.5, range -46 – 127), while in the Control it was 17.8 (SD=26.8; median =10, range -3 – 79). In the Paired group, the mean change score was reliably greater than zero (t(7)=2.6, p=0.04). This was not the case in the Control group (t(7)=1.9, p=0.10). Change scores were not reliably different between the Paired and Control groups (t(14)=-1.4, p=0.17).
Relationship between Change Scores for Ethanol Responses and Magazine Entries
Linear regression (Figure 2, left panel) of change scores for responding on change scores for entries resulted in a slope not significantly different from zero in either the Paired (0.082, P=0.14) or Control groups (0.132, P=0.29). Additionally, the two slopes did not reliably differ from each other (the slope of the Paired group was within the 95% confidence limits of the slope for the Control group -0.147 – 0.411).
Extinction
Over the three extinction sessions, head entries declined in both the Paired and Control groups.
In the Paired group when the light was lit, the mean values of head entries across the three extinction sessions were 181.0, 104.6 & 74.3, and individual values were lower in extinction session 3 than extinction session 1, in 8 of 8 rats. In the Control group, the means across the three extinction sessions were 94.5, 74.9 & 58.0, and individual values were lower in extinction session 3 than extinction session 1, in 5 of 8 rats.
Pavlovian-Instrumental-Transfer after Extinction
Extinction did not affect change scores either for responding or for magazine entries in either the Paired or Control groups; and again there was clear evidence of Pavlovian-Instrumental-Transfer in the Paired group.
Change Scores for Food Responses after Extinction
Mean change scores for food responding after extinction were not different from the means before extinction (Paired: t(7)=0.5, p=0.65; Control: t(7)=-0.9, p=0.40).
In the Paired group (Figure 2: right set of filled circles between the two scatter plots), 7 rats had positive change scores and 1 had a change score of zero. In the Control group (open circles), change scores were positive in 3, and negative in 5 rats. The median change score in the Paired group was 6.5 (0 – 15) and -2 (-11 – 7) in the Control group. The mean change scores were 6.8 (5.1) and -0.9 (5.8), and these means were reliably different (t(14)=-2.8, p=0.01). Additionally, the change score was reliably greater than zero in the Paired (t(7)=3.7, p=0.007), but not the Control group (t(7)=-0.4, p=0.68).
Change Scores for Magazine Entries after Extinction
Mean change scores for magazine entries after extinction were not different from the means before extinction (Paired: t(7)=1.9, p=0.10; Control: t(7)=1.2, p=0.27).
In the Paired group (Figure 2: lower set of filled circles below the left scatter plot), 7 rats had positive change scores and 1 a negative change score compared to 4 positive, 2 zero and 2 negative change scores in the Control group (open circles). The median change score in the Paired group was 14.5 (-10 – 31) compared to 3.5 (-13 – 21) in the Control group. The mean change scores were 13.0 (11.6) and 4.8 (12.1). The change score for the Paired group was reliably greater than zero (t(7)=3.2, p=0.02), but this was not the case in the Control group (t(7)= 1.1, p=0.30). The means of the two groups were not reliably different (t(14)=-1.4, p=0.19).
Relationship between Change Scores for Food Responses and Magazine Entries after Extinction
The slopes of both regression lines relating changes scores in magazine entries to change scores in food responses after extinction were within the 95% confidence limits of the slopes of these lines before extinction.
The slope of the regression line (Figure 2, right panel) relating entries to responses after extinction was not different from zero in either the Paired (0.172, p=0.34) or Control groups (0.138, p=0.49). Also, the slope for the Paired group was within the 95% confidence limits of the slope for the Control group (-0.317 – 0.593).
Experiment 3: Effects of a ethanol-paired CS on responding for ethanol and food
Ethanol & Food Maintained Behavior
The number of food- and ethanol- presentations was well matched within and between each group. Additionally, the number of ethanol-responses was similar in both groups, as was the number of food-responses. However, there were substantially more responses for food as compared to ethanol, as while the ethanol FR was fixed at 5, the food FR ranged from 5 to 50 with a median value of 25 and inter-quartile range of 15 to 30.
Ethanol-Maintained Behavior
In the Paired-Group, mean number ethanol-responses over the last five days before pairing ranged from 21.4 to 142.2 with a group mean of 75.4 (median = 69.1). In the Control group, means ranged from 18.8 to 227.0 for individual rats with a group mean of 81.4 (median = 66.8). In the Paired-Group, means for ethanol-presentations ranged from 1.6 to 28.4 with a group mean of 14.6 (median = 13.7). In the Control group, means ranged from 3.6 to 23.6 with a group mean of 14.4 (median = 13.3). Thus, rats in the Paired group earned an average of 0.35 g/kg of ethanol (SD=0.12; median=0.33) and the Control group 0.36 (SD=0.18; median=0.34).
Food-Maintained Behavior
In the Paired-Group, mean number of food-responses over the last five days before pairing ranged from 152.0 to 760.6 with a group mean of 405.9 (median = 396.4). In the Control group, means ranged from 138.6 to 710.0 with a group mean of 344.2 (median = 316.9). In the Paired-Group, means for food-deliveries ranged from 3.8 to 29.6 with a group mean 16.2 (median = 15.0). In the Control group, means ranged from 5.4 to 34.6 with a group mean of 15.4 (median = 14.3).
Pavlovian Conditioning
On ten of 10 days, the Paired group made more magazine entries when the light was lit than the Control group. Further on all but the first of the 10 days of conditioning, the Paired group made more entries when the light was lit than when it was not lit; and on 10 of 10 days, fewer entries when the light was not lit than the Control group. In contrast to the Paired group, the Control group made more head entries when the light was not lit than when it was lit on 10 of 10 days.
Pavlovian-Instrumental-Transfer
The ethanol-paired CS increased change scores for ethanol-responding, but not for food-responding. The CS also increased magazine entries. However, the CS did not clearly produce differential effects on change scores for ethanol or food.
Change Scores for ethanol responses
In the Paired group (Figure 3: left set of filled circles between the top two scatter plots), 12 rats had positive and 4 had negative change scores for ethanol-responding, while in the Control group (open circles), 6 had positive, 1 zero and 9 negative change scores. The mean change score in the Paired group was 9.8 (SD=16.3; median=15.0, range -22-34), while in the Control group it was -3.4 (SD=18.1; median =-1.5, range -41 – 24). The mean change score was reliably greater than zero in the Paired group (t(15)=2.4, p=0.03), but not in the Control group (t(15)=-0.7, p=0.47). Change scores were reliably different between the two groups (t(30)=2.2, p=0.04).
Figure 3.
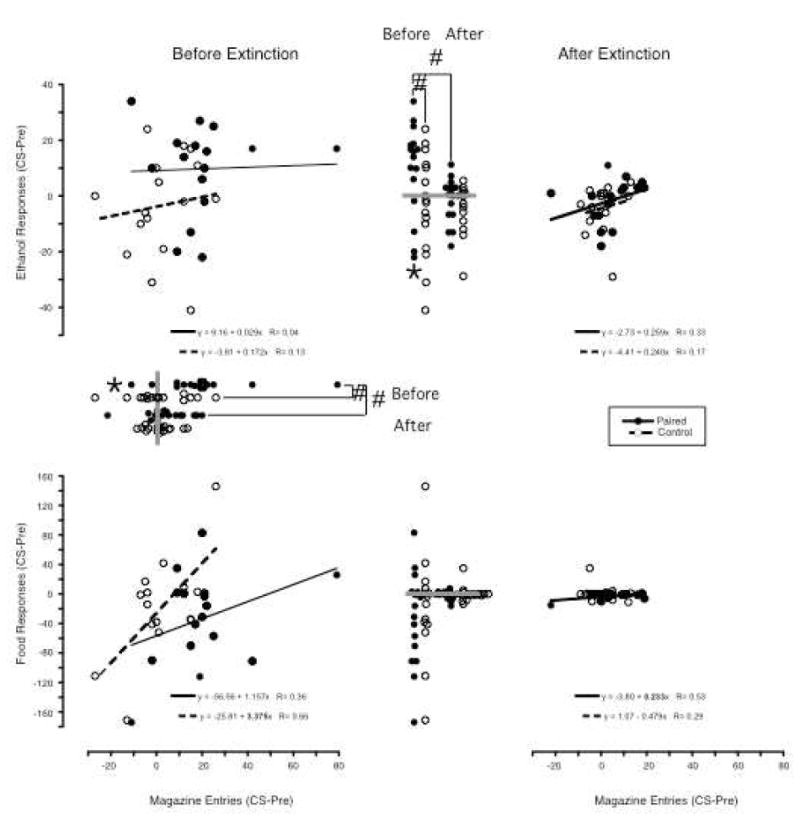
In the Paired group 2-minute light presentations were paired with ethanol presentations (filled circles) and in the Truly Random Control group both light and ethanol presentations were delivered under independent random time schedules (open circles). The effects of these light presentations on responding for ethanol (top panels) and food (bottom panels) that were in extinction and on entries into the magazine in which ethanol was delivered is shown in the left panels with responses on the Y-axis and magazine entries on the X-axis. Both responses and entries are plotted as change scores (responding during the 2-minute light presentations minus responding in the 2-minute period preceding light presentations). In the right panels, the same effects are shown following 3 sessions in which the light was presented as it was during conditioning, but ethanol is no longer presented. For convenience, lines representing the regression between responses and entries are plotted and the resulting regression values given (slopes significantly different from zero with P<0.05 are in bold; dashed line in bottom right scatter plot obscured by points). Also, dot plots of the ethanol (top) and food (bottom) responses are presented between the left and right scatter plots with the points on the left representing values before extinction and those on the right representing values after extinction. Dot plots of the magazine entries are presented below the X-axis of the left scatter plot with points on top representing values before extinction and those below representing values after extinction. The gray bars are drawn at zero. If any the mean value of any series of dots is significantly different from zero (P<0.05), this is marked with an asterisk (*) and if the Paired and Control values within a condition differed significantly, or the values differ following extinction this is marked with brackets and a pound sign (#) connecting the sets of dots.
Change Scores for food responses
In the Paired group (Figure 3: left set of filled circles between the bottom two scatter plots), 6 rats had positive change scores for food responding and 10 negative change scores. In the Control group (open circles), 7 had positive and 9 negative change scores. In neither group were change scores statistically different from zero (Paired group: mean=-33.6 (63.8), t(15)=-2.1, p=0.053; Control group: mean=-17.4 (67.6), t(15)=-1.0, p=0.32). Nor did change scores differ between the two groups (t(30)=-0.7, p=0.49).
Change Scores for Magazine Entries
In the Paired group (Figure 3: upper set of filled circles below the top left scatter plot), 14 rats had positive change scores magazine entries and 2 negative compared to 8 with positive, 1 zero and 7 with negative change scores in the Control group. Mean change score in the paired group was 19.9 (SD=19.6, median=19.5, range -11– 79), while in the Control group it was 2.5 (SD=13.3; median =0.5, range -27 – 26). Mean change score for the paired group was reliably greater than zero (t(15)=4.0, p=0.001), but not for the unpaired group (t(15)=0.8, p=0.46). Mean change scores were reliably different between the two groups (t(30)=-2.9, p=0.006).
Relationship between Change Scores for Ethanol Responses and Magazine Entries
Linear regression of change scores for ethanol responding on entries resulted in slopes not significantly different from zero in either group (Figure 3 top left panel: Paired Group: 0.029, P=0.90; Control group: 0.172, P=0.64). Additionally, the slope for the Paired group was within the 95% confidence limits of the slope for the Control group (-0.600 – 0.945).
Relationship between Change Scores for Food Responses and Magazine Entries
Linear regression of change scores for food responding on entries resulted in a slope not significantly different from zero in the Paired group (1.157, p=0.18), but in the control group the slope was greater than zero (3.375, p=0.005). Additionally, the slope of the paired group was not within the 95% confidence interval of the slope for the control group (1.197 – 5.553). However, this positive slope appears to be entirely due to the effect of the one highest and two lowest values (slope without these: -.164, p=0.86).
Tests of whether the ethanol-CS differentially affected change scores for ethanol and food
A repeated measures ANOVA with lever and treatment group as factors results in a significant effect of lever (F(1,30)=5.25, box corrected p=.029), but not of treatment group (F(1,30)=0.02, p=0.89) or of their interaction (F(1,30)=1.37, box correction p=0.25). However, direct comparisons of change scores for ethanol and food in the paired and control groups indicate that responding for ethanol was increased more than responding for food in the paired group (t(15)=2.3, p=0.03), but not in the control group (t(15)=0.8, p=0.42).
Relationship between change scores for ethanol and food
The slope of the regression line between ethanol change score and food change score was significantly less than zero in the paired group (slope= -0.141, p=0.03), but not in the control group (0.040, p=0.58), and the slope of the paired group was outside of the 95% confidence limits of the slope for the control group (-0.111 – 0.192).
Extinction
During extinction, magazine entries declined in the Paired and Control groups.
In the Paired group when the light was lit, the mean number of entries across the three extinction sessions were 59.4, 39.9 & 27.6. Individual values were lower in session 3 than session 1, in 15 of 16 rats in the Paired group. In the Control group, the means were 36.5, 23.7 & 23.9, and individual values were lower in session 3 than session 1, in 13 of 16 rats.
Pavlovian-Instrumental-Transfer after Extinction
Extinction reduced ethanol change scores in the Paired, but not the Control group; and ethanol change scores in the Paired and Control groups were no longer reliably different after extinction. Food change scores were not reliably altered by extinction, and food change scores in the Paired and Control groups were not reliably different. Change scores for magazine entries were reliably reduced by extinction in the Paired, but not the Control group; and change scores for magazine entries were not reliably different between the Paired and Control groups after extinction.
Change Scores for ethanol responses after extinction
Mean change score after extinction was reliably smaller in the Paired group (t(15)=2.6, p=0.02), but unchanged in the Control group (t(15)=0.2, p=0.86).
In the Paired group (Figure 3: right set of filled circles between the top two scatter plots), 8 rats had positive, 2 zero and 6 negative change scores. In the Control group (open circles), 5 had positive, 2 zero and 9 negative change scores. Mean change score for the Paired group was -1.6 (SD: 8.0; median: 0.5; range: -18-11) and -4.2 (SD: 8.5; median: -1; range -29 - 5) for the Control group. These means were not reliably different (t(30)=0.9, p=0.39). Additionally, means were not reliably different from zero in either the Paired (t(15)=0.8, p=0.43), or Control (t(15)=-2.0, p=0.07) groups.
Change Scores for food responses after extinction
Extinction did not reliably alter food responding change scores in either the Paired (t(15)=-1.9, p=0.08) or Control groups (t(15)=-1.1, p=0.31).
In the Paired group (Figure 3: right set of filled circles between the bottom two scatter plots), change scores were negative for 10, zero for 5, and positive for 1 rat. In the Control group (open circles), change scores were negative for 5, zero for 6, and positive for 5 rats. Mean change score for the Paired group was -2.8 (SD: 4.4; median: -1; range: -15-1) and 0.6 (SD: 10.1; median: 0; range -11 - 35) for the Control group. These means were not reliably different (t(30)=1.2, p=0.22). Additionally, the mean for the Control group was not reliably different from zero (t(15)=0.2, p=0.81) and the mean for the Paired group was reliably less than zero (t(15)=2.6, p=0.02).
Change Scores for magazine entries after extinction
Change scores were reliably reduced by extinction in the Paired group (t(15)=2.6, p=0.02), but not in the Control group (t(15)=0.4, p=0.69).
In the paired group (Figure 3: lower set of filled circles below the top left scatter plot), change scores were negative in 4, zero in 2, and positive in 10 rats. In the Control group, change scores were negative in 5, zero in 2, and positive in 9 rats. Mean change score for the Paired group was 4.3 (SD: 10.1; median: 3.5; range: -22 - 19) and 0.9 (SD: 6.2; median: 1; range -9 - 13) for the Control group. These means were not reliably different (t(30)=-1.1, p=0.27). Further, neither mean was reliably different from zero (Paired: t(15)=1.7, p=.11; Control: t(15)=0.6, p=0.55)
Relationship between Change Scores for Ethanol Responses and Magazine Entries
Linear regression of ethanol change scores on change scores for magazine entries after extinction produced slopes that were within the 95% confidence limits of the slopes obtained before extinction.
Slopes obtained following extinction did not differ from zero in either the Paired or Control groups (Paired: 0.259, p=0.22; Control: 0.240, p=0.52), and the slope for the Paired group was within the 95% confidence limits of the slope for the Control group (-.539 -1.019).
Relationship between Change Scores for Food Responses and Magazine Entries after extinction
Linear regression of food change scores on change scores for magazine entries after extinction produce a slope that was within the 95% confidence limits of the slope obtained before extinction in the Paired group, but that was below the 95% confidence limits of the slope obtained before extinction in the Control group.
The slope obtained following extinction did not differ from zero in the Control group (-0.479, p=0.27), but was reliably greater than zero in the Paired group (0.233, p=0.03). However, the slope for the Paired group was within the 95% confidence limits of the slope for the Control group (-1.380 – 0.422). Further, this positive slope appears to depend entirely upon the lowest value (slope without this value: .018, p=0.88).
Relationship between change scores for ethanol and food after extinction
Linear regression of ethanol change scores on food change scores after extinction produce a slope in the Paired group (0.196) that was outside of the 95% confidence limits of the slope for the Paired group before extinction (-0.263 - -0.018). The slope for the Control group after extinction was within the 95% confidence limits of the slope obtained before extinction.
After extinction, slopes were not reliably different from zero in the Paired (0.196, p=0.69) or Control groups (0.059, p=0.80), and the slope of the Paired group was within the 95% confidence limits of the slope for the Control group (-0.422 – 0.539).
Discussion
In Experiment 3, an ethanol-paired CS increased responding that had been reinforced by ethanol, but not responding that had been reinforced by food. This suggests that previous failures to see selectivity with an ethanol-paired CS may have resulted from the particular methods used in those experiments (Glasner et al 2005; Corbit & Janak 2007). One should note, that in one of these previous reports, reinforcer specific effects could be obtained when polycose was used instead of ethanol (Corbit & Janak 2007), suggesting the effects of an ethanol-paired CS may be particularly sensitive to the experimental conditions. Also, supporting this assertion are the results of Experiments 1 and 2. In Experiment 1, an ethanol-paired CS did not increase responding for ethanol, while under similar conditions in Experiment 2, a food-paired CS increased responding for food. The results of Experiment 1 stand in contrast to the results of several previously reported experiments (Glasner et al 2003; Corbit & Janak 2007; Krank 2003; Krank et al 2008; Milton et al 2008) and Experiment 3 of this report showing that an ethanol-paired CS can increase responding for ethanol. Suggesting again that the effects of an ethanol-paired CS may be especially sensitive to the experimental conditions under which these are examined. This may have implications for how the role of Pavlovian learning in addiction should be viewed.
The findings with ethanol in Experiment 3 are consistent with the results of several previous studies (Corbit & Janak 2007; Krank 2003; Krank et al 2008; Milton et al 2012; Glassner et al 2005). This finding extends these previous studies by showing that the ethanol-paired CS increased responding in comparison to the results obtained in a Truly-Random-Control group (see Rescorla 1967). Thus supporting the notion that some effects of a drug paired stimulus may result from associative learning rather than some other process, such as the inhibitory properties of the unpaired stimulus or dishabituation of extinction. Thus, buttressing the idea that associative learning can result in increases in drug seeking.
Unlike two previous studies (Corbit & Janak 2007; Glassner et al 2005), we found that an ethanol-CS could have selective effects, increasing ethanol-responding, but not food-responding. There are two general classes of explanation for these discrepant results: procedural and interpretive. There were many procedural differences between this study and those by Corbit & Janak and by Glassner et al. In the previous studies, rats responded for two solutions, which were delivered to the same magazine, and responding for each solution occurred on different days with the lever for the alternative solution removed. In the present experiment, food and ethanol were available concurrently and the food contingencies were adjusted so that a similar number of food and ethanol deliveries were earned. This combined with the extensive experience of the rats in the present experiment likely resulted in the rats clearly differentiating the response-outcome relationship despite food pellet and dipper deliveries occurring in the same magazine. This may have been less likely in the earlier experiments. Additionally, in these earlier experiments a CS was trained for each outcome. Because the solutions were delivered to the same location, rats need not necessarily have differentiated between the two-programed CS-US relationships. Thus, the generalized PIT observed in these two earlier experiments may be a result of the rats not differentiating between the two-programmed response-outcome relationships or the two-programed CS-US relationships.
Corbit & Janak’s (2007) data provide support both for this interpretation of their results and against such an interpretation. In their Experiment 2, the ethanol-paired stimulus similarly increased both responding for ethanol and responding for sucrose. In contrast, the sucrose-paired stimulus increased responding for sucrose more than it increased responding for ethanol, which was not clearly increased by the sucrose-paired stimulus. Thus, in their Experiment 2, the ethanol-paired stimulus clearly produced non-selective increases in responding while the sucrose-paired stimulus selectively increased responding for sucrose. Corbit & Janak also noted that responding on the sucrose-lever was similarly increased by both paired stimuli, but that responding on the ethanol-lever was increased more by the ethanol-paired stimulus than by the sucrose-paired stimulus. In their Experiment 2, rats responded more for sucrose than for ethanol (though this difference was not statistically reliable; P<0.07); thus, it could be hypothesized that following a CR such as a magazine entry, the most probable behavior would be pressing the sucrose lever. Such a hypothesis would be consistent with the results observed in their Experiment 2. Corbit & Janak conducted a third experiment substituting polycose for ethanol to determine if they could get reinforcer-specific PIT using their procedure. In Corbit & Janak’s Experiment 3, the sucrose-paired stimulus increased both responding for sucrose and responding for polycose, although responding for sucrose was numerically greater than responding for polycose this difference only reached a P-value of 0.29. In contrast, the polycose-paired stimulus increased responding for polycose more than it increased responding for sucrose. Corbit & Janak also note that responding on each lever was differentially affected by the two paired stimuli: Responding on the polycose-lever being increased more by the polycose-paired stimulus; and responding on the sucrose-lever being increased more by the sucrose-paired stimulus. In their Experiment 3, rats responded more for polycose than for sucrose; and the hypothesis put forward earlier to explain the results of their Experiment 2 would seem to some extent also explain the results of their third experiment. In other words, responses often followed magazine entries (which may be elicited by the CS) and thus, magazine entries may set the occasion for responses. The most likely response being the response that had occurred most frequently. One should note that results of our Experiment 3 do not support this hypothesis in this most specific form, in so much as there was no relationship between increases in ethanol-responding and magazine entries following presentation of the ethanol-paired stimulus and more food responses than ethanol responses occurred by the end of training.
Interestingly, decreases in food-responding were associated with increases in ethanol responding and decreases in food-responding explained about 30% of the variance in increases in ethanol-responding following the ethanol-paired CS. This CR, decreased food responding, might set the occasion for ethanol-responding, because when responding is not in extinction, ethanol-responding occurs during pauses in food-responding. While this argument may seem somewhat tautological, it is interesting to note that an important characteristic of what we call craving is the disruption of performance by search-like activities for alcohol or efforts to avoid drinking (Tiffany 1990). To the extent that this performance had been competing with drinking, its disruption may promote alcohol-seeking and drinking (Lamb et al 2016b). So, similarly in Experiment 3, disruption in food-responding by the ethanol-CS may have resulted in an increase in ethanol-responding.
This dependency of increases in ethanol-responding upon the CR elicited by the ethanol-paired CS may explain why increases in ethanol-responding are so dependent upon the experimental conditions that are used. Different experimental conditions likely result in a CS producing different CRs (see Holland 1977 & 1979), which in turn will have different likelihoods of increasing responding for ethanol. An elegant demonstration of this is a study by Krank (2003; see also Krank et al 2008). In Krank (2003), rats were trained to respond for ethanol, then the lever was removed and two stimuli were paired with ethanol delivery. One stimulus was a light located above where the lever had been and the other stimulus was a light located on the other side of the panel. Other than their location the two stimuli were identical as was their pairing with ethanol delivery. When the effect of each paired-stimulus on responding for ethanol was examined, the stimulus near the lever increased responding, while the stimulus away from the lever decreased or did not affect responding. Krank hypothesized that a particular CR elicited by the lights, approach, was responsible for the results he obtained. When the light was located above the lever, approach towards the light increased the probability of a response; but when the light was located away from the lever, approach towards the light reduced the probability of a response. Such a hypothesis provides an alternative way of understanding the role of associative learning in addiction (Krank 2003; Krank et al 2008; Tomie 1995; Lamb et al 2016a; for yet another way see Hogarth et al 2013) to theories that hypothesize motivational effects of drug-paired stimuli.
If the CR elicited by the CS either facilitates or does not facilitate responding, and this is what causes the CS to increase (or not increase) responding, then why was PIT observed in Experiments 2 and 3 or the experiments by other investigators that have shown PIT with ethanol, but not Experiment 1? The differences between Experiment 1 and the previous experiments by others are sufficient to hypothesize that differences in CS duration or modality resulted in the elicitation of different CRs, which in turn resulted in CRs that facilitate responding in these early studies, but not Experiment 1. When Krank found PIT (2003; Krank et al 2008), a 10-sec presentation of a light located above the response lever was used as opposed to the 120-sec light used in Experiment 1. When Corbit & Janak (2007), Milton et al (2012) or Glassner et al (2005) found PIT, a 120-sec tone was used as opposed to the light used in Experiment 1. Both CS modality and duration can determine the form of CR elicited (Holland 1977). Still, in the absence of specifying what the CRs are that produce or prevent PIT, this explanation is not fully satisfying, and future experiments of this issue are needed to address this issue of what are the crucially differing CRs.
However, in comparing the results of Experiment 1 to the results of Experiments 2 & 3, explanations based on differences in CS modality or duration cannot stand, as CS modality and duration were constant across these three experiments (other differences between the current study and past studies, e.g., rat strain or food-restriction, are open to the same counter-argument). The US (ethanol v. food) does differ between Experiments 1 and 2 and the US used will influence the CR elicited by a CS (see Holland 1979). Interestingly all the previous experiments reporting PIT with ethanol either used sweetened ethanol solutions (Krank 2003; Glasner et al 2005), or a sucrose/saccaharin fading procedure to establish responding for ethanol (Krank et al 2008; Corbit & Janak 2007 Experiment 1; Milton et al 2012) or rats responded for both sucrose and ethanol in the experimental context (Corbit & Janak 2007 Experiment 2). Manipulations that may have made ethanol a more food-like US, and promoted CRs more typical of those seen with food. Similarly, in our Experiment 3, having the rats respond for both food and ethanol in the same context may have resulted in the CRs elicited by the ethanol-paired CS being more like the CRs elicited by a food-paired CS. Such a hypothesis requires further experimentation in order to be tested.
An alternative and simpler explanation is that either the results of Experiment 1 or Experiment 3 are unreliable and would fail replication. This seems unlikely to be the case. Expected statistical power for Experiment 1 was reasonable. However, even if it were not, the absence of effect in Experiment 1 is convincing. The mean change score for ethanol responding in the experimental group was 0.3 compared to a mean change score of 2.3 in the control group. Thus, the estimated effect size was in the opposite direction to that predicted. In contrast, the mean change score for ethanol responding in the experimental group for Experiment 3 was 9.3 compared to -3.4 in the control group; and the experimental value was both reliably greater than zero (i.e., more responding occurred during the CS than in the time period preceding it) and the value in the control group. Still, replication, particularly of Experiment 1, would be useful.
We should note that there were procedural differences between Experiment 1 and Experiment 3, but we do not think these would explain the differences in results between the two experiments. Experiment 1 used an RI schedule of ethanol delivery, while Experiment 3 used an FR schedule. This difference is unlikely to explain our results, as interval schedules are thought to more readily promote the development of habitual behavior than ratio schedules; and PIT is more easily demonstrated with habitual behavior than with goal-directed behavior (Wiltgen et al 2012; Holland 2004). However, rats responding under the interval schedule that more readily promotes habitual behavior in Experiment 1 did not show PIT, while the rats responding under the ratio schedule that less readily promotes habitual behavior in Experiment 3 did show PIT. Another procedural difference is that unlike the rats in Experiment 1, the rats in Experiment 3 responded under a concurrent schedule. It would be unexpected that having to allocate responding between two response-outcomes contingencies would facilitate the transition from goal-directed to habitual behavior, and thus explain why PIT was seen in Experiment 3, but not Experiment 1. The more extended training of Experiment 3 might perhaps explain this, though in both Experiment 1 and 3, training on the operant procedures was much longer (65-200 sessions) than in previous experiments with ethanol showing PIT (8-13). However, Holmes et al (2010) hypothesize that when CS-US pairing follows instrumental conditioning (as in our experiments), the amount of PIT declines directly with the amount of instrumental conditioning. Thus, as instrumental training length was longer in Experiment 3 (which showed PIT) than in Experiment 1 (which did not) a difference in duration of instrumental training is unlikely to explain our result. Therefore, the procedural differences, other than food availability, between Experiment 1 and 3 seem unlikely to explain why PIT was seen in Experiment 3, but not Experiment 1.
All in all, the results of these experiments as well as the results of previous experiments reported by others (Corbit & Janak 2007; Krank 2003; Krank et al 2008; Milton et al 2012; Glassner et al 2005) indicate that associative learning can facilitate alcohol-seeking. However, these studies also indicate that facilitation of responding is not a foregone conclusion. Sometimes no facilitation will be seen (Experiment 1) and sometimes an ethanol-paired CS will even suppress ethanol responding (Krank 2003). The effects of an ethanol-paired CS may depend upon the CRs it elicits and the relationship between these CRs and the responses required to obtain ethanol (see Krank 2003; Lamb et al 2016a). The importance of this relationship and how it can be a natural consequence of drinking and drug use in many environments is a key feature of Tomie’s theory on the role of stimuli in addiction (Tomie 1995). Importantly, this relationship between CR elicited by the CS and the effect of the CS on responding for the US is not a unique feature of ethanol-maintained behavior. For instance, Karpicke et al (1977) trained rats to respond for food and then paired lights either near the food lever or away from it with food delivery, and like Krank (2003), found that when the light near the lever was lit, responding was facilitated; but when the light away from the lever was lit, responding was suppressed. Thus, drug-seeking and drug-taking are likely governed by the same basic learning processes governing other behaviors, and understanding how these basic processes sometimes lead to pathologic behavior will help us better understand alcoholism and other addictions.
Table.
| Mean Pre-CS Behavior (SD) | |||||
|---|---|---|---|---|---|
| Pre-Extinction | Post-Extinction | ||||
| Paired | Control | Paired | Control | ||
| Experiment 1 | ethanol responses | 6.4 (3.4) | 5.4 (2.6) | 2.3 (1.4) | 3.3 (1.8) |
| magazine entries | 13.3 (10.1) | 17.4 (10.0) | 7.3 (4.5) | 10.0 (4.8) | |
| Experiment 2 | food responses | 19.0 (10.1) | 20.0 (5.5) | 12.4 (6.2) | 18.6 (10.6) |
| magazine entries | 50.1 (28.3) | 36.6 (10.0) | 23.3 (24.5) | 23.3 (14.0) | |
| Experiment 3 | ethaonl responses | 17.6 (13.0) | 19.9 (18.2) | 7.1 (7.4) | 6.3 (7.7) |
| food responses | 67.6 (46.7) | 57.5 (43.9) | 3.4 (4.6) | 2.9 (5.6) | |
| magazine entries | 29.1 (13.5) | 24.8 (11.6) | 13.6 (8.4) | 9.9 (6.1) | |
all comparisons between Paired and Control within a condition are nonsignificant
In rats responding only for ethanol, an ethanol-paired CS did not increase responding
In rats responding only for food, a food-paired CS increased responding
In rats responding for both, an ethanol-paired CS increased responding for ethanol, but not food
The dependency of CS effects upon experimental context is most consistent with these effects resulting from the elicited CR
Acknowledgments
This work was supported by NIH grant AA12337. CWS was supported by the NIH/NIDA Intramural Research Program. The excellent technical assistance of Jonathan Chemello was instrumental in the accomplishment of this work.
Footnotes
Publisher's Disclaimer: This is a PDF file of an unedited manuscript that has been accepted for publication. As a service to our customers we are providing this early version of the manuscript. The manuscript will undergo copyediting, typesetting, and review of the resulting proof before it is published in its final citable form. Please note that during the production process errors may be discovered which could affect the content, and all legal disclaimers that apply to the journal pertain.
References
- Berridge KC, Robinson TE. Parsing reward. Trends Neurosci. 2003;26(9):507–513. doi: 10.1016/S0166-2236(03)00233-9. [DOI] [PubMed] [Google Scholar]
- Corbit LH, Janak PH. Ethanol-associated cues produce general pavlovian-instrumental transfer. Alcohol Clin Exp Res. 2007;31(5):766–774. doi: 10.1111/j.1530-0277.2007.00359.x. [DOI] [PubMed] [Google Scholar]
- Cunningham CL, Patel P. Rapid induction of Pavlovian approach to an ethanol-paired visual cue in mice. Psychopharm. 2007;192(2):231–241. doi: 10.1007/s00213-007-0704-4. [DOI] [PubMed] [Google Scholar]
- Davis WM, Smith SG. Role of conditioned reinforcers in the initiation, maintenance and extinction of drug-seeking behavior. Pavlovian J Bio Sci. 1976;11(4):222–236. doi: 10.1007/BF03000316. [DOI] [PubMed] [Google Scholar]
- de Wit H, Stewart J. Reinstatement of Cocaine-Reinforced Responding in the Rat. Psychopharm. 1981;75:134–143. doi: 10.1007/BF00432175. [DOI] [PubMed] [Google Scholar]
- Eikelboom R, Stewart J. Conditioning of drug-induced physiological responses. Psychol Rev. 1982;89(5):507–528. [PubMed] [Google Scholar]
- Glasner SV, Overmier JB, Balleine BW. The role of Pavlovian cues in alcohol seeking in dependent and nondependent rats. J Stud Alcohol. 2005;66(1):53–61. doi: 10.15288/jsa.2005.66.53. [DOI] [PubMed] [Google Scholar]
- Hogarth L, Balleine BW, Corbit LH, Killcross S. Associative learning mechanisms underpinning the transition from recreational drug use to addiction. Ann NY Acad Sci. 2013;1282:12–24. doi: 10.1111/j.1749-6632.2012.06768.x. [DOI] [PubMed] [Google Scholar]
- Holland PC. Conditioned Stimulus as a determinant of the form of the Pavlovian Conditioned Response. J Exp Psychol: Animal Behav Proc. 1977;3(1):71–104. doi: 10.1037//0097-7403.3.1.77. [DOI] [PubMed] [Google Scholar]
- Holland PC. The effects of qualitative and quantitative variation in the US on individual components of Pavlovian appetitive behavior in rats. Animal Learn Behav. 1979;7(4):424–432. [Google Scholar]
- Holland PC. Relations between Pavlovian-Instrumental Transfer and reinforce devaluation. J Exp Psychol Animal Behav Proc. 2004;30(2):104–117. doi: 10.1037/0097-7403.30.2.104. [DOI] [PubMed] [Google Scholar]
- Holmes NM, Marchard AR, Coutureau E. Pavlovian to instrumental transfer: a neurobehavioural perspective. Neurosci Biobehav Rev. 2010;34:1277–1295. doi: 10.1016/j.neubiorev.2010.03.007. [DOI] [PubMed] [Google Scholar]
- Koob GF, Stinus L, Le Moal M, Bloom FE. Opponent process theory of motivation: neurobiological evidence from studies of opiate dependence. Neurosci Biobehav Rev. 1989;13(2-3):135–140. doi: 10.1016/s0149-7634(89)80022-3. [DOI] [PubMed] [Google Scholar]
- Krank MD. Pavlovian conditioning with ethanol: sign-tracking (autoshaping), conditioned incentive, and ethanol self-administration. Alcohol Clin Exp Res. 2003;27(10):1592–1598. doi: 10.1097/01.ALC.0000092060.09228.DE. [DOI] [PubMed] [Google Scholar]
- Krank MD, O&Neill S, Squarey K, Jacob J. Goal- and signal-directed incentive: conditioned approach, seeking, and consumption established with unsweetened alcohol in rats. Psychopharm. 2008;196(3):397–405. doi: 10.1007/s00213-007-0971-0. [DOI] [PubMed] [Google Scholar]
- Kruzich PJ, Congleton KM, See RE. Conditioned reinstatement of drug-seeking behavior with a discrete compound stimulus classically conditioned with intravenous cocaine. Behav Neurosci. 2001;115(5):1086–1092. doi: 10.1037//0735-7044.115.5.1086. [DOI] [PubMed] [Google Scholar]
- Lamb RJ, Schindler CW, Pinkston JW. Conditioned Stimuli’s role in relapse: pre-clinical research on Pavlovian-Instrumental-Transfer. Psychopharmacology. 2016a;233:1933–1944. doi: 10.1007/s00213-016-4216-y. [DOI] [PMC free article] [PubMed] [Google Scholar]
- Lamb RJ, Maguire DR, Ginsburg BC, Pinkston JW, France CP. Determinants of choice, and vulnerability and recovery in addiction. Behavioural Processes. 2016b;127:35–43. doi: 10.1016/j.beproc.2016.04.001. [DOI] [PMC free article] [PubMed] [Google Scholar]
- LeBlanc KH, Ostlund SB, Maidment NT. Pavlovian-to-instrumental transfer in cocaine seeking rats. Behav Neurosci. 2012;126(5):681–689. doi: 10.1037/a0029534. [DOI] [PMC free article] [PubMed] [Google Scholar]
- Milton AL, Schramm MJ, Wawrzynski JR, Gore F, Oikonomou-Mpegeti F, Wang NQ, Samuel D, Economidou D, Everitt BJ. Antagonism at NMDA receptors, but not beta-adrenergic receptors, disrupts the reconsolidation of pavlovian conditioned approach and instrumental transfer for ethanol-associated conditioned stimuli. Psychopharm. 2012;219(3):751–761. doi: 10.1007/s00213-011-2399-9. [DOI] [PubMed] [Google Scholar]
- Peters J, de Vries TJ. Pavlovian conditioned approach, extinction, and spontaneous recovery to an audiovisual cue paired with intravenous heroin infusion. Psychopharm. 2014;231:447–453. doi: 10.1007/s00213-013-3258-7. [DOI] [PubMed] [Google Scholar]
- Rescorla RA. Pavlovian conditioning and its proper control procedures. Psychol Rev. 1967;74(1):71–80. doi: 10.1037/h0024109. [DOI] [PubMed] [Google Scholar]
- Robinson TE, Berridge KC. The neural basis of drug craving - an incentive-sensitization theory of addiction. Brain Res Rev. 1993;18(3):247–291. doi: 10.1016/0165-0173(93)90013-p. [DOI] [PubMed] [Google Scholar]
- Shahan TA. The observing-response procedure: A novel method to study drug-associated conditioned reinforcement. Exp Clin Psychopharm. 2002;10(1):3–9. doi: 10.1037//1064-1297.10.1.3. [DOI] [PubMed] [Google Scholar]
- Srey CS, Maddux J-MH, Chaudhri N. The attribution of incentive salience to Pavlovian alcohol cues: a shift from goal-tracking to sign-tracking. Frontiers in Behavioral Neurosciene. 2015;9:54. doi: 10.3389/fnbeh.2015.00054. [DOI] [PMC free article] [PubMed] [Google Scholar]
- Stewart J, de Wit H, Eikelboom R. Role of unconditioned and conditioned drug effects in the self-administration of opiates and stimulants. Psychol Rev. 1984;91(2):251–268. [PubMed] [Google Scholar]
- Tiffany ST. A cognitive model of drug urges and drug-use behavior: role of automatic and nonautomatic processes. Psychol Rev. 1990;97(2):147–168. doi: 10.1037/0033-295x.97.2.147. [DOI] [PubMed] [Google Scholar]
- Tomie A. CAM - An animal learning model of excessive and compulsive implement-assisted drug-taking in humans. Clin Psychol Rev. 1995;15(3):145–167. [Google Scholar]
- Uslaner JM, Acerbo MJ, Jones SA, Robinson TE. The attribution of incentive salience to a stimulus that signals an intravenous injection of cocaine. Behav Brain Res. 2006;169:320–324. doi: 10.1016/j.bbr.2006.02.001. [DOI] [PubMed] [Google Scholar]
- Wiltgen BJ, Sinclair C, Lane C, Barrows F, Molina M, Chabanon-Hicks C. The effect of ratio and interval training on Pavlovian-Instrumental Transfer in mice. PLoS One. 2012;7(10):e48227. doi: 10.1371/journal.pone.0048227. [DOI] [PMC free article] [PubMed] [Google Scholar]
- Woods JH, Winger GD. Observing responses maintained by stimuli associated with cocaine or remifentanil reinforcement in rhesus monkeys. Psychopharm. 2002;163(3-4):345–351. doi: 10.1007/s00213-002-1201-4. [DOI] [PubMed] [Google Scholar]