

Summary
Light inducible protein-protein interactions have been used to manipulate protein localization and function in the cell with utmost spatial and temporal precision. In this technical report, we use a recently developed optogenetic approach to manipulate protein localization in the developing sea urchin embryo. A photosensitive LOV domain from Avena sativa phototropin1 cages a small peptide that binds the engineered PDZ domain (ePDZ) upon blue light irradiation. Using this system, mCherry tagged proteins fused with the LOV domain were recruited to ectopic sub-cellular regions such as the membrane, microtubules, or actin by GFP tagged proteins fused with the ePDZ domain upon blue light irradiation within 1~3 minutes in the sea urchin embryo. The efficiency and speed of recruitment of each protein to its respective subcellular region appeared to be dependent on the power and duration of laser irradiation, as well as the respective level of affinity to the tagged location. Controlled laser irradiation allowed partial recruitment of the spindle to the membrane, and resulted in cell blebbing. Vasa, a cell cycle and germline factor that localizes on the spindle and enriches in the micromeres at 8–16 cell stage was recruited to ectopic sites, preventing normal enrichment. Continuous blue light activation with a regular blue aquarium light over two days of culture successfully induced LOV-ePDZ binding in the developing embryos, resulting in continued ectopic recruitment of Vasa and failure in gastrulation at Day 2. Although some cytotoxicity was observed with prolonged blue light irradiation, this optogenetic system provides a promising approach to test the sub-cellular activities of developmental factors, as well as to alter protein localization and development during embryogenesis.
Keywords: Optogenetics, Live imaging, Embryo, Sea urchin
Introduction
Embryonic cells display dynamic protein expression and localization in each blastomere, contributing to differential cell fate determination in the embryo during development. In the sea urchin embryo, cell division occurs every 30~40-minutes (i.e. 20 minutes of M-phase and 20 minutes of S-phase and no G-phase). Several proteins exhibit differential expression and/or localization in each blastomere. Traditionally, a general gene knockdown or overexpression has been used to identify the functional contributions of specific proteins during embryogenesis, but a method to examine protein activity at the sub-cellular level with a temporal control during embryonic development has yet to be developed. However, recently pioneered optogenetic techniques that manipulate protein localization and activity with temporal and spatial precision provide a novel approach to address these questions (see comprehensive reviews, Pathak et al., 2013; Tischer and Weiner, 2014; Zhang and Cui, 2015).
In this technical report, we utilize engineered photoreceptors that undergo conformational change and induce the heterodimerization of proteins upon specific light irradiation. The photosensitive LOVpep (LOV) domain from Avena sativa phototropin1 undergoes conformational change and binds reversibly to the engineered PDZb1 (ePDZ) domain upon blue light irradiation (Fig.1A; Kennedy et al., 2010; Strickland et al., 2012; van Bergeijk et al, 2015). DNA fragments encoding LOV and ePDZ domains are relatively small in size (~500bp), and can be easily fused to any gene of interest.
Fig. 1. GFP-ePDZ or mCherry-LOV was recruited to the plasma membrane upon blue light irradiation.

A A schematic diagram of experimental procedure. Membrane-mCherry-LOV (or membrane-mCherry for control) mRNA was co-injected with GFP-ePDZ mRNA into fertilized sea urchin embryos. Embryos were located on a slide 4–5 hpf after injection, then irradiated with blue laser (488nm) to induce binding of LOV to the ePDZ domain, followed by time-lapse imaging record protein dynamics. A’ A schematic depicting Membrane-mCherry-LOV and GFP-ePDZ interaction. In the absence of blue light (left panel), the LOV binding domain (orange subunit attached to LOV) remains caged and GFP-ePDZ stays in the cytoplasm. Upon blue light activation (right panel), LOV releases the binding domain, which binds to ePDZ, recruiting GFP towards the membrane. A” A timeline of imaging set-up. Embryos were irradiated with 6% blue light with 2 iterations, then with 1.5% blue light every 15 seconds thereafter. Images and mean fluorescence readings were obtained every 6 seconds on the microscope. B-C Still images from the Membrane-mCherry-LOV x GFP-ePDZ, or Membrane-mCherry x GFP-ePDZ (control) time-lapse movie (M1 and M2 respectively). A time-series of the white dotted squared region is shown on the right. Respective times are indicated on top right corner of each still image. Blue circles (El and Cl) indicate detection ROI where GFP intensity quantification was obtained. E1 and C1 correspond to values E1 and C1 in graph 1D. (B) cytoplasmic GFP signal was recruited to the membrane. (C) No GFP recruitment to the membrane was observed in the control embryo. D Mean GFP fluorescence intensity over time for selected ROIs in B and C (blue circles), as well as two other experimental and control embryos, n=3 each. Experimental embryos (E1–E3) showed an increase in GFP intensity at the membrane over time. No change in GFP intensity was observed at the membrane as expected for control embryos (C1–C3). E A schematic depicting mCherry-LOV binding to GFP-ePDZ-CAAX. No recruitment of mCherry-LOV to the membrane under no blue light (left panel). Blue light irradiation induces LOV-ePDZ binding, recruiting mCherry to the membrane (right panel). F-G Still images from the mCherry-LOV x GFP-ePDZ-CAAX, or mCherry x GFP-ePDZ-CAAX (control) time-lapse movies (M3 and M4 respectively). A time-series of the white dotted squared region is shown on the right. Respective times are indicated on top right corner of each still image. Blue circles (E1 and C1) indicate detection ROIs where mCherry intensity was quantified over time. Labels E1 and C1 correspond to values E1 and C1 in graph 1H. (F) mCherry signal gradually increased on the membrane over time in the experimental embryo. (G) No mCherry recruitment to the membrane was observed in the control embryo. H Mean mCherry fluorescence intensity over time for selected ROIs in F and G (blue circles), as well as two other experimental and control embryos, n=3 each. Mean mCherry fluorescence increased over time for experimental embryos (E1–E3), while staying unchanged for control embryos (C1–C3). I Mean mCherry fluorescence over time for two experimental embryos imaged for one continuous hour. Trend shows that mCherry intensity at the membrane continuously increased over the recording. To construct graphs in D, Η, I, average values of three time points around every 1 minute from three different embryos for both experimental (E1–3) and control (C1–3) were calculated. Fluorescent intensity was normalized by dividing initial intensity by subsequent readings thereafter. J Mean mCherry fluorescence over time for mCherry-LOV, GFP-ePDZ-CAAX embryos irradiated with three different laser conditions every 15 seconds (1%, 3% or 6%) throughout recording. Two ROIs were analyzed per embryo, and two embryos per laser group were imaged. Level and efficiency of mCherry recruitment to the membrane increased as laser powers are increased. Average values from four different ROIs was calculated at every 30 seconds for each laser group. Error bars represent mean ± s.d.
Other photoactivated proteins such as phytochromes perform similar molecule-binding activities as LOV-ePDZ. Phytochrome binding is induced by red light and released by far-red light, which has the potential to incur less phototoxicity than blue light, and sustain further protein binding. This phytochrome-mediated system has recently been proven to function in the vertebrate embryo (Buckley et al., 2016). However, it requires an external chromophore, phycocyanobilin (PCB), whereas the LOV-ePDZ system uses a ubiquitously occurring flavin as a chromophore, requiring no additional cofactors.
These features of the LOV-ePDZ system greatly reduce experimental complexity, which is especially important for experimental models that require mRNA microinjections. For this reason, we decided to pursue the LOV-ePDZ system in this study. After confirming the initial feasibility of LOV-ePDZ binding, we further demonstrated the versatility of this optogenetic system by fusing ePDZ to specific protein-binding domains such as CAAX, EMTB and Lifeact, and recruiting LOV-tagged mCherry to these constructs via light activation. Lastly, we specifically disturbed localization of the Vasa protein, a cell cycle and germline factor (Voronina et al., 2008; Yajima and Wessel, 2011). Vasa localizes on the spindle during early embryogenesis, and becomes restricted to the micromeres at the 8–16 cell stage through asymmetric cell division. Optogenetic manipulation of this protein under a confocal laser microscope led to the development of Vasa-depleted micromeres in the embryo. Importantly, prolonged recruitment of Vasa to ectopic sites during embryogenesis induced ectopic Vasa localization and prevented gastrulation in embryos, suggesting that this technology could be used to alter development in the embryo. This light induced approach can provide a powerful tool in controlling protein activities with spatio-temporal precision, and may be used in the near future to test the sub-cellular function of a protein or to alter cellular and developmental activities in the embryo.
Materials and Methods
Embryo culture
Strongylocentrotus purpuratus were obtained from Pat Leahy, Kerchoff Marine Laboratories, California Institute of Technology or from Josh Ross, South Coast Bio-Marine LLC. Long Beach, California, USA. Eggs and sperm were collected from healthy adult sea urchins through injections of 0.5M KCL to induce muscle spasms. Sea urchin eggs were prepared for fertilization and injection by de-jellying with an incubation of pH4 seawater (SW) for 10 minutes, followed by several neutralized SW washes. Eggs were fertilized in 1mM 3-aminotriazol (Sigma, St. Louis, MO, USA) to prevent the cross-linking of fertilization envelopes. Fertilized eggs were cultured in SW at 16°C in petri dishes until desired developmental stages.
Generation of plasmid constructs
All constructs were prepared in the pSP64 or pCS2 vector which were optimized for in vitro transcription. Primers and templates used in this study along with other cloning details are summarized in Table S1. All subcloning reactions were designed to be in frame with each gene of interest, and were conducted by the In-Fusion HD Cloning kit (Clonetech) protocol. To construct pSP64-GFP, the GFP open reading frame (ORF) was amplified via PCR from pSP64-Vasa-GFP (Yajima and Wessel, 2011) and inserted at the Apa1 site of the vector. pCS2–2x mCherry-EMTB (# 26742) and pCS2-membrane-mCherry (#53750) were obtained from Addgene. pSP64-Vasa-mCherry was constructed by replacing the GFP sequence of pSP64-Vasa-GFP at the Spe1 site. The mCherry ORF was then amplified by PCR, and fused in frame to the Vasa C-terminus. To construct pSP64-mCherry-LOV, the Vasa ORF was excised from pSP64-Vasa-mCherry-LOV via ApaI digestion. The remaining pSP64-mCherry-LOV vector was self-ligated by T4 ligase (Promega). pSP64-mCherry was constructed by removing the LOV domain at Not1 sites from pSP64-mCherry-LOV, and then self-ligating the resultant vector. To create the following LOV and ePDZ-tagged constructs, each domain was PCR amplified as summarized in Table S1, and inserted into the C-terminus of each gene of interest listed: pSP64-Vasa-mCherry-LOV, pCS2–2xmCherry-EMTB-LOV, and pSP64-GFP-ePDZ. To construct pSP64-Lifeact-GFP-ePDZ, a DNA fragment of Lifeact was inserted at the BglII and ApaI sites of pSP64-GFP-ePDZ, respectively.
mRNA preparation and microinjection
Each construct was linearized overnight with the appropriate restriction enzyme as shown in Table S1. Linearized constructs were then subject to in vitro transcription using the mMESSAGE mMACHINE® SP6 Transcription Kit (Thermo Fisher; catalog #AM1340), which involved a 4-hour incubation at 37°C, followed by a DNaseI treatment and LiC1 precipitation overnight at −20°C. The injection solution was prepared for a final concentration of 1500 ng/μl for Vasa-fusion constructs and of 750~1000 ng/μl for other constructs. Vasa morpholino anti-sense oligo (Yajima and Wessel, 2011) was injected with a final concentration of 0.2 mM. Embryos were injected with 6~10 pL of injection mixture and cultured up to 4–5 hours post fertilization (hpf) or for 2 days at 16°C.
Embryo preparation and blue light activation by confocal microscopy and data analysis
Embryos for confocal microscopy were cultured in the dark until the 8–16 cell stage (4 hpf) then mounted on a glass slide with double-sided tape, which prevented embryos from being flattened while immobilizing them during the experiment (Fig. 1A). Live confocal imaging was primarily conducted with the Zeiss 800 confocal laser microscope as it was equipped with a sequence manager - a software application that allows control of repetitive light activation and bleaching, followed by imaging. To demonstrate the versatility of this optogenetic system, we repeated some of the experiments originally performed on the Zeiss 800 on another confocal microscope, the Olympus FV3000. Because we obtained similar results for both microscopes, results obtained on the Zeiss 800 microscope were primarily used for the analyses in this report unless individually stated.
The definitions of general terms used for each microscope setting are as follows: ROI, Region of Interest. A specific region to be irradiated for laser activation (activation ROI) or to be measured for quantitative analysis (detection ROI); Iterations, Immediate repeat(s), usually within 1 second of laser irradiation against the ROI(s) within a single cycle of laser scanning; Scan speed, slower scan speeds that lead to brighter images and to more laser irradiation against the scanned area through a single cycle of scanning; Intervals, a specific duration (seconds or minutes) between each cycle of laser scanning. Other specific laser and image settings are documented in the results and discussion section. Sub-cellular laser irradiation was conducted with the timed bleaching option offered on the Zen Blue imaging software. Quantitative analysis was performed using “the relative ROI intensity” application of the Zeiss Zen software installed on the microscope, which automatically measures the signal intensity of each ROI at each time point of imaging, or with Image J for manual intensity quantification at the occasion when the cells were significantly moved during recording. Time-lapse movies were constructed by importing the image sequences to Image J.
Embryo preparation and blue light activation under aquarium tank light in the incubator
Two types of blue aquarium lights were used for prolonged light activation in this report. One is a “weak” blue light (3W; LED Aquarium Light, Tank Light Submersible Crystal Glass Lights, Mingdak, USA) and the other a “strong” blue light (12W; Blue LED PAR38 Grow Light for Aquarium and Plant Growth, ABI, USA). Embryos were cultured either under weak blue light throughout development, or pulsed with strong blue light for 3 hours per day in addition to overnight weak blue light irradiation. To ensure efficient exposure to irradiation, the lids of culture dishes were removed during the incubation (see Fig. S1 for setting). Weak blue light irradiation was sufficient to induce protein recruitment to ectopic sub-cellular regions in the cell, although insufficient to induce changes in cell division or development. Accordingly, the stronger blue light was utilized to induce stronger activation. However, its use was limited to 3 hours as overnight irradiation under strong blue light produced a significant amount of heat, evaporated water in the culture dish, and caused cytotoxicity. Wide-field fluorescent images were taken by Zeiss Axioplan E637 or by Vert A1 Zeiss. Image analysis was performed in Image J.
Results and Discussion
LOV-ePDZ binding was induced upon blue light irradiation.
To first test if LOV-ePDZ heterodimerization occurs upon blue light irradiation, embryos were co-injected with membrane-mCherry-LOV (red) and GFP-ePDZ (green) mRNA, and visualized at 4~5 hours post fertilization (hpf) with green light to first visualize protein expression, but not activate protein binding (Fig.1A, A’). A single cycle of activation with 2 iterations (less than a second per iteration) at a power of 6% was used, followed by timed activations at a power of 1.5% every 15 seconds with images obtained every 6 seconds (Fig. 1A”). GFP-ePDZ, which is localized in the cytoplasm at the inactivated state was recruited to the plasma membrane specifically within 1 minute of 488nm blue light activation (Fig. 1B; Movie S1). Control embryos injected with membrane-mCherry without the LOV domain did not recruit GFP-ePDZ to the membrane domain (Fig. 1C; Movie S2). Through quantifying mean fluorescence intensity over time in the movies, embryos injected with membrane-mCherry-LOV showed increased GFP signal over time in the detection ROI (Region of Interest) in the membrane, whereas control membrane-mCherry embryos lacking the LOV domain displayed an unchanged mean GFP intensity, even in the presence of blue light (Fig. 1D). This result demonstrated the initial technical feasibility of this experiment.
It has been reported that this LOV-ePDZ heterodimerization is reversible (Strickland et al., 2012). To maintain the binding, the embryo must be irradiated with blue light during the entire duration of microscopy. Thus, we tested if low laser powers can still induce heterodimerization while avoiding bleaching or cytotoxicity for prolonged periods of blue light irradiation. mCherry-LOV was co-injected with GFP-ePDZ-CAAX, which tethered GFP to the plasma membrane by the CAAX domain (Fig. 1E). A pulse of blue laser was applied at a strength of 3% for the first irradiation with 2 iterations, and then 1.5% for every 15 seconds for the total 60 minutes to maintain binding of LOV-ePDZ (Fig. 1E’). This setting slowed initial recruitment of mCherry to the membrane, while still successfully maintaining the induced protein-protein binding of mCherry-LOV and GFP-ePDZ-CAAX during the entirety of the recording (Fig. 1F; Movie S3). Control embryos injected without the LOV domain showed no recruitment to the membrane (Fig. 1G; Movie S4). When quantified, experimental embryos showed increased mCherry intensity at the membrane, while control embryos did not (Fig. 1H). With lower laser powers, we did not observe any notable bleaching or cytotoxicity during one-hour-long activation while still maintaining mCherry recruitment at the membrane (Fig. 1I). These results suggest that this system does not to require excessive laser power to activate protein-protein binding. With this sensitivity, one can activate and maintain protein-protein binding with minimal laser power, allowing temporal control. We also noticed some mCherry signal enrichment in the nucleus even before activation, for which we were unable to identify the cause. This appears to occur independent of the type of mRNA/Protein and can occur even with an injection dye in this embryo, and thus is likely irrelevant to light activation. To test the power and duration-dependent manner of this optogenetic toolkit, we also tested recruitment efficiency of mCherry-LOV to GFP-ePDZ-CAAX under three different laser conditions: a pulse of laser activation every 15 seconds at 1%, 3% or 6% power, respectively (Fig. 1J). We found that mCherry recruitment to the membrane was power dependent, and that higher laser powers caused stronger recruitment within 3 minutes of activation. This result suggests that laser power may be optimized accordingly depending on the desired level and speed of recruitment.
LOV-ePDZ binding induced tripolar spindle formation and disturbed cell division plane upon blue light irradiation.
Using this LOV-ePDZ system, Lifeact-GFP-ePDZ and 2x-mCherry-EMTB-LOV mRNAs that bind to actin and microtubules respectively were co-introduced into fertilized eggs with the aim to induce asymmetric cell division (Fig. 2A; Riedl et al., 2008; von Dassow 2009). A specific ROI on the membrane enriched with GFP signal was irradiated with a blue laser. Because both constructs possess a strong affinity for each sub-cellular region, low laser powers had little effect on inducing recruitment. Therefore, higher laser powers of 6% were used for the first irradiation with 2 iterations, followed by 1.5% power laser for every 15 seconds for the rest of time-lapse in this experiment (Fig. 2A’). As a result, mCherry signal was recruited to the membrane where Lifeact-GFP-ePDZ was located (Fig. 2B, B’; Movie S5). A shift in the cell division plane was induced with laser irradiation by recruiting a small portion of the cytoplasm to the activation ROI, but it only resulted in cell blebbing and not complete cytokinesis (Fig. 2C; Movie S6; n=4). These events were not seen in the control ROI (non-irradiated ROI in the experimental embryo; Fig. 2C’), or in the control embryo injected with constructs without the LOV domain that were imaged under the same condition (Fig. 2D, D’). These results suggest that other proteins may be necessary to recruit the entire mitotic apparatus to the activation ROI. Another possibility is that embryonic cells may possess significant resistance to abnormal cytokinesis as they appear to immediately re-adjust the position of the spindle, even when temporarily recruited to the ectopic direction (Fig. 2C).
Fig. 2. A sub-portion of the microtubules was recruited to the ectopic place, disturbing a normal division plane or inducing tri-polar spindle.
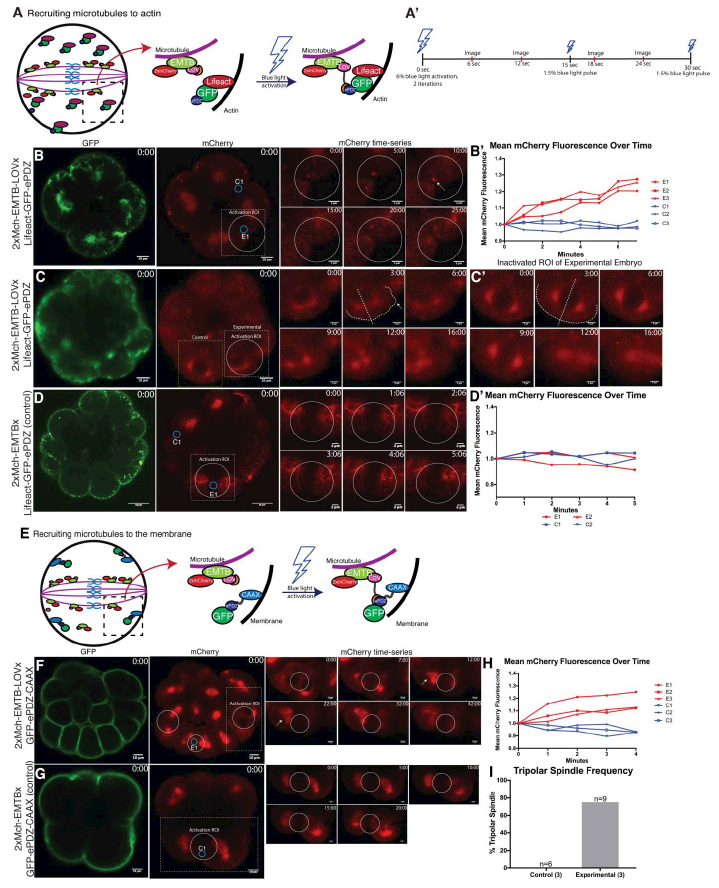
A A schematic diagram of 2x-mCherry-EMTB-LOV and Lifeact-GFP-ePDZ binding upon blue laser irradiation. Without blue light, EMTB remains bound to microtubules (left panel). Upon blue light irradiation, EMTB-bound microtubules are recruited to Lifeact that is bound to F-actin (right panel). A’ A timeline of imaging set-up. Embryos were irradiated with 6% blue light with 2 iterations, then with 1.5% blue light every 15 seconds thereafter. Images and mean fluorescence readings were obtained every 6 seconds on the microscope. B-D Still images from the 2x-mCherry-EMTB-LOV x Lifeact-GFP-ePDZ or 2x-mCherry-EMTB x Lifeact-GFP-ePDZ (control) time-lapse movies (M5 and M6, respectively). Time-series of white dotted squared region is shown on the right. White circle indicates area of embryo where blue light was specifically irradiated (experimental activation ROI), while smaller blue circles (E1 and C1) indicate the detection ROIs where mCherry intensity was quantified over time. Labels E1 and C1 correspond to values E1 and C in the graph B’ (B) 2x-mCherry-EMTB signal was recruited towards actin in the experimental detection ROI (white arrow). (B’) mCherry fluorescence intensity of experimental and control detection ROI’s (E1–3 and C1–3). Two other experimental embryos were used to obtain experimental and control ROIs over time, n=3 each. mCherry intensity increased over time in the experimental detection ROIs, whereas control detection ROI’s showed little change in mean intensity throughout recording. (C, C’) Still images from the 2x-mCherry-EMTB-LOV x Lifeact-GFP-ePDZ movie (M6). Partial recruitment of microtubules was induced upon light irradiation, inducing an extended cytoplasm in the right plane (arrow) in the experimental ROI (C), whereas the mid-plane of the control ROI in the experimental embryo remained centered (C’). Dotted white line in the time-series indicates the outline of each cell as well as mid-plane from each spindle pole. D Still images of the control embryo. Labels C1 and E1 correspond to values C1 and E1 in graph D’. mCherry expression remained consistent throughout recording, and no recruitment was observed both in experimental (E1–E2) and control (C1–2) ROIs. D’ mCherry fluorescence intensity over time for experimental and control ROI for 2x-mCherry-EMTB and Lifeact-GFP-ePDZ control embryos, n=3. This part of the experiments was performed on Olympus FV3000 confocal laser scanning microscope. E A schematic diagram of 2x-mCherry-EMTB-LOV and GFP-ePDZ-CAAX binding. Upon blue light irradiation, EMTB bound to microtubules is recruited to the membrane. F-G Still images from the 2x-mCherry-EMTB-LOV x GFP-ePDZ-CAAX or 2x-mCherry-EMTB x GFP-ePDZ-CAAX (control) time-lapse movies (M7 and M8, respectively). Time-series of the white dotted squared region is shown on the right. White circles indicate the areas where blue light was irradiated (experimental activation ROIs), while small blue circles (E1 and C1) indicate detection ROIs where mCherry intensity was quantified. Labels E1 and C1 corresponds to values E1 and C1 of graph H. (F) mCherry signal was recruited to the membrane in the experimental embryo. White arrow indicates formation of a tri-polar spindle. (G) No mCherry recruitment to the membrane was observed in the control embryo throughout recording. H mCherry fluorescence on the membrane within each detection ROI (blue circles in B and C) was quantified over time. Two more embryos from both experimental and control conditions were also quantified, n=3 each. mCherry fluorescence increased over time for experimental embryos (E1–3), while staying unchanged for control embryos (C1–3). I Frequency of tri-polar spindle formation in experimental and control embryos, n=3 each. A total number of detection ROIs (cells) examined is noted on the top of each column. Control embryos formed no tri-polar spindles compared to experimental embryos under this condition. To construct graphs in B’, D” and H, average values of three time points around every 1minute from three different embryos for both experimental (E1–3) and control (Cl-3) were calculated. Fluorescent intensity was then normalized by dividing initial intensity by subsequent readings thereafter.
Next, we co-injected the 2x-mCherry-EMTB-LOV and GFP-ePDZ-CAAX mRNAs, both of which also possess a strong affinity for the microtubules and membrane, respectively. We induced protein-protein binding at a specific region of the membrane to test whether microtubules can be recruited to the membrane during M-phase using the same laser condition as the experiments above in Fig. 2A-D (Fig. 2E). We observed the recruitment of a sub-population of microtubules to the membrane, which induced the formation of tri-polar spindles (Fig. 2F; Movie S7; n=9), whereas no tri-polar spindles were formed in the control embryo (Fig. 2G and I; Movie S8; n=6). When mCherry recruitment to the membrane was quantified, experimental embryos showed an increase of fluorescent intensity, whereas control embryos did not (Fig. 2H). The resulting cells, however, appeared abnormal and degraded rapidly. While we were able to induce a tri-polar spindle phenotype, we were unable to completely alter spindle orientation or induce healthy asymmetric cell division. These results suggest that proteins that do not just bind to microtubules but also control the orientation and/or position of the spindle may need to be used and optogenetically recruited to induce stable asymmetric cell division. Since manipulating spindle dynamics and/or cytokinesis can induce a change in cell fates and development of the embryo, it is important to improve this technique in the future.
Vasa, a germ line marker, was recruited to ectopic regions during embryonic development.
This optogenetic system has the potential to control the localization of cell regulators or fate determinants in a specific lineage, and directly test how sub-cellular functions of each molecule contribute to differential cell fate specification and/or cellular activity during embryogenesis. Vasa was used to test this function. Vasa is an RNA-helicase known as a germline factor in various organisms (Lasko and Ashuburer, 1988; Hay et al., 1988; Lasko, 2013), as well as a cell cycle factor in the sea urchin embryo (Voronina et al., 2008; Yajima and Wessel, 2011 & 2015). This protein was selected as it exhibits dynamic localization on the spindle of every blastomere, while also becoming asymmetrically enriched in the micromeres during the 8–16 cell stage (Fig. 3A). In many organisms, Vasa serves as a marker rather than an absolute determinant for germline formation. Thus, it is unlikely that ectopic localization of Vasa will induce an extra germline at ectopic places in the embryo. However, manipulating its localization during embryogenesis may compromise its activities in cell cycle regulation, and disrupt the maintenance of the germline later in development. With this hypothesis, we aimed to disturb Vasa’s localization on the spindle and its enrichment in the micromeres by recruiting Vasa to ectopic regions such as actin or the membrane.
Fig. 3. Light-induced approach caused loss of Vasa enrichment in micromeres.

A A schematic diagram of Vasa-mCherry-LOV and Lifeact-GFP-ePDZ binding. Vasa protein (red) is localized equally on the spindle of every blastomere until 8-cell stage, and then becomes enriched towards the sub-cellular region of the future micromeres. Through LOV-ePDZ binding, Vasa protein is recruited to actin, disturbing Vasa enrichment on the spindle and/or in the micromeres at the 16-cell stage. A’ A timeline of imaging set-up. Embryos were irradiated with 10% blue light with 2 iterations, then with 1.5% blue light every 15 seconds thereafter. Images and fluorescence mean readings were obtained every 6 seconds. B-C Still images from the Vasa-mCherry-LOV x Lifeact-GFP-ePDZ or Vasa-mCherry x Lifeact-GFP-ePDZ (control) time-lapse movies (M9 and M10 respectively). Time-series of the white dotted squared region is shown on the right. The dotted square indicates the presumptive area where micromeres are formed. (B) mCherry signal enriched in the presumptive micromeres was reduced, and the signal was distributed equally in macromeres and micromeres at 16-cell stage in the experimental embryo. Micromeres and macromeres (Ma and Mi, respectively) are indicated by dotted circles. (C) mCherry remained enriched in the micromeres throughout recording in the control embryo. Dotted circle indicates the formed micromere at 16-cell stage. D Ratio of mean Vasa signal intensity between micromeres and macromeres in both control and experimental groups, n=3 each. The average Vasa signal intensity of the macromeres and micromeres were calculated with Image J. Error bars represent mean ± s.d. E A Schematic diagram of Vasa-mCherry-LOV and GFP-ePDZ-CAAX binding. Blue light irradiation recruits Vasa to the membrane, disturbing Vasa enrichment in the micromeres. F-G Still images from the Vasa-mCherry-LOV x GFP-ePDZ-CAAX or Vasa-mCherry x GFP-ePDZ-CAAX (control) time-lapse movies (M11 and M12 respectively). Time-series of the white dotted squared region is shown on the right. (F) mCherry signal was reduced from the perinuclear/spindle region and diffused throughout the embryo in the experimental embryo. (G) mCherry signal was consistently enriched on the spindle or at the perinuclear region throughout recording in the control embryo. H Mean Vasa signal intensity ratios on the mitotic apparatus and the whole cell for both control and experimental embryos. The mitotic apparatus and whole-cell areas used to obtain intensity readings on ImageJ are indicated in F and G. Embryos quantified were in M-phase. I Ratio of Vasa intensity on the spindle versus the membrane. The spindle and membrane areas used to obtain intensity readings on ImageJare indicated in F and G (top right panels). (H and I) Average values from 3 detection ROIs per embryo were obtained for each group. Two additional embryos per group were analyzed and averaged for the final values, n=3 each. Error bars represent mean ± s.d.
To recruit Vasa to actin, Vasa-mCherry-LOV was co-injected with Lifeact-GFP-ePDZ (Fig. 3A). Due to the fact that the 8–16 cell division stage occurs in a short time frame of approximately 10 minutes, laser powers were increased to 10% for the first irradiation with 2 iterations, followed by 1.5% every 15 seconds onto the entire embryo to ensure immediate induction (Fig. 3A’). With this condition, Vasa-mCherry-LOV was immediately disturbed in approximately 10 seconds, resulting in reduced enrichment of Vasa in the micromeres (Fig. 3B; Movie S9). Control embryos injected with Vasa-mCherry without the LOV domain showed no recruitment of Vasa during the recording, and Vasa remained enriched in the micromeres without disturbance (Fig. 3C: Movie S10). These results suggest that this approach may be useful in the future to test the subcellular function of each molecule at a specific time and area of development.
We also recruited Vasa-mCherry-LOV to the membrane using GFP-ePDZ-CAAX (Fig. 3E). Experimental embryos showed compromised Vasa localization on the mitotic spindle compared to control embryos (Fig. 3F-G). When quantified, experimental embryos exhibited less Vasa localization on the spindle during M-phase (Fig. 3H) and increased Vasa signal recruitment to the membrane compared to controls (Fig. 3I). However, the level of recruitment was less consistent among the treated embryos compared to Lifeact-GFP-ePDZ (Fig. 3F-H; Movie S11, 12). This implies that the physical distance between two molecules or the affinity of each molecule to each sub-cellular region may greatly affect recruitment efficiency.
Optogenetic induction in the conventional incubator- testing survivability and altering embryonic development.
Developmental events are controlled through multiple rounds of cell divisions and differentiation that take place over the course of multiple days. While confocal microscopy enables finely controlled laser irradiation for short periods of time, long and continuous use is both technically and financially unfeasible. Therefore, we explored an alternative approach by utilizing commercially available blue aquarium lights. Two types of blue lights were used - one that irradiates “weak” (3W) blue light, and the other “strong” (12W) blue light (Fig. S1). To test the experimental setup, we injected the membrane-mCherry-LOV and GFP-ePDZ or membrane-mCherry and GFP-ePDZ mRNAs (control) and cultured them under weak blue light for two days (Fig. 4A). To test the toxicity of the weak blue light on embryo development, we also included two uninjected embryo groups: one group was cultured under weak blue light (Uninjected blue), while the other was in a regular incubator without blue light (Uninjected no blue). GFP-ePDZ was successfully recruited to the membrane at the blastula stage for experimental embryos, while no recruitment was seen in control embryos (Fig. 4B, arrowheads). Survivability of experimental and control embryos was relatively consistent, standing at approximately at 30–40% for both groups, while consistently lower than the uninjected groups that were approximately 60–80% by Day 2 (Fig. 4B’). These results suggest that this weak blue light condition successfully induced protein recruitment, but also caused some cytotoxicity in the injected embryos. Although fluorescent proteins such as GFP were used to identify levels of protein recruitment, they have been reported to result in some degree of cytotoxicity (Ansari et al., 2016). In the future, use of non-fluorescent constructs for prolonged light treatment and culture may improve survivability.
Fig. 4. A blue aquarium light induces protein recruitment in developing embryos.

A A timeline of experimental set-up. Embryos were developed in dark until 2-cell stage (approximately, 2 hpf), then incubated under weak blue light until gastrula stage (Day 2). B, B’ Embryos injected with membrane-mCherry-LOV x GFP-ePDZ or membrane-mCherry x GFP-ePDZ (control). Embryos were imaged at blastula (Day 1) and gastrula (Day 2) stages. The experimental embryo showed recruitment of GFP to the membrane (arrowheads), whereas no recruitment was observed in control embryos. Dotted square regions are magnified on right. (B’) Survivability of each embryo group was analyzed over two days. Total number of embryos observed is indicated in parenthesis at the bottom. Error bars represent mean ± s.d. C-C” Embryos injected with 2x-mCherry-EMTB-LOV x Lifeact-GFP-ePDZ or 2x-mCherry-EMTB x Lifeact-GFP-ePDZ (control). Embryos were imaged at 8–16-cell stage (Day 0), blastula (Day 1), and gastrula (Day 2) stage. Dotted squared regions are magnified on right for each channel. Experimental embryos showed that mCherry signal at the spindle was partially recruited to cortical actin at the membrane (arrowheads), while GFP signal at actin was recruited to the spindle (yellow arrow) at the 8–16 cell stage. C’ Survivability of each embryo group was analyzed. Total number of embryos observed is indicated in parenthesis at the bottom. Error bars represent mean ± s.d. C” Frequency of GFP signal recruitment to the spindle in experimental embryos at Day 0 in C. Total number of cells observed is indicated at the top of each bar. Total number of embryos analyzed is noted below x-axis in parentheses. No GFP signal recruitment to the spindle was observed in control embryos.
Under the same blue light conditions, Lifeact-GFP-ePDZ was recruited to 2x-mCherry-EMTB-LOV at the 8–16 cell stage in experimental embryos, but not in the control embryos, which were injected with 2x-mCherry-EMTB without the LOV domain (Fig. 4C, yellow arrow). Although we originally expected 2x-mCherry-EMTB-LOV to be recruited to actin (Lifeact-GFP-ePDZ), it appeared that the binding affinity of EMTB to the microtubules was stronger than Lifeact’s binding affinity to actin. However, we noticed that 2x-mCherry-EMTB-LOV was also recruited to the membrane to some extent (Fig. 4C, white arrowheads), suggesting a dynamic competition between the two molecules over the course of development. This may explain the results we obtained with incomplete manipulations of spindle, or asymmetric cell division in the experiments in Fig. 2. Thus, identifying molecules that possess stronger affinities to each sub-cellular region may be critical for successful manipulation of cellular dynamics and development. Survivability of experimental and control groups at Day 2 was approximately 30–40% (Fig. 4C’). GFP signal recruitment to the spindle (2x-mCherry-EMTB-LOV) was consistently observed in all cells of all experimental embryos observed, while no GFP recruitment was found in control embryos (Fig. 4C”).
Sea urchins used in these experiment were obtained from various locations throughout the year, and have significant genetic variations. To take these variations into account, each round of the survivability assays were conducted using the same batch of fertilized eggs for all experimental and control groups. The average value of three independent experiments (batches) were then obtained for each sample group. Although the overall viability fluctuated to some extent among different batches of animals, the margin of error among three batches was relatively small. Most importantly, the survivability rate between injected control and experimental groups was consistently close to each other independent of the batch or of the construct. These results suggest that decreased survivability of the injected groups was caused not by optogenetic recruitment, but likely through general cytotoxicity due to injection and/or fluorescent protein expression in the cell.
Next, we tested whether continuous exposure to the aquarium lights would be sufficient to alter Vasa activity during embryogenesis. Embryos injected with the Vasa-mCherry-LOV and Lifeact-GFP-ePDZ constructs were initially incubated under weak blue light. This, however, did not alter Vasa localization on the spindle nor in micromeres (data not shown). These results align with findings from experiments in Fig. 3, where we found stronger laser powers (10%) necessary to recruit Vasa to actin, whereas cytoplasmic GFP or microtubule-binding EMTB were recruited with lower laser powers (3–6%). Accordingly, we incubated these embryos under strong blue light for three hours per day, in addition to incubating under weak blue light overnight (Fig. 5A). These conditions ectopically recruited Vasa to Lifeact in experimental embryos, whereas no ectopic recruitment was found in control embryos (Fig. 5B arrowheads and B’). Further, Vasa localization in the micromeres was disturbed in experimental embryos, while it remained enriched in the micromeres throughout development in control embryos (Fig. 5C). Ectopic Vasa localization and failure in gastrulation were also observed in experimental embryos to a much greater degree than in control embryos (Fig. 5C’ and C”).
Fig 5. Continuous manipulation of Vasa localization induced gastrulation failure in the developing embryo.

A A timeline of experimental set-up. Embryos were developed in dark until 2-cell stage (2 hpf), followed by 3-hour incubation in strong blue light, then overnight incubation in weak blue light. B-C” Embryos injected with Vasa-mCherry-LOV x Lifeact-GFP-ePDZ or Vasa-mCherry x Lifeact-GFP-ePDZ (control). Images were taken at 8–16 cell (Day 0), blastula (Day 1) and gastrula (Day 2) stages. (B) White arrowheads indicate ectopic Vasa localization (red punctate) in experimental embryos. No ectopic localization was found in control embryos. (C) Dotted squared regions in both experimental and control indicate the location of the micromeres at the 8–16 cell stage. Vasa was enriched in the micromeres of control embryos, and was lost in experimental embryos. At Day 1, white arrowheads in control embryos indicate Vasa enrichment in the future germline. At Day 2, yellow arrow indicates formation of a normal gut in the control embryo, which was compromised in the experimental embryo. B’-C” Percentage of embryos with ectopic Vasa localization (B’), compromised Vasa enrichment in the micromeres (C’), and with gastrulation failure (C”) was scored, respectively, at three developmental time points. Numbers of embryos observed for experimental and control groups at each time point are noted in parentheses at the bottom of each graph. Error bars represent mean ± s.d. D-F Embryos injected with Vasa-mCherry-LOV x Lifeact-GFP-ePDZ or Vasa-mCherry x Lifeact-GFP-ePDZ (control) in the presence of Vasa-MO. Percentage of embryos with ectopic Vasa localization (D), compromised Vasa enrichment in micromeres (E), and lack of gastrulation (F, F’) was scored, respectively, at Day 2 for each embryo group. A total number of embryos observed for each group is noted in parentheses at the bottom of each graph. Error bars represent mean ± s.d. G Survivability of each embryo group over two days of culture.. Total number of embryos observed is indicated in parenthesis on the right. C, control embryos without Vasa-MO; E, experimental embryos without Vasa-MO; C+MO, control embryos with Vasa-MO; E+MO, experimental embryos with Vasa-MO; Uninjected Blue, uninjected embryos with blue light; Uninjected no Blue, uninjected embryos with no blue light. Error bars represent mean ± s.d.
The phenotypes observed in the experimental embryos are similar to those of Vasa-knockdown embryos (Yajima and Wessel, 2011). These results suggest that ectopic localization of Vasa may have disrupted proper cell division and induced gastrulation defects. We were unable to induce complete disruption of development and Vasa enrichment in the micromeres under these conditions, despite having ectopic Vasa localization maintained throughout development. This may partly be because endogenous Vasa mRNA and protein was still present in these embryos, likely weakening the effect of ectopic Vasa function in the cell. To investigate this, we co-injected a Vasa-morpholino anti-sense oligo (Vasa-MO) with Vasa-mCherry-LOV and Lifeact-GFP-ePDZ to knock down endogenous Vasa (Yajima and Wessel, 2011). In this experiment, a three-hour pulse of strong blue light irradiation was performed only on day 0 to improve survivability of the embryos (Fig. 5G), followed by continuous weak blue light irradiation up to Day 2. As a comparison, the embryo groups injected with the same mRNA sets without Vasa-MO (Fig. 5G, Experimental and Control) were prepared in addition to the uninjected control groups, and treated under the same light conditions. We found that the MO-injected experimental group (Fig. 5G, Experimental MO) induced compromised Vasa enrichment in the germline and failure to gastrulate (Fig. 5F) at a higher rate compared to the rest of the groups at Day 2, even under milder activation condition (Fig 5A, lower blue line). The overall survivability of these MO-injected embryos was similar to that of other injected groups without MO (Fig. 5G). These results consistently suggest that optogenetic manipulation of Vasa compromises proper embryonic development, and is more effective in the absence of endogenous Vasa protein,
A promising technique to manipulate protein localization and function essential for embryonic development with spatio-temporal control
In this study, we applied recent optogenetic technologies in developing sea urchin embryos with the aim to control localization and function of proteins that are essential for development. Sub-cellular protein regulation is critical for differential cell function and fate specification, which in turn govern overall development in various organisms. Embryonic development serves as an excellent setting to investigate differential protein expression and function, as each cell within a single embryo undergoes different cell regulation and fate determination within a relatively short time frame (e.g. every 40 minutes for the sea urchin embryo). Therefore, one can determine the significance of each protein’s sub-cellular activity by manipulating its localization during embryogenesis, such as shown in Fig. 5. Further, the LOV-ePDZ mediated optogenetic system used in this study is simple and versatile - one can simply tag a protein of interest with the 500 bp LOV or ePDZ domain, co-introduce the mRNAs and activate LOV-ePDZ protein binding with minimal laser power to manipulate protein localization. Intensity and duration of optogenetic activation can be controlled by laser power and duration of blue light irradiation.
While this optogenetic system is promising, several technical aspects may be improved in the future to maximize its efficiency. For example, embryos are multi-cellular and highly three-dimensional, which caused technical difficulties when activating a specific ROI without inducing unwanted activation elsewhere during multiple rounds of cell divisions. Dynamic cell movement during the time-lapse recording also made it difficult to analyze mean fluorescence intensities within the fixed ROIs. We addressed these issues by selecting the activation ROIs that were closest to the objective, and by immobilizing embryos between a slide and cover glass to maintain the activation ROI within the focal plane during recording. These adjustments reduced the problems to some extent. However, a complete 4-D confocal microscopy that allows light activation and imaging in a three-dimensional manner should alleviate this problem further in the future. We also faced the issue of occasional auto-activation of LOV-ePDZ binding. Cytoplasmic molecules, such as GFP and mCherry were sometimes automatically recruited to ectopic areas under natural light, which never occurred with Vasa-tagged molecules. EMTB- and Lifeact-tagged proteins also showed resistance to recruitment, as they strongly bind to sub-cellular domains. These observations suggest that it is important to select an appropriate pair of molecules that have proper affinities to each sub-cellular region of interest to maximize recruitment efficiency.
In this report, we also explored an alternative approach that can activate LOV-ePDZ binding without using confocal microscopy. We incubated embryos under a blue aquarium light in a regulator incubator for two days, which successfully induced LOV-ePDZ protein binding while exerting some cytotoxicity. Under these experimental conditions, recruitment of Vasa to an ectopic sub-cellular region altered development and caused gastrulation failure. Although further trials with other fate determinants are needed, this initial result suggests a future usefulness of this optogenetic toolkit. Improving survivability of injected embryos is also important in the future, which may be accomplished by using mRNAs tagged to non-fluorescent reporters to reduce cytotoxicity. In that case, however, protein recruitment will need to be measured through a different method.
A promising approach to consider in the future is combining the LOV-ePDZ system with CRISPR/Cas9 genome editing technology (Lin and Su, 2016). Using CRISPR/Cas9, the optogenetic toolkit can be permanently integrated into the endogenous gene loci of interest to construct “optogenetic genes” by knock-in. With this method, optogenetic genes will be under control of endogenous gene promoters, allowing the prediction of expression levels without the necessity of fluorescent reporters. This may significantly reduce the cytotoxicity due to fluorescent reporters presented in this study. With this LOV-ePDZ system, one can activate protein-protein binding throughout a lifecycle simply by culturing animals under blue lights. Although several technical hurdles need to be overcome to achieve precise gene knock-ins, the combination of optogenetic and genome-editing technology will be a powerful tool to control cell and protein activities with spatio-temporal precision. Therefore, this LOV-ePDZ optogenetic system will play an important part in developing such future technologies to facilitate the biological manipulation of developing embryos.
Supplementary Material
Photographs of representative incubator set-up with weak blue light (left) and strong blue light (right) used for experiments in Figs. 4 and 5. Embryo culture dishes and blue light are labeled in each photo.
Highlights:
Blue laser irradiation induced protein binding of LOV and ePDZ domains in a power and duration-dependent manner.
Proteins of interest were recruited to ectopic locations during embryogenesis in a light-induced manner.
Vasa, an RNA helicase, was recruited to ectopic regions of the embryo through light induction during embryogenesis, causing developmental defects.
An aquarium blue light is sufficient to induce LOV and ePDZ domain bindings in the developing embryo.
Acknowledgements
We thank members of PRIMO at Brown University for general discussion of the manuscript. A.U. was responsible for experimental design and undertaking, data analysis, and manuscript construction; M.Y. was responsible for conceptualization, experimental design and undertaking, manuscript construction and editing. This work was supported by the American Heart Association Scientist Development Grant (#14SDG18350021), Brown University Richard B. Salomon Faculty Research Awards, and National Institute of General Medical Sciences (1R01GM126043–01) to M.Y.
Footnotes
Publisher's Disclaimer: This is a PDF file of an unedited manuscript that has been accepted for publication. As a service to our customers we are providing this early version of the manuscript. The manuscript will undergo copyediting, typesetting, and review of the resulting proof before it is published in its final citable form. Please note that during the production process errors may be discovered which could affect the content, and all legal disclaimers that apply to the journal pertain.
References
- Ansari AM, Ahmed AK, Matsangos AE, Lay F, Born LJ, Marti G, Harmon JW, Sun Z. Cellular GFP Toxicity and Immunogenicity: Potential Confounders in in Vivo Cell Tracking Experiments. Stem Cell Rev 12, 553–559 (2016). [DOI] [PMC free article] [PubMed] [Google Scholar]
- Buckley CE, Moore RE, Reade A, Goldberg AR, Weiner OD, Clarke JDW. Reversible Optogenetic Control of Subcellular Protein Localization in a Live Vertebrate Embryo. Dev Cell 36, 117–126 (2016). [DOI] [PMC free article] [PubMed] [Google Scholar]
- Gustafson EA, Wessel GM. Exogenous RNA is selectively retained in the small micromeres during sea urchin embryogenesis. Mol Reprod Dev 77, 836 (2010). [DOI] [PMC free article] [PubMed] [Google Scholar]
- Hay B, Jan LY, Jan YN. A protein component of Drosophila polar granules is encoded by vasa and has extensive sequence similarity to ATP-dependent helicases. Cell 55, 577–587 (1988). [DOI] [PubMed] [Google Scholar]
- Kennedy MJ, Hughes RM, Peteya LA, Schwartz JW, Ehlers MD, Tucker CL. 2010. Rapid blue-light mediated induction of protein interactions in living cells. Nat Meth 7, 973–975. [DOI] [PMC free article] [PubMed] [Google Scholar]
- Lasko PF, Ashburner M. The product of the Drosophila gene vasa is very similar to eukaryotic initiation factor-4A. Nature 335, 611–617(1988). [DOI] [PubMed] [Google Scholar]
- Lasko PF. 2013. The DEAD-box helicase Vasa: Evidence for a multiplicity of functions in RNA processes and developmental biology. Biochim Biophys Acta 1829, 810–816. [DOI] [PubMed] [Google Scholar]
- Lin CY, Su YH. Genome editing in sea urchin embryos by using a CRISPR/Cas9 system. Dev Biol. 409(2), 420–428 (2016). [DOI] [PubMed] [Google Scholar]
- Pathak GP, Vrana JD, Tucker CL. Optogenetic control of cell function using engineered photoreceptors. Biol. Cell 105, 59–72 (2013). [DOI] [PMC free article] [PubMed] [Google Scholar]
- Riedl J, Crevenna AH, Kessenbrock K, Yu JH, Neukirchen D, Bista M, Bradke F, Jenne D, Holak TA, Werb Z, Sixt M, Wedlich-Soldner R. (2008). Lifeact: a versatile marker to visualize F-actin. Nat Methods 5, 605–607. [DOI] [PMC free article] [PubMed] [Google Scholar]
- Strickland D, Lin Y, Wagner E, Hope CM, Zayner J, Antoniou C, Sosnick TR, Weiss EL, Glotzer M.. TULIPs: tunable, light-controlled interacting protein tags for cell biology. Nat Methods 9, 379–384 (2012). [DOI] [PMC free article] [PubMed] [Google Scholar]
- Tischer D, Weiner OD. Illuminating cell signalling with optogenetic tools. Nat Rev Mol Cell Biol 15, 551–558 (2014). [DOI] [PMC free article] [PubMed] [Google Scholar]
- van Bergeijk P, Adrian M, Hoogenraad CC, Kapitein LC. Optogenetic control of organelle transport and positioning. Nature 518,111–114 (2015). [DOI] [PMC free article] [PubMed] [Google Scholar]
- von Dassow G, Verbrugghe KJ, Miller AL, Sider JR, Bement WM. Action at a distance during cytokinesis. J Cell Biol 187, 831–845 (2009). [DOI] [PMC free article] [PubMed] [Google Scholar]
- Voronina E, Lopez M, Juliano CE, Gustafson E, Song JL, Extavour C, George S, Oliveri P, McClay D, Wessel G. Vasa protein expression is restricted to the small micromeres of the sea urchin, but is inducible in other lineages early in development. Dev Biol 314, 276–286 (2008). [DOI] [PMC free article] [PubMed] [Google Scholar]
- Yajima M, Wessel GM. The DEAD-box RNA helicase Vasa functions in embryonic mitotic progression in the sea urchin. Development 138, 2217–2222 (2011). [DOI] [PMC free article] [PubMed] [Google Scholar]
- Yajima M, Wessel GM. The germ line factor Vasa functions broadly in somatic cells: mRNA clustering, translational regulation, and wound healing. Development 142,1960–1970 (2015). [DOI] [PMC free article] [PubMed] [Google Scholar]
- Zhang K, Cui B. Optogenetic control of intracellular signaling pathways. Trends Biotechnol 33, 92–100 (2015). [DOI] [PMC free article] [PubMed] [Google Scholar]
Associated Data
This section collects any data citations, data availability statements, or supplementary materials included in this article.
Supplementary Materials
Photographs of representative incubator set-up with weak blue light (left) and strong blue light (right) used for experiments in Figs. 4 and 5. Embryo culture dishes and blue light are labeled in each photo.