

Abstract
Several comorbidities have recently been shown to affect risk of chemotherapy‐induced febrile neutropenia (FN). Here, we evaluated the added predictive value of these comorbidities beyond established FN risk factors. A retrospective cohort study was conducted among adult patients diagnosed with cancer and treated with chemotherapy at Kaiser Permanente Southern California between 2000 and 2009. The study cohort was equally split into training and validation datasets to develop and evaluate the performance of FN risk prediction models in the first chemotherapy cycle. A reference model was developed based on the model proposed by Lyman et al (Cancer 2011;117:1917). A new model was developed by incorporating the newly identified comorbidities such as rheumatoid conditions and thyroid disorders into the reference model. Area under the receiver operating characteristic curve (AUROCC), risk reclassification, and integrated discrimination improvement (IDI) were used to evaluate the potential improvement of FN risk prediction by incorporating comorbidities. A total of 15 279 patients were included; 4.2% experienced FN in the first chemotherapy cycle. Including comorbidities in FN risk prediction did not improve AUROCC (reference model 0.71 vs new model 0.72). A significant improvement in individual‐level FN risk prediction was indicated by IDI (P = .02). However, significant improvement in risk reclassification was not observed overall (although 6% of all patients were more accurately classified for their FN risk level, 5% were less accurately classified) or when examining predicted FN risk among patients who did and did not develop FN. Incorporating several new comorbidities into FN prediction led to improved FN risk prediction in the first chemotherapy cycle, although the observed improvements were small and might not be clinically relevant.
Keywords: chemotherapy, comorbidities, febrile neutropenia, prediction model, risk factors
1. INTRODUCTION
Chemotherapy‐induced febrile neutropenia (FN) is a clinically important adverse event that can negatively impact treatment outcomes. FN frequently requires hospitalization, which may result in significant healthcare costs.1, 2 Risk of developing FN is affected by chemotherapy regimens, patient characteristics, and disease characteristics. Clinical guidelines recommend primary prophylaxis with granulocyte colony‐stimulating factor (G‐CSF) in patients receiving high‐risk chemotherapy regimens (>20% risk in a chemotherapy course) and recommend consideration of G‐CSF prophylaxis for patients receiving intermediate‐risk chemotherapy regimens (10%‐20% risk in a chemotherapy course) who have additional risk factors.3, 4, 5, 6 Therefore, FN risk prediction tools incorporating patient and disease characteristics for individual patients could inform the clinical use of G‐CSF.
Lyman et al7 published an FN risk prediction model in 2011 (hereafter referred to as “the Lyman model”) that was based on prospectively collected data from community oncology practices in the USA. This model included risk factors such as patient age, cancer type, prior chemotherapy, laboratory measurements for abnormal hepatic and renal functions, low white blood cell (WBC) count, chemotherapy agents and planned relative dose intensity (RDI) ≥85%, concurrent immunosuppressive therapy, and receipt of G‐CSF prophylaxis as predictors for severe neutropenia or FN.7 This model has been validated in a study using electronic medical records (EMRs) from an external retrospective cohort of adult patients with cancer.8
Since the publication of the Lyman model,7 many comorbid conditions have been reported to be associated with risk of developing chemotherapy‐induced FN, including human immunodeficiency virus (HIV), diabetes (in nonoverweight patients), congestive heart failure, chronic obstructive pulmonary disease (COPD), autoimmune diseases, peptic ulcer disease, thyroid disease, liver disease, osteoarthritis, and recent dermatologic/mucosal conditions.9, 10, 11 The possible biologic mechanisms underlying these risk factors include bone marrow suppression, impaired neutrophil function, compromised skin/mucosal barrier integrity, and disturbances of the microbiome.12 Based on these hypothesized underlying pathological mechanisms, it is possible that these comorbidities may provide additional value in FN risk prediction. In this study, we evaluated the added predictive value of these comorbidities beyond the predictors identified in the Lyman model.7
2. MATERIALS AND METHODS
2.1. Study setting
This study was conducted at Kaiser Permanente Southern California (KPSC), an integrated managed care organization that provides comprehensive health services for 4 million enrollees with diverse race/ethnicity and socioeconomic backgrounds who broadly represent the residents of Southern California.13 KPSC maintains a number of EMRs for most aspects of care delivered, including diagnoses (eg, International Classification of Diseases [ICD]‐9 codes), medical procedures, pharmacy dispensing, laboratory test results, and disease registries. These EMRs are linkable through unique member identifiers. Incident cancer cases are recorded in KPSC's Surveillance, Epidemiology, and End Results (SEER)–affiliated cancer registry. All data for this study were collected using KPSC's EMRs and cancer registry.
2.2. Study design and patient selection
This study included adult patients (≥18 years of age) diagnosed with non‐Hodgkin's lymphoma (NHL), or breast, lung, colorectal, ovarian, or gastric cancer at KPSC between 2000 and 2009 and treated with chemotherapy within 12 months of cancer diagnosis and before December 2010. Patients who received prophylactic G‐CSF or prophylactic antibiotics were excluded as receipt of these medications would potentially alter FN risk in these patients. Patients were also excluded if they had <12 months of KPSC membership prior to cancer diagnosis (to allow the proper assessment of comorbidity status); had missing information on cancer stage or chemotherapy agents; received dose‐dense chemotherapy or weekly chemotherapy regimens; or had received a bone marrow or stem cell transplant.
The protocol for this study was approved by KPSC's Institutional Review Board. Formal informed consent was not required as the article reports results from a retrospective analysis of data in KPSC's EMRs and cancer registry and does not contain any studies involving direct contact of human participants performed by any of the authors.
2.3. Endpoint assessment
The endpoint of interest was FN in the first chemotherapy cycle. Only the first cycle was assessed to obtain the most unbiased FN risk, because FN risk in subsequent cycles might be affected by dose modification due to other complications. FN was defined by a combination of ICD‐9 codes, laboratory values, and health service utilization, using one of the following methods:10, 11, 12, 14 (1) neutropenia ICD‐9 code 288.0 and fever ICD‐9 code 780.6 (within 7 days); or (2) absolute neutrophil count (ANC) <1000/μL and fever ICD‐9 code 780.6 (within 7 days); or (3) hospitalization with neutropenia ICD‐9 code 288.0 as the primary diagnosis; or (4) neutropenia ICD‐9 code 288.0 or ANC <1000/μL within 7 days of hospitalization with ICD‐9 code of bacterial/fungal infection.
2.4. Assessment of exposure to FN risk factors
Predictors used in the Lyman model7 included patient's age, prior chemotherapy, serum aspartate aminotransferase (AST) level, serum alkaline phosphatase (AP) level, serum bilirubin level, glomerular filtration rate (GFR), WBC count, cancer type, immunosuppressive drug use, RDI, and type of chemotherapy agents. The status of each of these predictors was assessed for all eligible patients included in this study. The use of immunosuppressive drugs (see the list in Table S1) was defined as use for 2 weeks or longer within 3 months prior to chemotherapy. Chemotherapy agents and the percentage of planned dose received were assessed for the first chemotherapy cycle only. The percentage of planned dose received was calculated as average of [actual dose in the first chemotherapy cycle/standard dose in the first chemotherapy cycle] for all myelosuppressive agents. This is different from [actual dose in a chemotherapy course/standard dose in a chemotherapy course], the standard method used for determining the RDI of a given regimen. This change was necessitated by our focus in this study on the first chemotherapy cycle. Laboratory measurements within 6 months prior to chemotherapy initiation were identified. If multiple measurements were available for a given laboratory test, the value closest to chemotherapy initiation was used in the analysis.
The status of comorbidities that have been shown to be associated with FN risk was assessed (see Table S2 for methods for identifying comorbid conditions). HIV and diabetes were assessed using data from KPSC's disease registries. For HIV, all available data up to the time of cancer diagnosis were assessed. For diabetes, data from the earliest diagnosis date defined in the case identification algorithm from KPSC's case management system up to the time of cancer diagnosis were assessed. The history of selected dermatological/mucosal conditions was assessed within 1 month before chemotherapy initiation using ICD‐9 codes (Table S2). The presence of congestive heart failure, COPD, liver disease, osteoarthritis, rheumatoid disease, other autoimmune diseases (including inflammatory bowel disease, systemic lupus erythematosus, and multiple sclerosis), thyroid disorder, and peptic ulcer disease was assessed within the 12 months before chemotherapy initiation using ICD‐9 diagnosis codes (Table S2). Overweight/obesity was assessed using patients’ weight and height information recorded in the chemotherapy administration database at chemotherapy initiation. Overweight was defined as a body mass index (BMI) between 25.0 and <30.0 kg/m2 and obesity as a BMI of 30 kg/m2 or higher.15
2.5. Model development and evaluation
2.5.1. Training and validation datasets
To evaluate the added predictive value of comorbidities for FN risk in the first chemotherapy cycle, the study population was randomly split into a training dataset and a validation dataset (in a 1:1 ratio) to lessen the impact of potential overfitting on evaluating risk prediction and assess the performance of the model. The training dataset was used to develop the new FN risk prediction model incorporating comorbidities, whereas the validation dataset was used to evaluate the performance of this new model in predicting FN risk, using the regression coefficients derived from the training dataset.
2.5.2. Development of the reference model
A reference model was developed based on the Lyman model7 with several modifications (Figure 1). Prior history of chemotherapy was omitted, because the complete history of chemotherapy might not be accurately assessed due to lack of patients’ information prior to KPSC enrollment. AST, AP, and bilirubin were omitted, because these were not routinely measured for all patients (missing > 10%), and patients who had these tests performed were more likely to have some clinical indications than those who did not. Several categories of chemotherapy agents (ie, nucleotide and precursor analogs, vinca alkaloids, targeted therapy, and others such as DNA cross‐linkers, epothilones, and immunomodulators) were added to account for the diverse chemotherapy agents used in this study. Additionally, the predictor of “G‐CSF prophylaxis” was not included in the reference model, because patients receiving G‐CSF primary prophylaxis were excluded from our study. Multivariate logistic regression model was used to derive odds ratios (ORs) and 95% confidence intervals (CIs) for the risk of developing FN in the first chemotherapy cycle in the training dataset.
Figure 1.
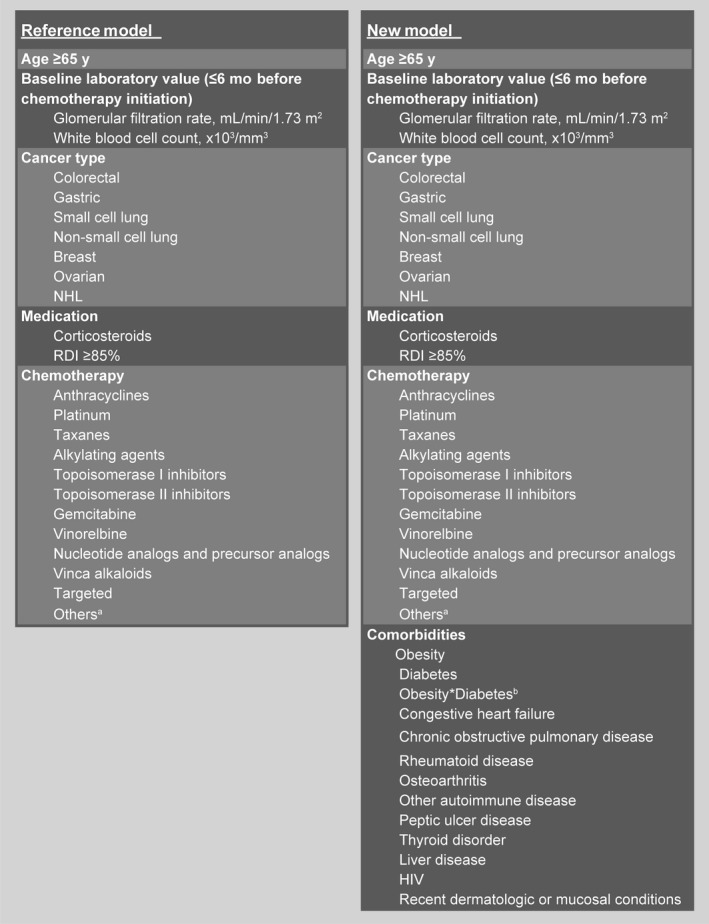
Predictors of febrile neutropenia risk in the first chemotherapy cycle included in the reference model and new risk factor model. aIncludes DNA cross‐linkers, epothilones, and immunomodulators. bInteraction term between obesity and diabetes. HIV, human immunodeficiency virus; NHL, non‐Hodgkin's lymphoma; RDI, relative dose intensity
2.5.3. Development of the new prediction model
A new model with all the newly identified comorbidities of interest plus the predictors in the reference model was developed (Figure 1). A 2‐way interaction term between obesity and diabetes was included in the new model, as a previous study12 had shown that diabetes was associated with increased FN risk only among patients who were not overweight/obese.
2.5.4. Evaluating added predictive value of comorbidities
The added predictive value of the comorbidities was assessed by comparing the performance of the reference model to that of the new model in the validation dataset. To compare the discriminative ability of the model, area under the receiver operating characteristic curve (AUROCC) was calculated for the reference model and the new model. The receiver operating characteristic curve is a plot of a model's sensitivity against 1 minus specificity. Area under the curve is a metric used to summarize the ability of a model to discriminate patients who developed an event of interest from those who did not, with an AUROCC of 1 corresponding to perfect discrimination and an AUROCC of 0.5 corresponding to no discrimination.
We also used risk reclassification tables to evaluate calibration in risk prediction improvement.16 First, an FN risk reclassification table for all patients in the validation dataset was generated by cross‐tabulating the FN risk categories in the first chemotherapy cycle predicted by the reference model and the new model. Risk reclassification is defined as improvement when the observed FN risk matches the new model's predicted risk category but not the reference model's and is defined as worsening when the observed FN risk matches the reference model's predicted risk category but not the new model's. Next, the risk reclassification tables were built separately for patients who did and did not develop FN. For patients who developed FN, any movement in the predicted risk to a higher FN risk category in the new model was considered improvement in risk prediction, whereas any movement to a lower FN risk category in the new model was considered worse reclassification. The opposite rule was applied for patients who did not develop FN. The improvement in predicted risk reclassification overall was quantified using net reclassification improvement (NRI).16 The following FN risk categories were considered in the reclassification analysis described above: <5%, 5% to <10%, and ≥10%. These ranges were chosen as it has been reported that approximately half of FN events occur in the first chemotherapy cycle;3, 17 therefore, they are likely equivalent to approximately <10%, 10% to 20%, and >20% FN risk over the chemotherapy course, which are cutoffs used in clinical guidelines.3, 4, 5, 6
The integrated discrimination improvement (IDI), a composite measurement of the increment in the predicted risk for patients with FN and the reduction of predicted risk for the patients without FN, was also calculated to assess the model performance independent of the choice of risk category cutoffs.18, 19
2.6. Sensitivity analysis
A sensitivity analysis was performed by creating a reference model that included all the predictors that had been used in the original Lyman model (except for G‐CSF prophylaxis) among a subcohort that had complete data for all the relevant laboratory predictors (ie, including AST, AP, bilirubin, WBC, and GFR). We used the history of prior cancer as a proxy for prior chemotherapy in this sensitivity analysis (of note, the history of prior cancer could also be incomplete due to lack of patients’ information for time periods prior to KPSC enrollment). Performance of the new model was then assessed in the subset that had complete data.
3. RESULTS
3.1. Patients
The analysis included 15 279 patients (Figure 2). Of these, 69.0% were female, and 38.3% were ≥65 years of age, with mean age at cancer diagnosis of 60.2 years (Table 1). Primary tumor types included NHL (10.3%) and breast (38.4%), lung (22.8%), colorectal (19.7%), ovarian (5.8%), and gastric cancers (3.0%). FN incidence in the first chemotherapy cycle was 4.2%. Similar distribution of demographic and treatment characteristics was observed in the training and validation datasets (Table 1).
Figure 2.
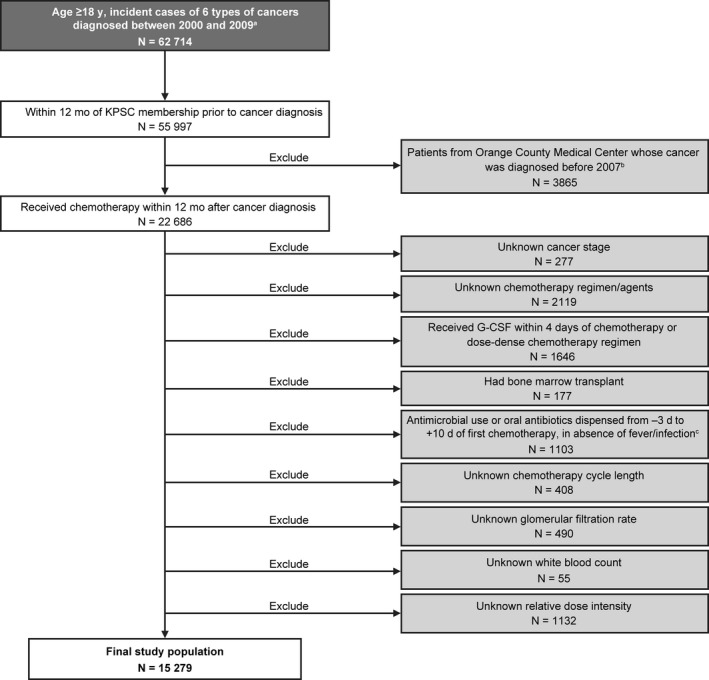
Patient selection. aThe 6 tumor types include non‐Hodgkin's lymphoma, and breast, lung, colorectal, ovarian, and gastric cancers. bExcluded due to lack of radiation therapy data. cAntimicrobial use includes the use of any prophylactic antibacterial, antifungal, or antiviral agent. G‐CSF, granulocyte colony‐stimulating factor; KPSC, Kaiser Permanente Southern California
Table 1.
Patient demographic and treatment characteristics
| Characteristics | Total (N = 15 279) | Training dataset (N = 7640) | Validation dataset (N = 7639) |
|---|---|---|---|
| Female, n (%) | 10 543 (69.0) | 5260 (68.9) | 5283 (69.2) |
| Age at cancer diagnosis, mean (SD), years | 60.2 (11.9) | 60.2 (12.0) | 60.2 (11.8) |
| Age at cancer diagnosis ≥65 yr, n (%) | 5859 (38.3) | 2932 (38.4) | 2927 (38.3) |
| Baseline laboratory valuea | |||
| Glomerular filtration rate, mean (SD), mL/min/1.73 m2 | 80.5 (24.82) | 80.6 (26.00) | 80.3 (23.57) |
| White blood cell count, mean (SD), ×103/mm3 | 8.1 (4.55) | 8.1 (4.17) | 8.1 (4.91) |
| Cancer type, n (%) | |||
| Breast | 5867 (38.4) | 2898 (37.9) | 2969 (38.9) |
| Colorectal | 3014 (19.7) | 1509 (19.8) | 1505 (19.7) |
| Non‐small cell lung | 2747 (18.0) | 1339 (17.5) | 1408 (18.4) |
| NHL | 1573 (10.3) | 804 (10.5) | 769 (10.1) |
| Ovarian | 890 (5.8) | 466 (6.1) | 424 (5.5) |
| Small cell lung | 727 (4.8) | 383 (5.0) | 344 (4.5) |
| Gastric | 461 (3.0) | 241 (3.2) | 220 (2.9) |
| Medication | |||
| Immunosuppressive drugs,b n (%) | 1381 (9.0) | 659 (8.6) | 722 (9.5) |
| Planned RDI ≥85%,c n (%) | 13 174 (86.2) | 6613 (86.6) | 6561 (85.9) |
| Chemotherapy, n (%) | |||
| Alkylating agents | 6627 (43.4) | 3295 (43.1) | 3332 (43.6) |
| Platinum | 6003 (39.3) | 3032 (39.7) | 2971 (38.9) |
| Anthracyclines | 5446 (35.6) | 2698 (35.3) | 2748 (36.0) |
| Nucleotide analogs and precursor analogs | 4784 (31.3) | 2413 (31.6) | 2371 (31.0) |
| Taxanes | 4175 (27.3) | 2089 (27.3) | 2086 (27.3) |
| Targeted | 1830 (12) | 929 (12.2) | 901 (11.8) |
| Vinca alkaloids | 1418 (9.3) | 724 (9.5) | 694 (9.1) |
| Topoisomerase II inhibitors | 861 (5.6) | 460 (6) | 401 (5.2) |
| Gemcitabine | 521 (3.4) | 260 (3.4) | 261 (3.4) |
| Topoisomerase I inhibitors | 442 (2.9) | 224 (2.9) | 218 (2.9) |
| Vinorelbine | 113 (0.7) | 37 (0.5) | 76 (1.0) |
| Others (DNA cross‐linkers, epothilones, and immunomodulators) | 40 (0.3) | 27 (0.4) | 13 (0.2) |
| Comorbidities,d , e n (%) | |||
| Obesity | 4257 (27.9) | 2062 (27.0) | 2195 (28.7) |
| Chronic obstructive pulmonary disease | 3007 (19.7) | 1506 (19.7) | 1501 (19.6) |
| Diabetes | 2676 (17.5) | 1334 (17.5) | 1342 (17.6) |
| Osteoarthritis | 1890 (12.4) | 921 (12.1) | 969 (12.7) |
| Thyroid disorder | 1584 (10.4) | 800 (10.5) | 784 (10.3) |
| Congestive heart failure | 558 (3.7) | 284 (3.7) | 274 (3.6) |
| Peptic ulcer disease | 394 (2.6) | 192 (2.5) | 202 (2.6) |
| Rheumatoid disease | 280 (1.8) | 137 (1.8) | 143 (1.9) |
| Liver disease | 261 (1.7) | 138 (1.8) | 123 (1.6) |
| Other autoimmune diseasef | 126 (0.8) | 67 (0.9) | 59 (0.8) |
| HIV | 53 (0.3) | 28 (0.4) | 25 (0.3) |
| Recent dermatologic or mucosal conditions,d , g n (%) | 455 (3) | 223 (2.9) | 232 (3) |
HIV, human immunodeficiency virus; NHL, non‐Hodgkin's lymphoma; SD, standard deviation; RDI, relative dose intensity.
≤6 mo before chemotherapy initiation.
≥2‐wk use within 3 mo prior to chemotherapy initiation.
Based on the first chemotherapy only, using the average (actual dose/standard dose) of all myelosuppressive drugs.
Newly identified risk/protective factors.
Assessed within 12 mo before chemotherapy initiation.
Includes inflammatory bowel disease, systemic lupus erythematosus, and multiple sclerosis.
≤1 mo before chemotherapy initiation.
3.2. Model derivation
The new model included the predictors in the reference model plus all comorbidities reported to be associated with FN risk in the literature, including HIV, diabetes, congestive heart failure, COPD, rheumatoid diseases, other autoimmune diseases, peptic ulcer disease, thyroid disease, liver disease, osteoarthritis, recent dermatologic/mucosal conditions, overweight/obesity, and an interaction term between diabetes and overweight/obesity (Figure 1). Table 2 summarizes the predictors that were included in the reference model and the new model, and the ORs and 95% CIs for the risk of developing FN in the first chemotherapy cycle in the training dataset.
Table 2.
Effect of predictors included in the reference model and new risk factor model on FN risk in the first chemotherapy cycle derived using the training dataset
| Predictor | Reference model Odds ratio (95% CI) | New model Odds ratio (95% CI) |
|---|---|---|
| Age ≥65 yr | 1.16 (0.90, 1.48) | 1.06 (0.82, 1.37) |
| Baseline laboratory valuea | ||
| Glomerular filtration rate, mL/min/1.73 m2 | 1.00 (0.99, 1.00) | 1.00 (0.99, 1.00) |
| White blood cell count, ×103/mm3 | 1.03 (1.01, 1.04) | 1.03 (1.01, 1.05) |
| Cancer type | ||
| Colorectal | 1.00 | 1.00 |
| Gastric | 3.66 (1.81, 7.43) | 3.18 (1.54, 6.56) |
| Small cell lung | 2.14 (0.94, 4.87) | 1.90 (0.83, 4.36) |
| Non‐small cell lung | 0.62 (0.29, 1.33) | 0.62 (0.29, 1.33) |
| Breast | 2.00 (0.93, 4.29) | 2.02 (0.94, 4.35) |
| Ovarian | 0.42 (0.17, 1.02) | 0.41 (0.17, 1.01) |
| NHL | 4.38 (1.59, 12.07) | 3.90 (1.39, 10.90) |
| Medication | ||
| Immunosuppressive drugsb | 1.40 (1.01, 1.94) | 1.28 (0.92, 1.80) |
| RDI ≥ 85%c | 1.37 (0.97, 1.94) | 1.40 (0.99, 1.98) |
| Chemotherapy | ||
| Anthracyclines | 1.37 (0.95, 1.98) | 1.41 (0.97, 2.06) |
| Platinum | 0.97 (0.63, 1.49) | 0.95 (0.62, 1.47) |
| Taxanes | 4.79 (3.15, 7.28) | 4.68 (3.07, 7.12) |
| Alkylating agents | 0.64 (0.40, 1.01) | 0.62 (0.39, 0.97) |
| Topoisomerase I inhibitors | 2.13 (0.97, 4.67) | 2.15 (0.97, 4.73) |
| Topoisomerase II inhibitors | 2.31 (1.33, 4.01) | 2.32 (1.33, 4.04) |
| Gemcitabine | 3.45 (1.75, 6.80) | 3.40 (1.71, 6.76) |
| Vinorelbine | 2.05 (0.27, 15.75) | 1.90 (0.25, 14.63) |
| Nucleotide analogs and precursor analogs | 0.70 (0.45, 1.09) | 0.70 (0.45, 1.09) |
| Vinca alkaloids | 1.65 (0.71, 3.83) | 1.71 (0.73, 3.99) |
| Targeted | 0.99 (0.66, 1.46) | 0.99 (0.66, 1.47) |
| Others (DNA cross‐linkers, epothilones, and immunomodulators) | 5.97 (2.08, 17.09) | 5.94 (1.97, 17.89) |
| Comorbiditiesd , e | ||
| Obesity | Not included | 0.94 (0.70, 1.27) |
| Diabetes | Not included | 1.16 (0.82, 1.64) |
| Obesity*diabetesf | Not included | 0.85 (0.47, 1.55) |
| Congestive heart failure | Not included | 1.03 (0.61, 1.76) |
| Chronic obstructive pulmonary disease | Not included | 1.22 (0.93, 1.61) |
| Rheumatoid disease | Not included | 2.03 (1.15, 3.56) |
| Osteoarthritis | Not included | 1.25 (0.92, 1.70) |
| Other autoimmune diseaseg | Not included | 0.87 (0.26, 2.91) |
| Peptic ulcer disease | Not included | 1.62 (0.94, 2.81) |
| Thyroid disorder | Not included | 1.51 (1.10, 2.08) |
| Liver disease | Not included | 1.73 (0.93, 3.22) |
| HIV | Not included | 1.48 (0.41, 5.31) |
| Recent dermatologic or mucosal conditionsd , h | Not included | 1.63 (1.01, 2.64) |
CI, confidence interval; FN, febrile neutropenia; HIV, human immunodeficiency virus; NHL, non‐Hodgkin's lymphoma; RDI, relative dose intensity.
≤6 mo before chemotherapy initiation.
≥2‐wk use within 3 mo prior to chemotherapy initiation.
Based on the first chemotherapy only, using the average (actual dose/standard dose) of all myelosuppressive drugs.
Newly identified risk/protective factors.
Assessed within 12 mo before chemotherapy initiation.
Interaction term between obesity and diabetes.
Includes inflammatory bowel disease, systemic lupus erythematosus, and multiple sclerosis.
≤1 mo before chemotherapy initiation.
3.3. Model performance
No improvement in AUROCC was observed in the new model (0.72) compared with the reference model (0.71). Adding comorbidities only led to slightly more patients being classified into correct FN risk categories. Table 3 cross‐tabulates predicted risk with the reference model, predicted risk with the new model, and observed FN risk. Patients more accurately classified by the new model are shown in green cells, while patients less accurately classified are shown in red cells. For the overall population, the new model provided more accurate risk classification for 6% of patients (n = 453; 218 + 235), as the observed FN risk matches the new model's predicted risk category (green cells) but not the reference model's predicted risk category. For example, the observed FN risk for the 235 patients is 4.7%, which matches the new model's predicted risk category of 0%‐5% but not the reference model's predicted risk category of 5% to <10%. The new model provided less accurate risk classification for 5% of patients (n = 390; 11 + 173 + 206) (red cells), as the observed FN risk matches the reference model's predicted risk category but not the new model's predicted risk category.
Table 3.
Predicted FN risks by the reference model and new model compared to the observed risks in the first chemotherapy cycle
| Reference modela | New modela | |||
|---|---|---|---|---|
| FN risk category | ||||
| FN risk category | <5% | 5% to <10% | ≥10% | Total |
| <5% | 5376 | |||
| n | 5147 | 218 | 11 | |
| Observed FN risk | 2.1% | 5.0% | 0% | |
| 5% to <10% | 1512 | |||
| n | 235 | 1104 | 173 | |
| Observed FN risk | 4.7% | 6.9% | 9.8% | |
| ≥10% | 751 | |||
| n | 0 | 206 | 545 | |
| Observed FN risk | NA | 10.7% | 13.0% | |
| Total | 5382 | 1528 | 729 | 7639 |
FN, febrile neutropenia; NA, not applicable.
Compared to the observed FN risks:
 , Risk reclassification improved by the new risk factor model (n = 453 [218 + 235]).
 , Risk reclassification worsened by the new risk factor model (n = 390 [11 + 173 + 206]).
 , Both new risk factor model and reference model classified patients into correct FN risk categories (n = 6769 [5147 + 1104 + 545]).
Table 4 summarizes risk reclassifications for patients who did and did not develop FN in the first chemotherapy cycle. Of the 317 patients in the validation dataset who developed FN, the new model improved classification for 8.8% of patients (n = 28 [17 + 11]) but worsened classification for 7.3% of patients (n = 33 [11 + 22]). Of the 7 322 patients who did not develop FN, the new model improved risk classification for 5.6% of patients (n = 408 [224 + 184]) but worsened risk classification for 5.1% of patients (n = 374 [207 + 11 + 156]). NRI, a metric used to quantify the overall improvement in risk reclassification among patients who developed and did not develop FN, was not statistically significant for the new model (P = .65) compared to the reference model.
Table 4.
Risk reclassification among patients who developed FN vs those who did not develop FN in the first chemotherapy cycle in the new model
| Reference modela | New modela | |||
|---|---|---|---|---|
| FN risk category | ||||
| FN risk category | <5% | 5% to <10% | ≥10% | Total |
| Patients who developed FN | ||||
| <5% | 120 | |||
| n | 109 | 11 | 0 | |
| 5% to <10% | 104 | |||
| n | 11 | 76 | 17 | |
| ≥10% | 93 | |||
| n | 0 | 22 | 71 | |
| Total | 120 | 109 | 88 | 317 |
| Patients who did not develop FN | ||||
| <5% | 5256 | |||
| n | 5038 | 207 | 11 | |
| 5% to <10% | 1408 | |||
| n | 224 | 1028 | 156 | |
| ≥10% | 658 | |||
| n | 0 | 184 | 474 | |
| Total | 5262 | 1419 | 641 | 7322 |
FN, febrile neutropenia.
 , No difference between the 2 models: patients with FN (n = 256 [109 + 76 + 71]) and patients without FN (n = 6540 [5038 + 1028 + 474]) were classified in the same risk categories by both models.
 , New risk factor model improved risk classification: patients with FN reclassified into higher‐risk categories (n = 28 [11 + 17]), and patients without FN reclassified into lower‐risk categories (n = 408 [224 + 0 + 184]).
 , New risk factor model worsened risk classification: patients with FN reclassified into lower‐risk categories (n = 33 [11 + 0 + 22]), and patients without FN reclassified into higher‐risk categories (n = 374 [207 + 11 + 156]).
Integrated discrimination improvement, a metric used to assess the model performance independent of the choice of risk category cutoffs, was found to be statistically significant for the new model (P = .02) compared to the reference model.
3.4. Sensitivity analysis
The sensitivity analysis included 10 046 patients with complete laboratory data. In the validation set (n = 5030), incorporating comorbidities into the Lyman model7 did not result in increase in AUROCC (from 0.70 to 0.70). The model with comorbidities improved predicted risk classification for 3% of patients (171 [98 + 73]) but worsened predicted risk classification for 5% of patients (n = 274 [145 + 128 + 1]) (Table S3). NRI (P = .911) and IDI (P = .65) were not statistically significant.
4. DISCUSSION
We found that including recently identified comorbidities that are associated with FN risk led to improved individual‐level FN risk prediction in the first chemotherapy cycle as measured by the IDI. However, the improvement we observed was small, and it may not translate into meaningful risk reclassification or an improvement in the clinical prophylactic management of FN.
Although clinical guidelines3, 4, 5, 6 recommend consideration of patient‐level risk factors when making G‐CSF prophylaxis decisions, it is not clear how prophylaxis should be best directed based on the presence of these patient‐level risk factors. A risk prediction model incorporating all relevant patient‐level risk factors is thus needed to guide prophylactic decisions. The intent of this study was to evaluate whether previously established FN risk prediction models should be updated to include newly identified FN risk factors. Such an update might have implications for clinical management of cancer patients undergoing chemotherapy. However, statistically significant risk factors may or may not be important contributors to risk prediction, depending on their distributions in the population.20 A previous study also suggested that for models containing standard risk factors and with reasonably good discrimination, very large “independent” associations of the new marker with the outcome are required to result in a meaningful increase in AUROCC.16 These considerations call for robust evaluations of the added predictive value of novel risk factors.
That said, the interpretation of the NRI and risk reclassification tables requires caution, as these measures depend on the choice of clinically meaningful cutoffs. We assumed that FN incidence in the first cycle is half the FN incidence over the whole course of chemotherapy. Although this appears true in some cohorts,17 FN distribution across cycles depends on the chemotherapy regimen as well as how many cycles are present in the regimen. If the true FN incidence proportion in the first cycle is not half of that over the chemotherapy course, our statistical methods remain valid, but the statistics for NRI and the numbers in Tables 3 and 4 would be different; IDI would remain the same, as it is independent of choice of cutoffs. Further, both clinical trials and observational studies are subject to selection bias due to differential censoring. For example, patients who developed other severe adverse events may die, may need to switch regimens, or may terminate treatment early. As a result, patients who complete the entire course of treatment are likely different than the entire patient cohort at the beginning of chemotherapy. The FN risk cutoffs chosen based on the available data thus might not reflect the appropriate cutoffs.
In our reference model, we expanded the chemotherapy classes beyond what was included in the Lyman model,7 to fully account for the chemotherapy agents used in the study population. In addition to alkylating agents, platinum, anthracyclines, taxanes, topoisomerase I and II inhibitors, gemcitabine, and vinorelbine included in the Lyman model7 (Figure 1), we also included nucleotide and precursor analogs, targeted therapy, vinca alkaloids, and others. This expansion to the reference model was not subject to any form of model selection; therefore, it is possible that some of the newly added chemotherapy drug classes may have no effect on FN risk as suggested by the OR estimates and could be omitted from the prediction model. However, because our purpose was to evaluate the incremental predictive value of adding comorbidities to established risk factors, we included more chemotherapy drug classes to ensure that the effects of chemotherapy on FN were appropriately captured. Of note, we found that chemotherapy agents that were classified into the “others” category appeared to be associated with highly elevated FN risk (OR = 5.97, 95% CI: 2.08, 17.09) (Table 2), independent of other predictors in the reference model as well as the new model. Agents in this category, including DNA cross‐linkers, epothilones, and immunomodulators, were only used by 0.3% of the study population. Further studies with large sample sizes are needed to better understand the impact of these agents on FN risk.
Several limitations should be considered when interpreting the results of our study. In addition to those mentioned above, the retrospective use of EMR data is subject to potential misclassification of the FN outcome and predictors due to inadequate or undercoding, which may negatively affect the evaluation of model performance. We developed and evaluated the new prediction models in the same study population that was previously used to identify these comorbidities as FN risk factors;9, 10, 11, 12 however, we split the study population into training and validation datasets and applied the beta coefficients obtained in the training set to the validation set to mitigate potential issues with overfitting. Patients who were excluded from the study because they received G‐CSF or antibiotics might have been those at highest risk of FN or those with comorbidities, and this may have left lower‐risk patients in the study cohort and biased our results. However, the impact of this exclusion is likely only moderate as only 7% of those eligible were excluded due to prophylactic G‐CSF use or receipt of a dose‐dense chemotherapy regimen. Several predictors in the Lyman model7 were omitted from the reference model in this study to avoid performing model development and evaluation in a biased sample. We also made the assumption that incidence of FN in the first cycle is half of that over the whole course of chemotherapy to derive NRI. This assumption might not be valid, which might partially explain the inconsistent findings measured by NRI and IDI.
In conclusion, incorporating several new comorbidities into established FN risk factors led to improved FN risk prediction in the first chemotherapy cycle in the patient population from a large community‐based practice, although the observed improvements were small and might not be clinically relevant. The best FN risk prediction model should be continually evaluated as knowledge on new FN risk factors becomes available.
DISCLOSURE STATEMENT
This study was funded by Amgen Inc. Yanli Li, John H. Page, and Zandra Klippel report employment by and hold shares in Amgen Inc. Leila Family reports employment by Kaiser Permanente Southern California (KPSC) at the time of the study; she is currently employed by the Los Angeles County Department of Public Health, Office of Health Assessment and Epidemiology. Lie Hong Chen and Chun R. Chao report employment by KPSC, which received research funding for this study from Amgen Inc. Lanfang Xu reports employment by Medhealth Statistical Consulting Inc. and being an independent contractor for KPSC, which received research funding for this study from Amgen Inc.
Supporting information
ACKNOWLEDGMENTS
Medical writing support was provided by Martha Mutomba (on behalf of Amgen Inc.) and Micah Robinson (of Amgen Inc.).
Li Y, Family L, Chen LH, et al. Value of incorporating newly identified risk factors into risk prediction for chemotherapy‐induced febrile neutropenia. Cancer Med. 2018;7:4121‐4131. 10.1002/cam4.1580
REFERENCES
- 1. Lyman GH, Dale DC, Crawford J. Incidence and predictors of low dose‐intensity in adjuvant breast cancer chemotherapy: a nationwide study of community practices. J Clin Oncol. 2003;21:4524‐4531. [DOI] [PubMed] [Google Scholar]
- 2. Lyman GH, Kuderer NM. Epidemiology of febrile neutropenia. Support Cancer Ther. 2003;1:23‐35. [DOI] [PubMed] [Google Scholar]
- 3. National Comprehensive Cancer Network . The NCCN® clinical practice guidelines in oncology (NCCN guidelines®). Myeloid growth factors. Version 2.2017. https://www.nccn.org/professionals/physician_gls/pdf/myeloid_growth.pdf. Accessed May 19, 2017. [DOI] [PubMed] [Google Scholar]
- 4. Aapro MS, Bohlius J, Cameron DA, et al. 2010 update of EORTC guidelines for the use of granulocyte‐colony stimulating factor to reduce the incidence of chemotherapy‐induced febrile neutropenia in adult patients with lymphoproliferative disorders and solid tumours. Eur J Cancer. 2011;47:8‐32. [DOI] [PubMed] [Google Scholar]
- 5. Klastersky J, de Naurois J, Rolston K, et al. Management of febrile neutropaenia: ESMO clinical practice guidelines. Ann Oncol. 2016;27:v111‐v118. [DOI] [PubMed] [Google Scholar]
- 6. Smith TJ, Bohlke K, Lyman GH, et al. Recommendations for the use of WBC growth factors: American Society of Clinical Oncology clinical practice guideline update. J Clin Oncol. 2015;33:3199‐3212. [DOI] [PubMed] [Google Scholar]
- 7. Lyman GH, Kuderer NM, Crawford J, et al. Predicting individual risk of neutropenic complications in patients receiving cancer chemotherapy. Cancer. 2011;117:1917‐1927. [DOI] [PMC free article] [PubMed] [Google Scholar]
- 8. Pawloski PA, Thomas AJ, Kane S, et al. Predicting neutropenia risk in patients with cancer using electronic data. J Am Med Inform Assoc. 2017;24:e129‐e135. [DOI] [PMC free article] [PubMed] [Google Scholar]
- 9. Chao C, Rodriguez R, Page JH, et al. History of chronic comorbidity and risk of chemotherapy‐induced febrile neutropenia in patients with non‐Hodgkin lymphoma not receiving granulocyte colony‐stimulating factor prophylaxis. Leuk Lymphoma. 2015;56:72‐79. [DOI] [PubMed] [Google Scholar]
- 10. Chia VM, Page JH, Rodriguez R, et al. Chronic comorbid conditions associated with risk of febrile neutropenia in breast cancer patients treated with chemotherapy. Breast Cancer Res Treat. 2013;138:621‐631. [DOI] [PubMed] [Google Scholar]
- 11. Family L, Li Y, Chen LH, et al. Risk factors for febrile neutropenia in cancer patients treated with chemotherapy. J Clin Oncol 2016;34(Suppl):Abstract 6559. [Google Scholar]
- 12. Chao C, Page JH, Yang SJ, et al. History of chronic comorbidity and risk of chemotherapy‐induced febrile neutropenia in cancer patients not receiving G‐CSF prophylaxis. Ann Oncol. 2014;25:1821‐1829. [DOI] [PubMed] [Google Scholar]
- 13. Koebnick C, Langer‐Gould AM, Gould MK, et al. Sociodemographic characteristics of members of a large, integrated health care system: comparison with US Census Bureau data. Perm J. 2012;16:37‐41. [DOI] [PMC free article] [PubMed] [Google Scholar]
- 14. Weycker D, Sofrygin O, Seefeld K, et al. Technical evaluation of methods for identifying chemotherapy‐induced febrile neutropenia in healthcare claims databases. BMC Health Serv Res. 2013;13:60. [DOI] [PMC free article] [PubMed] [Google Scholar]
- 15. Centers for Disease Control and Prevention . Defining Adult Overweight and Obesity. June 16, 2016. https://www.cdc.gov/obesity/adult/defining.html. Accessed May 19, 2017.
- 16. Pencina MJ, D'Agostino RB Sr., D'Agostino RB Jr., Vasan RS. Evaluating the added predictive ability of a new marker: from area under the ROC curve to reclassification and beyond. Stat Med 2008;27:157‐172; discussion 207‐212. [DOI] [PubMed] [Google Scholar]
- 17. Culakova E, Thota R, Poniewierski MS, et al. Patterns of chemotherapy‐associated toxicity and supportive care in US oncology practice: a nationwide prospective cohort study. Cancer Med. 2014;3:434‐444. [DOI] [PMC free article] [PubMed] [Google Scholar]
- 18. Yates JF. External correspondence: decompositions of the mean probability score. Organ Behav Hum Perform. 1982;30:132‐156. [Google Scholar]
- 19. Pencina MJ, D'Agostino RB, Vasan RS. Statistical methods for assessment of added usefulness of new biomarkers. Clin Chem Lab Med. 2010;48:1703‐1711. [DOI] [PMC free article] [PubMed] [Google Scholar]
- 20. Ware JH. The limitations of risk factors as prognostic tools. N Engl J Med. 2006;355:2615‐2617. [DOI] [PubMed] [Google Scholar]
Associated Data
This section collects any data citations, data availability statements, or supplementary materials included in this article.
Supplementary Materials