

Abstract
Kidney cancer incidence in African Americans (AA) is higher than among European Americans (EA); reasons for this disparity are not fully known. Dietary micronutrients may have a protective effect on renal cell carcinoma (RCC) development by inhibiting oxidative DNA damage and tumor growth. We evaluated whether any micronutrient associations differed by race in the US Kidney Cancer Study. 1142 EA and AA RCC cases and 1154 frequency‐matched controls were enrolled in a population‐based case‐control study between 2002 and 2007. Dietary micronutrient intake was derived from an interviewer‐administered diet history questionnaire. RCC risk associated with micronutrient intake was estimated using adjusted odds ratios from logistic regression comparing lower to highest quartiles of intake and sample weighting. Inverse associations with RCC risk were observed for α‐carotene, β‐carotene, lutein zeaxanthin, lycopene, vitamin A, folate, thiamin, vitamin C, α‐tocopherol, β‐tocopherol, γ‐tocopherol, and selenium. A trend for β‐cryptoxanthin was suggested among EA but not AA or the total sample (P‐interaction = .04). Otherwise, findings did not differ by race, gender, age, or smoking status. The increase in RCC risk associated with lower micronutrient intake is similar within AA and EA populations. A diet rich in sources of micronutrients found in fruits, vegetables, and nuts may help to reduce the overall risk of RCC.
Keywords: African Americans, carcinoma, diet, micronutrients, renal cell, vitamins
1. INTRODUCTION
It is estimated that 63 990 new cases of kidney cancer (KCa) will be identified in 2017, making it the sixth leading cancer diagnosed in men and tenth for women in the United States.1 Incidence rates have been rising over past decades, with rates two times higher among men than women, and approximately 20% higher among African Americans (AA) compared to European Americans (EA).2 Higher incidence rates, lower survival rates, and earlier age at diagnosis suggest that distinct factors may influence the development of kidney cancer within AA.3
Renal cell carcinoma (RCC) makes up approximately 90% of kidney cancer cases, and risk factors include cigarette smoking, obesity, hypertension, and alcohol.2, 4, 5, 6, 7, 8, 9, 10, 11 Racial differences in the distribution of several of these risk factors likely account for some of the excess risk observed in AA as compared to EA populations.4, 12, 13 Many vitamins from diet and supplements, including vitamin A, C, and B, have been shown to have antioxidative effects and may influence RCC risk.5, 6, 7, 8, 14, 15 Intake of dietary E vitamins, including α‐, β‐, δ‐, and γ‐tocopherol, is suggested to be chemo‐preventative.16 Supplementation with selenium may influence RCC risk, and selenium has been shown to possess anti‐tumor functions.17, 18, 19, 20 Diets rich in carotenoids, including α‐carotene, β‐carotene, β‐cryptoxanthin, lutein zeaxanthin, and lycopene, have been associated with lower RCC risk.6, 21, 22, 23 Several studies, however, have demonstrated no significant relationship between micronutrient intake and RCC.7, 14, 15 These discrepancies in the literature highlight the importance of further exploration of the role of micronutrients in RCC risk.
Further, it is unknown whether micronutrient intake explains some of the racial disparity in RCC risk. The objectives of this study were to investigate associations between intake of specific micronutrients and RCC risk, and to evaluate whether any of these associations differed by race in the US Kidney Cancer Study.
2. PATIENTS AND METHODS
2.1. Study population
The US Kidney Cancer Study is a population‐based case‐control study designed to examine racial disparities between AA and EA in RCC risk. The study was conducted in the metropolitan areas of Detroit (Wayne, Oakland, and Macomb counties), Michigan and Chicago (Cook County), Illinois.4 The study was approved by the Institutional Review Boards (IRB) of all participating institutions. Eligible cases were EA and AA men and women between the ages of 20 and 79 years with newly diagnosed RCC. In Chicago, cases were identified via pathology report review at hospitals in Cook County with diagnosis dates between January 1 and December 31, 2003. In Detroit, cases were ascertained through the Metropolitan Detroit Cancer Surveillance System (MDCSS), a participating registry of the National Cancer Institute's Surveillance, Epidemiology, and End Results (SEER) program, with diagnosis dates between February 1, 2002 and July 31, 2006 for EA, and through January 31, 2007 for AA. Controls were identified using motor vehicle records (20‐65 years old) and Medicare eligibility files (65‐79 years old). A detailed description of the sampling strategy is provided Colt et al.4 Controls were frequency matched to cases 2:1 in AA and 1:1 in EA on study center, race, sex, and five‐year age categories.
We identified 1918 eligible cases. Of these, 171 died before contact or interview, 92 could not be located, 21 relocated, and we were unable to obtain physician permission to contact 63. We also identified 2718 potentially eligible controls, and were not able to contact 41 due to death before contact or interview, 345 could not be located, and 63 relocated. In total, 1217 cases (77% contacted) and 1235 controls (54% contacted) completed an in‐person interview. We excluded 8 cases and 11 controls who did not complete the Diet History Questionnaire (DHQ) portion of the interview, 16 cases and 18 controls with questionable data quality as reported by the interviewer, and 51 cases and 52 controls with implausible reported total daily caloric intake (TDCI, <800 kcal or >5000 kcal). There were 1142 cases (72.7%) and 1154 controls (50.9%) with data appropriate for inclusion in these analyses.
2.2. Data collection
All participants gave informed consent prior to data collection. In‐person computer‐assisted personal interviews were conducted for each participant by trained personnel. Information was collected on demographics and past medical history, including hypertension, height and weight, diet, and smoking.
Dietary micronutrient intake was assessed using a modified version of the NCI DHQ24, which asked about usual adult diet prior to two years ago. The DHQ was interviewer‐administered and queried frequency of intake for foods, beverages, multivitamin, vitamin C, and vitamin E supplements, for a total of 80 line items. Portion sizes of beverages were reported by subjects, while standard portion sizes were assumed for foods to reduce respondent burden.25 Micronutrient intakes were calculated from DHQ responses based on the 1994‐1996 United States Department of Agriculture's Continuing Survey of Food Intake by Individuals (CSFII) with additional nutrients derived from the Nutrition Data Systems for Research (NDS‐R) database (University of Minnesota, Minneapolis, MN).26, 27 When both CSFII and NDS‐R calculated intake estimates were available for a given micronutrient, the NDS‐R values were used as these assessments are more comprehensive for micronutrient groups.28
2.3. Statistical analysis
The distributions of geographic region, sex, education, age, smoking status, body mass index (BMI), RCC family history, hypertension history, alcohol intake, and total daily caloric intake (TDCI) were described by counts and weighted percentages for cases and controls within racial category. Daily micronutrient intake (mg/day) was categorized into quartiles based on control distributions; the three lower quartiles were each compared to the highest quartile.
Associations between individual micronutrients and RCC risk were assessed using unconditional logistic regression models to estimate odds ratios (ORs) and 95% confidence intervals (CIs) from adjusted models. These analyses were weighted using a jackknife replication method (Jackknife 2).29, 30 Sample weights were developed to reduce bias from several sources, including differential sampling rates, survey nonresponse, and deficiencies in the population at risk arising from sampling frames. Sample weights for controls included a poststratification adjustment, so that weighted distribution of controls was equivalent to weighted distribution of cases. Poststratification adjustment also reduced the variability of weights.31
The linear trend was tested by analyzing an ordinal variable for micronutrient quartiles in an adjusted model. Adjusted models included variables for: region (Detroit, Chicago), sex (male, female), race (White, African American), age (20‐44, 45‐54, 55‐64, 65‐74, 75+), education (<12 years, high school graduate, some college, 4+ years of college), smoking history (never, occasional/unknown, former, current), BMI (<25, 25‐30, 30‐<35, 35+_kg/m2), RCC family history (none with cancer, unknown if diagnosed with cancer, diagnosed with other type of cancer, diagnosed with kidney cancer), and TDCI (continuous variable). Stratum‐specific analyses were also conducted within race, sex, BMI, hypertension status, and smoking history categories. Interaction between stratification variables and each micronutrient was assessed by including an interaction term in the adjusted models. Analyses were also conducted in the subset of clear cell RCC cases (n = 791) and all controls. The acceptable type I error rate was set at α = 0.05, and tests were two‐sided. The tests for linear trend were corrected for multiple comparisons using the Benjamini and Hochberg (1995) method considering the 18 micronutrients evaluated.32
3. RESULTS
Sociodemographic and baseline health characteristics and nutrient intake levels of 1142 cases and 1154 controls in the eligible study population are presented by race in Table 1. Compared to controls, cases were more likely to report a lower education level, smoke, have a higher BMI and family history of RCC, and diagnosed with hypertension. There were no differences between cases and controls in terms of region, sex, age, or TDCI. EA cases differed from EA controls on education level, smoking status, BMI, and hypertension. AA cases were more likely than AA controls to be male, have a lower education level, higher BMI, hypertension history, and greater caloric intake (Table 1).
Table 1.
Weighted results of baseline characteristics by case‐control status by race in the US kidney cancer study cohort
| White | African American | |||
|---|---|---|---|---|
| Cases | Controls | Cases | Controls | |
| N = 825 | N = 691 | N = 317 | N = 463 | |
| Region: N (%) | ||||
| Chicago | 113 (15.1) | 98 (16.1) | 70 (21.3) | 87 (21.0) |
| Detroit | 712 (84.9) | 593 (83.9) | 247 (78.7) | 376 (79.0) |
| Sex: N (%) | ||||
| Male | 477 (61.9) | 425 (61.4) | 194 (60.4) | 211 (58.8) |
| Female | 348 (38.1) | 266 (38.6) | 123 (39.6) | 252 (41.2) |
| Education: N (%) | ||||
| < 12 years | 98 (12.6) | 62 (9.3) | 81 (26.8) | 71 (15.8) |
| High school graduate | 301 (36.2) | 203 (30.2) | 93 (29.1) | 159 (33.8) |
| Some college | 208 (24.9) | 182 (26.1) | 102 (31.2) | 160 (33.3) |
| 4+ Years of college | 218 (26.3) | 244 (34.4) | 41 (12.9) | 73 (17.1) |
| Age (years): N (%) | ||||
| 20‐44 | 104 (10.3) | 90 (10.2) | 37 (12.0) | 74 (11.0) |
| 45‐54 | 179 (20.2) | 144 (20.5) | 90 (26.3) | 116 (27.2) |
| 55‐64 | 246 (29.0) | 198 (28.8) | 100 (29.5) | 131 (30.6) |
| 65‐74 | 211 (27.9) | 192 (28.4) | 74 (24.7) | 113 (23.4) |
| 75+ | 85 (12.6) | 67 (12.1) | 16 (7.5) | 29 (7.8) |
| Smoking status: N (%) | ||||
| Never | 299 (35.9) | 279 (39.9) | 108 (34.0) | 169 (35.4) |
| Occasional/Unknown | 31 (4.0) | 24 (3.4) | 17 (6.0) | 26 (5.4) |
| Former | 295 (36.9) | 271 (39.8) | 96 (30.0) | 147 (33.5) |
| Current | 200 (23.2) | 117 (17.0) | 96 (29.9) | 121 (25.7) |
| Body mass index (kg/m2): N (%) | ||||
| <25 | 170 (20.0) | 207 (29.0) | 58 (18.2) | 129 (27.2) |
| 25‐30 | 294 (36.6) | 289 (42.8) | 114 (37.2) | 182 (41.5) |
| 30‐<35 | 204 (25.2) | 123 (18.2) | 80 (24.3) | 81 (17.4) |
| 35+ | 150 (17.4) | 70 (9.9) | 62 (19.2) | 66 (13.1) |
| Unknown | 7 (0.9) | 2 (0.2) | 3 (1.1) | 5 (0.7) |
| Family history of kidney cancer: N (%) | ||||
| None with cancer | 323 (38.4) | 272 (38.1) | 160 (50.6) | 252 (52.8) |
| Unknown if diagnosed with cancer | 4 (0.6) | 5 (0.8) | 6 (1.9) | 4 (0.9) |
| Diagnosed with other type of cancer | 466 (57.0) | 401 (59.2) | 135 (42.5) | 198 (44.7) |
| Diagnosed with kidney cancer | 32 (3.9) | 13 (1.9) | 16 (5.1) | 9 (1.5) |
| Ever diagnosed with high blood pressure: N (%) | ||||
| No | 389 (44.9) | 432 (61.3) | 92 (29.3) | 247 (52.2) |
| Yes | 423 (53.4) | 254 (37.9) | 222 (69.8) | 213 (47.0) |
| Unknown | 13 (1.7) | 5 (0.8) | 3 (0.9) | 3 (0.8) |
| Daily alcohol intake | ||||
| None | 159 (19.3) | 104 (15.2) | 80 (25.9) | 127 (26.1) |
| >0‐0.14 drinks per day | 267 (31.3) | 215 (31.1) | 84 (27.0) | 114 (21.9) |
| >0.14‐0.86 drinks per day | 163 (20.2) | 157 (22.1) | 59 (18.6) | 111 (25.9) |
| >0.86 drinks per day | 236 (29.1) | 215 (31.6) | 92 (27.9) | 111 (26.2) |
| Unknown | ‐ | ‐ | 2 (0.6) | ‐ |
| Total caloric intake: Mean (SE) | 2345 (27) | 2306 (27) | 2609 (51) | 2467 (56) |
| Daily micronutrient intake: Mean (SE) | ||||
| α‐carotene (mcg/day) | 583 (13) | 637 (15) | 444 (21) | 502 (23) |
| β‐carotene equivalents (mcg/day) | 3268 (71) | 3619 (86) | 3827 (143) | 4295 (156) |
| β‐cryptoxanthin (mcg/day) | 143 (3.6) | 145 (2.9) | 219 (7.8) | 211 (7.9) |
| Lutein Zeaxanthin (mcg/day) | 2611 (69) | 2849 (75) | 3304 (125) | 3628 (129) |
| Lycopene (mcg/day) | 4523 (80) | 4609 (95) | 3553 (143) | 3602 (116) |
| Vitamin A (mcg/day) | 790 (13) | 822 (12) | 802 (23) | 827 (22) |
| Folate Equivalents (mcg/day) | 536 (6.7) | 558 (7.0) | 597 (14.0) | 585 (12.7) |
| Niacin (mg/day) | 27.3 (0.3) | 27.6 (0.3) | 28.8 (0.8) | 27.5 (0.6) |
| Riboflavin (mg/day) | 2.3 (0.03) | 2.3 (0.03) | 2.3 (0.05) | 2.2 (0.05) |
| Thiamin (mg/day) | 1.7 (0.02) | 1.8 (0.02) | 2.0 (0.04) | 1.9 (0.04) |
| Vitamin B6 (mg/day) | 2.1 (0.03) | 2.2 (0.02) | 2.4 (0.06) | 2.3 (0.05) |
| Vitamin B12 (mg/day) | 5.6 (0.08) | 5.5 (0.08) | 5.5 (0.14) | 5.2 (0.13) |
| Vitamin C (mg/day) | 335 (8) | 384 (11) | 366 (15) | 375 (13) |
| α‐Tocopherol (mg/day) | 8.5 (0.12) | 9.0 (0.12) | 8.7 (0.25) | 8.8 (0.21) |
| β‐Tocopherol (mg/day) | 0.3 (0.005) | 0.3 (0.005) | 0.4 (0.010) | 0.3 (0.008) |
| δ‐Tocopherol (mg/day) | 2.6 (0.05) | 2.7 (0.05) | 2.8 (0.09) | 2.7 (0.07) |
| γ‐Tocopherol (mg/day) | 17.9 (0.26) | 18.2 (0.29) | 18.7 (0.53) | 18.3 (0.46) |
| Selenium (mcg/day) | 116.8 (1.5) | 117.0 (1.3) | 129.4 (3.1) | 123.3 (2.7) |
Inverse associations with RCC risk were observed for α‐carotene (P‐trend = .021), β‐carotene (P‐trend <.001), lutein zeaxanthin (P‐trend = .021), and lycopene (P‐trend = .036) among all participants after adjustment for all variables (Table 2, Figure 1). While β‐cryptoxanthin intake was not significantly associated with RCC risk, we did observe a significant interaction with race (P‐interaction = .040), with an inverse association suggested among EA (P‐trend = .102), but no association observed among AA (P‐trend = .649, Table 2).
Table 2.
Weighted associations overall and by race between micronutrient intake and renal cell carcinoma (RCC) in the US kidney cancer study cohort
| Micronutrient | All Participants | Associations by Race | ||
|---|---|---|---|---|
| ORa (95% CI) | White | African American | P‐interaction | |
| ORb (95% CI) | ORb (95% CI) | |||
| Carotenes | ||||
| α‐carotene | ||||
| >754 mcg/day | 1 | 1 | 1 | .16 |
| 468‐754 mcg/day | 1.0 (0.8‐1.3) | 1.0 (0.8‐1.4) | 0.8 (0.4‐1.5) | |
| 267‐467 mcg/day | 1.4 (1.1‐1.8) | 1.3 (1.0‐1.8) | 1.6 (0.9‐3.0) | |
| <=266 mcg/day | 1.3 (1.0‐1.6) | 1.1 (0.8‐1.5) | 1.8 (1.1‐3.1) | |
| P‐trend (FDR corrected) | .021 | .232 | .024 | |
| β‐carotene equivalents | ||||
| >4936 mcg/day | 1 | 1 | 1 | .92 |
| 3275‐4936 mcg/day | 1.1 (0.8‐1.5) | 1.1 (0.8‐1.5) | 1.3 (0.8‐2.3) | |
| 2121‐3274 mcg/day | 1.5 (1.2‐2.0) | 1.5 (1.1‐2.1) | 1.6 (0.9‐2.6) | |
| <=2120 mcg/day | 1.8 (1.4‐2.3) | 1.6 (1.2‐2.3) | 2.3 (1.3‐3.9) | |
| P‐trend (FDR corrected) | <.001 | .004 | .024 | |
| β‐cryptoxanthin | ||||
| >216 mcg/day | 1 | 1 | 1 | .04 |
| 146‐216 mcg/day | 0.8 (0.6‐1.1) | 0.8 (0.6‐1.1) | 0.9 (0.5‐1.4) | |
| 93‐145 mcg/day | 1.0 (0.8‐1.4) | 1.1 (0.7‐1.5) | 0.9 (0.6‐1.4) | |
| <=92 mcg/day | 1.1 (0.8‐1.5) | 1.2 (0.9‐1.7) | 0.9 (0.5‐1.5) | |
| P‐trend (FDR corrected) | .174 | .102 | .649 | |
| Lutein Zeaxanthin | ||||
| >4014 mcg/day | 1 | 1 | 1 | .91 |
| 2480‐4014 mcg/day | 1.1 (0.8‐1.5) | 1.1 (0.8‐1.6) | 1.2 (0.8‐1.9) | |
| 1716‐2479 mcg/day | 1.1 (0.8‐1.4) | 1.0 (0.7‐1.4) | 1.4 (0.8‐2.3) | |
| <=1715 mcg/day | 1.5 (1.1‐2.0) | 1.4 (1.0‐2.0) | 1.7 (1.1‐2.9) | |
| P‐trend (FDR corrected) | .021 | .102 | .074 | |
| Lycopene | ||||
| >5368 mcg/day | 1 | 1 | 1 | .95 |
| 3900‐5368 mcg/day | 1.1 (0.9‐1.4) | 1.2 (0.9‐1.5) | 0.8 (0.4‐1.4) | |
| 2527‐3899 mcg/day | 1.4 (1.1‐1.8) | 1.4 (1.1‐1.9) | 1.1 (0.6‐1.8) | |
| <=2526 mcg/day | 1.3 (1.0‐1.8) | 1.2 (0.8‐1.7) | 1.5 (0.8‐2.8) | |
| P‐trend (FDR corrected) | .036 | .163 | .109 | |
| Vitamins | ||||
| Vitamin A | ||||
| >1041 rae ‐ mcg/day | 1 | 1 | 1 | .93 |
| 761‐1041 rae ‐ mcg/day | 1.6 (1.2‐2.1) | 1.6 (1.2‐2.3) | 1.5 (0.9‐2.6) | |
| 548‐760 rae ‐ mcg/day | 1.4 (1.1‐2.0) | 1.4 (1.0‐2.0) | 1.8 (1.0‐3.1) | |
| <=547 rae ‐ mcg/day | 1.9 (1.3‐2.6) | 1.8 (1.2‐2.7) | 2.2 (1.1‐4.4) | |
| P‐trend (FDR corrected) | .015 | .077 | .068 | |
| B Vitamins | ||||
| Dietary folate equivalents | ||||
| >689 mcg/day | 1 | 1 | 1 | .79 |
| 542‐689 mcg/day | 1.1 (0.8‐1.5) | 1.1 (0.8‐1.5) | 1.2 (0.7‐2.1) | |
| 418‐541 mcg/day | 1.4 (1.0‐2.0) | 1.4 (0.9‐2.1) | 1.5 (0.8‐2.9) | |
| <=417 mcg/day | 1.7 (1.1‐2.6) | 1.6 (1.0‐2.6) | 2.4 (1.2‐4.9) | |
| P‐trendc | .021 | .102 | .062 | |
| Niacin | ||||
| >33 mg/day | 1 | 1 | 1 | .91 |
| 28‐33 mg/day | 1.2 (0.8‐1.6) | 1.1 (0.8‐1.6) | 1.3 (0.7‐2.2) | |
| 21‐27 mg/day | 1.4 (1.0‐2.0) | 1.3 (0.9‐2.0) | 1.9 (1.0‐3.7) | |
| <=20 mg/day | 1.4 (0.9‐2.2) | 1.3 (0.8‐2.2) | 2.3 (1.0‐5.2) | |
| P‐trendc | .117 | .294 | .074 | |
| Riboflavin | ||||
| >2.7 mg/day | 1 | 1 | 1 | .53 |
| 2.2‐2.7 mg/day | 1.0 (0.7‐1.3) | 0.9 (0.6‐1.2) | 1.2 (0.7‐2.0) | |
| 1.7‐2.1 mg/day | 1.0 (0.7‐1.4) | 1.0 (0.7‐1.5) | 0.9 (0.5‐1.6) | |
| <=1.6 mg/day | 1.0 (0.7‐1.5) | 1.0 (0.6‐1.6) | 1.2 (0.6‐2.4) | |
| P‐trendc | .850 | .858 | .889 | |
| Thiamin | ||||
| >2.2 mg/day | 1 | 1 | 1 | .50 |
| 1.9‐2.2 mg/day | 1.2 (0.9‐1.6) | 1.2 (0.8‐1.6) | 1.3 (0.8‐2.1) | |
| 1.5‐1.8 mg/day | 1.5 (1.0‐2.2) | 1.4 (0.9‐2.2) | 2.0 (1.1‐3.6) | |
| <=1.4 mg/day | 1.6 (1.0‐2.6) | 1.6 (0.9‐2.8) | 1.6 (0.8‐3.5) | |
| P‐trendc | .046 | .131 | .179 | |
| Vitamin B6 | ||||
| >2.7 mg/day | 1 | 1 | 1 | .59 |
| 2.2‐2.7 mg/day | 1.1 (0.7‐1.5) | 0.9 (0.6‐1.3) | 1.8 (1.1‐3.2) | |
| 1.7‐2.1 mg/day | 1.4 (0.9‐2.0) | 1.2 (0.8‐1.9) | 2.0 (1.1‐3.4) | |
| <=1.6 mg/day | 1.4 (0.9‐2.2) | 1.3 (0.7‐2.2) | 1.8 (0.9‐3.8) | |
| P‐trendc | .109 | .220 | .173 | |
| Vitamin B12 | ||||
| >6.6 mg/day | 1 | 1 | 1 | .39 |
| 5.1‐6.6 mg/day | 1.1 (0.8‐1.5) | 1.2 (0.8‐1.7) | 0.9 (0.6‐1.4) | |
| 3.7‐5.0 mg/day | 1.1 (0.8‐1.5) | 1.2 (0.8‐1.8) | 0.9 (0.5‐1.5) | |
| <=3.6 mg/day | 1.0 (0.7‐1.5) | 1.0 (0.7‐1.6) | 1.0 (0.5‐1.8) | |
| P‐trendc | .889 | .858 | .889 | |
| Vitamin C | ||||
| Total Vitamin C (Dietary + Supplements) | ||||
| >666 mg/day | 1 | 1 | 1 | .09 |
| 255‐666 mg/day | 1.4 (1.1‐1.7) | 1.4 (1.1‐1.8) | 1.3 (0.8‐2.1) | |
| 145‐254 mg/day | 1.4 (1.1‐1.9) | 1.4 (1.0‐2.0) | 1.5 (1.0‐2.3) | |
| <=144 mg/day | 1.6 (1.2‐2.0) | 1.7 (1.3‐2.3) | 1.1 (0.7‐1.8) | |
| P‐trendc | .011 | .014 | .575 | |
| Vitamin E | ||||
| Dietary α‐Tocopherol | ||||
| >11.0 mg/day | 1 | 1 | 1 | .98 |
| 8.6‐11.0 mg/day | 1.4 (1.1‐1.9) | 1.4 (1.0‐1.9) | 1.6 (0.9‐2.9) | |
| 6.5‐8.5 mg/day | 1.7 (1.2‐2.4) | 1.5 (1.0‐2.2) | 2.8 (1.4‐5.5) | |
| <=6.4 mg/day | 2.3 (1.6‐3.4) | 2.1 (1.4‐3.4) | 3.6 (1.6‐8.0) | |
| P‐trendc | .001 | .024 | .021 | |
| Dietary β‐Tocopherol | ||||
| >0.42 mg/day | 1 | 1 | 1 | .95 |
| 0.33‐0.42 mg/day | 1.5 (1.1‐1.9) | 1.6 (1.2‐2.2) | 1.0 (0.6‐1.7) | |
| 0.25‐0.32 mg/day | 1.4 (1.0‐1.8) | 1.4 (1.0‐1.9) | 1.3 (0.7‐2.7) | |
| <=0.24 mg/day | 1.8 (1.2‐2.7) | 1.8 (1.2‐2.9) | 2.1 (1.0‐4.4) | |
| P‐trendc | .023 | .102 | .097 | |
| Dietary δ‐Tocopherol | ||||
| >3.29 mg/day | 1 | 1 | 1 | .41 |
| 2.41‐3.29 mg/day | 1.0 (0.8‐1.3) | 1.0 (0.8‐1.4) | 0.8 (0.5‐1.3) | |
| 1.69‐2.40 mg/day | 1.3 (0.9‐1.7) | 1.2 (0.8‐1.7) | 1.7 (1.0‐2.9) | |
| <=1.68 mg/day | 1.2 (0.8‐1.8) | 1.3 (0.8‐2.0) | 1.2 (0.6‐2.2) | |
| P‐trendc | .186 | .253 | .285 | |
| Dietary γ‐Tocopherol | ||||
| >22.6 mg/day | 1 | 1 | 1 | .59 |
| 17.0‐22.6 mg/day | 1.4 (1.0‐1.8) | 1.3 (1.0‐1.8) | 1.4 (0.8‐2.6) | |
| 12.7‐16.9 mg/day | 1.4 (1.0‐1.9) | 1.4 (0.9‐2.0) | 1.4 (0.7‐2.6) | |
| <=12.6 mg/day | 1.7 (1.2‐2.4) | 1.6 (1.1‐2.5) | 2.0 (0.9‐4.3) | |
| P‐trendc | .036 | .102 | .158 | |
| Other | ||||
| Selenium | ||||
| >146 mcg/day | 1 | 1 | 1 | .35 |
| 115‐146 mcg/day | 1.2 (0.9‐1.6) | 1.1 (0.8‐1.5) | 1.9 (1.1‐3.4) | |
| 89‐114 mcg/day | 1.7 (1.2‐2.4) | 1.6 (1.0‐2.3) | 2.4 (1.2‐4.8) | |
| <=88 mcg/day | 2.0 (1.3‐3.0) | 1.9 (1.1‐3.1) | 2.4 (1.1‐5.3) | |
| P‐trendc | .008 | .028 | .097 | |
Adjusted for total calories, region, sex, race, age, education, smoking history, BMI, family history of RCC, hypertension, and alcohol intake.
Adjusted for total calories, region, sex, age, education, smoking history, BMI, family history of RCC, hypertension, and alcohol intake.
FDR corrected.
Figure 1.
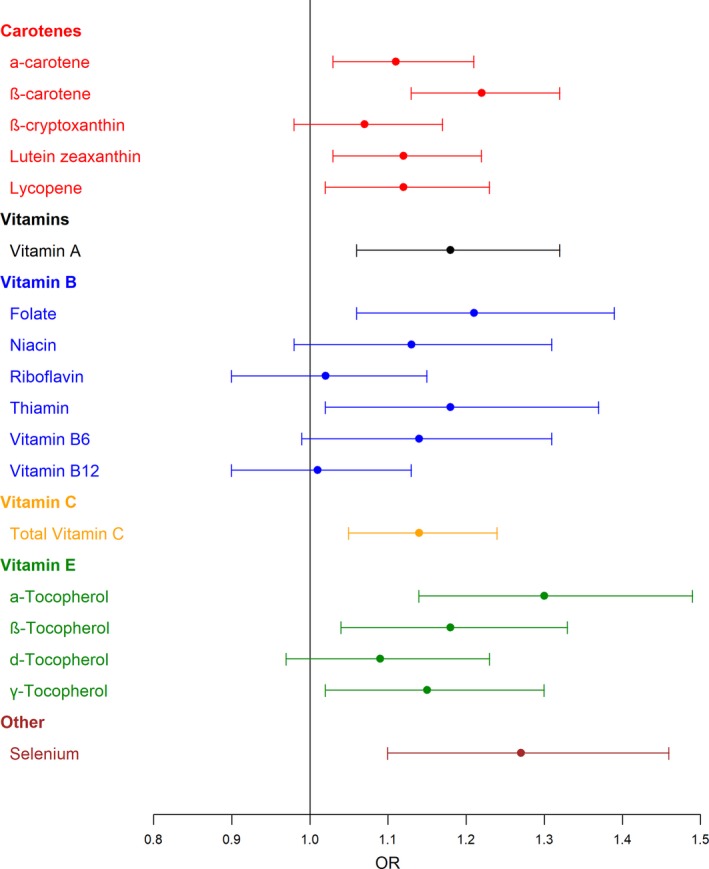
Odds ratios, with 95% confidence intervals, from multivariate logistic regression models of association between micronutrients and renal cell carcinoma in the US Kidney Cancer Study cohort. OR: Adjusted for total calories, region, sex, race, age, education, smoking history, BMI, family history of RCC, hypertension, and alcohol intake; micronutrients are included as an ordinal variable for quartiles of intake in the controls.
Vitamin A was inversely associated with RCC risk (P‐trend = .015). Compared to individuals in the highest quartile, those in the lowest were 1.9‐fold more likely to have increased risk of RCC. For B vitamins, significant inverse associations with RCC were observed for dietary folate (P‐trend = .021) and thiamin (P‐trend = .046) among all participants. Total vitamin C was significantly inversely associated with RCC risk (P‐trend = .011). No significant interactions were observed between race and A, B, or C vitamins. Among E vitamins, α‐tocopherol (P‐trend = .001), β‐tocopherol (P‐trend = .023), and γ‐tocopherol (P‐trend = .036) demonstrated significant inverse association with RCC risk among all participants (Table 2, Figure 1). No significant interactions with race were observed for any of the E vitamins.
Inverse association with RCC risk was also noted for overall selenium intake Table 2, Figure 1). Compared to individuals in the highest quartile, those that reported in the lowest quartile selenium intake had a 2.0‐fold increased risk of RCC (P‐trend = .008).
We also performed weighted analyses between micronutrient intake and RCC stratified by sex, BMI, hypertension, and smoking status, and observed similar results (data not shown). Notably, no significant interactions between any micronutrients examined and race, age or other RCC risk factors were observed (Table 2 and data not shown). Results from analyses restricted to the subset of 791 clear cell RCC cases and all controls did not appreciably differ from those in the entire sample (data not shown).
4. DISCUSSION
Our analysis of micronutrient intake with risk of RCC by race in a population‐based case‐control study demonstrated significant inverse associations between intake of micronutrients and RCC risk. We discovered these associations are similar by race for both AA and EA, noting stronger protective trends among AA. Despite known differences in RCC risk attributable to gender, age, smoking status, and alcohol, we found that these characteristics did not modify the protective effects of micronutrients.
Carotenoids, such as lycopene and β‐cryptoxanthin, are exclusively obtained from dietary sources that originate from fruits and vegetables, including tomato, watermelon, papaya, and pink grapefruit.33 We observed significant inverse associations with RCC risk independent of race for α‐carotene, β‐carotene, lutein zeaxanthin, and lycopene. We observed an interaction between β‐cryptoxanthin intake and race, wherein β‐cryptoxanthin was associated with decreased risk among EA but not AA. Because none of the quartile‐specific ORs among EA were statistically significant, implications for β‐cryptoxanthin consumption recommendations are not clear. Previous reports of associations between carotenoids and RCC are inconsistent. Aligned with our observations, previous case‐control,6, 34 individual cohort21 and pooled cohort22 studies have demonstrated significant associations between intake of carotenoids and RCC risk.34, 35, 36 However, other case‐control37 and cohort5, 7, 8, 14, 23 studies did not detect an association. Reasons for discrepancies in findings among dietary risk factor studies may be due to differences in the source populations, variations in dietary assessment methods, and varying degrees of recall bias between studies.
Among the vitamins, we reported significant inverse associations with RCC risk for vitamin A, total vitamin C, dietary folate and thiamin in all participants. By race, we observed significant associations with dietary folate and niacin and RCC among AA. In contrast, total vitamin C intake was significantly associated with risk of RCC among EA. Previous population‐based studies have demonstrated significant inverse associations with vitamin C intake and RCC.6, 35
Our study is novel as it is the first to assess the association of micronutrient intake, including tocopherols, with RCC risk among AA. Of vitamin E compounds, there are four tocopherols (α‐ β‐, δ‐, and γ‐tocopherol) found naturally in nuts, fish, leafy greens, and vegetable oils. We noted inverse associations between α‐tocopherol and RCC risk among all participants, with greater protective effects among AA. Aligned with these observations, previous studies demonstrated an association between increased intake of tocopherols with decreasing RCC risk for males and females, nonsmokers, and ever smokers.5, 36, 37, 38, 39, 40 In contrast, other studies reported associations of marginal or no significance between RCC risk and tocopherol intake.7, 8, 10, 14, 15, 41
Studies examining the relationships between mineral intake and RCC risk have previously found no associations with selenium.5, 36 Selenium plays critical roles in major metabolic pathways, and is an essential element to protect the body from harmful substances. Recent studies demonstrated that selenium supplementation reduces side effects from chemotherapy and improves kidney and liver functions in cancer patients.16, 19, 20 Analysis of selenium intake by participants in our study revealed inverse associations with RCC risk for both EA and AA, with greater protective effects among AA. Based on these observations and the findings of Stafford, et al3 which identified racial disparities in RCC incidence and survival, additional work is needed to provide insight on the association between micronutrients and RCC development specifically among AA.
Similar to other studies, we found no interactions with obesity or hypertension and micronutrients with respect to RCC risk.35 We acknowledge that limitations of this study include self‐reported dietary information and the inherent limitations of a case‐control study design, in particular, low participation rates among controls, typical of population‐based case‐control studies. The use of sample weights helps reduce bias arising from nonresponse, as weights account for differential nonresponse across subgroups (age, sex, and county of residence) for which data were available for both respondents and nonrespondents. We were unable to stratify patients by smoking status due to small sample sizes, but adjusted this in our weighted analyses.
The current study is strengthened by the inclusion of large numbers of AA cases and controls and the use of in‐person interviews. As a result, we were able to examine associations between the micronutrients of interest and RCC risk overall and by race and sex after adjusting for known RCC risk factors. Use of SEER data is another strength as it allowed for a considerable number of pathologically verified cases, and results can be generalized to the larger United States population.
While a strength of the study is the inclusion of adequate numbers of AAs and EAs to examine associations stratified by race, other racial/ethnic groups were not represented thus limiting generalizability to these two race groups. Knowledge of disease status may have biased FFQ responses, resulting in differential misclassification of exposures. Additionally, DHQs have known measurement error which may result in nondifferential misclassification, biasing effect estimates toward the null. The DHQ was modified for length from the validated NCI DHQ;24 however, the modified version was not independently validated. The micronutrient values available for analysis only included supplement use for vitamin C variable; the remaining variables did not include micronutrients from supplement sources. We expect that this would result in a bias toward the null in the observed odds ratios. To address this concern, we repeated the analyses with adjustment for multivitamin use, and there was no change in which P‐trends were statistically significant or not. Although we adjusted for multiple comparisons, we cannot rule out the role of chance and possibility of false positives, as in any epidemiologic study.
In conclusion, we observed high intake of micronutrients to be associated with lower RCC risk among AA and EA. These findings support a diet rich in carotenes, tocopherols, vitamins, and minerals to help reduce the risk of RCC among both AA and EA. Despite differences in underlying disease risk attributable to race, gender, age, smoking status, and alcohol, these characteristics did not modify the protective associations of micronutrients observed in our study. Although our findings suggest that dietary interventions involving increased consumption of these micronutrients could reduce RCC risk, further investigation is needed before causal inferences can be drawn.
CONFLICT OF INTERESTS
There are no conflict of interests for any authors.
ACKNOWLEDGMENTS
The US Kidney Cancer Study is supported by the Intramural Research Program of the National Institutes of Health and the National Cancer Institute. We appreciate the contributions of Ms. Gloria Gridley, Ms. Joanne Colt, Dr. Wong‐Ho Chow, and Dr. Sholom Wacholder (deceased) to the US Kidney Cancer Study and this manuscript. This original article was submitted without invitation.
Bock CH, Ruterbusch JJ, Holowatyj AN, et al. Renal cell carcinoma risk associated with lower intake of micronutrients among African Americans and white people. Cancer Med. 2018;7:4087–4097. 10.1002/cam4.1639
Funding information
This work was supported by the Intramural Research Program of the National Institutes of Health and the National Cancer Institute.
REFERENCES
- 1. Siegel RL, Miller KD, Jemal A. Cancer statistics, 2018. CA Cancer J Clin. 2018;68:7‐30. [DOI] [PubMed] [Google Scholar]
- 2. Chow WH, Dong LM, Devesa SS. Epidemiology and risk factors for kidney cancer. Nat Rev Urol. 2010;7:245‐257. [DOI] [PMC free article] [PubMed] [Google Scholar]
- 3. Stafford HS, Saltzstein SL, Shimasaki S, Sanders C, Downs TM, Sadler GR. Racial/ethnic and gender disparities in renal cell carcinoma incidence and survival. J Urol. 2008;179:1704‐1708. [DOI] [PMC free article] [PubMed] [Google Scholar]
- 4. Colt JS, Schwartz K, Graubard BI, et al. Hypertension and risk of renal cell carcinoma among white and black Americans. Epidemiology. 2011;22:797‐804. [DOI] [PMC free article] [PubMed] [Google Scholar]
- 5. Nicodemus KK, Sweeney C, Folsom AR. Evaluation of dietary, medical and lifestyle risk factors for incident kidney cancer in postmenopausal women. Int J Cancer. 2004;108:115‐121. [DOI] [PubMed] [Google Scholar]
- 6. Hu J, La VC, Negri E, DesMeules M, Mery L, Canadian Cancer Registries Epidemiology Research G . Dietary vitamin C, E, and carotenoid intake and risk of renal cell carcinoma. Cancer Causes Control. 2009;20:1451‐1458. [DOI] [PubMed] [Google Scholar]
- 7. Prineas RJ, Folsom AR, Zhang ZM, Sellers TA, Potter J. Nutrition and other risk factors for renal cell carcinoma in postmenopausal women. Epidemiology. 1997;8:31‐36. [DOI] [PubMed] [Google Scholar]
- 8. Lee JE, Giovannucci E, Smith‐Warner SA, Spiegelman D, Willett WC, Curhan GC. Intakes of fruits, vegetables, vitamins A, C, and E, and carotenoids and risk of renal cell cancer. Cancer Epidemiol Biomarkers Prev. 2006;15:2445‐2452. [DOI] [PubMed] [Google Scholar]
- 9. Bellocco R, Pasquali E, Rota M, et al. Alcohol drinking and risk of renal cell carcinoma: results of a meta‐analysis. Ann Oncol. 2012;23:2235‐2244. [DOI] [PubMed] [Google Scholar]
- 10. Hu J, Chen Y, Mao Y, Desmeules M, Mery L, Canadian Cancer Registries Epidemiology Research G . Alcohol drinking and renal cell carcinoma in Canadian men and women. Cancer Detect Prev. 2008;32:7‐14. [DOI] [PubMed] [Google Scholar]
- 11. Song DY, Song S, Song Y, Lee JE. Alcohol intake and renal cell cancer risk: a meta‐analysis. Br J Cancer. 2012;106:1881‐1890. [DOI] [PMC free article] [PubMed] [Google Scholar]
- 12. Beebe‐Dimmer JL, Colt JS, Ruterbusch JJ, et al. Body mass index and renal cell cancer: the influence of race and sex. Epidemiology. 2012;23:821‐828. [DOI] [PMC free article] [PubMed] [Google Scholar]
- 13. Cote ML, Colt JS, Schwartz KL, et al. Cigarette smoking and renal cell carcinoma risk among black and white Americans: effect modification by hypertension and obesity. Cancer Epidemiol Biomarkers Prev. 2012;21:770‐779. [DOI] [PMC free article] [PubMed] [Google Scholar]
- 14. Bertoia M, Albanes D, Mayne S, Mannisto S, Virtamo J, Wright ME. No association between fruit, vegetables, antioxidant nutrients and risk of renal cell cancer. Int J Cancer. 2010;126:1504‐1512. [DOI] [PMC free article] [PubMed] [Google Scholar]
- 15. Virtamo J, Edwards BK, Virtanen M, et al. Effects of supplemental alpha‐tocopherol and beta‐carotene on urinary tract cancer: incidence and mortality in a controlled trial (Finland). Cancer Causes Control. 2000;11:933‐939. [DOI] [PubMed] [Google Scholar]
- 16. Salganik RI. The benefits and hazards of antioxidants: controlling apoptosis and other protective mechanisms in cancer patients and the human population. J Am Coll Nutr 2001;20:464S‐472S; discussion 473S‐475S. [DOI] [PubMed] [Google Scholar]
- 17. Chintala S, Najrana T, Toth K, et al. Prolyl hydroxylase 2 dependent and Von‐Hippel‐Lindau independent degradation of Hypoxia‐inducible factor 1 and 2 alpha by selenium in clear cell renal cell carcinoma leads to tumor growth inhibition. BMC Cancer. 2012;12:293. [DOI] [PMC free article] [PubMed] [Google Scholar]
- 18. Gupta S, Jaworska‐Bieniek K, Lubinski J, Jakubowska A. Can selenium be a modifier of cancer risk in CHEK2 mutation carriers? Mutagenesis. 2013;28:625‐629. [DOI] [PubMed] [Google Scholar]
- 19. Vieira ML, Fonseca FL, Costa LG, et al. Supplementation with selenium can influence nausea, fatigue, physical, renal, and liver function of children and adolescents with cancer. J Med Food. 2015;18:109‐117. [DOI] [PubMed] [Google Scholar]
- 20. Zachara BA. Selenium and selenium‐dependent antioxidants in chronic kidney disease. Adv Clin Chem. 2015;68:131‐151. [DOI] [PubMed] [Google Scholar]
- 21. Ho WJ, Simon MS, Yildiz VO, et al. Antioxidant micronutrients and the risk of renal cell carcinoma in the Women's Health Initiative cohort. Cancer. 2015;121:580‐588. [DOI] [PMC free article] [PubMed] [Google Scholar]
- 22. Lee JE, Mannisto S, Spiegelman D, et al. Intakes of fruit, vegetables, and carotenoids and renal cell cancer risk: a pooled analysis of 13 prospective studies. Cancer Epidemiol Biomarkers Prev. 2009;18:1730‐1739. [DOI] [PMC free article] [PubMed] [Google Scholar]
- 23. van Dijk BA, Schouten LJ, Oosterwijk E, et al. Carotenoid and vitamin intake, von Hippel‐Lindau gene mutations and sporadic renal cell carcinoma. Cancer Causes Control. 2008;19:125‐134. [DOI] [PubMed] [Google Scholar]
- 24. Subar AF, Thompson FE, Kipnis V, et al. Comparative validation of the Block, Willett, and National Cancer Institute food frequency questionnaires : the Eating at America's Table Study. Am J Epidemiol. 2001;154:1089‐1099. [DOI] [PubMed] [Google Scholar]
- 25. Daniel CR, Schwartz KL, Colt JS, et al. Meat‐cooking mutagens and risk of renal cell carcinoma. Br J Cancer. 2011;105:1096‐1104. [DOI] [PMC free article] [PubMed] [Google Scholar]
- 26. Rizek RL, Pao EM. Dietary intake methodology I. USDA surveys and supporting research. J Nutr. 1990;120(Suppl 11):1525‐1529. [DOI] [PubMed] [Google Scholar]
- 27. United States Department of Agriculture . What We Eat in America: 1994‐1996. Interviewer's manual for the continuing survey of food intage by individuals 1994‐1996 and the diet and health knowledge survey 1994‐1996. Rockville, MD: Westat, Inc.; 1993. [Google Scholar]
- 28. Dixon L, Zimmerman T, Kahle L, Subar A. Adding carotenoids to the NCI Diet History Questionnaire Database. J Food Compos Anal. 2003;16:269‐280. [Google Scholar]
- 29. DiGaetano R, Severynse J, Graubard B, Rao S, Wacholder S. Case control studies after RDD: new sample designs and analytic strategies. Proceedings of the American Statistical Association, Statistics in Epidemiology Section. Am Stat Assoc. 2004;3045‐3049. [Google Scholar]
- 30. SAS Institute Inc . SAS/STAT 9.2 user's guide: Survey data analysis. Cary, NC: SAS Institute Inc.; 2009. [Google Scholar]
- 31. Li Y, Graubard B, DiGaetano R. Weighting methods for population‐based case‐control studies with complex sampling. J Roy Stat Soc: Ser C (Appl Stat) 2010;60:165‐185. [Google Scholar]
- 32. Benjamini Y, Hochberg Y. Controlling the False Discovery Rate ‐ a Practical and Powerful Approach to Multiple Testing. J R Stat Soc Series B Stat Methodol. 1995;57:289‐300. [Google Scholar]
- 33. Bramley PM. Is lycopene beneficial to human health? Phytochemistry. 2000;54:233‐236. [DOI] [PubMed] [Google Scholar]
- 34. Yuan JM, Gago‐Dominguez M, Castelao JE, Hankin JH, Ross RK, Yu MC. Cruciferous vegetables in relation to renal cell carcinoma. Int J Cancer. 1998;77:211‐216. [DOI] [PubMed] [Google Scholar]
- 35. Brock KE, Ke L, Gridley G, et al. Fruit, vegetables, fibre and micronutrients and risk of US renal cell carcinoma. Br J Nutr. 2012;108:1077‐1085. [DOI] [PubMed] [Google Scholar]
- 36. Hu J, Mao Y, White K, Canadian Cancer Registries Epidemiology Research G . Diet and vitamin or mineral supplements and risk of renal cell carcinoma in Canada. Cancer Causes Control. 2003;14:705‐714. [DOI] [PubMed] [Google Scholar]
- 37. Bosetti C, Scotti L, Maso LD, et al. Micronutrients and the risk of renal cell cancer: a case‐control study from Italy. Int J Cancer. 2007;120:892‐896. [DOI] [PubMed] [Google Scholar]
- 38. Mellemgaard A, McLaughlin JK, Overvad K, Olsen JH. Dietary risk factors for renal cell carcinoma in Denmark. Eur J Cancer. 1996;32A:673‐682. [DOI] [PubMed] [Google Scholar]
- 39. Lindblad P, Wolk A, Bergstrom R, Adami HO. Diet and risk of renal cell cancer: a population‐based case‐control study. Cancer Epidemiol Biomarkers Prev. 1997;6:215‐223. [PubMed] [Google Scholar]
- 40. Negri E, Foschi R, Talamini R, et al. Family history of cancer and the risk of renal cell cancer. Cancer Epidemiol Biomarkers Prev. 2006;15:2441‐2444. [DOI] [PubMed] [Google Scholar]
- 41. Wolk A, Lindblad P, Adami HO. Nutrition and renal cell cancer. Cancer Causes Control. 1996;7:5‐18. [DOI] [PubMed] [Google Scholar]