Abstract
Gram-negative bacteria possess a complex cell envelope consisting of a plasma membrane, a peptidoglycan cell wall, and an outer membrane. The envelope is a selective chemical barrier1 that defines cell shape2 and allows the cell to sustain large mechanical loads such as turgor pressure3. It is widely believed that the covalently cross-linked cell wall grants the envelope its mechanical properties4,5. Here, we demonstrate that the stiffness and strength of Escherichia coli cells are largely due to the outer membrane. Compromising the outer membrane, chemically or genetically, greatly increased deformation of the cell envelope in response to stretching, bending, and indentation forces, and induced elevated levels of cell lysis upon mechanical perturbation and L-form proliferation. Both lipopolysaccharides and proteins contributed to outer membrane stiffness. These findings overturn the prevailing dogma that the cell wall is the dominant mechanical element within Gram-negative bacteria, instead demonstrating that the outer membrane can be more stiff than the cell wall and that mechanical loads are often balanced between these structures.
The three essential layers of the Gram-negative cell envelope (Fig. 1a) are chemically and structurally diverse: the plasma membrane is a fluid phospholipid bilayer, the peptidoglycan cell wall is a covalently cross-linked macromolecule, and the outer membrane possesses phospholipids in its inner leaflet and lipopolysaccharides (LPS) in its outer leaflet. A primary role of the envelope is to sustain mechanical forces3, and it is universally assumed that the mechanical integrity of the envelope is conferred by the cell wall4,5. However, the outer membrane’s unique chemistry leads to remarkable physical properties. For example, while proteins freely diffuse in the plasma membrane, the motion of outer-membrane proteins is constrained6–8. In this light, we investigated whether the outer membrane contributed to the mechanics of the cell envelope.
Figure 1. Detergent treatment after plasmolysis causes further contraction of the Gram-negative cell wall.
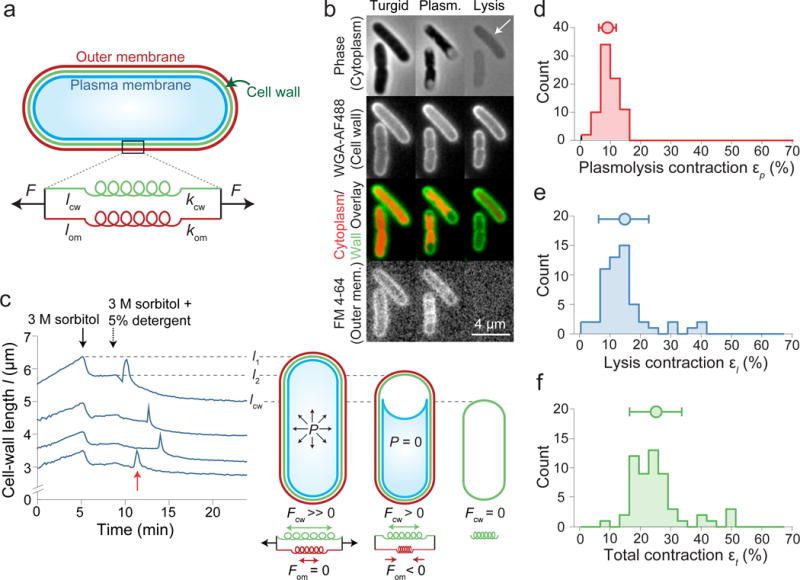
a) Model of the cell wall/outer membrane complex as parallel linear springs with spring constants kcw, kom, and rest lengths lcw, lom.
b) E. coli cells (turgid, plasmolyzed, lysed) stained with WGA-488 and FM 4-64. White arrow: residual phase signal after lysis (n = 84 cells, 3 experiments).
c) Left: cell-wall length versus time during hyperosmotic shock and treatment with detergent for representative cells (n = 79 cells). Red arrow: sharp swelling upon lysis. Right: model of turgid/plasmolyzed/lysed cellular state.
d-f) Histograms of length contraction upon (d) plasmolysis (n = 79 cells), (e) lysis (n = 56 cells), and (f) in total (n = 56 cells). Circle and error bars, mean ± 1 s.d.
To assay the mechanical properties of the E. coli envelope, we first measured its contraction when turgor pressure (≈1 atm3,9) was eliminated by subjecting cells to a large hyperosmotic shock10. This shock induced plasmolysis11 whereby the inner membrane receded from the cell wall (Fig. 1b, Extended Data Video 1), indicating the cell wall/outer membrane complex had contracted to its relaxed state (Extended Data Fig. 1). Plasmolysis caused the length of the cell wall to contract by εp = 9.6 ± 2.9% (εp = (l1-l2)/l2, where l1 is the pre-shock length and l2 is the post-shock length; mean ± s.d.; Fig. 1c,d). To test whether the outer membrane affected this response, we damaged it by exposing plasmolyzed cells to a detergent (5% N-lauroylsarcosine; Fig. 1b, Extended Data Fig. 2a-d, Extended Data Videos 1,2). Cells lysed within minutes after detergent treatment (Fig. 1b, Extended Data Video 1), coinciding with a brief phase of rapid cell-wall expansion (Fig. 1c) likely caused by viscous drag on the cell wall by the cytoplasm as it was released from the cells (SI, Extended Data Fig. 2e,f). Cell-wall length then contracted beyond its post-plasmolysis value by εl = 14.5 ± 8.3% (εl = (l2-lcw)/lcw, where lcw is the cell-wall length after detergent treatment; Fig. 1e, Extended Data Video 1). Thus, while plasmolysis caused the cell wall to contract, compromising the outer membrane caused a second, larger, contraction (p = 10−6, Student’s two-sided t-test) that was not due to changes in cell-wall composition (Extended Data Fig. 2g) or compaction by the detergent (SI, Extended Data Fig. 3a,b). We observed similar behavior in other growth conditions, other E. coli strains, and other Gram-negative species, but not in the Gram-positive bacterium Bacillus subtilis (SI, Extended Data Fig. 3b-f).
Under turgid conditions, the cell wall is under extreme extension: between the turgid state and the fully relaxed state, the cell-wall length contracted by a total of εt = 25.0 ± 8.6% (εt = (l1-lcw)/lcw; n = 56), with increased contraction at higher detergent concentrations (Extended Data Fig. 4a). In addition, total contraction was correlated with the residual phase density of the cell after lysis (Fig. 1b, arrow), which was caused by retention of specific proteins within the sacculus (Extended Data Fig. 4b-h, SI). The least phase-dense cells contracted by as much as 50% (Fig. 1f, Extended Data Fig. 4h). These data suggest that after lysis, residual cytoplasm within the envelope caused an entropic, turgor-like pressure within cells, indicating that our measurement of the contraction upon lysis was actually lower than it would have been if all cytoplasmic contents were lost. By comparison to the cell wall, the relative length extension at which typical materials plastically deform ranges from ≈0.01% to ≈5% for pure elements12, and is ≈10% for agarose gels13.
Our results suggested that the outer membrane was stabilizing the cell wall in a highly stretched state during plasmolysis by bearing compressive stress, thereby balancing tensile stress in the wall (Fig. 1c, right). This model implies that the relaxed size of the outer membrane is larger than that of the cell wall (and larger than the size of the cell envelope after plasmolysis) and that the outer membrane can bear mechanical forces comparable to those borne by the wall. To estimate the rest length of the outer membrane, we plasmolyzed cells and then digested their cell walls with lysozyme, thereby allowing their outer membranes to relax (Fig. 2a). Since cell-wall digestion caused the cells to form spheroplasts (Fig. 2a), we measured the surface area of the outer membrane and calculated the length that it would have had in a rod-like shape, given this surface area. We found that the rest length of the outer membrane was precisely equal to the length of the turgid cell (lom/l1 = 1.0 ± 0.11 for E. coli MG1655, n = 12, Fig. 2b, with similar values for other wild-type strains, Extended Data Fig. 3g), and was therefore larger than the length after plasmolysis. Thus, during steady-state growth, the outer membrane bears little or no load. Using this finding, we solved for the stiffness of the outer membrane by treating the cell wall-outer membrane complex as parallel linear springs:
| (Eq. 1) |
from which it follows that the outer membrane is stiffer than the cell wall, with kom = 1.32kcw.
Figure 2. Cellular mechanical properties depend on the composition and integrity of the outer membrane.
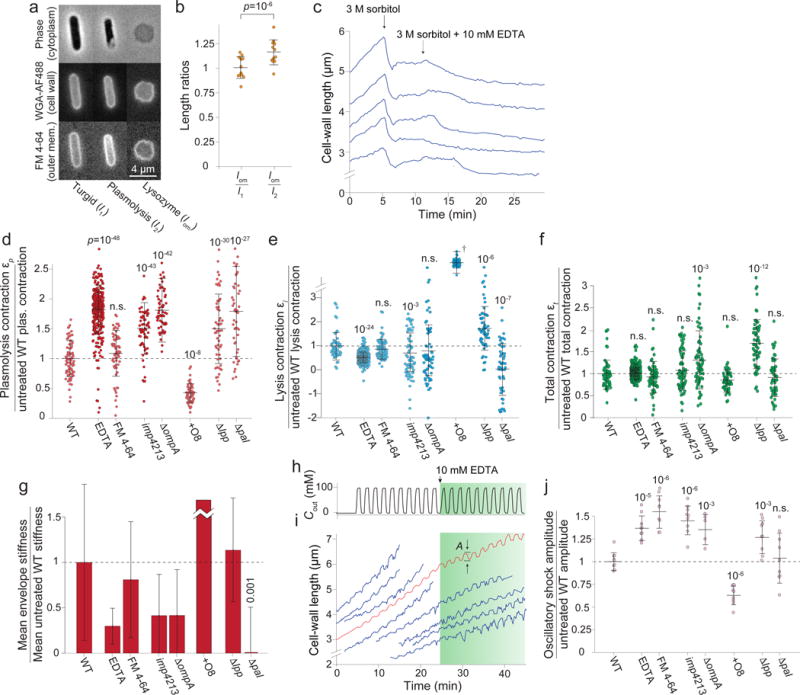
a) E. coli cells (turgid/plasmolyzed/lysozyme) stained as in Fig. 1b (1 experiment, similar results for two other wild-type strains, Extended Data Fig. 3g).
b) Left: mean ratio between the rest length of the outer membrane, lom, and the length of the turgid cell, l1. Right: mean ratio between lom and the length of the cell envelope during plasmolysis, l2 (n = 12 cells). Error bars: ± 1 s.d. p-value, paired two-sided t-test.
c) Length of representative cell walls versus time during hyperosmotic shock and treatment with EDTA (n = 184 cells total).
d-f) Cell wall length contractions upon (d) plasmolysis (e) lysis and (f) in total under chemical and genetic perturbations to outer membrane (ratio with respect to WT, n=79,309,65,70,65,55,59,50 cells). p-values: Student’s two-sided t-test, difference from untreated wild-type control. n.s.: not significant.
g) Outer membrane stiffness under chemical or genetic perturbations (ratio with respect to wild-type). Error bars, ± 1 s.d. Uncertainty propagated from εl and εp measurements.
h) Sorbitol concentration in growth medium during 100-mM oscillatory osmotic shocks with 2-min period.
i) Representative cell-wall lengths during shocks in (h) (blue traces; n = 243 cells). Green shaded period, EDTA included. Red curve, effective population-averaged length.
j) Mean amplitude of cell-wall length oscillations during 100-mM oscillatory shock with a 2-min period (n = 10 cycles for each measurement). Error bars, ± 1 s.d. p-values: Student’s two-sided t-test, difference from untreated wild-type control. n.s.: not significant.
We thus sought to dissect the molecular basis underlying the load-bearing capacity of the outer membrane by altering its composition via chemical and genetic means. Divalent cations mediate ionic bonds between negatively charged moieties within LPS, including charges in the lipid A and the core oligosaccharide domains14. Interestingly, we found that Vibrio cholerae O1, which has one phosphate group within lipid A substituted15, has a relatively compliant outer membrane (Extended Data Fig. 3f). Accordingly, we hypothesized that ionic bonds were important for the outer membrane’s load-bearing capacity and that disrupting these bonds would decrease its stiffness. Treating cells with EDTA, which chelates magnesium, released LPS from the outer membrane (Extended Data Fig. 2d)16,17, and had no direct effect on cell-wall length (Extended Data Fig. 5a-c) or composition (Extended Data Fig. 2g). We therefore predicted that EDTA treatment after plasmolysis would cause a cell-wall contraction similar to detergent treatment. Indeed, the walls of plasmolyzed cells began to contract shortly after EDTA was added (Fig. 2c) and the degree of contraction increased with EDTA concentration (Extended Data Fig. 5d). Adding saturating magnesium blocked this effect (Extended Data Fig. 5e). When we repeated the plasmolysis/lysis experimental sequence (Fig. 1c) including 10 mM EDTA in both the plasmolysis and lysis media, cell walls contracted 1) much more upon plasmolysis (Fig. 2d); 2) much less upon detergent treatment (Fig. 2e); and 3) the same total amount as untreated cells (Fig. 2f), reducing the estimated stiffness of the outer membrane by 70% (Fig. 2g).
While the dye FM 4-64, which intercalates into the outer membrane, did not have a significant effect on outer membrane stiffness (Fig. 2d-g), genetic alterations to the outer membrane had drastic effects. A mutant E. coli strain with the imp4213 allele of lptD, encoding a component of the LPS assembly machinery, has a porous outer membrane rich in phospholipids18,19. Like EDTA-treated cells, imp4213 cells contracted more upon plasmolysis (Fig. 2d) and less upon lysis (Fig. 2e), with no change in total contraction (Fig. 2f), indicating reduced outer-membrane stiffness (Fig. 2g). A mutant lacking the abundant outer-membrane protein OmpA exhibited a similar phenotype (Fig. 2d-g), demonstrating that proteins also contribute to outer membrane mechanics.
The LPS of most Gram-negative bacteria include a polysaccharide component called the O antigen (although many domesticated strains do not). Remarkably, adding the O8 antigen to a domesticated E. coli strain (AB1133) that exhibited no contraction upon lysis (Extended Data Fig. 3h) greatly reduced its contraction upon plasmolysis (Fig. 2d, Extended Data Fig. 3h) and increased its contraction upon lysis (Fig. 2e, Extended Data Fig. 3h), suggesting the antigen greatly stiffens the outer membrane (Fig. 2g). The O8 antigen is an electrically neutral poly-mannose molecule, demonstrating that non-ionic interactions between LPS molecules can also contribute to outer-membrane stiffness.
For the outer membrane to exert force on the cell wall during plasmolysis, there must be mechanical coupling between these structures. Deletion of pal, a gene that encodes a component of the Tol-Pal complex, which bridges the outer membrane and the cell wall, resulted in cell walls that underwent extreme contraction upon plasmolysis (Fig. 2d) and no contraction upon lysis (Fig. 2e), implicating this complex as a mechanical linker. Braun’s lipoprotein (Lpp) is a highly abundant protein that also binds both the cell wall and the outer membrane. Mutant cells lacking lpp contracted more upon both plasmolysis and lysis, yielding a very large total contraction (Fig. 2d-f). Because the estimate for the ratio between the stiffnesses of the cell wall and the outer membrane did not change (Fig. 2g), but the total contraction increased markedly (Fig. 2f), we speculate that deletion of lpp affects the coupling between the cell wall and the outer membrane as well as the stiffness of the cell wall and/or outer membrane directly.
To confirm that our measurements of envelope stiffness were not affected by variation in initial turgor pressure between conditions or strains, we subjected E. coli cells to small oscillatory hyperosmotic shocks (Fig. 2h, Extended Data Video 3), which caused cells and their envelopes to oscillate in size as they grew (Fig. 2i) while causing negligible plasmolysis10. We hypothesized that the amplitude of cell-envelope oscillations should depend on envelope stiffness and should therefore be affected by perturbations to the outer membrane. In the absence of outer-membrane perturbation, cell-wall length oscillated with an amplitude of 2.2 ± 0.2%. Treating cells with EDTA during the oscillations starkly increased their amplitude (Fig. 2i,j, Extended Data Fig. 5f-k), as did FM 4-64 (Fig. 2j). As predicted, mutations that decreased outer-membrane stiffness (imp4213 and ΔompA) increased the oscillation amplitude (Fig. 2j, Extended Data Fig. 5l), while the O8 antigen decreased this amplitude (Fig. 2j). Whereas deletion of lpp increased the oscillation amplitude, deletion of pal did not (Fig. 2j). These data support our model that while Lpp weakens the outer membrane and/or the cell wall as well as their coupling, the Tol-Pal complex is responsible only for mechanical coupling, which is less important during small shocks that do not plasmolyze the cells10.
Each of the measurements above tested the mechanical properties of the outer membrane under compression. E. coli cells do not swell under hypoosmotic shock10, limiting our ability to test whether the outer membrane can bear tensile loads (although a very stiff outer membrane could account for this observation). To determine whether the outer membrane affects the mechanical properties of the cell envelope under other types of load, we used atomic force microscopy (AFM) to directly measure the stiffness of turgid cells, which is dependent on envelope stiffness3. Progressive addition of EDTA or FM 4-64 decreased cell stiffness in a concentration-dependent manner (Fig. 3a,b, Extended Data Fig. 6a,b). Mutations that weakened the outer membrane in osmotic shock-based assays also decreased cell stiffness (Fig. 3c, Extended Data Fig. 6c). However, the O8 antigen did not increase cell stiffness (Fig. 3c), despite the strong phenotype we observed in osmotic shock-based assays (Fig. 2d-g,j). We speculate that because the O8 antigen greatly increases the length of LPS, it results in a thick layer that “pads” the cell against perpendicular indentation forces but can nonetheless bear in-plane loads. Deletion of lpp drastically reduced cell stiffness (Fig. 3c). Deletion of pal rendered the cells extremely sensitive to indentation such that they lysed when addressed with the AFM cantilever, precluding stiffness determination.
Figure 3. The stiffness of turgid cells depends on outer-membrane integrity.
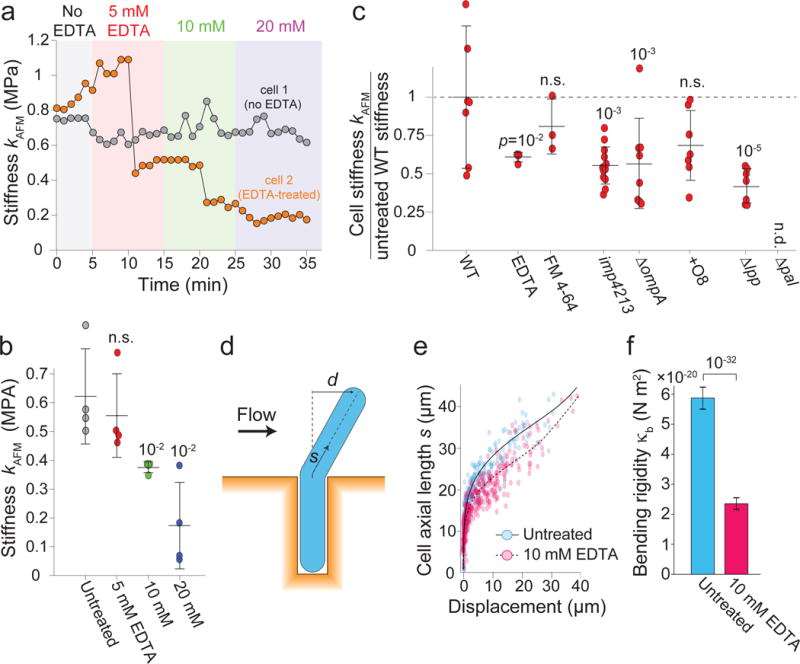
a) AFM measurements of cell stiffness versus time. One cell was treated with increasing EDTA concentrations (similar data for 4 treated, 2 untreated cells).
b) Mean cell stiffness versus EDTA concentration (n = 4 cells for each measurement). Error bars, ± 1 s.d. p-values: Student’s two-sided t-test, difference from untreated wild-type control. n.s.: not significant.
c) AFM measurements of cell stiffness under chemical or genetic perturbations (relative to untreated wild-type, n=7,4,3,13,8,7,7 cells). Δpal cells lysed under AFM. Error bars, ± 1 s.d. p-values: Student’s two-sided t-test, difference from untreated wild-type control. n.s.: not significant.
d) Microfluidic cell-bending assay.
e) Displacement versus axial length for untreated (blue dots, n = 300) and EDTA-treated (pink dots, n = 367) cells. Solid and dashed black lines, best fits of mechanical model used to calculate the bending rigidities.
f) Mean bending rigidities of untreated and EDTA-treated cells. Error bars, 95% confidence. p-value calculated from confidence intervals.
Next, we used a microfluidics-based assay20,21 to measure the deformation of wild-type cells in response to bending forces before and after treatment with 10 mM EDTA. A perpendicular fluid force was applied to filamentous cells (Fig. 3d), and the bending rigidity was calculated by fitting the deflection of the cell (Fig. 3e) to a mechanical model21. Untreated cells deflected less than did EDTA-treated cells, yielding bending rigidities of 5.8 × 10⁻²⁰ ± 0.4 N m2 and 2.4 ×10⁻²⁰ ± 0.2 N m2, respectively (Fig. 3f), again demonstrating the contribution of LPS to outer-membrane stiffness to various types of load.
Given the profound contribution of the outer membrane to the mechanical properties of the cell envelope, we next explored their contribution to cell physiology. Wild-type E. coli cells gradually lysed during moderately large (400 mM) oscillatory osmotic shocks (Fig. 4a, Extended Data Video 4). The chemical perturbations N-lauroylsarcosine, EDTA, and FM 4-64 drastically decreased cell survival in the presence of shocks (Fig. 4a,b, Extended Data Fig. 7a, Extended Data Video 4). In the absence of shocks, EDTA and FM 4-64 caused little and no lysis, respectively (Fig. 4a), demonstrating that outer-membrane strength is important for cell survival during mechanical perturbations but not during steady-state growth. Genetic mutations that weakened the outer membrane or disrupted coupling between the outer membrane and the cell wall also drastically decreased cell survival during shocks (Fig. 4b, Extended Data Fig. 7b,d), whereas the presence of the O8 antigen delayed the onset of lysis (Fig. 4b, Extended Data Fig. 7c).
Figure 4. Undermining outer-membrane integrity reduces survival during mechanical perturbation and L-form proliferation.
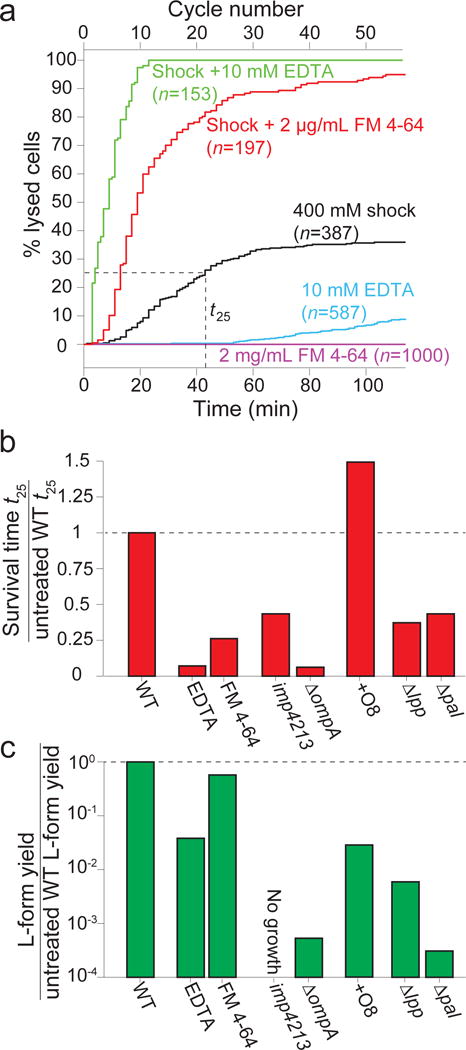
a) Cell lysis versus time under chemical perturbation to outer membrane. Shock: 400-mM oscillations with 2-min period. No cells died in the absence of both oscillatory shock and outer membrane perturbation (n=1000 cells). t25, time at which 25% of cells had lysed.
b) Time at which 25% of cells had lysed under chemical or genetic perturbations (ratio to untreated wild-type).
c) Concentration of viable L-forms in overnight cultures under chemical or genetic perturbations to outer membrane (ratio to untreated wild-type, 1 experiment).
Finally, we hypothesized that the strength of the outer membrane would affect the survival of L-forms, viable wall-less cells that are produced by inhibiting cell-wall biosynthesis22. All chemical and genetic perturbations that reduced outer-membrane stiffness also drastically reduced the number of viable L-forms generated after inhibiting wall synthesis (Fig. 4c, Extended Data Fig. 7e). During L-form generation in imp4213 cells, which yielded no viable L-forms (Fig. 4c), cells always lysed as soon as the cytoplasm blebbed out of the cell wall, which is precisely when turgor pressure is shifted entirely to the outer membrane (Extended Data Video 5), consistent with previous measurements showing that outer membrane integrity affect the dynamics of blebbing and lysis during antibiotic treatment23. In sum, the mechanical properties of the outer membrane are critical for cell survival during osmotic fluctuation and L-form proliferation.
Our conclusions revise our understanding of the physiology of both the cell wall and the outer membrane: whereas the former determines cell shape and the latter provides a selective chemical barrier, both are important mechanical elements in Gram-negative bacteria. Our finding that the outer membrane is under negligible or slightly compressive load during steady-state growth (Fig. 2b, Extended Data Fig. 3g) may provide a mechanism for the formation of outer-membrane vesicles, which could bud spontaneously under this circumstance. However, steady-state growth is unlikely to be common for E. coli: in the gut, bacteria frequently encounter osmotic fluctuations and dynamic mechanical forces, which will constantly engage the load-bearing nature of the outer membrane. Cell-wall biosynthesis has long been an antibiotic target because of the wall’s role in protecting the cell from osmotic lysis, and L-forms have been implicated in antibiotic persistence24. Hence, our finding that the outer membrane shares mechanical load with the cell wall, and is therefore critical for L-form proliferation, has clear consequences for anti-bacterial therapy. Further research should elucidate the interdependence between the outer membrane’s chemical and mechanical roles. In particular, it is intriguing that LPS, which is a potent antigen that stimulates the mammalian immune system, thereby endangering pathogenic bacteria, also provides mechanical integrity to bacteria and therefore protects them.
Methods
Bacterial strains and culture
Bacterial strains used in this study are listed in Table S1. Three wild-type E. coli genetic backgrounds were used: MG1655, MC4100, and AB1133. We tested the effect of the imp4213 allele in the MG1655 and MC4100 backgrounds. The ompA, pal, and lpp deletions were tested in the MC4100 background. The O8 antigen was expressed in the AB1133 background (ATM378)25. Strain KC427 (MG1655 imp4213 carB::Tn10) was constructed using P1 transduction to transfer the imp4213 mutation from MC4100 to MG1655 cells using NR693 lysate18. Bacteria (including non-E. coli species) were grown in lysogeny broth (LB), Lennox formulation (5 g/L NaCl), or minimal medium M9 + 20 mM glucose, overnight in a rotary shaker at 37 °C.
Statistical significance
Under the hypothesis that the outer membrane can bear large mechanical loads, we expected that chemical or genetic perturbations to the outer membrane would result in large changes in the deformation of the cell envelope under a given load. We therefore conservatively calculated the number of cells required to distinguish such a change using a two-sided Student’s t-test to be n ≈ 44 to obtain a power of β = 0.9 with statistical significance p = 0.05 and effect size with Cohen’s d = 0.5.
Imaging in microfluidic devices
Cells were imaged on a Nikon Eclipse Ti-E inverted fluorescence microscope with a 100X (NA 1.40) oil-immersion objective. Images were collected on a DU885 electron-multiplying charge-coupled device camera (Andor) using μManager v. 1.426. Cells were maintained at 37 °C during imaging with an active-control environmental chamber (HaisonTech).
Overnight cultures were diluted 100-fold into 1 mL of fresh LB and incubated for 2 h with shaking at 37 °C, excepting experiments in minimal medium, for which overnight cultures were diluted into M9 + 20 mM glucose and incubated for 8 h. Cells were imaged in B04A microfluidic perfusion plates (CellASIC Corp.) and medium was exchanged using the ONIX microfluidic platform (CellASIC Corp.). Plates were loaded with medium pre-warmed to 37 °C. Cells were loaded into the plate, which was incubated at 37 °C, without shaking, for 30 min before imaging. The cell envelope was stained with wheat germ agglutinin-AlexaFluor488 (WGA-AF488, Life Technologies), the fluorescent D-amino acid HADA (gift from the Brun and Vannieuwenzhe Labs, University of Indiana), and/or FM 4-64 (ThermoFisher). For staining of the cell wall, WGA-AF488 or HADA was added to the loading well to a final concentration of 10 μg/mL or 1 mM, respectively, prior to loading cells into the imaging chamber. For staining of the outer membrane, FM 4-64 was added to the loading and perfusion medium to a final concentration of 2 μg/mL and medium containing FM 4-64 was perfused for 3 h prior to imaging in order to saturate the polydimethylsiloxane of the microfluidic chamber with the dye. The osmolarity of the growth medium or phosphate-buffered saline (PBS) was modulated with sorbitol (Sigma).
For plasmolysis/lysis and oscillatory osmotic shock experiments to measure the effect of chemical perturbations (EDTA and FM 4-64 labeling) on cell stiffness, MG1655-based strains were stained with WGA-AF488; non-MG1655 strains stained poorly with WGA-AF488 (data not shown). For plasmolysis/lysis experiments, E. coli MC4100- and AB1133-based strains, P. aeruginosa, and V. cholerae were stained with HADA. For oscillatory osmotic shocks of non-MG1655 strains, HADA photobleached too quickly for tracking over many frames (data not shown); hence, we stained and tracked cell envelopes with FM 4-64. Since FM 4-64 itself increased the amplitude of oscillations in MG1655 cells (Fig. 2j), ratios between the amplitudes of each FM 4-64-stained mutant and the FM 4-64-stained wild-type parental strain were reported (Fig. 2j).
During plasmolysis/lysis experiments, cells were allowed to grow for 5 min in medium in the imaging chamber before being plasmolyzed with medium + 3 M sorbitol and exposed to medium + 3 M sorbitol + 5% N-lauroylsarcosine 5 min later. For plasmolysis/lysis in PBS, cells were loaded into the imaging chamber in LB, which was exchanged for PBS + 70 mM sorbitol (to balance the osmolarity of PBS with LB) for 10 min, followed by exchange with PBS + 3 M sorbitol for 5 min, which was finally exchanged with PBS + 3 M sorbitol + 5% N-lauroylsarcosine. For plasmolysis/lysis in the presence of EDTA, 10 mM EDTA was included in the plasmolysis and lysis media.
To measure the rest length of the outer membrane, we plasmolyzed cells stained with WGA-AF488 and FM 4-64, as described above. We then exchanged the plasmolysis medium with the same medium containing 1 mg/mL lysozyme (ThermoFisher). After ≈15 min, cells began to lose their rod-like shape and lyse. Upon lysis, when released from the constraint of the cell wall, the outer membrane of many cells collapsed into many small vesicles. However, the outer membranes of many other cells maintained their topology and their size could be measured (see below).
When EDTA was applied to cells after plasmolysis (Fig. 2c), for reasons we do not understand, a larger fraction of cells quickly recovered from plasmolysis and swelled. Pre-treatment with FM 4-64 resulted in a similar de-plasmolysis (data not shown), indicating that chemical perturbation of outer membrane integrity is somehow responsible. Cells that de-plasmolyzed were not included in population-averaged contraction measurements (Fig. 2d-f).
For oscillatory osmotic shocks, cells were allowed to grow for 5 min in medium in the imaging chamber before being subjected to 100-mM oscillatory osmotic shocks by switching between LB and LB + 100 mM sorbitol. When adding EDTA during oscillatory shocks, two types of experiments were performed. For illustrative purposes, in one experiment cells were left untreated for 10 cycles, and then treated with EDTA for 10 cycles (Fig. 2h,i). In a complementary set of experiments, EDTA was added during the first 10 cycles (but not before); this experiment was used to calculate the amplitude ratio for EDTA treatment (Fig. 2j).
To measure lysis curves (Fig. 4a, Extended Data Fig. 7a-c), cells were loaded into the microfluidic chip as described above, and imaged in LB for 5 min prior to beginning chemical perturbation and/or oscillatory osmotic shock. A cell was considered to have lysed when it lost phase contrast and, in the case of oscillatory shocks, cell size ceased to oscillate. In the absence of shocks, most strains tested showed no lysis after 2 h of growth in the microfluidic chamber; ΔpalA and MG1655 imp4213 cells showed a small degree of lysis (2.0% and 3.5%, respectively) after 2 h of steady-state growth in LB.
Cell-growth tracking and analysis
Custom MATLAB software was written to automatically track cells stained with WGA-AF488 or FM 4-64, as in previous studies10. In plasmolysis/lysis experiments in which cells were stained with HADA, the signal-to-noise ratio was not high enough to track cell-wall contours automatically, so cell lengths (immediately before plasmolysis, immediately after plasmolysis, and 20 min after detergent treatment) were measured manually in FIJI.
To calculate outer-membrane rest lengths, we used a custom MATLAB algorithm to manually trace cell-envelope contours before plasmoslysis, after plasmolysis, and after lysozyme-induced lysis. In the first two states, cell length and width were automatically calculated. After lysozyme treatment, we calculated the length of the outer membrane as if it were rod-shaped with a width equal to the width of the cell before plasmolysis, as follows. We first calculated the surface area of the turgid cell envelope, Aturgid, from its contour by assuming rotational symmetry around its long axis. After lysis, the outer membrane adopted an amorphous morphology, while remaining trapped in the microfluidic chamber with height equal to the width of the cell before lysis, w. Therefore, for each cell we calculated the “rest surface area” of the outer membrane, Aom, by first measuring the arc length of the cell contour, s, and the area enclosed within this contour, a, and then applied the equation Aom = 2a+ws. Finally, to calculate the rest length of the outer membrane, lom, defined as the length of the outer membrane if it had surface area equal to Aom and was rod-shaped with cell width equal to w, we used the equation lom = lturgid + (Aturgid-Aom)/(πw). This equation indicates that the difference between the rest length of the outer membrane and the length of the turgid cell is equal to the length of a cylindrical section with area (Aturgid-Aom) and radius w/2.
To calculate the amplitude of length oscillations during oscillatory osmotic shocks, cells were tracked using custom MATLAB algorithms. First, cell-wall lengths (l) were automatically tracked (Extended Data Fig. 5f,g), and the elongation rate (ė = d(ln l)/dt) was calculated for each cell (Extended Data Fig. 5h). The effective population-averaged length was calculated by integrating the population-averaged elongation rate over time10 (Extended Data Fig. 5i):
where is the mean initial cell length. The effective population-averaged length was then smoothed with a mean filter with window size equal to the period of oscillation (Extended Data Fig. 5i), and subtracted from the unsmoothed trace to obtain the deviation of the length oscillations around the smoothed trace (Extended Data Fig. 5j). The peak-to-peak amplitude was calculated for each cycle (Extended Data Fig. 5k). The mean amplitude was calculated by averaging the peak-to-peak amplitude over cycles. Uncertainty was estimated as the standard deviation of the mean amplitude over cycles.
The time scale of the loss of cytoplasmic contents (cytoplasmic GFP or ribosomal S2-YFP) and the time scale for cell wall expansion during lysis were calculated using custom MATAB algorithms. The integrated fluorescence intensity in each cell was computed over time during plasmolysis/lysis experiments. The duration of efflux (or the time scale of expansion during lysis) was measured manually by selecting time points immediately before and after efflux (or lysis).
Outer membrane release assay
An overnight E. coli MG1655 culture was diluted 100-fold into 100 mL fresh LB and incubated with shaking at 37 °C for 2 h. The culture was aliquoted into 10 15-mL tubes and centrifuged (Eppendorf 5084 R) at 5000 rpm for 10 min to pellet cells. The supernatant was decanted and each pellet was resuspended in 1 mL PBS and transferred to 10 1.5-mL tubes. The suspensions were centrifuged (Eppendorf 5415 D) at 13,000 rpm to pellet cells. The supernatant was removed and each pellet was resuspended in 100 μL PBS. To these suspensions, 100 μL of detergent or EDTA were added to the specified final concentrations and incubated at room temperature for 10 min. Cells and sacculi were pelleted by centrifuging (Beckman Coulter Optima Max-XP, Rotor TL-100) at 100,000 rpm for 10 min at 4 °C. The supernatant was removed for analysis. LPS was detected in serial dilutions of the supernatant using the Pierce Limulus Amebocyte Lysate (LAL) assay (ThermoFisher). After performing this reaction, absorbance at 410 nm was measured using an M200 96-well plate reader (Tecan). We found that detergent above 0.05% interfered with the LAL reaction (data not shown) and therefore we diluted supernatants from the detergent-treated samples 1000-fold into 0.05% detergent before measuring LPS.
Outer-membrane proteins in the supernatant were detected with immunoblotting using an anti-OMP antiserum generously provided by the Thomas Silhavy Lab at Princeton University. Supernatant was added to 1X NuPAGE LDS sample buffer (Invitrogen). Proteins were separated by electrophoresis on a 4-12% Bis-Tris gel (Invitrogen) and transferred to a nitrocellulose membrane. After blocking, membranes were probed with 1:30,000 anti-OMP antiserum and 1:10,000 donkey anti-rabbit 800CW (LiCor Biosciences). Fluorescence antibody-bound proteins were detected with an Odyssey Imager (LiCor Biosciences).
Analysis of peptidoglycan composition
Ultra-high pressure liquid chromatography (UPLC) samples were prepared as described previously27. Overnight cultures of E. coli MG1655 were diluted 1:200 in 250 mL LB and grown at 37 °C to an OD600 nm of 0.7. Cultures were centrifuged at 5,000 × g for 10 min at room temperature and the resulting pellet was suspended in 3 mL of either LB, LB + 3M Sorbitol, LB + 3M sorbitol + 10 mM EDTA, or LB + 3M sorbitol + 5% N-lauroyl sarcosine. All samples that contained 3M sorbitol in the resuspension solution were allowed to sit at room temperature for 20 min after resuspension. Cell suspensions were then lysed by boiling in SDS for 3 h. Lysed cell suspensions were ultracentrifuged at 400,000 × g to purify sacculi, which were digested with muramidase into muropeptides. Samples were pH-adjusted and injected onto a Waters H Class UPLC system equipped with a BEH C18 1.7-μm column and eluted with sodium phosphate buffers. Peaks were quantified and identified as particular muropeptide species from their elution times28, from which the crosslinking density and glycan strand length were calculated as previously described29.
Derivation of a mechanical model of the cell envelope
Cell-wall length contractions upon plasmolysis (εp), upon lysis (εl), and total contraction (εt) were defined as: εp = (l1-l2)/l2 × 100, εl = (l2-lcw)/lcw × 100, and εt = (l1-lcw)/lcw × 100, respectively, where l1 is the length before plasmolysis, l2 is the length after plasmolysis, and lcw is the length after lysis. We modeled the cell wall/outer membrane complex as two linear springs in parallel with spring constants kcw and kom, respectively, and rest lengths lcw and lom, respectively (Fig. 1a). Although the mechanical properties of the cell envelope have been measured to be non-linear by atomic force microscopy3, envelope contraction upon hyperosmotic shock was approximately linear with respect to shock magnitude up to the maximum contraction caused by large shocks (Extended Data Fig. 1), motivating our use of a linear spring-based model for estimating outer-membrane stiffness. Initially, the springs are subjected to an applied force, F, representing turgor pressure, and have initial length l1. When the force is released (when the cell is plasmolyzed), the springs relax to length l2. The force balance equation is:
| (Eq. 2) |
We substitute for l2 using the definition of εl, which yields:
| (Eq. 3) |
Using the experimental finding that lom = l1= lcw(1+ εt) (Fig. 2b, Extended Data Fig. 3g), and substituting the identity εt = (1 + εp)(1 + εl) - 1 yields lom = lcw(1 + εp)(1 + εl). Finally, substituting this expression into Eq. 3 yields Eq. 1 of the main text.
AFM measurements of cell stiffness
The day before AFM, poly-L-lysine-coated glass slides were prepared by boiling 22-mm square cover glasses in 2% Micro-90 detergent. Cover glasses were rinsed in ethanol and baked in a dry oven at 80 °C for ≥ 1 h. Cover glasses were glued onto microscope slides using super glue.
On the day of measurement, 10 μL of 0.01% poly-L-lysine were spotted onto the center of the cover glass and dried for 1 h. A silicone well (Grace Biolabs) was affixed to the cover glass around the poly-L-lysine spot. An overnight culture of E. coli was diluted 100-fold into LB and incubated at 37 °C for 1.5 h. One milliliter of culture was spun down in a table-top microcentrifuge for 1 min at 13,000 rpm and resuspended in 1 mL de-ionized water. This suspension was then spun down and concentrated in 100 μL de-ionized water. This suspension was added to the well on the poly-L-lysine-coated slide. The slide was incubated at room temperature for 15 min. The well was rinsed with de-ionized water three times to remove cells that were not stuck to the surface. The well was then immersed in 100 μL M9 + 20 mM glucose.
AFM experiments were performed on a Bioscope Resolve (Bruker) with MLCT-BIO-E (Bruker) cantilevers with a nominal spring constant of 0.1 N/m (for EDTA experiments) or PFQNM-LC (Bruker) cantilevers (0.08 N/m). Cantilevers were calibrated using the thermal noise method30. We measured the deflection sensitivity (nm/V) from the slope of a force curve recorded on a glass surface. The resonance frequency and q-factor of the cantilever were determined by a Lorentzian fit of the power spectral density of the cantilever recorded using the thermal tune option in the Nanoscope Analysis v. 1.8 (Bruker) software. From these parameters, the spring constant was calculated.
A polydimethylsiloxane calibration sample with known stiffness of 3.5 MPa was measured using force volume imaging mode in an area of 1 × 1 μm at a resolution of 32 × 32 pixels at 0.5-Hz ramp rate and 600-nm ramp size (Extended Data Fig. 6d). Force curves were recorded to a maximal deflection error of 5 nm, and analysis of the force curves was accomplished with Nanoscope Analysis v. 1.8. For analysis of the polydimethylsiloxane stiffness measured with PFQNM-LC cantilevers, the baseline correction of the force curve was performed using 10-80% of the ramp size, with tip radius set to 65 nm, the tip half angle to 18°, and Poisson’s ratio of 0.3. The approach direction of the force curve was used to analyze the stiffness, assuming a Hertz contact model as a modulus fit model for the interaction of a sphere with a surface, resulting in a mean stiffness of 3.41 ± 0.73 MPa (Extended Data Fig. 6d). These parameters were then used to analyze force curves recorded on immobilized E. coli with a PFQNM-LC cantilever. For measurements with MLCT-BIO-E cantilevers, the tip radius was set to 20 nm.
For each cell measured, an image of the immobilized cell was recorded to confirm firm attachment and to position the cantilever at the center of the cell before recording force curves. Three consecutive force curves with z-range of 800 nm were recorded at a rate of 0.5 Hz to a maximum deflection of 5 nm. Force curves were further analyzed using NanoScope Analysis v. 1.8. For each cell, the mean stiffness was calculated from the three force curves. In all cases, individual slides or dishes were measured for no more than 1 h.
To compare our reported cell stiffness values (akin to Young’s modulus of the cell as if it was a single bulk material, previously shown to be dependent on envelope stiffness3) to previous measurements3, we used the PDMS calibration to compute the relationship between stiffness values in MPa and in N/m using the Nanoscope analysis software. The cell stiffness value of 0.017 N/m reported in Ref. 3 converts to a Young’s modulus value of 0.5 MPa for our experimental methodology, which compares very favorably with our data in Fig. 3b.
For measuring the effect of FM 4-64 on cell stiffness, single force curves were taken every minute. After several minutes, a concentrated solution (4 μg/mL) of FM 4-64 was added to a final concentration of 2 μg/mL.
For measuring the effect of EDTA on cell stiffness, instead of supported cover-glass slides, we adhered cells to glass-bottom dishes (Ted Pella, 14026) that had been spotted with poly-L-lysine as described above. After cells adhered, dishes were immersed in 4 mL M9 + glucose medium. For each cell, single force curves were recorded at 1-min intervals. After 5-10 min, the EDTA concentration was increased stepwise every 10 min to final concentrations of 5 mM, 10 mM, and 20 mM by adding 1 mL of appropriately concentrated stock EDTA solution.
Microfluidic assay of bending stiffness
The bending rigidity of E. coli cells was measured using a microfluidic assay similar to that used in Refs. 20,21. E. coli MG1655 was transformed with a plasmid (pDB192) containing sulA under an isopropyl β-D-1-thiogalactopyranoside (IPTG)-inducible promoter. Cells were grown overnight in 2 mL LB containing 30 μg/mL kanamycin and 50 μg/mL ampicillin. IPTG was added to the medium to induce sulA throughout cell growth in the microfluidic flow chamber. Deflection of cells under fluid flow was monitored on a Zeiss Axiovert 100 microscope (Zeiss) equipped with a 60X oil objective. Images were collected with an Andor iXon 3 EMCCD (Andor) using μManager v. 1.426. Deflection of the cells was determined using a custom Igor Pro (WaveMetrics Inc.) image-analysis algorithm.
Quantification of L-form viability, physiology, and growth
Overnight cultures of the appropriate strains were diluted 1:100 into LFLB (LB supplemented with 3.6% sucrose and 10 mM MgSO4). Cultures were incubated at 37 °C for 1 h, at which point cefsulodin was added to a final concentration of 60 μg/mL. As appropriate, chemical treatments (EDTA and FM 4-64) were also added at this point. Cells were incubated for 12 h with shaking at 30 °C. Five microliters of serial ten-fold dilutions were plated on LFLB + cefsulodin and LB + cefsulodin plates. Plates were incubated at 30 °C for 24 h. Plates were imaged with a Canon EOS Rebel T5i DSLR camera and colony-forming units per mL were counted manually. MC4100-based L-forms formed smaller colonies that were not visible with the DSLR camera, and thus spots from the plates were excised and imaged with an inverted microscope (Nikon Eclipse Ti-E) at 10X magnification. For each L-form culture except AB1133, spotting onto LB + cefsulodin plates reduced yield by at least an order of magnitude relative to LFLB + cefsulodin (data not shown).
L-forms produce LPS at levels approximately equal to untreated cells (6.6 × 10⁻⁶ vs. 7.2 × 10⁻⁶ Endotoxin Units/cell for untreated cells and L-forms, respectively). To measure this, 1 mL of overnight culture was washed twice in PBS. N-lauroyl sarcosine was added to a final concentration of 5%, and cell suspensions were incubated at 90 °C for 10 min to lyse cells and dissolve their membranes. LPS was detected in 10-fold serial dilutions of this solution using the Pierce Limulus Amebocyte Lysate assay (ThermoFisher).
To image L-form generation from imp4213 cells, a 5-mL culture was grown overnight in LB at 30 °C. The overnight culture was diluted 100-fold into LB and incubated at 30 °C for 2 h. Five microliters of this culture were spotted onto an LFLB + cefsulodin agarose pad and imaged every minute at 30 °C.
Data Availability
The datasets generated during the current study are available from the corresponding author on reasonable request.
Code Availability
All custom code used for the current study is available from the corresponding author on reasonable request.
Extended Data
Extended Data Figure 1. Cell-wall deformation is approximately linear with respect to hyperosmotic shock over a large range.
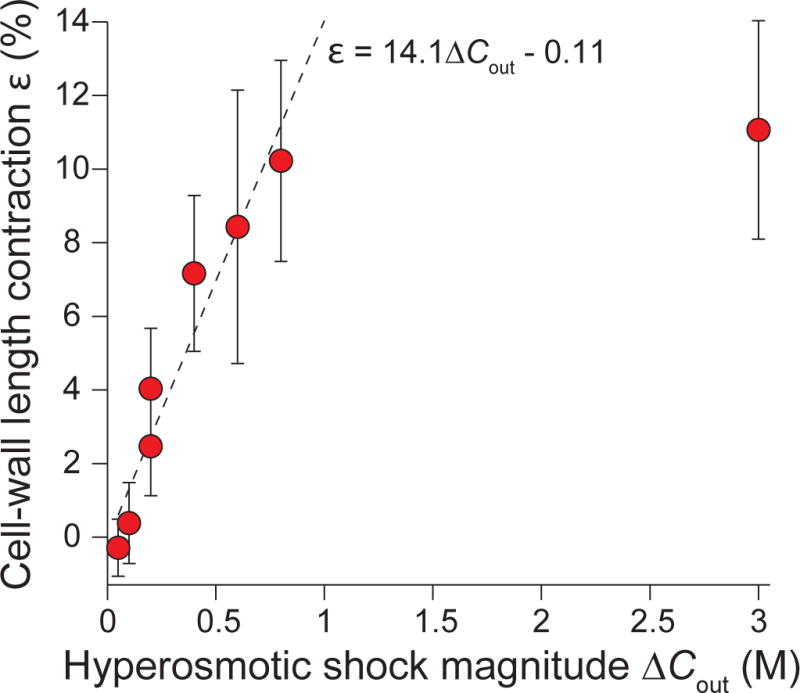
Population-averaged contraction of cell wall lengths versus hyperosmotic shock magnitude (n = 92, 73, 53, 71, 58, 11, 31, 47 cells). Error bars indicate ±1 s.d. The dotted line is the linear best fit for experimental data for shocks with magnitude ≤ 800 mM. The plateau after 800 mM demonstrates that the cell envelope has reached its minimum length upon large, 3 M hyperosmotic shocks.
Extended Data Figure 2. Detergent or EDTA treatment causes dissolution of the outer membrane.
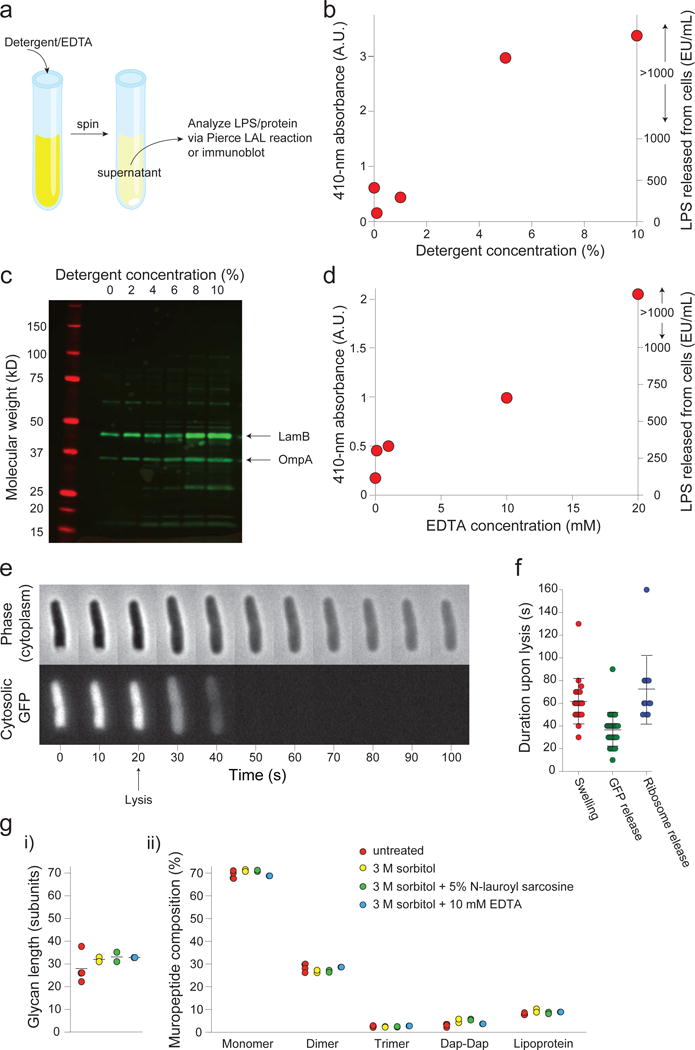
a) Description of the outer-membrane release assay used to measure the effect of detergent and EDTA on the outer membrane. See Online Methods for a more detailed description.
b) Absorbance of 410 nm light (left axis) in the supernatant from detergent-treated cell suspensions after performing the LAL LPS detection assay (Methods). Absorbance is correlated with the amount of LPS in the sample, and is linear below 1000 EU/mL (right axis). This experiment was performed once.
c) Immunoblot with an antibody cross-reactive with several outer-membrane proteins (e.g. LamB and OmpA) of the supernatant of cells treated with various concentrations of N-lauroyl sarcosine (detergent). This experiment was performed once.
d) Absorbance of 410 nm light (left axis) in the supernatant from EDTA-treated cell suspensions after performing the LAL LPS detection assay. Absorbance is correlated with the amount of LPS in the sample, and is linear below 1000 EU/mL (right axis). This experiment was performed once.
e) Montage of a representative plasmolyzed cell expressing cytosolic GFP lysing upon detergent treatment. Cell expansion corresponds to the time of GFP disappearance (n = 32 cells, 1 experiment). Error bars, ±1 s.d.
f) Duration of swelling (left), of release of cytosolic GFP (center), and of release of ribosomes upon lysis of plasmolyzed cells (n = 22, 32, 12 cells, respectively. 1 experiment each). Error bars, ±1 s.d. The duration of swelling is approximately equal to the duration of the release of cytoplasmic contents.
g) Ultra performance liquid chromatography of peptidoglycan composition of cell walls purified from untreated (red), sorbitol-treated (yellow), detergent-treated (green), and EDTA-treated (blue) cells. Mean glycan strain lengths (i) and percentage of various peptidoglycan subunit eluents (ii) are the same across all treatments. Dap-Dap: Dimers formed with double diaminopimelic acid bonds as opposed to diaminopimelic acid/D-alanine bonds; lipoprotein: subunits bound to Lpp. n = 4, 2, 2, 1 sacculi preparations for untreated, sorbitol-treated, detergent-treated, and EDTA-treated cells, respectively.
Extended Data Figure 3. Detergent treatment causes contraction of the cell wall across a range of conditions and organisms.
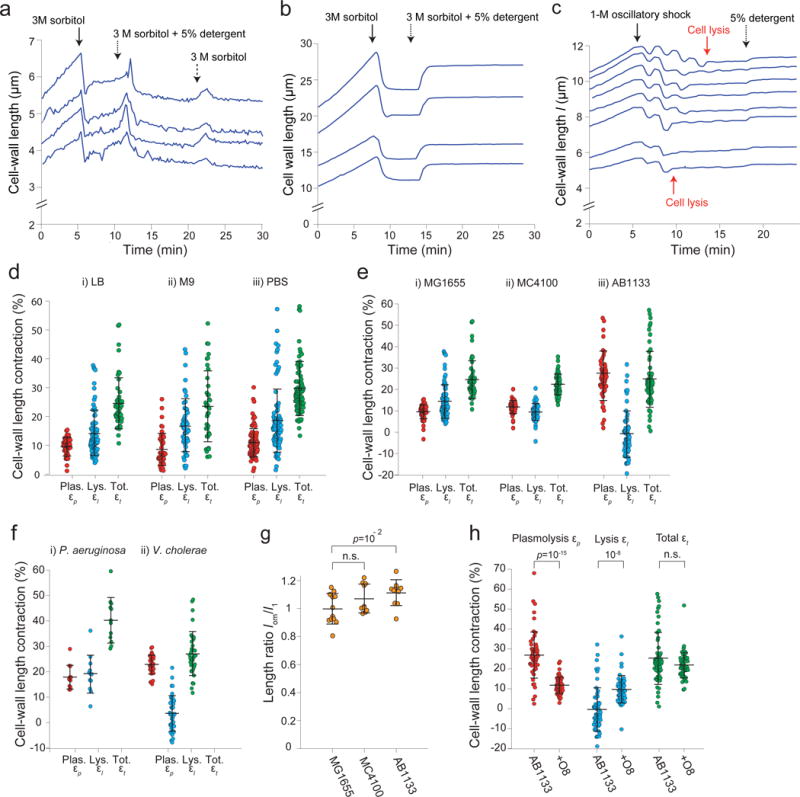
a) Length of the cell wall versus time during hyperosmotic shock (3 M sorbitol, solid arrow) and subsequent treatment with detergent (5% N-lauroyl sarcosine, dotted arrow), and washout of the detergent (switching back to 3 M sorbitol, dashed arrow) for four representative cells (n = 260 cells). The cells briefly swelled upon washout, then relaxed to the pre-washout rest length. We speculate that the brief swelling is caused by a hypoosmotic shock during washout (lowering the concentration of detergent). That is, we propose that the detergent has a slow diffusion constant through the cell wall, and therefore washing it out imposes a transient hypoosmotic shock, before detergent within the cell diffuses out of it. When it does, the cell wall relaxes again to its rest state, demonstrating that cell-wall contraction upon detergent treatment is not due to compaction by the detergent.
b) Lengths of the cell wall versus time during hyperosmotic shock (3 M sorbitol, solid arrow) and subsequent addition of detergent (5% N-lauroyl sarcosine, dotted arrow) for four representative B. subtilis cell chains (n = 112 cell chains). Rather than contract upon detergent treatment, the cell walls re-extend. We hypothesize that the cell wall is in a highly compressed state after 3-M hyperosmotic shock because the cytoplasm is exerting an inward force via connections between the plasma membrane and cell wall. When the plasma membrane is dissolved with detergent, this force is relieved and the cell wall extends to its rest length.
c) Lengths of the cell wall of B. subtilis cell chains versus time during a 1-M oscillatory osmotic shock, which caused cell lysis (e.g., red arrows), followed by treatment with detergent (5% N-lauroyl sarcosine, dotted arrow; n = 93 cell chains). The cell walls expanded only slightly upon detergent addition, indicating that it is lysis rather than detergent treatment that causes the re-extension in (b).
d) Contraction upon plasmolysis, subsequent lysis, and total contraction for three environmental conditions: i) LB (n = 79, 56, 56 cells, respectively), ii) M9 (n = 46, 52, 38 cells, respectively), and iii) cultured in LB and transferred to PBS before plasmolysis (n = 95, 86, 94 cells, respectively). Error bars indicate ±1 s.d.
e) Contraction upon plasmolysis, subsequent lysis, and total contraction for three wild-type E. coli strains: i) MG1655 (n = 79, 56, 56 cells, respectively), ii) MC4100 (n = 48, 48, 48, respectively), and iii) AB1133 (n = 56, 56, 56 cells, respectively). Error bars indicate ±1 s.d.
f) Contraction upon plasmolysis, subsequent lysis, and total contraction for i) Pseudomonas aeruginosa (n = 12, 12, 12 cells, respectively), and ii) Vibrio cholerae (n = 36, 36, 36 cells, respectively). Error bars indicate ±1 s.d.
g) The mean ratio between the rest length of the outer membrane, lom, and the length of the cell envelope in the fully turgid state, l1, for three wild-type E. coli strains (n = 12, 10, 10 cells for MG155, MC4100, and AB1133, respectively). The rest length of the outer membrane is approximately equal to length of the fully turgid cell for all three strains. Error bars indicate ±1 s.d. The p-value was calculated using a Student’s two-sided t-test.
h) Mean contraction upon plasmolysis, subsequent lysis, and total contraction for wild-type AB1133 (n = 56 cells) and an isogenic strain expressing the O8-antigen (n = 55 cels). The ratio for cells expressing the O8 antigen is very large because the contraction upon lysis for the parental wild-type strain (AB1133) was close to zero, and adding the antigen markedly increased contraction. Error bars indicate ±1 s.d. p-values were calculated using a Student’s two-sided t-test.
Extended Data Figure 4. Impermeable molecules within the cell wall after lysis cause residual turgor pressure.
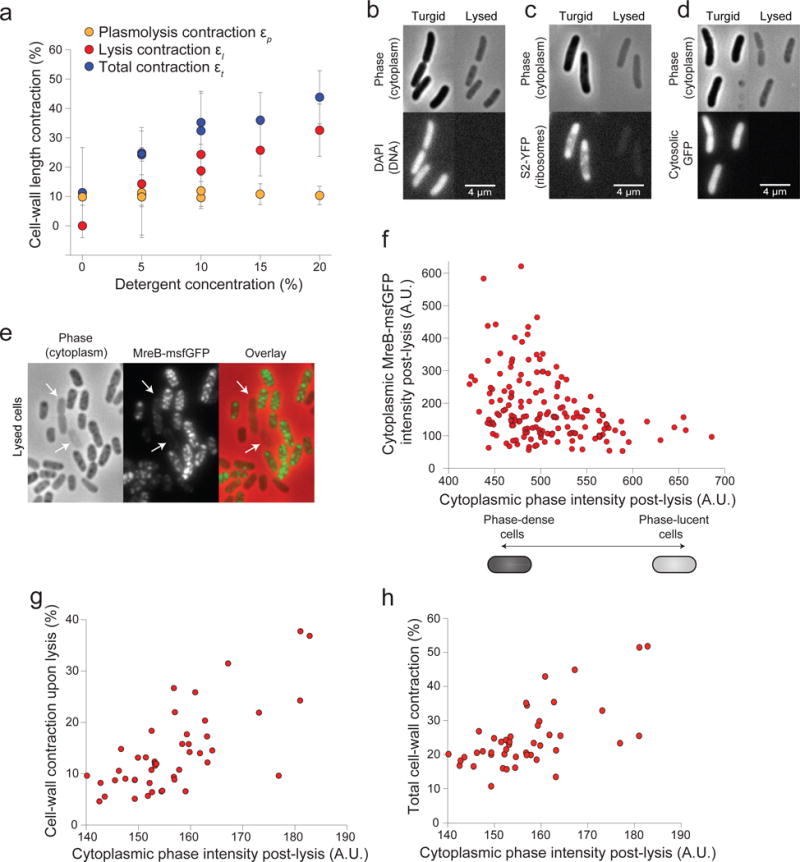
a) Increasing detergent concentration caused an approximately proportional increase in the mean cell wall contraction upon lysis and the mean total contraction in E. coli MG1655 cells. Each point represents one experiment. Number of cells for each experiment are given in Table S2.
b) Representative DAPI-stained E. coli cells before (left) and after (right) lysis shown in phase contrast and epifluorescence, demonstrating that DNA is not retained in the lysed cells. The experiment was performed once.
c) Representative E. coli cells expressing a fluorescent protein fusion to the S2 ribosomal protein before (left) and after (right) lysis shown in phase contrast and epifluorescence, demonstrating that ribosomes are not retained in lysed cells. The experiment was performed once.
d) Representative E. coli cells expressing cytosolic GFP before (left) and after (right) lysis shown in phase contrast and epifluorescence, demonstrating that GFP is not retained in lysed cells. The experiment was performed once.
e) Representative E. coli cells expressing a fluorescently tagged version of MreB after lysis shown in phase contrast (left), epifluorescence (center), and in overlay (right), demonstrating that MreB is retained within most lysed cells, but that cells with weak phase density after lysis retain low levels of MreB (arrows).
f) Cumulative fluorescence intensity of MreB-sfGFP versus the average phase-contrast intensity within the cell after lysis (n = 162 cells). Cells with higher phase density have lower intensity.
g) Cell wall contraction upon lysis versus average phase-contrast intensity within the cell after lysis (n = 46 cells).
h) Total contraction during plasmolysis and lysis versus average phase-contrast intensity within the cell after lysis (n = 46 cells).
Extended Data Figure 5. EDTA weakens the E. coli cell envelope.
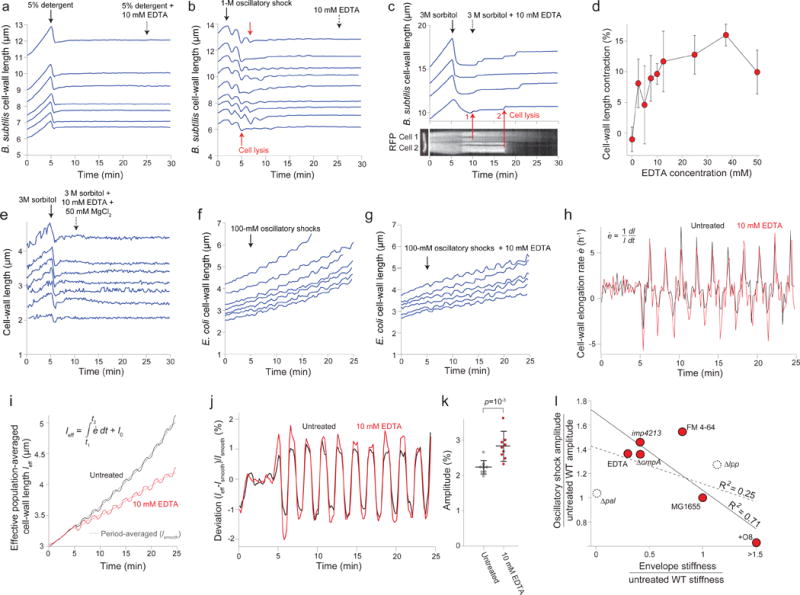
a) Length of the cell wall versus time for seven representative Bacillus subtilis cell chains during treatment with detergent followed by treatment with detergent + 10 mM EDTA (n = 68 cell chains). While detergent caused lysis, subsequent addition of EDTA did not affect cell-wall rest length.
b) Lengths of the cell wall of B. subtilis cell chains versus time during 1-M oscillatory osmotic shocks, which caused cell lysis (e.g., red arrows), followed by treatment with 10 mM EDTA (dashed arrow; n = 127 cell chains). EDTA did not affect the rest length of the cell walls.
c) (top) Length of the B. subtilis cell wall versus time through a hyperosmotic shock (3 M sorbitol, solid arrow) and subsequent treatment with 10 mM EDTA (dotted arrow) for 4 representative cell chains (n = 61 cell chains). Cell-wall length did not decrease after detergent, as for E. coli. (bottom) micrograph of a two-cell chain expressing cytosolic (strain HA405, left) and a kymograph showing fluorescence intensity along the dotted red line during the experiment in the top graph. The cell chain in the kymograph corresponds to the bottom-most length trace in the top graph. Red arrows demonstrate that the discrete increases in length observed after EDTA treatment correspond to cell lysis events, when fluorescence within the cells begin to decrease.
d) Population-averaged E. coli cell-wall length contraction upon EDTA application after plasmolysis increased with increasing concentration of EDTA (n = 131, 193, 225, 138, 81, 94, 36, 28, 72 cells, respectively). Error bars indicate ±1 s.d.
e) Length of the cell wall versus time during hyperosmotic shock (3 M sorbitol, solid arrow) and subsequent treatment with 10 mM EDTA + 50 mM MgCl2 (dotted arrow) for representative E. coli cells (n = 91 cells).
f) Length of the cell walls of representative E. coli cells during 100-mM oscillatory shocks with 2-min period (n = 243 cells).
g) Length of the cell walls of representative E. coli cells during a 100-mM oscillatory shock with 2-min period and 10 mM EDTA (n = 284 cells).
h) Population-averaged elongation rate of the E. coli cell wall during 100-mM oscillatory shocks with 2-min period for untreated (black line) and 10 mM EDTA-treated cells (n = 284 cells).
i) Effective population-averaged cell length (leff), calculated by integrating the population averaged elongation rate in (h) during 100-mM oscillatory shocks with 2-min period for untreated (black line) and 10 mM EDTA-treated cells (n = 284 cells). Dotted lines are the respective time-averaged leff using a rolling-window averaging filter with a 2-min window (equal to the period of oscillations).
j) Deviation of the effective population-averaged length in (i) from the respective time-averaged trace.
k) The mean amplitude of oscillation was found by averaging the peak-to-peak amplitude in (j) over cycles (n = 10 cycles). Error bars indicate ±1 s.d. The p-value was calculated using a Student’s two-sided t-test.
l) Amplitude of cell-wall length oscillations (ratio with respect to untreated wild-type; Fig. 2j) versus cell-wall stiffness calculated from plasmolysis-lysis experiments (ratio with respect to untreated wild-type; Fig. 2g). Solid line, linear best fit for only perturbations to the outer membrane (red circles; linear regression: R2 = 0.71, F = 9.7, p = 0.0356). Dashed line, best fit when additionally considering perturbations to protein linkages between the outer membrane and cell wall (dashed circles; linear regression: R2 = 0.25, F = 1.4, not significantly different from horizontal). For the O8-expressing strain, we conservatively used a stiffness ratio of 1.5 for the fits.
Extended Data Figure 6. FM 4-64 softens E. coli cells.
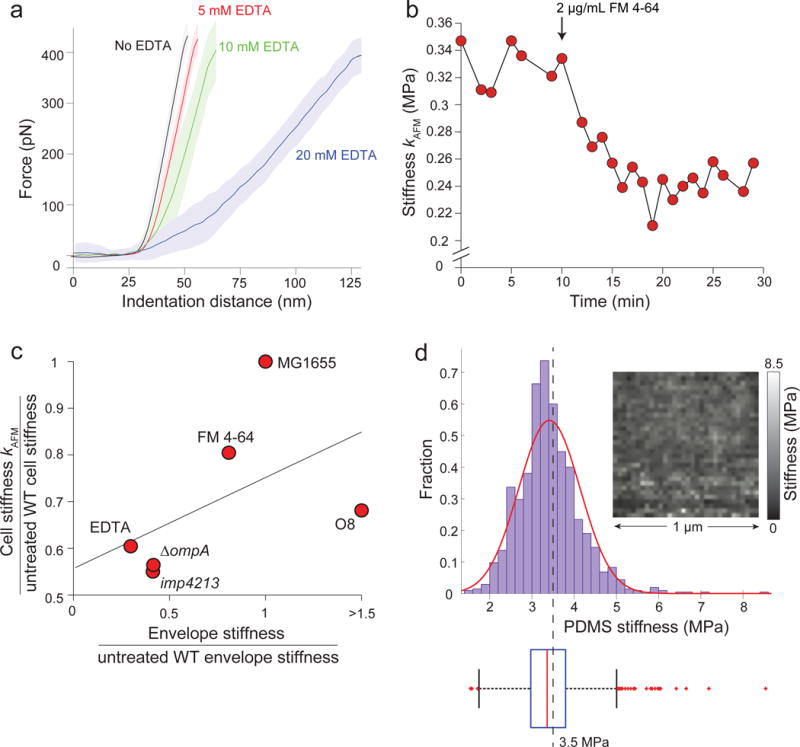
a) Cantilever force versus indentation distance during successively increasing EDTA concentrations, as in Fig. 3a. Lines indicate the average force-distance curves taken during the period in which the cell was treated with the given concentration of EDTA. Shaded areas indicate ±1 s.d (n = 4 cells). Stiffness was measured every minute during the 5-10 min periods when the cell was treated with each EDTA concentration. Average force curves were registered with respect to the onset of force increase as the cantilever was lowered.
b) Stiffness of a representative cell versus time, as measured with AFM. At t = 10 min the cell was treated with 2 μg/mL FM 4-64 (n = 3 cells).
c) The ratio of the cell stiffness computed with AFM (Fig. 3c) versus the ratio of envelope stiffness computed from plasmolysis-lysis experiments (Fig. 2g) across chemical and genetic perturbations. The solid line is the linear best fit (linear regression: R2 = 0.27, F = 1.4, not significantly different from horizontal). The numbers of cells used for each measurement are the same as given for Fig. 3c (AFM measurements of cell stiffness) and Fig. 2d-f (envelope stiffness). For the O8-expressing strain, we conservatively used a stiffness ratio of 1.5 for the fit.
d) Calibration of AFM measurements using a polydimethylsiloxane sample with known Young’s modulus of 3.5 MPa. (top) Distribution of measurements of Young’s modulus across the calibration sample. Red curve is Gaussian fit to the data. Dashed line is the mean. (top, inset) Young’s modulus measurements were spatially uniform. (bottom) Box plot of the distribution of Young’s modulus measurements showing the median stiffness (red line), 25% and 75% percentiles (edges of box), extreme bounds (whiskers), and outliers (red points).
Extended Data Figure 7. Genetic perturbations to the outer membrane render cells vulnerable to mechanical perturbation.
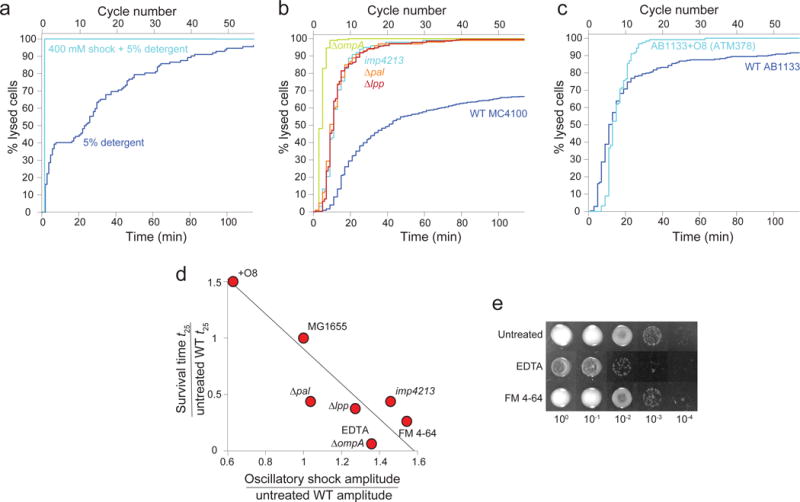
a) Cell lysis versus time and cycle number during application of 5% detergent (N-lauroyl sarcosine, n = 112 cells) and 5% detergent + 400 mM oscillatory osmotic shock (n = 100 cells). Cell-lysis rate increased dramatically during 400-mM oscillatory osmotic shocks.
b) Cell lysis versus time and cycle number during 400-mM oscillatory osmotic shocks with 2-min period for mutant E. coli strains with the MC4100 wild-type background (n = 476, 98, 187, 99, 280 cells for wild-type, imp4213, ΔompA, Δlpp, and Δpal, respectively).
c) Cell lysis versus time and cycle number during 400-mM oscillatory osmotic shock with 2-min period for E. coli wild-type AB1133 (n = 273 cells) and ATM378 (AB1133+O8, n = 123 cells).
d) Time at which 25% of cells had lysed (ratio to untreated wildtype, Fig. 4b) versus the ratio of amplitudes during 100-mM oscillatory osmotic shocks (Fig. 2j). The line is the linear best fit (linear regression: R2 = 0.84, F = 19.4, p = 0.0045).
e) Serial dilutions of overnight E. coli L-form cultures spotted onto solid media permissive for L-form growth. For chemical treatments, 10 mM EDTA and 2 μg/mL FM 4-64 were included in the liquid media used to culture L-forms overnight, but not in the solid media onto which L-forms were spotted. Mutants (ΔompA, +O8, Δlpp, Δpal) formed very small colonies, and were thus viewed using an inverted microscope to ensure accurate counting.
Supplementary Material
Acknowledgments
The authors thank the Huang, Theriot, and Weibel labs for useful discussions, Katie Amberg-Johnson for assistance with immunoblotting, and Thomas Silhavy, Thomas Bernhardt, Anthony Maurelli, Brian Hammer, and Heidi Arjes for helpful feedback, antibodies, and strains. This work was supported by NIH Director’s New Innovator Awards DP2OD006466 (to K.C.H.) and DP2OD008735 (to D.W.), NSF CAREER Award MCB-1149328 (to K.C.H.), the Stanford Systems Biology Center funded by NIH grant P50 GM107615 (to K.C.H. and J.A.T.), NIH Grant R37-AI036929 (to J.A.T.), the Howard Hughes Medical Institute (to J.A.T.), and NSF Grant DMR-1121288 (to D.W.). K.C.H. is a Chan Zuckerberg Biohub Investigator. E.R.R. was supported by a postdoctoral fellowship from the Simbios Center for Physics Based Computation at Stanford University under NIH Grant U54 GM072970. P.D.O. was supported by a postdoctoral fellowship from the Swiss National Science Foundation under Grant P2ELP3_172318. This work was also supported in part by the National Science Foundation under Grant PHYS-1066293 and the hospitality of the Aspen Center for Physics.
Footnotes
Supplementary Information
The supplementary information contains text and 5 videos.
Author Contributions
E.R.R. conceptualized the study. E.R.R., G.B., P.O., G.A., A.M., F.C., D.W., J.A.T., and K.C.H. designed the experiments. E.R.R. and G.B. performed detergent treatments, oscillatory osmotic shock assays, and protein release assays. G.B. performed cloning. E.R.R. and P.O. performed AFM experiments. G.A. performed microfluidic bending assays. E.R.R., G.B., and L.Z. performed L-form experiments. A.M. performed UPLC experiments. E.R.R., G.B., P.O., A.M., and G.A. analyzed data. E.R.R., G.B., G.A., P.O., A.M., J.A.T., and K.C.H. wrote the manuscript. All authors reviewed the manuscript before submission.
Author Information
The authors have no competing financial interests.
References
- 1.Zgurskaya HI, Lopez CA, Gnanakaran S. Permeability Barrier of Gram-Negative Cell Envelopes and Approaches To Bypass It. ACS infectious diseases. 2015;1:512–522. doi: 10.1021/acsinfecdis.5b00097. [DOI] [PMC free article] [PubMed] [Google Scholar]
- 2.Martin H, Frank H. Quantitative Bausteinanalyse der Stützmembran in der Zellwand von Escherichia coli B. Zeitschrift für Naturforschung B. 1962;17:190–196. [Google Scholar]
- 3.Deng Y, Sun M, Shaevitz JW. Direct measurement of cell wall stress stiffening and turgor pressure in live bacterial cells. Phys Rev Lett. 2011;107:158101. doi: 10.1103/PhysRevLett.107.158101. [DOI] [PubMed] [Google Scholar]
- 4.Holtje JV. Growth of the stress-bearing and shape-maintaining murein sacculus of Escherichia coli. Microbiol Mol Biol Rev. 1998;62:181–203. doi: 10.1128/mmbr.62.1.181-203.1998. [DOI] [PMC free article] [PubMed] [Google Scholar]
- 5.Koch AL. Biophysics of bacterial walls viewed as stress-bearing fabric. Microbiological reviews. 1988;52:337–353. doi: 10.1128/mr.52.3.337-353.1988. [DOI] [PMC free article] [PubMed] [Google Scholar]
- 6.Herrmann M, Schneck E, Gutsmann T, Brandenburg K, Tanaka M. Bacterial lipopolysaccharides form physically cross-linked, two-dimensional gels in the presence of divalent cations. Soft matter. 2015;11:6037–6044. doi: 10.1039/c5sm01002k. [DOI] [PubMed] [Google Scholar]
- 7.Rassam P, et al. Supramolecular assemblies underpin turnover of outer membrane proteins in bacteria. Nature. 2015;523:333–336. doi: 10.1038/nature14461. [DOI] [PMC free article] [PubMed] [Google Scholar]
- 8.Ursell TS, Trepagnier EH, Huang KC, Theriot JA. Analysis of surface protein expression reveals the growth pattern of the gram-negative outer membrane. PLoS Comput Biol. 2012;8:e1002680. doi: 10.1371/journal.pcbi.1002680. [DOI] [PMC free article] [PubMed] [Google Scholar]
- 9.Cayley DS, Guttman HJ, Record MT., Jr Biophysical characterization of changes in amounts and activity of Escherichia coli cell and compartment water and turgor pressure in response to osmotic stress. Biophys J. 2000;78:1748–1764. doi: 10.1016/s0006-3495(00)76726-9. [DOI] [PMC free article] [PubMed] [Google Scholar]
- 10.Rojas E, Theriot JA, Huang KC. Response of Escherichia coli growth rate to osmotic shock. Proc Natl Acad Sci U S A. 2014;111:7807–7812. doi: 10.1073/pnas.1402591111. [DOI] [PMC free article] [PubMed] [Google Scholar]
- 11.de Vries H. Die Plasmolytische Studien über die Wand Vacuolen. G. Bernstein; 1885. [Google Scholar]
- 12.Howatson AM. Engineering tables and data. Springer Science & Business Media; 2012. [Google Scholar]
- 13.Tuson HH, et al. Measuring the stiffness of bacterial cells from growth rates in hydrogels of tunable elasticity. Mol Microbiol. 2012;84:874–891. doi: 10.1111/j.1365-2958.2012.08063.x. [DOI] [PMC free article] [PubMed] [Google Scholar]
- 14.Coughlin RT, Peterson AA, Haug A, Pownall HJ, McGroarty EJ. A pH titration study on the ionic bridging within lipopolysaccharide aggregates. Biochim Biophys Acta. 1985;821:404–412. doi: 10.1016/0005-2736(85)90044-6. [DOI] [PubMed] [Google Scholar]
- 15.Broady KW, Rietschel ET, Luderitz O. The chemical structure of the lipid A component of lipopolysaccharides from Vibrio cholerae. Eur J Biochem. 1981;115:463–468. doi: 10.1111/j.1432-1033.1981.tb06224.x. [DOI] [PubMed] [Google Scholar]
- 16.Leive L, Shovlin VK, Mergenhagen SE. Physical, chemical, and immunological properties of lipopolysaccharide released from Escherichia coli by ethylenediaminetetraacetate. J Biol Chem. 1968;243:6384–6391. [PubMed] [Google Scholar]
- 17.Amro NA, et al. High-resolution atomic force microscopy studies of the Escherichia coli outer membrane: structural basis for permeability. Langmuir. 2000;16:2789–2796. [Google Scholar]
- 18.Ruiz N, Falcone B, Kahne D, Silhavy TJ. Chemical conditionality: a genetic strategy to probe organelle assembly. Cell. 2005;121:307–317. doi: 10.1016/j.cell.2005.02.014. [DOI] [PubMed] [Google Scholar]
- 19.Sampson BA, Misra R, Benson SA. Identification and characterization of a new gene of Escherichia coli K-12 involved in outer membrane permeability. Genetics. 1989;122:491–501. doi: 10.1093/genetics/122.3.491. [DOI] [PMC free article] [PubMed] [Google Scholar]
- 20.Amir A, Babaeipour F, McIntosh DB, Nelson DR, Jun S. Bending forces plastically deform growing bacterial cell walls. Proc Natl Acad Sci U S A. 2014;111:5778–5783. doi: 10.1073/pnas.1317497111. [DOI] [PMC free article] [PubMed] [Google Scholar]
- 21.Auer GK, et al. Mechanical Genomics Identifies Diverse Modulators of Bacterial Cell Stiffness. Cell systems. 2016;2:402–411. doi: 10.1016/j.cels.2016.05.006. [DOI] [PMC free article] [PubMed] [Google Scholar]
- 22.Billings G, et al. De novo morphogenesis in L-forms via geometric control of cell growth. Mol Microbiol. 2014;93:883–896. doi: 10.1111/mmi.12703. [DOI] [PMC free article] [PubMed] [Google Scholar]
- 23.Yao Z, Kahne D, Kishony R. Distinct single-cell morphological dynamics under beta-lactam antibiotics. Mol Cell. 2012;48:705–712. doi: 10.1016/j.molcel.2012.09.016. [DOI] [PMC free article] [PubMed] [Google Scholar]
- 24.Kawai Y, Mickiewicz K, Errington J. Lysozyme Counteracts beta-Lactam Antibiotics by Promoting the Emergence of L-Form Bacteria. Cell. 2018;172:1038–1049 e1010. doi: 10.1016/j.cell.2018.01.021. [DOI] [PMC free article] [PubMed] [Google Scholar]
- 25.Rick PD, Hubbard GL, Barr K. Role of the rfe gene in the synthesis of the O8 antigen in Escherichia coli K-12. J Bacteriol. 1994;176:2877–2884. doi: 10.1128/jb.176.10.2877-2884.1994. [DOI] [PMC free article] [PubMed] [Google Scholar]
- 26.Edelstein A, Amodaj N, Hoover K, Vale R, Stuurman N. Computer Control of Microscopes Using μManager. John Wiley And Sons, Inc; 2010. [DOI] [PMC free article] [PubMed] [Google Scholar]
- 27.Desmarais SM, et al. High-throughput, Highly Sensitive Analyses of Bacterial Morphogenesis Using Ultra Performance Liquid Chromatography. J Biol Chem. 2015;290:31090–31100. doi: 10.1074/jbc.M115.661660. [DOI] [PMC free article] [PubMed] [Google Scholar]
- 28.Glauner B, Holtje J, Schwarz U. The Composition of the murein of Escherichia coli. The Journal of biological chemistry. 1988;263:10088–10095. [PubMed] [Google Scholar]
- 29.Glauner B. Separation and quantification of muropeptides with high-performance liquid chromatography. Anal Biochem. 1988;172(2):451–464. doi: 10.1016/0003-2697(88)90468-x. [DOI] [PubMed] [Google Scholar]
- 30.Hutter JL, Bechhoefer J. Calibration of atomic‐force microscope tips. Review of Scientific Instruments. 1993;64:1868–1873. [Google Scholar]
Associated Data
This section collects any data citations, data availability statements, or supplementary materials included in this article.
Supplementary Materials
Data Availability Statement
The datasets generated during the current study are available from the corresponding author on reasonable request.


