

Abstract
BACKGROUND
Autism spectrum disorder (ASD) is associated with impaired face processing. The N170 event-related potential (ERP) has been considered a promising neural marker of this impairment. However, no quantitative review to date has integrated the literature to assess whether the N170 response to faces in individuals with ASD differs from that of typically-developing (TD) individuals.
METHODS
This meta-analysis examined the corpus of literature investigating difference in N170 response to faces in individuals with ASD and without ASD. Data from 23 studies (NASD=374, NTD=359) were reviewed. Meta-analysis was used to examine the effect size of the difference in N170 latency and amplitude among individuals with and without ASD. Analyses were also conducted examining hemispheric differences, potential moderators, and publication bias.
RESULTS
On average, N170 latencies to faces were delayed in individuals with ASD, but amplitudes did not differ for individuals with ASD and TD individuals. Moderator analyses revealed that N170 amplitudes were smaller in magnitude in the ASD relative to TD participants in adult samples and in those with higher cognitive ability. However, effects differed as a function of hemisphere of recording. No evidence of publication bias was found.
CONCLUSIONS
Atypicality of N170 – particularly latency – to faces appears to be a specific biomarker of social-communicative dysfunction in ASD and may relate to differential developmental experiences and use of compensatory cognitive mechanisms. Future research should examine phenotypic differences that contribute to N170 heterogeneity, as well as specificity of N170 differences in ASD versus non-ASD clinical populations, and N170 malleability with treatment.
Keywords: autism spectrum disorder (ASD), event-related potential (ERP), N170, electroencephalography (EEG), face processing, meta-analysis
Introduction
While social symptoms represent core deficits in autism spectrum disorder (ASD) (1), neurocognitive processes that underlie them are poorly understood. Among the most well-studied is face processing, with some evidence suggesting clear differences (2,3), but other studies showing less pronounced effects (4–6). Examining face processing in ASD is vital, as the ability to attend to and process facial information is implicated in many social impairments in ASD (7) and is often a target of treatment (8,9). Neural indices of face processing are of interest as candidate biomarkers of atypical neurodevelopment of social processes in ASD, particularly given that face perception is a well-studied social process in typical development (TD).
Event-related potentials (ERPs), indexed by electroencephalogram (EEG), are a useful tool for studying potential biomarkers of ASD. ERPs represent the synchronous activation of large populations of neurons that produce electrical fields, reflecting neural activity in response to a discrete stimulus (10). Among the most consistently cited candidate neural markers of face processing is the N170 ERP component (11–14). The N170 is a negative-going waveform that peaks approximately 170ms after stimulus presentation and exhibits larger amplitude and shorter latency to faces in comparison to other stimuli (e.g., objects) (15). As such, it is presumed to reflect neural activity associated with early-stage face processing (12). In the ASD literature, the N170 is among the most studied ERPs, is associated with behavioral deficits in face processing, and is considered among the most promising biomarkers of ASD (16,17).
Atypical Face Processing in ASD
Despite theoretical models suggesting deficits in face processing as a fundamental disruption that is reliably and sensitively implicated in ASD (18,19), empirical findings regarding N170 response to faces are inconsistent. Although numerous studies have demonstrated atypical N170 response, with reduced amplitudes and/or slower latencies in children (18,20–24) and adults (2,25–29) with ASD, these effects are inconsistent (30–35), and the studies often suffer from small sample sizes. Likewise, it is unclear if differences in N170 to faces in ASD are stimulus- and component-specific, or if they reflect broader differences in (e.g., N170 differences to non-face stimuli) or more basic stages of (e.g., differences in earlier visual ERPs such as the P1) visual information processing. Therefore, a meta-analysis is needed to synthesize findings and determine whether the N170 response to faces represents a specific biomarker relevant to ASD.
Plausible Moderators of Differential ERP Responses
Given heterogeneity within ASD and across the lifespan, inconsistent findings across studies may be driven by one or more moderating factors.
Age
Atypical N170 responses in ASD have been reported in children (18,20–24,32) and adults (2,25–29). Typically N170 latency becomes faster and amplitude becomes larger with age (32,36,37), but it is unclear whether individuals with ASD show a similar degree of change in N170. Therefore, age of the sample may influence group differences in the N170 responses to faces.
Sex Ratio
ASD diagnoses are 4.5 times more likely in males than females (38), and there is much heterogeneity in ASD social symptom presentation across sexes (39). Females at risk for ASD pay more attention to social cues as infants and show better facial emotion recognition as children than high-risk males (40,41). Also, females with ASD may show larger N170 amplitude and slower latencies than males (42) which may lead to more pronounced diagnostic differences depending on gender composition.
Cognitive ability
Individuals with ASD often show IQ-related differences in symptom presentation and task performance (43). For instance, higher-functioning individuals with ASD use compensatory cognitive strategies in behavioral tasks (e.g., emotion recognition) to perform comparably to TD (3). However, it is unclear whether cognitive ability exerts similar influence on more basic perceptual processes, such as those indexed by the N170.
ASD diagnosis based on gold standard measures
There are inconsistencies among the ASD literature regarding use of gold-standard diagnostic instruments (i.e., Autism Diagnostic Observational Scale [ADOS] (44), Autism Diagnostic Interview-Revised [ADI-R]) (45). However, it is not clear whether differences in N170 responses in ASD are constrained to samples whose diagnoses have been rigorously confirmed using such measures.
ASD symptom severity
ASD is a markedly heterogeneous disorder, and individuals with ASD significantly vary in core ASD symptoms and concomitant features (46). Thus, to the extent that face processing deficits may vary across individuals with ASD, it is plausible that variations in ASD symptomatology may influence differences in N170 responses.
Lateralization
Besides potential moderators, differential hemispheric specialization of the N170 could also manifest in ASD. When viewing faces, TD individuals show a localized response pattern in the right hemisphere and more activation in the right than left fusiform gyrus (47,48). In contrast, ASD individuals may show a more diffuse pattern of electrophysiological response across the scalp and reduced right fusiform activation (16,49,50). Therefore, ASD individuals may differ in their pattern of N170 latency or amplitude in the left versus the right hemisphere as a function of a developmental delay in hemispheric lateralization for face processing (51).
Current Review
This study aims to determine if, and under what conditions, the N170 differentiates individuals with ASD. Specifically, this meta-analysis examined whether overall effect sizes (ESs) for N170 latency and amplitude in response to face stimuli differ between individuals with ASD and TD. It was hypothesized that ASD would be characterized by N170 responses to faces that are longer in latency and smaller (i.e., less negative) in amplitude. We also hypothesized that differences would be especially pronounced in right-lateralized N170. This study also examined following potential study-level moderators that could predict variation in ESs across studies: mean age of participants, sex ratio (% of male participants), mean cognitive ability of the sample (full-scale IQ [FSIQ], verbal IQ [VIQ], and performance IQ [PIQ]), use of gold-standard ASD diagnostic measures (presence/absence of ADOS/ADI-R inclusion requirements for ASD), and ASD symptom severity (measured by ADOS and ADI-R). Finally, this study examined the specificity of differential N170 response to faces in individuals with ASD in the same sample of studies by meta-analyzing differences in a) N170 to non-face stimuli, and b) P1 response to faces.
Methods and Materials
Identification and Selection of Studies
Procedures reported here adhere to the Preferred Reporting Items for Systematic Reviews and Meta-Analyses (PRISMA) guidelines (52). Description of search procedure is in the Supplement.
Eligibility criteria
Studies included in the current meta-analysis satisfied the following criteria after full-text review: 1) a sample of patients meeting DSM-IV or DSM-5 criteria for ASD (including Autistic Disorder, Asperger’s Disorder, and Pervasive Developmental Disorder—Not Otherwise Specified diagnoses based on ASD symptomatology measures and/or expert clinicians); 2) a TD control sample; 3) empirical manuscript (not a review); 4) study task included face stimuli and simultaneous EEG recording; 5) examined latency and/or amplitude of the N170 ERP in response to face stimuli; 6) reported statistics allowing for calculation of ES of N170 latency and/or amplitude; and 7) reported findings in an English-language, peer-reviewed journal.
All eligible studies used age-matched control group. IQ-matched control group was not considered as an eligibility criterion because only a subset of primary studies included information on IQ, and these studies either used IQ-matched controls or reported that ASD and TD groups did not significantly differ on IQ, except one study (53) (see Table 1).
Table 1.
Study Characteristics
| Study | Mean Age (years) |
Sex Ratio (% male) |
Mean Cognitive Ability | Mean ASD Symptom Severitya | ASD n |
TD n |
Control group matched by | N170 Lat | N170 Amp | Hemispheric Lateralization Reported | |||
|---|---|---|---|---|---|---|---|---|---|---|---|---|---|
|
| |||||||||||||
| FSIQ | VIQ | PIQ | ADOS | ADI-R | |||||||||
| Akechi et al., 2010 (20) | 13.00 | 64.29 | 100.45 | – | – | – | – | 14 | 14 | Age, sex, IQ | Yes | Yes | Yes |
| Apicella et al., 2013 (21) | 9.93 | – | – | – | – | – | – | 10 | 12 | Age | Yes | Yes | Yes |
| Batty et al., 2011 (22) | 10.53 | 73.33 | – | – | – | – | – | 15 | 17 | Age or VIQ | Yes | No | No |
| Churches et al, 2010; 2012a; 2012b (25,63,64) | 30.55 | 100.00 | 117.61 | 116.13 | 115.37 | 17 | 17 | Age, IQ | Yes | Yes | No | ||
| Cygan et al., 2014 (26) | 20.60 | – | 109.67 | 111.50 | 106.77 | 12.57 | 50.96 | 23 | 23 | Age, IQ, handedness | No | Yes | Yes |
| Grice et al., 2005 (31) | 5.17 | 90.00 | – | – | – | – | – | 10 | 10 | Age, sex | Yes | Yes | No |
| Gunji et al., 2009 (32) | 11.06 | 64.71 | 97.00a | 102.00a | 92.00a | – | – | 8 | 9 | Age, sex, IQ, handedness | Yes | Yes | Yes |
| Hileman et al., 2011 (23) | 13.79 | 83.67 | 101.38 | 100.84 | 101.92 | 12.85 | – | 27 | 22 | Age, sex, IQ | Yes | Yes | Yes |
| Khorrami et al., 2013 (53) | 13.84 | 100.00 | 112.97 | – | – | – | – | 14 | 18 | Age, sex | Yes | Yes | No |
| McPartland et al., 2004 (2) | 23.27 | 91.30 | – | – | 105.43 | – | – | 9 | 14 | Age, sex, IQ, ethnicity, handedness | Yes | Yes | Yes |
| McPartland et al., 2011 (18) | 11.67 | 87.04 | 107.77 | – | – | 11.48 | 48.12 | 32 | 17 | Age, sex, IQ, handedness | Yes | Yes | Yes |
| Neuhaus et al., 2016 (33) | 10.63 | 62.71 | 108.08 | 107.92 | 106.10 | – | – | 25 | 40 | Age (twins) | Yes | Yes | No |
| O’Connor et al., 2005 – Child (27) | 11.40 | 100.00 | – | – | – | – | – | 15 | 15 | Age, sex | Yes | Yes | Yes |
| O’Connor et al., 2005 – Adult (27) | 24.70 | 87.50 | – | – | – | – | – | 15 | 15 | Age, sex | Yes | Yes | Yes |
| O’Connor et al., 2007 (28) | 23.65 | 100.00 | – | – | – | – | – | 15 | 15 | Age | Yes | Yes | No |
| Senju et al., 2005 (34) | 12.08 | 92.86 | – | – | – | – | – | 13 | 15 | Age | Yes | Yes | Yes |
| Tye et al., 2013; 2014 (65,66) | 10.72 | 100.00 | 115.74 | – | – | 12.11 | 43.90 | 43 | 26 | Age, sex | Yes | Yes | No |
| Webb et al., 2006 (24) | 3.74 | – | – | – | – | – | – | 27 | 18 | Age | Yes | Yes | Yes |
| Webb et al., 2012 (29) | 23.40 | 92.19 | 110.65 | – | – | 11.57 | 37.19 | 32 | 32 | Age, IQ | No | Yes | No |
| Wong et al., 2008 (35) | 8.50 | 100.00 | – | – | 114.55 | – | 39.40 | 10 | 12 | Age, PIQ | Yes | No | Yes |
Notes.
For ASD sample only. Lat=Latency; Amp=Amplitude. ADOS=Autism Diagnostic Observation Schedule; ADI-R=Autism Diagnostic Interview-Revised. FSIQ=Full-Scale IQ; VIQ=Verbal IQ; PIQ=Performance/Nonverbal IQ. Yes=data available; No=data not available.
Coding of Study Characteristics and Effect Sizes
All variables were double-coded by two independent raters. The N170 was identified as a negative-going peak occurring approximately 170ms and the P1 as a positive-going peak occurring approximately 100ms after stimulus presentation. N170 and P1 latency and amplitude data (means, standard deviations) were extracted separately for ASD and TD samples, averaged across all relevant facial (e.g., different emotions) and non-facial (e.g., objects, houses) stimuli for each study. When means and standard deviations were not available, ESs were calculated using algebraically equivalent formulas (t-test, one-way ANOVA) or exact p-values (54).
Meta-analytic Procedure
For the current study, we conducted ten meta-analytic models. The first two included data on N170 latency or amplitude to faces from each study regardless of the hemisphere. To examine the influence of N170 lateralization, four additional models were conducted for N170 latency and amplitude data reported exclusively from the left or right hemisphere. Four additional meta-analyses were conducted examining P1 latency and amplitude to faces and N170 latency and amplitude to non-faces.
The ES, using Hedges’ g for small sample correction, was calculated using Comprehensive Meta-Analysis, Version 3 (CMA-3) (54). A random-effects model was used unless otherwise specified (55). Positive g indicated longer latency and less negative (i.e., smaller) amplitude of N170 response in ASD relative to TD (i.e., relatively less efficient or less robust N170 response in ASD). ESs of 0.2, 0.5, and 0.8 were considered to be small, medium, and large, respectively (56). A jackknife sensitivity analysis was conducted by repeating analyses excluding one study at a time to examine impact on the ES estimate (57).
Publication bias was assessed using funnel plots (58) and the tandem method suggested by Ferguson and Brannick (59) (see Supplement). Publication bias was deemed “probable” if indicated by all three criteria, “possible” if one or two criteria were met, and “unlikely” if no evidence of bias was found.
A significant Q statistic (60) and/or nontrivial heterogeneity according to the I2 statistic (≥25%) (61) was used to warrant moderator analysis on each effect. Mixed-effects models were used (62). As information was reported separately for adults and children, these data were analyzed separately as an additional moderator. Moderator analyses were conducted using meta-regression for continuous variables (age, sex ratio, cognitive ability, ASD symptom severity), and using analogue-to-ANOVA for the categorical moderators (adult vs. child, use of gold-standard ASD diagnostic measure).
Results
The initial literature search identified 42 results in Web of Science, 41 results in PubMed, and 29 results in PsycINFO. Duplicates were removed (62 studies), and five additional articles were identified with a manual search of the citation list from relevant past reviews, yielding 30 articles eligible for full-text review. After applying inclusion criteria, 23 articles remained (see Supplementary Figure S1).
Of these, most included information on N170 latency and amplitude; some only reported one or the other. A total of 16 studies were included in the meta-analysis for latency and 20 for amplitude. One article (27) reported data separately for adult and child groups, so the two subgroups were included as separate studies in the meta-analyses.
Authors were contacted for multiple studies from the same research group to determine sample overlap or for additional data. After corresponding with authors, two studies (29,30) contained overlapping participants (S. J. Webb, S. Faja; personal communication, February 16, 2017). The study with the larger sample was included (29). One group of three studies (25,63,64) and a separate group of two studies (65,66) each contained partially overlapping participants; here, summary data provided by the corresponding authors (such that each participant was represented once) were used. One author provided latency data that were not described in published articles (25,63,64). Consequently, data from 21 articles (18 studies) were included in the meta-analyses for both N170 latency and amplitude (Table 1). Agreement among coders was excellent, ICC(2,1)>0.90, on all coded variables.
N170 Latency
Overall analysis
For the 18 studies included in the overall N170 latency meta-analysis, data were collected from 319 ASD and 304 TD participants. ESs ranged from g=−0.36 to 2.18 (Figure 1). Overall, N170 latency in the ASD group was significantly longer when compared to the TD control group (g=0.36, k=18, 95% [CI 0.06, 0.67], Z=2.33, p=0.02), evincing a small effect. Sensitivity analysis revealed that the effect was still significant after each study was removed individually (Supplementary Figure S2A).1
Figure 1.
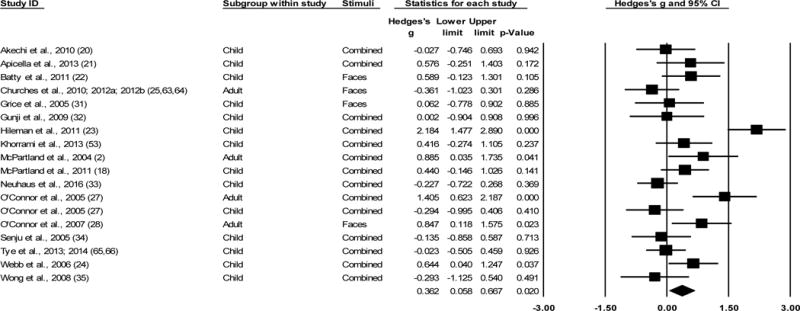
Overall effect sizes (ESs) for N170 latency to faces, regardless of hemisphere recorded. All models are random effects. All ESs are Hedges’ g. Positive g indicates longer latency of N170 response in the ASD sample relative to the TD sample. Plots with a square indicate Hedges’ g for individual studies within the analysis. Diamond indicates overall ES for the analysis. “Combined” in the Stimuli column refers to aggregating all facial stimuli in the study.
Publication bias analysis
Publication bias was not evident according to the Egger’s regression method (p=0.29; Figure 2) and an Orwin’s fail-safe N of 40 studies. The trim-and-fill method suggested that 3 studies are likely to be missing to the right of the mean (i.e., suggesting the “true” ES may be greater than detected). Accounting for these studies, the adjusted g=0.50, 95% CI [0.20, 0.80], was still significantly different from zero. The combined tandem criteria suggest publication bias is unlikely.
Figure 2.
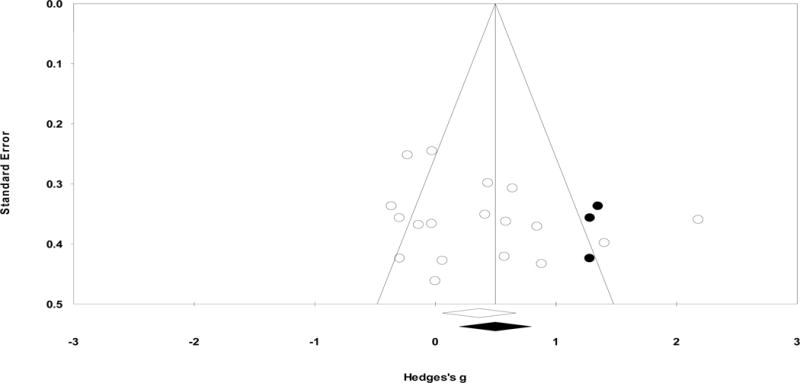
Funnel plot examining publication bias for overall N170 latency to faces. Here, Y-axis stands for the standard error of the Hedges’ g and X-axis stands for the Hedges’ g. Each dot stands for an individual study. Using the trim-and-fill procedure, the funnel plot indicates the number of unpublished studies missing due to publication bias (indicated in black dots). The overall effect size did not change significantly when accounting for the unpublished studies.
Moderator analyses
Significant heterogeneity was found (Q[17]=59.08, p<0.001, I2=71.23), warranting exploratory moderator analyses. Moderator analyses for age (categorical and continuous), sex ratio, cognitive ability (FSIQ, VIQ, and PIQ), and use of gold-standard ASD diagnostic measures were all non-significant (ps>0.16). Moderator analyses could not be conducted for ASD symptom severity due to lack of converging measures across studies.
Analyses by hemisphere
Ten studies reported N170 latency data separately for left and right hemispheres. The ESs ranged from g=−0.29 to g=1.46 for the left hemisphere and g=−0.30 to g=1.35 for the right hemisphere. Overall, N170 latency was significantly longer in ASD than in TD for the left hemisphere (g=0.35, k=10, 95% CI [0.03, 0.67], Z=2.16, p=0.03), but not for the right hemisphere (g=0.30, k=10, 95% CI [−0.04, 0.65], Z=1.73, p=0.08). Significant heterogeneity was found among ESs for both left (Q[9]=18.73, p=0.03, I2=51.96) and right (Q[9]=21.86, p=0.01, I2=58.82) hemispheres. Moderator analyses revealed that age (categorical for both hemispheres; continuous for right hemisphere only) accounted for significant variability in ESs. That is, N170 latencies were longer for ASD relative to TD participants only for adult samples in both hemispheres and for older participants in the right hemisphere (see Supplement).
N170 Amplitude
Overall analysis
Across the 18 studies included in the overall N170 amplitude meta-analysis, data were collected from 349 ASD participants and 332 TD participants. The ESs ranged from g=−1.59 to 0.94 (Figure 3). Overall, N170 amplitude in ASD group was not statistically different when compared to TD controls (g=−0.03, k=18, 95% CI [−0.33, 0.26], Z=−0.23, p=0.82). Sensitivity analysis revealed that the overall effect was still nonsignificant after each study was removed individually (Supplementary Figure S2B).2
Figure 3.
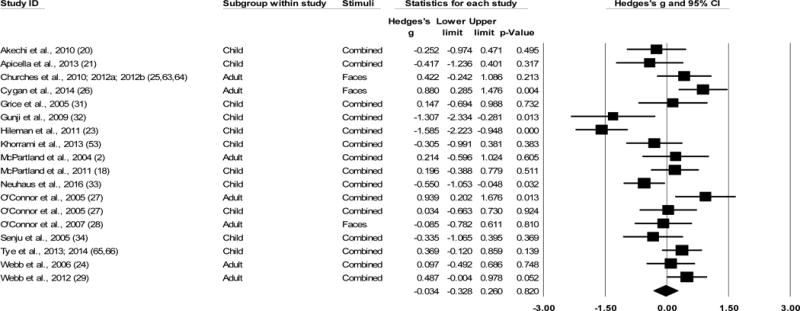
Overall effect sizes (ESs) for N170 amplitude to faces, regardless of hemisphere recorded. All models are random effects. All ESs are Hedges’ g. Positive g indicates less negative (i.e., smaller) amplitude of N170 response in the ASD sample relative to the TD sample. Plots with a square indicate Hedges’ g for individual studies within the analysis. Diamond indicates overall ES for the analysis. “Combined” in the Stimuli column refers to aggregating all facial stimuli in the study.
Publication bias analysis
Publication bias was not evident according to the Egger’s regression method (p=0.31; Figure 4). Orwin’s fail-safe N was not applicable. The trim-and-fill method suggested that 3 studies are likely to be missing to the left of the mean (i.e., where amplitude would be greater in ASD than TD). When accounting for these studies, the adjusted g=−0.21, 95% CI [−0.52, 0.11], was still nonsignificant. The combined tandem criteria suggest publication bias is unlikely.
Figure 4.
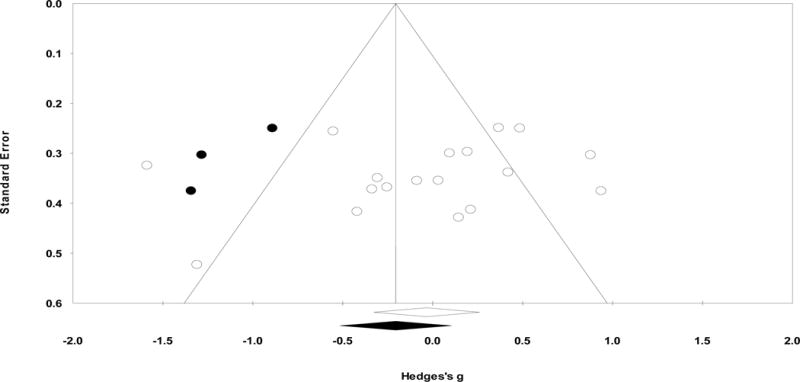
Funnel plot examining publication bias for overall N170 amplitude to faces. Here, Y-axis stands for the standard error of the Hedges’ g and X-axis stands for the Hedges’ g. Each dot stands for an individual study. Using the trim-and-fill procedure, the funnel plot indicates the number of unpublished studies missing due to publication bias (indicated in black dots). The overall effect size did not change significantly when accounting for the unpublished studies.
Moderator analyses
Significant heterogeneity was found (Q[17]=60.76, p<0.001, I2=72.02], warranting exploratory moderator analyses. Moderator analyses for sex ratio, use of gold-standard diagnostic measures, and ASD symptom severity were all non-significant (ps>.05).
Age (categorical)
A significant difference was found when comparing adult versus child samples (Q[1]=10.87, p=0.001). ESs were small but significant for the adult samples (g=0.43, k=7, 95% CI [0.16, 0.70], Z=3.09, p=0.002), such that N170 amplitudes were smaller (i.e., less negative) for ASD relative to TD adults. ESs for the child samples were marginally significant (g=−0.34, k=11, 95% CI [−0.70, 0.03], Z=−1.80, p=0.07) but in the opposite direction, such that N170 amplitude was larger in ASD than TD children.
Age (continuous)
The effect of mean age of participants within study samples was marginally significant, Q(1)=3.35, p=0.07, and consistent in direction with the categorical age effects (b=0.04, SE=0.02, 95% CI [−0.003, 0.07], p=0.07).
Cognitive ability
The effect of mean FSIQ of participants within study samples was significant, Q(1)=7.46, p=0.006. The magnitude of N170 amplitude difference for ASD versus TD was larger for higher FSIQ, such that those with ASD had relatively smaller N170 amplitudes as compared to TD when all participants had relatively higher FSIQ (b=0.08, SE=0.03, 95% CI [0.02, 0.15], p=0.006). This effect was present in both VIQ (Q[1]=12.99, b=0.16, SE=0.04, 95% CI [0.07, 0.25], p<0.001) and PIQ (Q[1]=5.00, b=0.10, SE=0.04, 95% CI [0.01, 0.19], p=0.03) as well.
Analyses by hemisphere
Eleven studies reported N170 amplitude data for the left hemisphere and 10 studies for the right hemisphere. ESs ranged from g=−1.78 to 1.12 for the left hemisphere and g=−0.76 to 0.84 for the right hemisphere. N170 amplitude did not differ for ASD versus TD group for either left (g=0.003, k=11, 95% CI [−0.35, 0.35], Z=0.02, p=0.99) or right hemisphere (g=0.12, k=10, 95% CI [−0.21, 0.45], Z=0.73, p=0.47). A nontrivial amount of heterogeneity was found among the ESs for both left (Q[10]=28.66, p=0.001, I2=65.11) and right hemisphere (Q[9]=20.18, p=0.02, I2=55.40). Moderator analyses revealed that age (categorical and continuous) for the left hemisphere and cognitive ability (FSIQ) for the right hemisphere accounted for significant variability in ESs. That is, N170 amplitudes were smaller for ASD than TD participants for older samples in the left hemisphere and for those with relatively higher FSIQ in the right hemisphere (see Supplement).
Examining Specificity of Atypical N170 Response to Face Processing
Overall, when compared to TD controls, ASD groups did not show differences in N170 latency (g=0.51, k=9, 95% [CI −0.14, 1.16], Z=1.55, p=0.12) or amplitude (g=0.11, k=10, 95% CI [−0.14, 0.36], Z=0.86, p=0.39) to non-faces, or P1 latency (g=0.18, k=9, 95% [CI −0.09, 0.46], Z=1.29, p=0.20) or amplitude (g=−0.12, k=8, 95% CI [−0.58, 0.35], Z=−0.49, p=0.62) to faces (see Supplement).
Discussion
This is the first meta-analysis examining N170 response to faces in individuals with ASD relative to TD individuals. A small but significant and specific effect of prolonged N170 latency was found for ASD populations. Substantial heterogeneity was found across ESs for N170 latency; however, none of the proposed moderators (age, sex ratio, cognitive ability, presence of gold-standard diagnosis) accounted for this variance. For N170 amplitude, there was no difference between ASD and TD. Again, substantial heterogeneity was found; relatively smaller N170 amplitudes in ASD were found for older participants and those with higher cognitive ability.
While there were no differences in the magnitude (amplitude) of ERP-indexed face processing, there were significant differences in the speed (latency) of this response between ASD and TD individuals. This latency difference was unique to faces and, in terms of early visual components, to the N170 specifically. This finding suggests that, on the whole, individuals with ASD may be investing comparable basic neural resources to discriminating and processing facial information (67), albeit at a slowed pace.
This slower or more inefficient processing of facial information may arise from neurobiological and electrophysiological abnormalities in ASD. For example, differential EEG band power and coherence, hemispheric asymmetry in power across frequency bands, and differential structural connectivity (68) can impact the observed latency of early ERP components (e.g., via oscillatory phase synchrony across frequencies) (69), and should be examined in future ASD studies, particularly given that no tested moderator explained heterogeneity in N170 latency.
Delayed processing of faces may contribute to social deficits in ASD (19). Examining the impact of N170 latency to faces on real-world processes, such as emotion recognition performance (70), face memory (2), social functioning and social anxiety (29), will shed light on mechanisms of social difficulty in ASD.
Results indicated that N170 latency was longer for ASD relative to TD participants in both hemispheres, and with more prominent effect in older/adult samples. Development of the N170 component continues into adulthood, with mean latency faster in adults than children in normative samples (32,36,37). Our results suggest that, though mean latency also decreases with age in ASD, the lag in the ASD individuals becomes more pronounced over development, such that relative latency delays compared to TD are most clearly detected in adult samples. These findings are consonant with developmental plasticity models of ASD (71,72) that suggest individuals with ASD interact with their social world in a way that yields divergent developmental trajectories. Specifically, characteristic symptoms of ASD may lead to reduced engagement with social stimuli across childhood, and may contribute to a failure to develop neural specialization in processing social information by adulthood (7,73). Such specialization typically guides engagement in salient social experiences, which in turn further shapes development of neural specialization. Derailment of this bidirectional process may lead to disruption in normative social brain development over time (2,72). This is also supported by meta-analytic findings on facial emotion recognition performance during behavioral tasks demonstrating that relative deficits between ASD and TD increase with age (3), despite facial emotion recognition abilities improving with age even in ASD (74).
Moreover, given that this relative N170 latency lag is more prominent in the left hemisphere (non-dominant for face processing in TD), the relative specialization may be disrupted in ASD.
While attenuated (i.e., less negative) N170 amplitude did not broadly characterize ASD samples, it did tend to characterize both older and higher-IQ samples. Given the developmental neural specialization of face processing, the sensitivity of N170 amplitude as a measure of face processing may also change with development and be particularly useful in adults. The latter finding of reduced N170 amplitude in ASD in higher-IQ samples may seem counterintuitive, as IQ mitigates deficits in emotional recognition tasks (3). However, these data may be explained by potential IQ-related compensatory mechanisms in ASD (43): selective employment of compensatory social-cognitive processes to overcome deficits in earlier, automatic face processing. This notion, deemed the “hacking hypothesis” of ASD social cognition (75–77), suggests that seemingly intact social cognition may be mediated by more effortful processing of social information, rather than typical automatic pre-cognitive processing. Subsequently, increased reliance on top-down compensatory strategies among high cognitive ability individuals with ASD may further weaken the pre-cognitive processing mechanism, resulting in attenuated N170 amplitude. However, it is important to note that all participants in this study exhibited normative IQ (>70); future studies must examine how these neural responses might differ in individuals with ASD and intellectual disability.
The age effect was driven by the left hemisphere, while the effect of cognitive ability was specific to the right hemisphere. In the left hemisphere, N170 amplitude may become more sensitive in older samples to index disruption in ASD of integrative visual processing associated with left parietal cortex (78). Given evidence of reduced right lateralization of face processing in ASD (50,79), individuals with ASD may evince underdeveloped lateral specialization for faces, and higher-IQ individuals may rely on cognitive processing mechanisms.
The current review had several limitations. First, there was significant variability across included studies in terms of electrode selection and EEG setups, as well as methodological factors (e.g., differences in stimuli, sample matching, reporting peak vs. mean amplitudes, lack of converging ASD symptomatology measures). However, examining studies with IQ-matched controls resulted in same-direction N170 latency effect to faces, with reduced ES likely due to the smaller number of studies and the small magnitude of the original effect. Moreover, examining individual-level variables averaged across participants (e.g., mean age, mean IQ) may obscure individual differences in relation of these variables to the N170 that must be examined in subsequent empirical studies. Additionally, two articles in this meta-analysis may be from overlapping samples.
Future studies should use gold-standard diagnostic tools to ensure sample rigor and include continuous measures of ASD symptomatology. Crucially, while this study provides evidence of sensitivity of the N170 to face processing deficits in ASD, future studies must compare this ERP to other populations with face processing deficits (e.g., schizophrenia), as well as later face-responsive ERP components, to refine specificity (11,14).
Overall, this meta-analysis suggests delayed N170 latency to faces in ASD to be a biomarker of ASD that is sensitive, specific (in the context of facial stimulus tasks), and robust to age, sex, and cognitive functioning, suggesting pathognomonic atypical early-stage face processing. Despite no consistent N170 amplitude alteration across ASD samples, relative attenuation of N170 amplitude found in ASD may increase with age and cognitive ability. Relative lag in N170 latency may also increase with age, suggesting an important role for developmental experiences in shaping low-level neural responses. In summary, N170 is a plausible biomarker indexing neural mechanisms of face processing in ASD, and may help refine theoretical models and treatment targets by providing more reliable, objective, and rapid assessment of treatment outcome and changes over development.
Supplementary Material
Acknowledgments
The authors wish to thank Dr. Anne Moyer for her training and input on conducting the meta-analysis, Dr. Greg Hajcak for providing helpful comments, as well as authors of primary studies who kindly provided further information upon request.
EK received support from the Simons Foundation Autism Research Initiative (SFARI# 381283). EK and CMF received funding from NIMH grant R01MH110585. EL and JCM were supported by NIH U19 MH108206, R01 MH107426, and R01 MH100173. JF received support from a Brain and Behavior Research Foundation NARSAD Young Investigator Award, an Autism Science Foundation Accelerator Grant, and the Seaver Foundation. MDL received support from NIMH grant R01MH110585, the Simons Foundation Autism Research Initiative (SFARI# 381283), a Brain and Behavior Research Foundation NARSAD Young Investigator Award, Arts Connection, and the Alan Alda Fund for Communication during the course of this project.
These funders had no role in the study design, collection, analysis or interpretation of the data, writing the manuscript, or the decision to submit the paper for publication.
Footnotes
Publisher's Disclaimer: This is a PDF file of an unedited manuscript that has been accepted for publication. As a service to our customers we are providing this early version of the manuscript. The manuscript will undergo copyediting, typesetting, and review of the resulting proof before it is published in its final citable form. Please note that during the production process errors may be discovered which could affect the content, and all legal disclaimers that apply to the journal pertain.
Given the possibility of study-specific IQ discrepancies between ASD and TD samples, a separate analysis of studies that used IQ-matched control group (k=9; NASD=159, NTD=138) was run; the latency effect maintained in direction but was marginal (g=0.46, p=0.076).
Given the aforementioned possible IQ discrepancies between samples, between ASD and TD individuals, a separate analysis of studies that used IQ-matched control group (k=9; NASD=159, NTD=138) was again run; the overall amplitude effect remained nonsignificant (g=−0.061, p=0.82).
Financial Disclosures
All authors report no biomedical financial interests or potential conflicts of interest.
References
- 1.American Psychiatric Association. Diagnostic and Statistical Manual of Mental Disorders. 5th. Washington, DC: American Psychiatric Press; 2013. [Google Scholar]
- 2.McPartland J, Dawson G, Webb SJ, Panagiotides H, Carver LJ. Event-related brain potentials reveal anomalies in temporal processing of faces in autism spectrum disorder. J Child Psychol Psychiatry. 2004;45:1235–1245. doi: 10.1111/j.1469-7610.2004.00318.x. [DOI] [PubMed] [Google Scholar]
- 3.Lozier LM, Vanmeter JW, Marsh AA. Impairments in facial affect recognition associated with autism spectrum disorders: A meta-analysis. Dev Psychopathol. 2014;26:1–13. doi: 10.1017/S0954579414000479. [DOI] [PubMed] [Google Scholar]
- 4.Behrmann M, Avidan G, Leonard GL, Kimchi R, Luna B, Humphreys K, Minshew N. Configural processing in autism and its relationship to face processing. Neuropsychologia. 2006;44:110–129. doi: 10.1016/j.neuropsychologia.2005.04.002. [DOI] [PubMed] [Google Scholar]
- 5.Barton JJS, Cherkasova MV, Hefter R, Cox TA, O’Connor M, Manoach DS. Are patients with social developmental disorders prosopagnosic? Perceptual heterogeneity in the Asperger and socio-emotional processing disorders. Brain. 2004;127:1706–1716. doi: 10.1093/brain/awh194. [DOI] [PubMed] [Google Scholar]
- 6.Lahaie A, Mottron L, Arguin M, Berthiaume C, Jemel B, Saumier D. Face perception in high-functioning autistic adults: evidence for superior processing of face parts, not for a configural face-processing deficit. Neuropsychology. 2006;20:30–41. doi: 10.1037/0894-4105.20.1.30. [DOI] [PubMed] [Google Scholar]
- 7.Dawson G, Webb SJ, McPartland JC. Understanding the nature of face processing impairment in autism: insights from behavioral and electrophysiological studies. Dev Neuropsychol. 2005;27:403–424. doi: 10.1207/s15326942dn2703_6. [DOI] [PubMed] [Google Scholar]
- 8.Golan O, Ashwin E, Granader Y, McClintock S, Day K, Leggett V, Baron-Cohen S. Enhancing emotion recognition in children with autism spectrum conditions: An intervention using animated vehicles with real emotional faces. J Autism Dev Disord. 2010;40:269–279. doi: 10.1007/s10803-009-0862-9. [DOI] [PubMed] [Google Scholar]
- 9.Kandalaft MR, Didehbani N, Krawczyk DC, Allen TT, Chapman SB. Virtual reality social cognition training for young adults with high-functioning autism. J Autism Dev Disord. 2013;43:34–44. doi: 10.1007/s10803-012-1544-6. [DOI] [PMC free article] [PubMed] [Google Scholar]
- 10.Nelson CA, McCleery JP. Use of Event-Related Potentials in the Study of Typical and Atypical Development. J Am Acad Child Adolesc Psychiatry. 2008;47:1252–1261. doi: 10.1097/CHI.0b013e318185a6d8. [DOI] [PMC free article] [PubMed] [Google Scholar]
- 11.Feuerriegel D, Churches O, Hofmann J, Keage HAD. The N170 and face perception in psychiatric and neurological disorders: A systematic review. Clin Neurophysiol. 2015;126:1141–1158. doi: 10.1016/j.clinph.2014.09.015. [DOI] [PubMed] [Google Scholar]
- 12.Hinojosa JA, Mercado F, Carretié L. N170 sensitivity to facial expression: A meta-analysis. Neurosci Biobehav Rev. 2015;55:498–509. doi: 10.1016/j.neubiorev.2015.06.002. [DOI] [PubMed] [Google Scholar]
- 13.Lazar SM, Evans DW, Myers SM, Moreno-De Luca A, Moore GJ. Social cognition and neural substrates of face perception: Implications for neurodevelopmental and neuropsychiatric disorders. Behav Brain Res. 2014;263:1–8. doi: 10.1016/j.bbr.2014.01.010. [DOI] [PubMed] [Google Scholar]
- 14.McCleery A, Lee J, Joshi A, Wynn JK, Hellemann GS, Green MF. Meta-analysis of face processing event-related potentials in schizophrenia. Biol Psychiatry. 2015;77:116–126. doi: 10.1016/j.biopsych.2014.04.015. [DOI] [PubMed] [Google Scholar]
- 15.Bentin S, Allison T, Puce A, Perez E, McCarthy G. Electrophysiological Studies of Face Perception in Humans. J Cogn Neurosci. 1996;8:551–565. doi: 10.1162/jocn.1996.8.6.551. [DOI] [PMC free article] [PubMed] [Google Scholar]
- 16.Jeste SS, Nelson CA. Event related potentials in the understanding of autism spectrum disorders: An analytical review. J Autism Dev Disord. 2009;39:495–510. doi: 10.1007/s10803-008-0652-9. [DOI] [PMC free article] [PubMed] [Google Scholar]
- 17.McPartland JC. Considerations in biomarker development for neurodevelopmental disorders. Curr Opin Neurol. 2016;29:1. doi: 10.1097/WCO.0000000000000300. [DOI] [PMC free article] [PubMed] [Google Scholar]
- 18.McPartland JC, Wu J, Bailey CA, Mayes LC, Schultz RT, Klin A. Atypical neural specialization for social percepts in autism spectrum disorder. Soc Neurosci. 2011;6:436–451. doi: 10.1080/17470919.2011.586880. [DOI] [PMC free article] [PubMed] [Google Scholar]
- 19.Mendelson JL, Gates JA, Lerner MD. Friendship in School-Age Boys With Autism Spectrum Disorders: A Meta-Analytic Summary and Developmental, Process-Based Model. Psychol Bull. 2016;142:601–622. doi: 10.1037/bul0000041. [DOI] [PubMed] [Google Scholar]
- 20.Akechi H, Senju A, Kikuchi Y, Tojo Y, Osanai H, Hasegawa T. The effect of gaze direction on the processing of facial expressions in children with autism spectrum disorder: An ERP study. Neuropsychologia. 2010;48:2841–2851. doi: 10.1016/j.neuropsychologia.2010.05.026. [DOI] [PubMed] [Google Scholar]
- 21.Apicella F, Sicca F, Federico RR, Campatelli G, Muratori F. Fusiform Gyrus responses to neutral and emotional faces in children with Autism Spectrum Disorders: a High Density ERP study. Behav Brain Res. 2013;251:155–162. doi: 10.1016/j.bbr.2012.10.040. [DOI] [PubMed] [Google Scholar]
- 22.Batty M, Meaux E, Wittemeyer K, Rogé B, Taylor MJ. Early processing of emotional faces in children with autism: An event-related potential study. J Exp Child Psychol. 2011;109:430–444. doi: 10.1016/j.jecp.2011.02.001. [DOI] [PubMed] [Google Scholar]
- 23.Hileman CM, Henderson H, Mundy P, Newell L, Jaime M. Developmental and individual differences on the P1 and N170 ERP components in children with and without autism. Dev Neuropsychol. 2011;36:214–236. doi: 10.1080/87565641.2010.549870. [DOI] [PMC free article] [PubMed] [Google Scholar]
- 24.Webb SJ, Dawson G, Bernier R, Panagiotides H. ERP evidence of atypical face processing in young children with autism. J Autism Dev Disord. 2006;36:881–890. doi: 10.1007/s10803-006-0126-x. [DOI] [PMC free article] [PubMed] [Google Scholar]
- 25.Churches O, Wheelwright S, Baron-Cohen S, Ring H. The N170 is not modulated by attention in autism spectrum conditions. Neuroreport. 2010;21:399–403. doi: 10.1097/wnr.0b013e328334311b. [DOI] [PubMed] [Google Scholar]
- 26.Cygan HB, Tacikowski P, Ostaszewski P, Chojnicka I, Nowicka A. Neural correlates of own name and own face detection in autism spectrum disorder. PLoS One. 2014;9:e86020. doi: 10.1371/journal.pone.0086020. [DOI] [PMC free article] [PubMed] [Google Scholar]
- 27.O’Connor K, Hamm JP, Kirk IJ. The neurophysiological correlates of face processing in adults and children with Asperger’s syndrome. Brain Cogn. 2005;59:82–95. doi: 10.1016/j.bandc.2005.05.004. [DOI] [PubMed] [Google Scholar]
- 28.O’Connor K, Hamm JP, Kirk IJ. Neurophysiological responses to face, facial regions and objects in adults with Asperger’s syndrome: An ERP investigation. Int J Psychophysiol. 2007;63:283–293. doi: 10.1016/j.ijpsycho.2006.12.001. [DOI] [PubMed] [Google Scholar]
- 29.Webb SJ, Merkle K, Murias M, Richards T, Aylward E, Dawson G. ERP responses differentiate inverted but not upright face processing in adults with ASD. Soc Cogn Affect Neurosci. 2012;7:578–587. doi: 10.1093/scan/nsp002. [DOI] [PMC free article] [PubMed] [Google Scholar]
- 30.Faja S, Dawson G, Aylward E, Wijsman EM, Webb SJ. Early event-related potentials to emotional faces differ for adults with autism spectrum disorder and by serotonin transporter genotype. Clin Neurophysiol. 2016;127:2436–2447. doi: 10.1016/j.clinph.2016.02.022. [DOI] [PMC free article] [PubMed] [Google Scholar]
- 31.Grice SJ, Halit H, Farroni T, Baron-Cohen S, Bolton P, Johnson MH. Neural Correlates of Eye-Gaze Detection in Young Children with Autism. Cortex. 2005;41:342–353. doi: 10.1016/s0010-9452(08)70271-5. [DOI] [PubMed] [Google Scholar]
- 32.Gunji A, Inagaki M, Inoue Y, Takeshima Y, Kaga M. Event-related potentials of self-face recognition in children with pervasive developmental disorders. Brain Dev. 2009;31:139–147. doi: 10.1016/j.braindev.2008.04.011. [DOI] [PubMed] [Google Scholar]
- 33.Neuhaus E, Kresse A, Faja S, Bernier RA, Webb SJ. Face processing among twins with and without autism: social correlates and twin concordance. Soc Cogn Affect Neurosci. 2016;11:44–54. doi: 10.1093/scan/nsv085. [DOI] [PMC free article] [PubMed] [Google Scholar]
- 34.Senju A, Tojo Y, Yaguchi K, Hasegawa T. Deviant gaze processing in children with autism: An ERP study. Neuropsychologia. 2005;43:1297–1306. doi: 10.1016/j.neuropsychologia.2004.12.002. [DOI] [PubMed] [Google Scholar]
- 35.Wong TKW, Fung PCW, Chua SE, McAlonan GM. Abnormal spatiotemporal processing of emotional facial expressions in childhood autism: Dipole source analysis of event-related potentials. Eur J Neurosci. 2008;28:407–416. doi: 10.1111/j.1460-9568.2008.06328.x. [DOI] [PubMed] [Google Scholar]
- 36.Taylor MJ, McCarthy G, Saliba E, Degiovanni E. ERP evidence of developmental changes in processing of faces. Clin Neurophysiol. 1999;110:910–915. doi: 10.1016/s1388-2457(99)00006-1. [DOI] [PubMed] [Google Scholar]
- 37.Taylor MJ, Batty M, Itier RJ. The faces of development: a review of early face processing over childhood. J Cogn Neurosci. 2004;16:1426–1442. doi: 10.1162/0898929042304732. [DOI] [PubMed] [Google Scholar]
- 38.Christensen DL, Baio J, Braun KVN, Bilder D, Charles J, Constantino JN, et al. Prevalence and characteristics of Autism Spectrum Disorder among children aged 8 Years - Autism and Developmental Disabilities Monitoring Network, 11 Sites, United States, 2012. Morb Mortal Wkly report Surveill Summ. 2016;65:1–23. doi: 10.15585/mmwr.ss6503a1. [DOI] [PMC free article] [PubMed] [Google Scholar]
- 39.Halladay AK, Bishop S, Constantino JN, Daniels AM, Koenig K, Palmer K, et al. Sex and gender differences in autism spectrum disorder: summarizing evidence gaps and identifying emerging areas of priority. Mol Autism. 2015;6:36. doi: 10.1186/s13229-015-0019-y. [DOI] [PMC free article] [PubMed] [Google Scholar]
- 40.Chawarska K, Macari S, Powell K, DiNicola L, Shic F. Enhanced Social Attention in Female Infant Siblings at Risk for Autism. J Am Acad Child Adolesc Psychiatry. 2016;55:188–195. doi: 10.1016/j.jaac.2015.11.016. [DOI] [PMC free article] [PubMed] [Google Scholar]
- 41.Kothari R, Skuse D, Wakefield J, Micali N. Gender differences in the relationship between social communication and emotion recognition. J Am Acad Child Adolesc Psychiatry. 2013;52 doi: 10.1016/j.jaac.2013.08.006. [DOI] [PMC free article] [PubMed] [Google Scholar]
- 42.Coffman MC, Anderson LC, Naples AJ, McPartland JC. Sex differences in social perception in children with ASD. J Autism Dev Disord. 2015;45:589–599. doi: 10.1007/s10803-013-2006-5. [DOI] [PMC free article] [PubMed] [Google Scholar]
- 43.Rutherford MD, Troje NF. IQ predicts biological motion perception in autism spectrum disorders. J Autism Dev Disord. 2012;42:557–565. doi: 10.1007/s10803-011-1267-0. [DOI] [PubMed] [Google Scholar]
- 44.Lord C, Rutter M, DiLavore P, Risi S, Gotham K, Bishop S. Autism Diagnostic Observation Schedule–2nd edition (ADOS-2) Los Angeles: Western Psychological Services; 2012. [Google Scholar]
- 45.Rutter M, Le Couteur A, Lord C. Autism diagnostic interview-revised. Los Angeles: Western Psychological Services; 2003. [Google Scholar]
- 46.Geschwind DH, Levitt P. Autism spectrum disorders: developmental disconnection syndromes. Curr Opin Neurobiol. 2007;17:103–111. doi: 10.1016/j.conb.2007.01.009. [DOI] [PubMed] [Google Scholar]
- 47.de Haan M, Nelson CA. Recognition of the mother’s face by six-month-old infants: a neurobehavioral study. Child Dev. 1997;68:187–210. [PubMed] [Google Scholar]
- 48.de Schonen S, Mathivet E. First come, first served: A scenario about the development of hemispheric specialization in face recognition during infancy. Eur Bull Cogn Psychol. 1989;9:3–44. [Google Scholar]
- 49.Jemel B, Mottron L, Dawson M. Impaired face processing in autism: Fact or artifact? J Autism Dev Disord. 2006;36:91–106. doi: 10.1007/s10803-005-0050-5. [DOI] [PubMed] [Google Scholar]
- 50.Schultz RT, Gauthier I, Klin A, Fulbright RK, Anderson AW, Volkmar F, et al. Abnormal ventral temporal cortical activity during face discrimination among individuals with autism and Asperger syndrome. Arch Gen Psychiatry. 2000;57:331–340. doi: 10.1001/archpsyc.57.4.331. [DOI] [PubMed] [Google Scholar]
- 51.Dundas EM, Plaut DC, Behrmann M. The joint development of hemispheric lateralization for words and faces. J Exp Psychol Gen. 2013;142:348–58. doi: 10.1037/a0029503. [DOI] [PMC free article] [PubMed] [Google Scholar]
- 52.Moher D, Liberati A, Tetzlaff J, Altman DG, Group TP Preferred Reporting Items for Systematic Reviews and Meta-Analyses: The PRISMA Statement. PloS Med. 2009;6 doi: 10.1371/journal.pmed1000097. [DOI] [PMC free article] [PubMed] [Google Scholar]
- 53.Khorrami A, Tehrani-Doost M, Esteky H. Comparison between Face and Object Processing in Youths with Autism Spectrum Disorder: An event related potentials study. Iran J Psychiatry. 2013;8:179–187. [PMC free article] [PubMed] [Google Scholar]
- 54.Borenstein M, Hedges L, Higgings J, Rothstein H, Englewood NJ. Comprehensive meta-analysis, Version 3. A computer program for meta-analysis 2015 [Google Scholar]
- 55.Schmidt FL, Oh I-S, Hayes TL. Fixed- versus random-effects models in meta-analysis: model properties and an empirical comparison of differences in results. Br J Math Stat Psychol. 2009;62:97–128. doi: 10.1348/000711007X255327. [DOI] [PubMed] [Google Scholar]
- 56.Cohen J. A power primer. Psychol Bull. 1992;112:155–159. doi: 10.1037//0033-2909.112.1.155. [DOI] [PubMed] [Google Scholar]
- 57.Higgins J, Green S. Higgins JPT, Green S (editors) Cochrane Handbook for Systematic Reviews of Interventions Version 5.1.0. The Cochrane Collaboration; 2011. Version 5. (J. Higgins & S. Green, editors) 2011. Retrieved from www.handbook.cochrane.org. [Google Scholar]
- 58.Egger M, Davey Smith G. Bias in location and selection of studies. BMJ Br Med J. 1998;316:61–66. doi: 10.1136/bmj.316.7124.61. [DOI] [PMC free article] [PubMed] [Google Scholar]
- 59.Ferguson CJ, Brannick MT. Publication bias in psychological science: Prevalence, methods for identifying and controlling, and implications for the use of meta-analyses. Psychol Methods. 2012;17:120–128. doi: 10.1037/a0024445. [DOI] [PubMed] [Google Scholar]
- 60.Lipsey MW, Wilson D. Practical Meta Analysis. 49th. Thousand Oaks, CA: SAGE Publications, Inc.; 2001. [Google Scholar]
- 61.Huedo-Medina TB, Sánchez-Meca J, Marín-Martínez F, Botella J. Assessing heterogeneity in meta-analysis: Q statistic or I2 index? Psychol Methods. 2006;11:193–206. doi: 10.1037/1082-989X.11.2.193. [DOI] [PubMed] [Google Scholar]
- 62.Borenstein M, Hedges LV, Higgins JPT, Rothstein HR. Introduction to Meta-Analysis. Chichester, UK: John Wiley & Sons, Ltd; 2009. [Google Scholar]
- 63.Churches O, Damiano C, Baron-Cohen S, Ring H. Getting to know you: the acquisition of new face representations in autism spectrum conditions. Neuroreport. 2012;23:668–672. doi: 10.1097/WNR.0b013e3283556658. [DOI] [PubMed] [Google Scholar]
- 64.Churches O, Baron-Cohen S, Ring H. The psychophysiology of narrower face processing in autism spectrum conditions. Neuroreport. 2012;23:395–399. doi: 10.1097/WNR.0b013e3283525bc8. [DOI] [PubMed] [Google Scholar]
- 65.Tye C, Mercure E, Ashwood KL, Azadi B, Asherson P, Johnson MH, et al. Neurophysiological responses to faces and gaze direction differentiate children with ASD, ADHD and ASD + ADHD. Dev Cogn Neurosci. 2013;5:71–85. doi: 10.1016/j.dcn.2013.01.001. [DOI] [PMC free article] [PubMed] [Google Scholar]
- 66.Tye C, Battaglia M, Bertoletti E, Ashwood KL, Azadi B, Asherson P, et al. Altered neurophysiological responses to emotional faces discriminate children with ASD, ADHD and ASD plus ADHD. Biol Psychol. 2014;103:125–134. doi: 10.1016/j.biopsycho.2014.08.013. [DOI] [PubMed] [Google Scholar]
- 67.Kok A. Event-related-potential (ERP) reflections of mental resources: A review and synthesis. Biol Psychol. 1997;45:19–56. doi: 10.1016/s0301-0511(96)05221-0. [DOI] [PubMed] [Google Scholar]
- 68.Wang J, Barstein J, Ethridge LE, Mosconi MW, Takarae Y, Sweeney JA. Resting state EEG abnormalities in autism spectrum disorders. J Neurodev Disord. 2013;5:1–14. doi: 10.1186/1866-1955-5-24. [DOI] [PMC free article] [PubMed] [Google Scholar]
- 69.Gruber WR, Klimesch W, Sauseng P, Doppelmayr M. Alpha phase synchronization predicts P1 end N1 latency and amplitude size. Cereb Cortex. 2005;15:371–377. doi: 10.1093/cercor/bhh139. [DOI] [PubMed] [Google Scholar]
- 70.Lerner MD, McPartland JC, Morris JP. Multimodal emotion processing in autism spectrum disorders: An event-related potential study. Dev Cogn Neurosci. 2013;3:11–21. doi: 10.1016/j.dcn.2012.08.005. [DOI] [PMC free article] [PubMed] [Google Scholar]
- 71.Kang E, Durand S, LeBlanc JJ, Hensch TK, Chen C, Fagiolini M. Visual acuity development and plasticity in the absence of sensory experience. J Neurosci. 2013;33:17789–96. doi: 10.1523/JNEUROSCI.1500-13.2013. [DOI] [PMC free article] [PubMed] [Google Scholar]
- 72.Klin A, Jones W, Schultz R, Volkmar F. The enactive mind, or from actions to cognition: lessons from autism. Philos Trans R Soc Lond B Biol Sci. 2003;358:345–60. doi: 10.1098/rstb.2002.1202. [DOI] [PMC free article] [PubMed] [Google Scholar]
- 73.Dawson G. Early behavioral intervention, brain plasticity, and the prevention of autism spectrum disorder. Dev Psychopathol. 2008;20:775–803. doi: 10.1017/S0954579408000370. [DOI] [PubMed] [Google Scholar]
- 74.Trevisan DA, Birmingham E. Are emotion recognition abilities related to everyday social functioning in ASD? A meta-analysis. Res Autism Spectr Disord. 2016;32:24–42. [Google Scholar]
- 75.Bowler DM. “Theory of Mind” in Asperger syndrome. J Child Psychol Psychiatry. 1992;33:877–893. doi: 10.1111/j.1469-7610.1992.tb01962.x. [DOI] [PubMed] [Google Scholar]
- 76.Happé FG. The role of age and verbal ability in the theory of mind task performance of subjects with autism. Child Dev. 1995;66:843–855. [PubMed] [Google Scholar]
- 77.Dissanayake C, Macintosh K. Mind reading and social functioning in children with autistic disorder and Asperger’s disorder. In: B Repacholi B, Slaughter V, editors. Individual differences in theory of mind implications for typical and atypical development. New York, NY: Psychology Press; 2003. pp. 213–239. [Google Scholar]
- 78.Hellige JB, Laeng B, Michimata C. Processing Asymmetries in the Visual System. In: Hugdahl K, Westerhausen R, editors. The Two Halves of the Brain. Cambridge, MA: MIT Press; 2010. pp. 379–416. [Google Scholar]
- 79.Pierce K, Müller RA, Ambrose J, Allen G, Courchesne E. Face processing occurs outside the fusiform “face area” in autism: evidence from functional MRI. Brain a J Neurol. 2001;124:2059–2073. doi: 10.1093/brain/124.10.2059. [DOI] [PubMed] [Google Scholar]
Associated Data
This section collects any data citations, data availability statements, or supplementary materials included in this article.