Abstract
Amide proton transfer (APT) imaging is a variation of chemical exchange saturation transfer (CEST) MRI which has shown promise in diagnosing tumor, ischemic stroke, multiple sclerosis, and traumatic brain injury etc. Specific quantification of APT effect is crucial for the interpretation of APT contrast in pathologies. Conventionally, magnetization transfer ratio with asymmetric analysis (MTRasym) has been used to quantify APT effect. However, some studies indicate that MTRasym is contaminated by water longitudinal relaxation time (T1w) and thus it is necessary to normalize T1w in MTRasym to obtain specific quantification of APT effect. Until now, whether to use MTRasym or the T1w normalized MTRasym is still under debate in the field. In this paper, the influence of T1w on the quantification of APT was evaluated through theoretical analysis, numerical simulations, and phantom studies for different experimental conditions. Results indicate that there are two types of T1w effects (T1w recovery and T1w-related saturation) which have inverse influences on the steady-state MTRasym. In situations with no or weak direct water saturation (DS) effect, there is only T1w recovery effect and MTRasym linearly depends on T1w. In contrast, in situations with significant DS effects, the dependence of MTRasym on T1w is complex, which is dictated by the competition of these two T1w effects. Therefore, by choosing appropriate irradiation powers, MTRasym could be roughly insensitive to T1w. Moreover, in non-steady-state acquisitions with very short irradiation time, MTRasym is also roughly insensitive to T1w. Therefore, for the steady-state APT imaging at high fields or with very low irradiation powers where there are no significant DS effects, it is necessary to normalize T1w to improve the specificity of MTRasym. However, on clinical MRI systems (usually low fields or non-steady-state acquisitions), T1w normalization may not be necessary when appropriate sequence parameters are chosen.
Keywords: MRI, chemical exchange saturation transfer (CEST), amide proton transfer (APT), T1w normalization
Graphical Abstract

MTRasym from two creatine samples with pH 6.3 (mimicking amide) with different T1w shows that it has complex dependencies on T1w. The steady-state MTRasym (a) are sensitive to T1w at relatively lower powers, but are roughly insensitive to T1w at relatively higher powers. The non-steady-state MTRasym (dashed line in (b)) are relatively insensitive to T1w compared with the steady-state MTRasym with the same powers (solid line in (b)).
INTRODUCTION
Chemical Exchange Saturation Transfer (CEST) is a sensitivity enhancement mechanism that has shown great potentials in imaging molecules in millimolar range (1–3). In CEST imaging, an irradiation RF pulse is applied at the frequency offset of exchangeable protons of solute molecules and the subsequent chemical exchange between those saturated protons and water protons reduces the magnitude of the measured water signal. Because water is significantly more abundant than the solutes, the detection sensitivity to exchanging protons by measuring water signal is magnified. Previously, CEST effects have been observed for a number of endogenous and exogenous molecules (4–12), and have been found to be sensitive to tissue pH (13,14). Amide proton transfer (APT) is an important application of CEST imaging, which detects the chemical exchange between backbone amide protons of proteins/peptides and water protons (14). In the last decade, APT has been applied to diagnose tumors (5,15–18), ischemic stroke (19–22), multiple sclerosis (23), and traumatic brain injury (24,25).
However, CEST is an indirect method to detect solute molecules or pH through measurements of water signals, and thus depends on multiple other tissue parameters including direct water saturation (DS), semi-solid magnetization transfer (MT), and water longitudinal relaxation time (T1w). Those non-exchange related factors may vary in pathologies, which reduces the specificity of CEST imaging and may lead to misinterpretations. To remove contaminations from these factors, a reference signal that ideally has the same contributions from DS and semi-solid MT effects, but without chemical exchange, is required to compare to the exchange-labeled signal. Conventionally, the difference in the label and reference signals normalized to a control signal with no saturating pulses, termed CEST ratio (CESTR), was used to quantify the CEST effect. The CESTR was also named magnetization transfer ratio with asymmetric analysis (MTRasym) when the reference signal is obtained from the offset frequency symmetric about the water resonance (3). However, CEST, DS, and non-specific MT effects have mutual interactions, and do not add linearly (26). Thus CESTR cannot fully remove the DS and MT effects (26–28). Recently, Zaiss et al. introduced an alternative analysis of CEST data, which subtracts the reciprocals of the label and reference signals obtained in steady state and normalize water longitudinal relaxation time (T1w), to address the non-specificities associated with CESTR. This method is termed apparent exchange-dependent relaxation (AREX) (26–28), and its specificity has been previously evaluated through simulations, phantom, and animal studies (26,29,30).
Although AREX is specific, it requires special hardware for long-time RF irradiation as well as measurement of water longitudinal relaxation time (T1w=1/R1w) which lengthen the total imaging time. Therefore, CESTR, as a simple and effective metric to remove most of the influence (0th order effect) from DS and semi-solid MT effects, is still widely used especially in clinical applications (31–35). However, the T1w normalization in AREX and a previous defined CESTR under weak saturation pulse approximation (3) suggest that CESTR depends on T1w. This raises a concern whether there is a need to normalize T1w in CESTR.
Here, the influence of T1w on CESTR quantification of APT was evaluated through theoretical analysis, numerical simulations, and phantom studies for different experimental conditions. This study will provide insights into the specificity of APT imaging and guide MRI researchers and radiologists to choose appropriate CEST quantification metrics.
THEORY
Steady-state CESTR under an approximation of weak saturation pulse and complete saturation
CESTR is defined by (3),
| (1) |
where Δω is the RF frequency offset from water resonance frequency. Slab(Δω), Sref(Δω), and S0 are the label, reference, and non-irradiated control signals, respectively. A previous study indicates that CESTR can be described by the following Eq. (2) under an approximation of weak saturation pulse and complete saturation, and also with spin system in steady state (3),
| (2) |
where fs and ksw are the solute concentration and exchange rate, respectively. The steady-state acquisition can usually be obtained with RF irradiation time (tp) > 5T1w. For slow exchanging pool (fsksw < R1w), Eq. (2) could be approximated by,
| (3) |
Eq. (3) suggests that T1w normalization is required in CESTR to obtain specific quantification of exchanging effect. However, under this weak saturation pulse approximate, there is no DS effect, and thus both Eq. (2) and Eq. (3) may be too simple to provide a correct T1w dependence for in vivo CESTR.
Steady-state CESTR with DS and semi-solid MT effects
Zaiss et al. (26,27) have shown that water, chemical exchange, and semi-solid MT effects acquired in steady state can be described simultaneously by superimposing their rotating frame relaxations (when the exchanging solute concentration is much less than 1),
| (4) |
where R1ρ(Δω), Rcestex(Δω), and RMTex(Δω) are water longitudinal relaxation, chemical exchange, and semi-solid MT effects in the rotating frame, respectively; fm is the semi-solid component concentration. Rcestex(Δω), Reff, and R1ρ(Δω) can be described by the following Eq. (5), Eq. (6), and Eq. (7), respectively,
| (5) |
| (6) |
| (7) |
with
where ω1 is the RF irradiation power; R2w (1/T2w) and R2s (1/T2s) are the transverse relaxation rate of water and solute, respectively; Δ is solute resonance frequency; Sss(Δω) is the steady-state CEST signal which represents either Slab(Δω) or Sref(Δω); R1obs is the apparent water longitudinal relaxation rate in the presence of semi-solid MT effect, which can be obtained by (R1w + fmR1m)/(1+fm) in which R1m is the longitudinal relaxation rate of the semi-solid component (26). Here, Rcestex can be looked as the product of fs, ksw, and labeling efficiency (27), which can represent pure CEST effect that depends only on solute exchanging parameters and sequence parameters but not non-specific tissue parameters. By substituting R1ρ(Δω) in Eq. (4) with Eq. (7), and expanding it in powers of Rcestex(Δω), we can obtain,
| (8) |
In APT imaging in biological tissues, Rcestex is much less than Reff (Sup. Table S1 shows the calculated Rcestex with complete saturation (=fsksw) and Reff for different experimental conditions using Eq. (5) and Eq. (6), respectively, with parameters mimicking amide and tissue water). Therefore, the first two items of the series in Eq. (8) dominate Sss. Assuming Rcestex(Δω) is zero in the reference signal, we can obtain Sref in steady state,
| (9) |
By further substituting Eq. (1) with Eq. (8) and Eq. (9), we can derive CESTR for a more complex model with DS and semi-solid MT effects,
| (10) |
From Eq. (8) and Eq. (10), we find that CESTR only removes the 0th order term, but not higher order terms of the non-exchange related factors, which thus still depends on DS and semi-solid MT effects. Eq. (10) also provides an approximate model for the steady-state CESTR signal which shows the relationship between CESTR and the pure CEST effect quantified by Rcestex.
Dependence of the steady-state CESTR with DS effect on R1w.
To be simple, we ignore the semi-solid MT effect in Eq. (10). Then we substitute Eq (10) with Eq. (6), replace R1obs with R1w, and obtain,
| (11) |
Eq. (3) suggests that there is a T1w scaling effect under an approximation of weak saturation pulse. Since there are no DS and semi-solid MT effects in Eq. (3), the CESTR in Eq. (3) should be determined only by the decrease of water signal due to chemical exchange and the recovery of water signal due to T1w. Thus we name this T1w effect in Eq. (3) as T1w recovery effect here. Furthermore, since T1w recovery exists in all spin systems, it should also present when there are DS and semi-solid MT effects. Therefore, the first item in Eq. (11) should represent the T1w recovery effect. By comparing Eq. (11) with Eq. (3), we find that except the T1w recovery effect, there is another T1w effect which indirectly influences CESTR through the DS effect. Here, we name this T1w effect as T1w-related saturation effect. From Eq. (11), we also know that the two T1w effects have inverse influences on CESTR, which may result in different T1w dependence as that given by Eq. (3). The two competing T1w effects suggest that T1w normalization may not be generally required in CESTR. Eq. (11) also suggests that except R1w, the DS effect also depends on R2w and Δω/ω1.
Dependence of the non-steady-state CESTR on R1w
The non-steady-state CEST signals (tp << 5T1w) with long recovery time (trec > 5T1w, trec is the recovery time between the end the acquisition module and the beginning of next RF irradiation pulse) were previously described by (27,36),
| (12) |
where Snss is the water signal acquired in the non-steady-state CEST imaging.
In some non-steady-state CEST imaging especially in clinic, both tp (usually from 200 ms to 1000 ms) and trec (~2 s) are less than 5T1w (31–35). As a result: (1) the control scan will obtain a non-equilibrium signal (Sunsat) which is less than S0; (2) the initial signal before the RF irradiation (Si) is not equal to S0 (37). In this case, Eq. (12) becomes,
| (13) |
Eq. (13) can be rewritten as
| (14) |
When tp << 1/R1ρ,
| (15) |
By assuming Rcestex(Δω) is zero in the reference scan, the non-steady-state CESTR can be derived as,
| (16) |
When trec > 5T1w, Si = Sunsat = S0. Then CESTR = Rcestex(Δω)tp which is independent of T1w. When trec < 5T1w and because tp << 5T1w, Si ≈ Sunsat < S0. Then, CESTR could be also roughly independent of T1w.
METHODS
Numerical simulations
Numerical simulations were used to evaluate these two competing T1w effects and to validate the approximate model given in Eq. (10) and Eq. (11). Two-pool (solute and water) model numerical simulations were performed with a continuous wave (CW) CEST sequence with a series of ω1 (1 μT, 2 μT, 3 μT, 4 μT, and 5 μT) and T1w (0.5 s, 1 s, 1.5 s, 2 s, and 2.5 s). The irradiation time is 8 s for steady states and 0.5 s for non-steady states. Table 1 lists the simulation parameters mimicking APT imaging. All CESTR were calculated by using the asymmetric analysis. So in following sections, we use MTRasym to represent CESTR.
Table 1.
Parameters for the two-pool model numerical simulations with pool concentration (f), exchange rate (k), longitudinal relaxation time (T1), transverse relaxation time (T2), and resonance frequency offset for each pool (Δr). Water content is set to be 1.
| f | k (s−1) | T1 (s) | T2 (ms) | Δr (ppm) | |
|---|---|---|---|---|---|
| Solute | 0.001 | 50 | 1.5 | 15 | - |
| Water | 1 | - | 0.5, 1, 1.5, 2, 2.5 | 50 | 0 |
(a) To study the T1w recovery effect in Eq. (10) and Eq. (11) separately, we plotted the steady-state MTRasym vs. T1w with Δω set to be 100ω1 to satisfy the condition of ω1 << Δω. We also plotted 1/R1w vs. T1w in the same figure and scaled it for comparison with the curve of MTRasym vs. T1w.
(b) To study the T1w-related saturation effect in Eq. (10) and Eq. (11) separately, we plotted the steady-state MTRasym·R1w vs. T1w with: (1) Δω set to be 10ω1, 5ω1, and 2ω1 with T2w of 50 ms, respectively; (2) T2w set to be 10 ms, 30 ms, 50 ms, 70 ms, 100 ms, and 150 ms with Δω/ω1 of 5, respectively. The product of MTRasym and R1w was used to remove the T1w recovery effect so that it only shows the T1w-related saturation effect. (Sref/S0)2 vs. T1w was also plotted in the same figure and scaled for comparison with the curve of MTRasym·R1w vs. T1w. (Sref/S0)2 was obtained through numerical simulations with RF offset symmetric about the water resonance against CEST effects.
(c) To study how the two T1w effects in Eq. (10) and Eq. (11) influence the steady-state MTRasym, we plotted the steady-state MTRasym vs. T1w with: (1) Δω set to be 10ω1, 5ω1, and 2ω1 with T2w of 50 ms, respectively; (2) T2w set to be 10 ms, 30 ms, 50 ms, 70 ms, 100 ms, and 150 ms with Δω/ω1 of 5, respectively.
(d) To study whether the approximate model of MTRasym in Eq. (10) is valid, we compared the steady-state MTRasym with (Sref/S0)2Rcestex/R1w for different experimental conditions, in which the steady-state MTRasym and (Sref/S0)2 were from simulations, and Rcestex was calculated using Eq. (5) with the same parameters as those in the simulation.
(e) To study the dependence of the non-steady-state MTRasym in Eq. (16) on T1w, we plotted the non-steady-state MTRasym vs. T1w with: (1) Δω set to be 10ω1, 5ω1, and 2ω1 with T2w of 50 ms, respectively; (2) T2w set to be 10 ms, 30 ms, 50 ms, 70 ms, 100 ms, and 150 ms with Δω/ω1 of 5, respectively. tp was 0.5 s for the non-steady-state acquisition. For the simulation of the non-steady-state acquisition with short recovery time, trec was 1.5 s and the Z component of water signal before recovery was set to 0 by assuming a 90° excitation for the readout.
The coupled Bloch equations can be written as , where A is a 6 × 6 matrix for the two-pool model. The water and solute pools each has three coupled equations representing their x, y, and z components. All numerical calculations of CEST signals integrated the differential equations through the sequence using the ordinary differential equation solver (ODE45) in MATLAB 2014a (Mathworks, Natick, MA, USA).
Sample preparation and MRI
Two creatine samples served to evaluate the dependence of MTRasym on T1w. Creatine was added to phosphate-buffered saline (PBS) solution to reach a concentration of 100 mM, and the pH of the solution was titrated to 6.3 by using NaoH/HCl. The solution was then transferred into two tubes. 0.075 mM and 0.05 mM MnCl2 were added to the two tubes (samples #1 and #2), respectively, to vary T1w. At room temperature and with pH of 6.3, creatine is in the slow exchange regime (38,39). The resonance frequency offsets of creatine amines and protein amides are at around 1.9 ppm and 3.5 ppm, respectively. So the Δ of creatine at 4.7 T (380 Hz) is close to that of amide at 3 T (447 Hz). Therefore, experiments on creatine at 4.7 T can be used to mimic amide at clinical 3 T.
All measurements on creatine samples were performed at a Varian 4.7 T MRI system with a 38-mm Doty coil (Doty Scientific Inc. Columbia, SC, USA) for both transmission and reception. CEST measurements were performed by applying a CW RF irradiation before free induction decay (FID) acquisition. An 8-s irradiation pulse was performed for steady-state acquisitions, and a 0.5-s irradiation pulse was performed for non-steady-state acquisitions. TR was 10 s for both the steady-state acquisition and the non-steady-state acquisition. Slab, Sref, and S0 were acquired with RF offsets at 1.9 ppm, −1.9 ppm, and 500 ppm, respectively. MTRasym was calculated using Eq. (1). T1w were obtained using an inversion recovery sequence. T2w were obtained using a multiple echo sequence.
RESULTS
T1w recovery effect and T1w-related saturation effect
Fig. 1 shows the simulated steady-state MTRasym vs. T1w for the condition of ω1 << Δω (no DS effect). Note that the curves of MTRasym vs. T1w match the curve of 1/R1w vs. T1w, indicating that MTRasym linearly depends on T1w, which confirms the presence of the T1w recovery effect. Fig. 2 shows the simulated steady-state MTRasymR1w vs. T1w for a series of Δω/ω1 (with DS effect) and T2w. Note that different from Fig. 1, MTRasymR1w in Fig. 2 inversely depends on T1w, suggesting the presence of other T1w effects. Also note that the curves of MTRasymR1w vs. T1w match the curve of (Sref/S0)2 vs. T1w, indicating that MTRasymR1w may depend on DS effect regulated by T1w, which confirms the presence of T1w-related saturation effect. It was also found that both MTRasymR1w and (Sref/S0)2 values are smaller for lower Δω/ω1 values (see Fig. 2a-2c) and shorter T2w values (see Fig. 2d-2i), suggesting that MTRasymR1w also depends on DS effect regulated by Δω/ω1 and T2w.
FIG. 1.
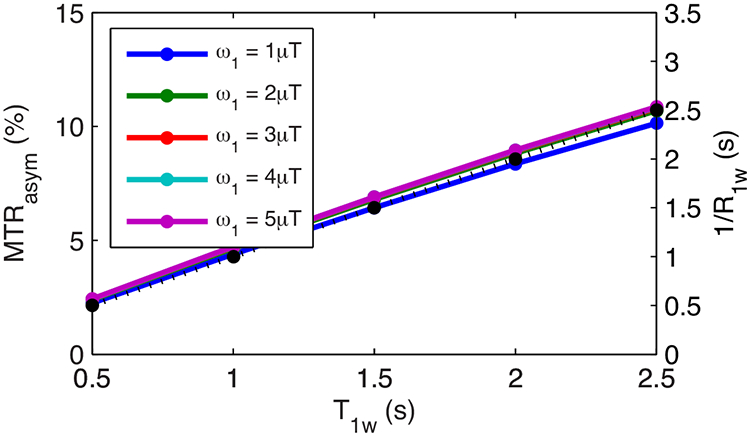
Steady-state MTRasym vs. T1w for ω1 << Δω (Δω/ω1=100) with a series of ω1 (solid lines) as well as 1/R1w vs. T1w (dotted line). Note that the lines with different ω1 are indicated by different colors, which overlap. Also note that the solid lines and the dotted line overlap.
FIG. 2.
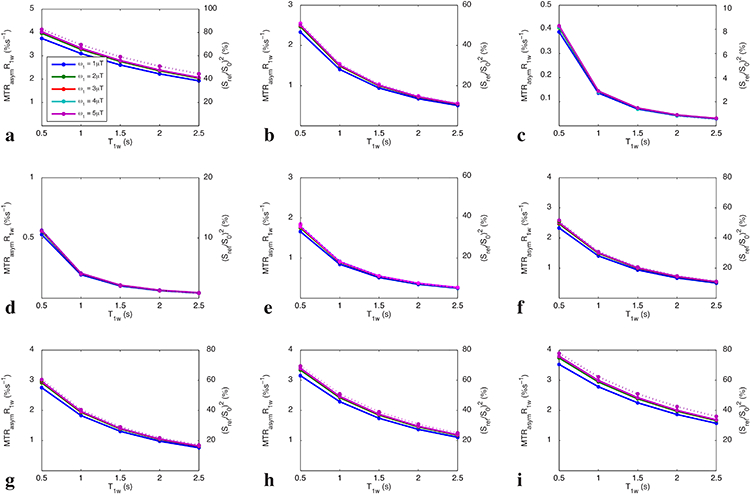
Steady-state MTRasymR1w vs. T1w for Δω/ω1=10, 5, and 2 with T2w of 50 ms (a-c), as well as for T2w = 10 ms, 30 ms, 50 ms, 70 ms, 100 ms, and 150 ms with Δω/ω1=5 (d-i). Solid lines represent the simulated MTRasymR1w, and the dotted line represents the simulated (Sref/S0)2. Note that the lines with different ω1 are indicated by different colors, which overlap. Also note that the solid lines and the dotted line overlap.
Dependence of the steady-state MTRasym on T1w with DS effect.
Fig. 3 shows the simulated steady-state MTRasym vs. T1w for a series of Δω/ω1 and T2w. Note that the curves of MTRasym vs. T1w are relatively flat in Fig. 3b and Fig. 3e-3h, suggesting that the two competing T1w effects may result in the rough independence of MTRasym on T1w by choosing appropriate sequence parameters. In Fig. 3a and 3i, MTRasym increases with T1w which is due to that the T1w recovery effect dominates the T1w-related saturation effect when Δω/ω1 is relatively higher or T2w is relatively longer and thus the DS effect is relatively weaker. In Fig. 3c and 3d, MTRasym decreases with T1w which is due to that the T1w-related saturation effect dominates the T1w recovery effect when Δω/ω1 is relatively lower or T2w is relatively shorter and thus the DS effect is relatively greater. Fig. 4 shows the measured steady-state MTRasym from two creatine samples with different T1w. Note that the steady-state MTRasym increases with T1w with lower ω1, but becomes roughly insensitive to T1w with higher ω1.
FIG. 3.
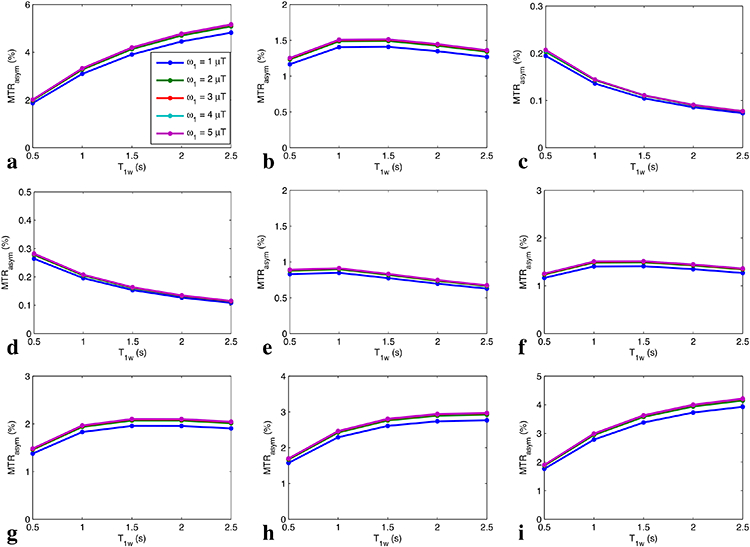
Steady-state MTRasym vs. T1w for Δω/ω1=10, 5, and 2 with T2w of 50 ms (a-c), as well as for T2w = 10 ms, 30 ms, 50 ms, 70 ms, 100 ms, and 150 ms with Δω/ω1=5 (d-i). Note that the lines with different ω1 are indicated by different colors, which overlap.
FIG. 4.
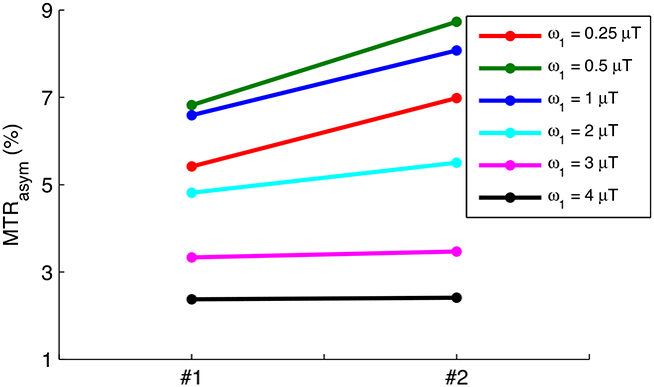
Measured steady-state MTRasym from two creatine samples with different T1w. T1w and T2w were measured to be (0.9 s and 88 ms) and (1.2 s and 132 ms) for sample #1 and #2, respectively.
An approximate model of MTRasym
Fig. 5 shows the simulated steady-state MTRasym and (Sref/S0) 2Rcestex/R1w vs. T1w and ω1 for a series of Δω/ω1 values and T2w. The curves of MTRasym match the curves of (Sref/S0)2Rcestex/R1w very well for all experimental conditions, confirming the approximate model in Eq. (10).
FIG. 5.
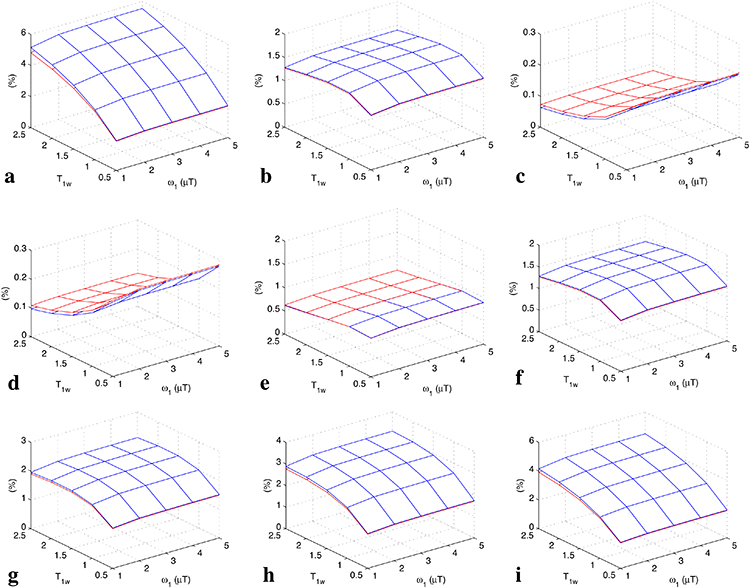
Steady-state MTRasym (red) and (Sref/S0)2Rcestex/R1w (blue) vs. T1w for Δω/ω1=10, 5, and 2 with T2w of 50 ms (a-c), as well as for T2w = 10 ms, 30 ms, 50 ms, 70 ms, 100 ms, and 150 ms with Δω/ω1=5 (d-i).
Dependence of the non-steady-state MTRasym on R1w
Fig. 6 shows the simulated non-steady-state MTRasym with full recovery (tp = 0.5 s) vs. T1w for a series of Δω/ω1 values and T2w, respectively. Fig. 7 shows the simulated non-steady-state MTRasym with short recovery time (tp = 0.5 s, trec = 1.5 s) vs. T1w for a series of Δω/ω1 values and T2w, respectively. Note that the curves of MTRasym vs. T1w are relatively flat for all experimental conditions, indicating that MTRasym is roughly independent of T1w for the non-steady-state irradiation with very short irradiation time, which confirms Eq. (16). Fig. 8 shows the measured MTRasym from two creatine samples with different T1w. Note that although the steady-state MTRasym increases with T1w at relatively low ω1, the non-steady-state MTRasym acquired with the same ω1 is roughly insensitive to T1w.
FIG. 6.
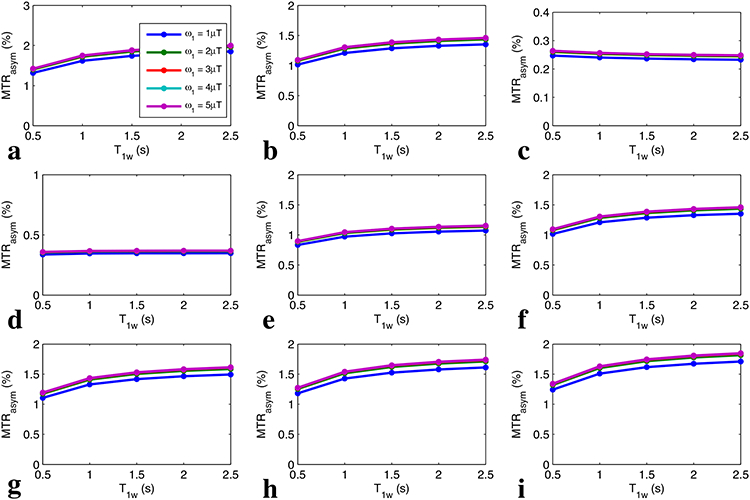
Non-steady-state MTRasym with full recovery vs. T1w for Δω/ω1=10, 5, and 2 with T2w of 50 ms (a-c), as well as for T2w = 10 ms, 30 ms, 50 ms, 70 ms, 100 ms, and 150 ms with Δω/ω1=5 (d-i). Note that the lines with different ω1 are indicated by different colors, which overlap.
FIG. 7.
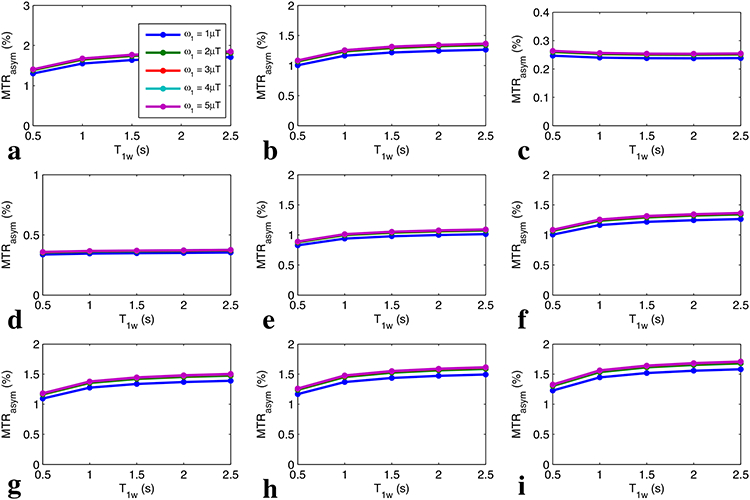
Non-steady-state MTRasym with short recovery time vs. T1w for Δω/ω1=10, 5, and 2 with T2w of 50 ms (a-c), as well as for T2w = 10 ms, 30 ms, 50 ms, 70 ms, 100 ms, and 150 ms with Δω/ω1=5 (d-i). Note that the lines with different ω1 are indicated by different colors, which overlap.
FIG. 8.
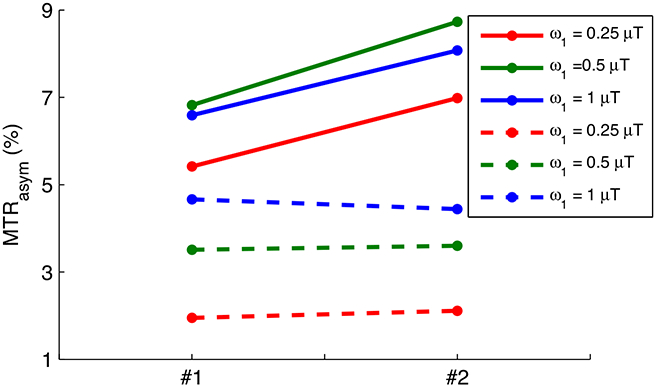
Measured steady-state (solid lines) and non-steady-state (dashed lines) MTRasym from two creatine samples with different T1w. T1w and T2w were measured to be (0.9 s and 88 ms) and (1.2 s and 132 ms) for sample #1 and #2, respectively.
DISCUSSION
Our study suggests that there are two inverse T1w effects (T1w recovery effect and T1w-related saturation effect) for the steady-state MTRasym. The competition of the two T1w effects results in the complex dependence of MTRasym on T1w, which is different from that given by Eq. (2) or Eq. (3) under weak saturation pulse approximation. Since T1w-related saturation effect depends on ω1, MTRasym could be adjusted to be roughly insensitive to T1w by choosing appropriate ω1. In addition, we show that the non-steady-state MTRasym acquired with very short irradiation time is also roughly insensitive to T1w.
In addition to Fig. 1, Fig. 3a shows positive dependence of the steady-state MTRasym on T1w, which suggests that the T1w recovery effect may dominate T1w-related saturation effect when there are no significant DS effects at high fields or with low irradiation powers. Therefore, in these situations, it is necessary to use T1w normalization to increase the specificity of MTRasym. Actually, previous studies at high fields have indicated that T1w normalization is necessary for obtaining specific MTRasym in APT imaging (26,29,30). In contrast, Fig. 3b shows roughly flat curves, which suggests that the two T1w effects are comparable at relatively low fields. For amides at 3.5 ppm at 3 T, ω1 of 2 μT can satisfy the condition of Δω/ω1=5 used in Fig. 3b and thus can make the MTRasym roughly insensitive to T1w. In previous APT imaging at 3 T (40), ω1 from 1 μT–3 μT were traditionally used. Therefore, it may not be necessary to normalize T1w to remove the influence from T1w in some of these previous studies on clinical MRI systems.
Although AREX is equal to the pure CEST effect quantified by Rcestex (26,29,36), the relationship between MTRasym and the pure CEST effect has not been evaluated. Eq. (10) provides an approximate model for MTRasym which provides insight into its contrast sources. Eq. (10) also suggests that MTRasymR1w/(Sref/S0)2 could be a simple metric to remove the influence from T1w and to obtain relatively purer CEST effects. Simulations in Sup. Fig. S1 show that MTRasymR1w/(Sref/S0)2 is independent of T1w and is roughly equal to Rcestex except for very strong DS effects. Please note that although we use a two-pool model simulation (Fig. 5) to evaluate Eq. (10), it can be extended to more complex tissue models by inspecting the definition of Sref. Simulations in Sup. Fig. S2 confirm Eq. (10) in a three-pool (solute, semi-solid, and water) model. In biological tissues, T1w also influences RMTex and thus affects both Sref and MTRasym according to Eq. (9) and Eq. (10). Studies on the influence of T1w on MTRasym through the semi-solid MT effect are also necessary. However, although the analytical equation for RMTex has been given previously (26), its dependence on T1w is complex. Here, we ignored the semi-solid MT effect in the theoretical analysis, but provided the three-pool model simulated MTRasymR1w and MTRasym vs. T1w in Sup. Fig. S3 and Fig. S4, respectively. Different from the two-pool model simulated MTRasym for higher Δω/ω1 (Fig. 3a) or longer T2w (Fig. 3i) which depends on T1w, the add of semi-solid MT effect makes MTRasym in these two conditions relatively insensitive to T1w. Previously, an empirical MTRasym equation for a two-pool model with DS effect has been also provided (41). Sup. Fig. S5 compares MTRasym in Eq. (10), the empirical MTRasym equation, and the numerical simulated MTRasym. It was found that the empirical MTRasym equation matches the numerical simulated MTRasym better than the MTRasym in Eq. (10), suggesting that the empirical MTRasym equation is more accurate than the MTRasym in Eq. (10). However, the empirical MTRasym equation is very complex and is not as straightforward as the MTRasym in Eq. (10) to study the dependence of MTRasym on T1w and DS effect.
In addition to Eq. (1), MTRasym was also defined to be (Sref(Δω)-Slab(Δω))/Sref(Δω) (42,43) which can be looked as the product of (Sref(Δω)-Slab(Δω))/S0(Δω) and S0(Δω)/Sref(Δω). Here we name this definition as MTR’asym. By substituting this definition with Eq. (10), we can obtain,
| (17) |
Eq. (17) indicates that MTR’asym also has two competing T1w effects, but the influence from the T1w-related saturation effect on MTR’asym is relatively weak compared with its influence on MTRasym. Therefore, it should require higher ω1, and thus greater DS effect, for MTR’asym to be roughly insensitive to T1w. Sup. Fig. S6 and Fig. S7 show the simulated MTR’asymR1w and MTR’asym vs. T1w, respectively, which confirms our expectation. In addition, our analysis is based on CW RF irradiation. For pulsed-RF irradiation, short RF irradiation pulses may also increase the DS effect, which may enhance the T1w-related saturation effect.
Heo et al. (44) have also studied the dependence of CESTR on T1w for different ω1 through numerical simulations, and found similar complex dependences: the CESTR at 3.5 ppm increases with T1w under lower ω1, but is roughly insensitive to T1w or even decreases with T1w under relatively higher ω1. However, this study did not give an explanation for these complex dependences. Our results about the two competing T1w effects can explain these complex dependences and guide researchers and radiologists to choose appropriate quantification metrics. Previously, Jokivarsi et al. (45) showed a strong correlation between MTRasym and pH in ischemic stroke. However, Sun et al. (45) showed that the correlation between MTRasym/T1w and pH is stronger than that between MTRasym and pH in ischemic stroke. Based on our study, choosing an appropriate CEST quantification metric should consider the relative contributions of the two T1w effects for specific experimental conditions.
Fig. 6 and Fig. 8 suggest that the non-steady-state MTRasym with very short RF irradiation time and long recovery time is roughly insensitive to T1w effect. This may be due to the different dynamics of chemical exchange, T1w recovery, and T1w-related saturation effects. Based on the Bloch equations with exchange terms (3), the water signal depends on three terms including the chemical exchange term (Mzwkws, where Mzw is the water Z magnetization and kws is the rate of exchange from water to solute protons, and in which we ignore the small back exchange), T1w recovery term (R1w(M0w – Mzw), where M0w is the equilibrium water magnetization), and water saturation term (ω1Myw, where Myw is the water Y magnetization). In a short time after the irradiation, both Mzw – M0w and Myw are very small, but Mzw is large. Thus chemical exchange dominates other two T1w effects, and as a result MTRasym is insensitive to T1w. Fig. 7 suggests that the non-steady-state MTRasym with very short RF irradiation time and short recovery time is also roughly insensitive to T1w effect. This may be due to that the dependences of the labeled signal, the reference signal, and the non-equilibrium control signal on T1w are roughly the same, and thus could be cancelled. However, when equilibrium control signal is used, the non-steady-state MTRasym with very short RF irradiation time and short recovery time is still influenced by T1w (Sup. Fig. S8).
Although steady-state MTRasym can be adjusted to be roughly insensitive to T1w, the direct subtraction of the label and reference signals cannot remove the higher order effect of the influence from the semi-solid MT effect. In situations, such as tumor, where there is significant change of semi-solid MT effect (46), MTRasym may be still contaminated by the semi-solid MT effect. Variation of T1w is usually associated with multiple physiological parameters such as water content. A recent paper indicates that the increase of T1w could be mostly eliminated by the increase of water content in tumors (47). This study is important for interpretation of contrast mechanism in many CEST applications. In this paper, we ignore this dependence and only studied the specificity of MTRasym to solute concentration from a perspective of theory.
CONCLUSION
We show that MTRasym has different dependences on T1w at high fields, low fields, and with steady-state or non-steady-state acquisitions. For some previous studies on clinical MRI systems with appropriate sequence parameters, the steady-state MTRasym may be roughly insensitive to T1w; For non-steady state acquisitions with very short RF irradiation time, MTRasym is also roughly insensitive to T1w.
Supplementary Material
Abbreviations used
- CEST
chemical exchange saturation transfer
- APT
amide proton transfer
- MT
magnetization transfer
- MTR
magnetization transfer ratio
- MTRasym
magnetization transfer ratio with asymmetric analysis
- AREX
apparent exchange-dependent relaxation
- DS
direct water saturation
- R1ρ
water longitudinal relaxation rate in the rotating frame
- Rcestex
chemical exchange effect in the rotating frame
- RMTex
semi-solid magnetization transfer effect in the rotating frame
REFERENCES
- 1.van Zijl PCM, Yadav NN. Chemical Exchange Saturation Transfer (CEST): What is in a Name and What Isn’t? Magnetic Resonance in Medicine 2011;65(4):927–948. [DOI] [PMC free article] [PubMed] [Google Scholar]
- 2.van Zijl PCM, Zhou J, Mori N, et al. Mechanism of magnetization transfer during on-resonance water saturation. A new approach to detect mobile proteins, peptides, and lipids. Magnetic Resonance in Medicine 2003;49(3):440–449. [DOI] [PubMed] [Google Scholar]
- 3.Zhou JY, van Zijl PCM. Chemical exchange saturation transfer imaging and spectroscopy. Progress in Nuclear Magnetic Resonance Spectroscopy 2006;48(2–3):109–136. [Google Scholar]
- 4.Walker-Samuel S, Ramasawmy R, Torrealdea F, et al. In vivo imaging of glucose uptake and metabolism in tumors. Nature Medicine 2013;19(8):1067–1074. [DOI] [PMC free article] [PubMed] [Google Scholar]
- 5.Zhou JY, Tryggestad E, Wen ZB, et al. Differentiation between glioma and radiation necrosis using molecular magnetic resonance imaging of endogenous proteins and peptides. Nature Medicine 2011;17(1):130–U308. [DOI] [PMC free article] [PubMed] [Google Scholar]
- 6.Cai KJ, Haris M, Singh A, et al. Magnetic resonance imaging of glutamate. Nature Medicine 2012;18(2):302–306. [DOI] [PMC free article] [PubMed] [Google Scholar]
- 7.Cai KJ, Tain RW, Zhou XJ, et al. Creatine CEST MRI for Differentiating Gliomas with Different Degrees of Aggressiveness. Mol Imaging Biol 2016;19(2):225–232. [DOI] [PMC free article] [PubMed] [Google Scholar]
- 8.Haris M, Cai KJ, Singh A, Hariharan H, Reddy R. In vivo mapping of brain myo-inositol. Neuroimage 2011;54(3):2079–2085. [DOI] [PMC free article] [PubMed] [Google Scholar]
- 9.Zaiss M, Kunz P, Goerke S, Radbruch A, Bachert P. MR imaging of protein folding in vitro employing Nuclear-Overhauser-mediated saturation transfer. Nmr in Biomedicine 2013;26(12):1815–1822. [DOI] [PubMed] [Google Scholar]
- 10.Zhang XY, Wang F, Jin T, et al. MR imaging of a novel NOE-mediated magnetization transfer with water in rat brain at 9.4T. Magnetic Resonance in Medicine 2017;78(2):588–597. [DOI] [PMC free article] [PubMed] [Google Scholar]
- 11.Liu GS, Ali MM, Yoo B, et al. PARACEST MRI With Improved Temporal Resolution. Magnetic Resonance in Medicine 2009;61(2):399–408. [DOI] [PMC free article] [PubMed] [Google Scholar]
- 12.Chen LQ, Howison CM, Jeffery JJ, et al. Evaluations of Extracellular pH within In Vivo Tumors Using acidoCEST MRI. Magnetic Resonance in Medicine 2014;72(5):1408–1417. [DOI] [PMC free article] [PubMed] [Google Scholar]
- 13.Ward KM, Balaban RS. Determination of pH using water protons and chemical exchange dependent saturation transfer (CEST). Magnetic Resonance in Medicine 2000;44(5):799–802. [DOI] [PubMed] [Google Scholar]
- 14.Zhou JY, Payen JF, Wilson DA, Traystman RJ, van Zijl PCM. Using the amide proton signals of intracellular proteins and peptides to detect pH effects in MRI. Nature Medicine 2003;9(8):1085–1090. [DOI] [PubMed] [Google Scholar]
- 15.Salhotra A, Lal B, Laterra J, et al. Amide proton transfer imaging of 9L gliosarcoma and human glioblastoma xenografts. Nmr in Biomedicine 2008;21(5):489–497. [DOI] [PMC free article] [PubMed] [Google Scholar]
- 16.Jones CK, Schlosser MJ, van Zijl PCM, et al. Amide proton transfer imaging of human brain tumors at 3T. Magnetic Resonance in Medicine 2006;56(3):585–592. [DOI] [PubMed] [Google Scholar]
- 17.Jia GA, Abaza R, Williams JD, et al. Amide Proton Transfer MR Imaging of Prostate Cancer: A Preliminary Study. Journal of Magnetic Resonance Imaging 2011;33(3):647–654. [DOI] [PMC free article] [PubMed] [Google Scholar]
- 18.Zhou JY, Lal B, Wilson DA, Laterra J, van Zijl PCM. Amide proton transfer (APT) contrast for imaging of brain tumors. Magnetic Resonance in Medicine 2003;50(6):1120–1126. [DOI] [PubMed] [Google Scholar]
- 19.Sun PZ, Wang EF, Cheung JS. Imaging acute ischemic tissue acidosis with pH-sensitive endogenous amide proton transfer (APT) MRI-Correction of tissue relaxation and concomitant RF irradiation effects toward mapping quantitative cerebral tissue pH. Neuroimage 2012;60(1):1–6. [DOI] [PMC free article] [PubMed] [Google Scholar]
- 20.Sun PZ, Zhou JY, Sun WY, Huang J, van Zijl PCM. Detection of the ischemic penumbra using pH-weighted MRI. Journal of Cerebral Blood Flow and Metabolism 2007;27(6):1129–1136. [DOI] [PubMed] [Google Scholar]
- 21.Sun PZ, Benner T, Copen WA, Sorensen AG. Early Experience of Translating pH-Weighted MRI to Image Human Subjects at 3 Tesla. Stroke 2010;41(10):S147–S151. [DOI] [PMC free article] [PubMed] [Google Scholar]
- 22.Li H, Zu ZL, Zaiss M, et al. Imaging of amide proton transfer and nuclear Overhauser enhancement in ischemic stroke with corrections for competing effects. Nmr in Biomedicine 2015;28(2):200–209. [DOI] [PMC free article] [PubMed] [Google Scholar]
- 23.Dula AN, Asche EM, Landman BA, et al. Development of Chemical Exchange Saturation Transfer at 7T. Magnetic Resonance in Medicine 2011;66(3):831–838. [DOI] [PMC free article] [PubMed] [Google Scholar]
- 24.Zhang H, Wang WZ, Jiang SS, et al. Amide proton transfer-weighted MRI detection of traumatic brain injury in rats. Journal of Cerebral Blood Flow and Metabolism 2017;37(10):3422–3432. [DOI] [PMC free article] [PubMed] [Google Scholar]
- 25.Wang WZ, Zhang H, Lee DH, et al. Using functional and molecular MRI techniques to detect neuroinflammation and neuroprotection after traumatic brain injury. Brain Behavior and Immunity 2017;64:344–353. [DOI] [PMC free article] [PubMed] [Google Scholar]
- 26.Zaiss M, Zu ZL, Xu JZ, et al. A combined analytical solution for chemical exchange saturation transfer and semi-solid magnetization transfer. Nmr in Biomedicine 2015;28(2):217–230. [DOI] [PMC free article] [PubMed] [Google Scholar]
- 27.Zaiss M, Bachert P. Exchange-dependent relaxation in the rotating frame for slow and intermediate exchange - modeling off-resonant spin-lock and chemical exchange saturation transfer. Nmr in Biomedicine 2013;26(5):507–518. [DOI] [PubMed] [Google Scholar]
- 28.Zaiss M, Xu JZ, Goerke S, et al. Inverse Z-spectrum analysis for spillover-, MT-, and T-1-corrected steady-state pulsed CEST-MRI - application to pH-weighted MRI of acute stroke. Nmr in Biomedicine 2014;27(3):240–252. [DOI] [PMC free article] [PubMed] [Google Scholar]
- 29.Zaiss M, Xu J, Goerke S, et al. Inverse Z-spectrum analysis for spillover, MT-, and T1-corrected steady-state pulsed CEST-MRI-application to pH-weighted MRI of acute stroke. Nmr in Biomedicine 2014;27(3):240–252. [DOI] [PMC free article] [PubMed] [Google Scholar]
- 30.Li H, Li K, Zhang XY, et al. R-1 correction in amide proton transfer imaging: indication of the influence of transcytolemmal water exchange on CEST measurements. Nmr in Biomedicine 2015;28(12):1655–1662. [DOI] [PMC free article] [PubMed] [Google Scholar]
- 31.Yuan J, Chen SZ, King AD, et al. Amide proton transfer-weighted imaging of the head and neck at 3 T: a feasibility study on healthy human subjects and patients with head and neck cancer. Nmr in Biomedicine 2014;27(10):1239–1247. [DOI] [PMC free article] [PubMed] [Google Scholar]
- 32.Heo HY, Zhang Y, Lee DH, et al. Accelerating chemical exchange saturation transfer (CEST) MRI by combining compressed sensing and sensitivity encoding techniques. Magnetic Resonance in Medicine 2017;77(2):779–786. [DOI] [PMC free article] [PubMed] [Google Scholar]
- 33.Heo HY, Zhang Y, Jiang SS, Lee DH, Zhou JY. Quantitative Assessment of Amide Proton Transfer (APT) and Nuclear Overhauser Enhancement (NOE) Imaging with Extrapolated Semisolid Magnetization Transfer Reference (EMR) Signals: II. Comparison of Three EMR Models and Application to Human Brain Glioma at 3 Tesla. Magnetic Resonance in Medicine 2016;75(4):1630–1639. [DOI] [PMC free article] [PubMed] [Google Scholar]
- 34.Heo HY, Zhang Y, Burton TM, et al. Improving the Detection Sensitivity of pH-Weighted Amide Proton Transfer MRI in Acute Stroke Patients Using Extrapolated Semisolid Magnetization Transfer Reference Signals. Magnetic Resonance in Medicine 2017;78:871–880. [DOI] [PMC free article] [PubMed] [Google Scholar]
- 35.Ma XY, Bai Y, Lin YS, et al. Amide proton transfer magnetic resonance imaging in detecting intracranial hemorrhage at different stages: a comparative study with susceptibility weighted imaging. Scientific Reports 2017;7. [DOI] [PMC free article] [PubMed] [Google Scholar]
- 36.Zaiss M, Bachert P. Chemical exchange saturation transfer (CEST) and MR Z-spectroscopy in vivo: a review of theoretical approaches and methods. Physics in Medicine and Biology 2013;58(22):R221–R269. [DOI] [PubMed] [Google Scholar]
- 37.Zaiss M, Angelovski G, Demetriou E, et al. QUESP and QUEST Revisited - fast and accurate quantitative CEST experiments. Magn Reson Med 2017:DOI: 10.1002/mrm.26813. [DOI] [PubMed] [Google Scholar]
- 38.Goerke S, Zaiss M, Bachert P. Characterization of creatine guanidinium proton exchange by water-exchange (WEX) spectroscopy for absolute- pH CEST imaging in vitro. Nmr in Biomedicine 2014;27(5):507–518. [DOI] [PubMed] [Google Scholar]
- 39.Sun PZ, Benner T, Kumar A, Sorensen AG. Investigation of optimizing and translating pH-sensitive pulsed-chemical exchange saturation transfer (CEST) imaging to a 3T clinical scanner. Magnetic Resonance in Medicine 2008;60(4):834–841. [DOI] [PMC free article] [PubMed] [Google Scholar]
- 40.Zhao XN, Wen ZB, Huang FH, et al. Saturation Power Dependence of Amide Proton Transfer Image Contrasts in Human Brain Tumors and Strokes at 3 T. Magnetic Resonance in Medicine 2011;66(4):1033–1041. [DOI] [PMC free article] [PubMed] [Google Scholar]
- 41.Sun PZ, van Zijl PCM, Zhou JY. Optimization of the irradiation power in chemical exchange dependent saturation transfer experiments. Journal of Magnetic Resonance 2005;175(2):193–200. [DOI] [PubMed] [Google Scholar]
- 42.McMahon MT, Gilad AA, Zhou JY, et al. Quantifying exchange rates in chemical exchange saturation transfer agents using the saturation time and saturation power dependencies of the magnetization transfer effect on the magnetic resonance imaging signal (QUEST and QUESP): pH calibration for poly-L-lysine and a starburst dendrimer. Magnetic Resonance in Medicine 2006;55(4):836–847. [DOI] [PMC free article] [PubMed] [Google Scholar]
- 43.Wermter FC, Bock C, Dreher W. Investigating GluCEST and its specificity for pH mapping at low temperatures. Nmr in Biomedicine 2015;28(11):1507–1517. [DOI] [PubMed] [Google Scholar]
- 44.Heo HY, Lee DH, Zhang Y, et al. Insight into the quantitative metrics of chemical exchange saturation transfer (CEST) imaging. Magnetic Resonance in Medicine 2017;77(5):1853–1865. [DOI] [PMC free article] [PubMed] [Google Scholar]
- 45.Jokivarsi KT, Grohn HI, Grohn OH, Kauppinen RA. Proton transfer ratio, lactate, and intracellular pH in acute cerebral ischemia. Magnetic Resonance in Medicine 2007;57(4):647–653. [DOI] [PubMed] [Google Scholar]
- 46.Xu JZ, Li K, Zu ZL, et al. Quantitative magnetization transfer imaging of rodent glioma using selective inversion recovery. NMR in Biomedicine 2014;27(3):253–260. [DOI] [PMC free article] [PubMed] [Google Scholar]
- 47.Lee DH, Heo HY, Zhang K, et al. Quantitative assessment of the effects of water proton concentration and water T-1 changes on amide proton transfer (APT) and nuclear overhauser enhancement (NOE) MRI: The origin of the APT imaging signal in brain tumor. Magnetic Resonance in Medicine 2017;77(2):855–863. [DOI] [PMC free article] [PubMed] [Google Scholar]
Associated Data
This section collects any data citations, data availability statements, or supplementary materials included in this article.


