

Abstract
The mechanistic/mammalian target of rapamycin (mTOR) has emerged as a critical integrator of signals from the immune microenvironment capable of regulating T cell activation, differentiation and function. The precise role of mTOR in the control of regulatory T cell (Treg) differentiation and function is complex. Pharmacologic inhibition and genetic deletion of mTOR promotes the generation of Tregs even under conditions which would normally promote generation of effector T cells. Alternatively, mTOR activity has been observed to be increased in Tregs and the genetic deletion of the mTOR complex 1 (mTORC1)-scaffold protein Raptor inhibits Treg function. Herein, by employing both pharmacologic inhibitors and genetically altered T cells we seek to clarify the role of mTOR in Tregs. Our studies demonstrate that inhibition of mTOR during T cell activation promotes the generation of long-lived central Treg with a memory-like phenotype in mice. Metabolically, these central “memory” Tregs possess enhanced spare respiratory capacity, similar to CD8+ memory cells. Alternatively, the generation of effector Tregs requires mTOR function. Indeed, genetic deletion of Rptor leads to the decreased expression of ICOS and PD-1 on the effector Tregs. Overall our studies define a subset of mTORC1hi effector Tregs and mTORC1lo central Tregs.
Introduction
Regulatory T cells (Treg) play a pivotal role in controlling immune responses and maintaining peripheral tolerance. Defined by the canonical transcription factor FoxP3, natural Tregs emerge from the thymus while inducible Tregs can differentiate from naïve CD4+ T cells (1). It is clear that the precise expression profile of Tregs varies greatly depending upon their tissue localization. For example, PPARγ, an important transcription factor that promotes adipocyte differentiation, plays a critical role in regulating genetic programs for Tregs that reside in adipose tissue (2). Likewise, Tregs also express canonical effector T helper cell transcription factors, such as T-bet, GATA-3, Bcl6, and IRF4 and have been shown to be necessary for optimal suppression of the corresponding T helper subsets (3–11). Recently, Tregs from secondary lymphoid organs, such as the spleen and lymph nodes, have been divided into two subgroups based on their CD44 and CD62L expression: CD44lo CD62Lhi central Treg (cTreg) or CD44hi CD62Llo effector Treg (eTreg) (12). These subsets have been suggested to play differential roles in maintaining homeostasis in seconday lymphoid organs and distant tissue sites.
Initially, Tregs were described as CD25+ T cells emerging from the thymus that could inhibit the development of systemic organ specific autoimmunity (13–16). Studies involving the autoimmune-proned scurfy mouse strain led to the identification of FoxP3 as a critical transcription factor of Tregs (17, 18). Furthermore, it was found that FoxP3+ Tregs could readily be generated in vitro by activating naïve CD4+ T cells in the presence of TGFβ and IL-2 or retinoic acid (19–24). Subsequent studies revealed that the efficiency of Treg generation both in vitro and in vivo could be markedly enhanced by the allosteric mechanistic/mammalian target of rapamycin (mTOR) inhibitor rapamycin (25–29). These observations were followed up by studies that demonstrated that the genetic deletion of components of mTOR signaling pathway in T cells led to the enhanced generation of Tregs (30–32). That is, stimulation of mTOR-deficient T cells under normal activating conditions (in the presence of Th1 or Th2 skewing cytokines) can lead to the generation of Tregs.
These observations supported a model whereby antigen recognition by CD4+ T cells in the absence of mTOR signaling leads to the generation of Tregs. However, additional studies revealed that the role of mTOR signaling in regulating Tregs was more complex. Paradoxically, it was observed that mTOR activity was increased in human Tregs and that mTOR supports Treg proliferation (25, 26, 33). Likewise, a study using mice in which the mTORC1 adaptor protein Raptor was deleted in Tregs developed systemic autoimmunity, suggesting that mTORC1 activity was necessary for Treg function (34).
Previously our group and others have shown that mTOR activation plays an important role in promoting CD8+ T cell effector function (35, 36). Likewise, it has been shown that the inhibition of mTOR either with the small molecule inhibitor rapamycin or by genetic deletion leads to enhanced generation of memory CD8+ T cells (35–37). In this report, we employ both genetic and pharmacologic approaches to more precisely clarify the role of mTOR in Treg differentiation and function. To this end, we hypothesized that mTORC1 activation played a similar role in regulating Treg effector and memory T cell differentiation and function. Our studies reveal that central and effector Tregs show distinct levels of mTORC1 activation. Effector Tregs demonstrate increased mTORC1 activity and a concomitant increase in glycolytic metabolism. Moreover, Rptor-deficient effector Tregs have reduced expression of effector molecules such as CTLA-4 and ICOS and are less potent suppressors. Alternatively, the T-Rptor-deficient mice demonstrate an increase in Tregs with central markers (CD62L and CD25). Furthermore, the generation of Tregs in the presence of rapamycin leads to cells with increased central Treg markers that demonstrate robust longevity in vivo.
Materials and Methods
Mice
Six- to eight-week-old male or female mice were used for performing all the experiments in this study. All mouse procedures were approved by the Johns Hopkins University Institutional Animal Care and Use Committee. C57BL/6, Cd4-Cre, Rag2−/−, Cd90.1, and mice with loxP-flanked Rptor alleles were initially obtained from Jackson Laboratories. The FoxP3-GFP mice (C57BL/6-Tg(Foxp3-GFP)90Pkraj/J) were originally generated by Dr. Piotr Kraj and were kindly provided by Dr. Charles Drake (Columbia University).
Flow cytometry and cell sorting reagents
Antibodies against the following proteins were purchased from BD Biosciences: CD4 (RM4-5), CD69 (H1.2F3), CD90.1 (OX-7), phospho-STAT5Y694 (C71E5), and CD90.2 (53-2.1). Antibodies against the following proteins were purchased from eBioscience: CD44 (IM7), CD98 (RL388), ICOS (7E.17G9), IRF4 (3E4), Ki-67 (SolA15), CD39 (24DMS1), KLRG1 (2F1), and FoxP3 (FJK-16s). Antibodies against the following proteins were purchased from BioLegend: CD4 (RM4-5), CD45 (30-F11), CD62L (MEL-14), CTLA-4 (UC10-4F10-11), PD-1 (29F.1A12), CD25 (PC61), and Bcl2 (BCL/10C4). Normal rabbit IgG (2729) and anti-phospho-S6S240/244 (5364) were purchased from Cell Signaling Technology. Goat anti-rabbit-Alexa Fluor 647 secondary antibody was purchased from Invitrogen. Fc Block (2.4G2) and anti-CD28 (37.51) were purchased from Bio X Cell. Stimulatory anti-CD3 (2C11) was purified from hybridoma supernatants prepared in-house. Fixable viability dye eFluor780 was purchased from eBioscience. MitoTracker Deep Red dye was purchased from Invitrogen. Flow cytometry experiments were performed on a FACSCalibur, LSR II, or FACSCelesta (BD Biosciences), and analyzed using FlowJo software (Treestar, v.10.3) or FCS Express (De Novo Software, v.6). Cell sorting was performed on a FACSAria II or FACSAria Fusion (BD Biosciences).
Immunoblot analysis
Sorted Tregs were flash-frozen and lyzed in radioimmunoprecipitation (RIPA) lysis buffer supplemented with protease and phosphatase inhibitor cocktails. Protein was quantified with Pierce Coomassie Plus (Bradford) Assay (ThermoFisher), and equal protein was separated on 4–12% gradient gels (Invitrogen). The following antibodies were purchased from Cell Signaling Technology: anti-phospho-S6S240/244 (5364), anti-phospho-mTORS2448 (2971), anti-phospho-4EBPT37/46 (236B4, 2855), anti-β-actin (D6A8, 8457), and anti-rabbit-HRP (7074). Proteins were detected with SuperSignal West Pico PLUS Chemiluminescent Substrate (ThermoFisher). All images were captured with the UVP Biospectrum500 imaging system (UVP).
Real-time PCR analysis
Tregs were sorted from the spleen and lymph nodes of naïve FoxP3-GFP mice. Total RNA was isolated by using TRIzol reagent (Life Technologies) and following manufacturer’s protocol. RNA (800 ng) was then converted to cDNA with ProtoScript II RT (New England BioLabs). Real-time PCR was performed using EagleTaq Universal Master Mix (Roche). Real-time PCR primers and probes were obtained from Applied Biosystems: Cpt1a (carnitine palmitoyltransferase 1a, liver, Mm01231183_m1), Hif1a (hypoxia inducible factor 1, alpha subunit, Mm00468869_m1), Hk2 (hexokinase 2, Mm00443385_m1), and Pfkp (phosphofructokinase, platelet, Mm00444792_m1). Delta-delta Ct (ΔΔCt) values were normalized to the housekeeping gene 18s ribosomal RNA (Life Technologies) and further normalized to the control group. Experiments were performed on an OneStepPlus 96 well instrument (Applied Biosystems).
In vitro suppression assay
Tregs were isolated from the spleen and lymph nodes of naïve mice with the CD4+ CD25+ Regulatory T Cell Isolation Kit (Miltenyi Biotec) or by cell-sorting to isolate central and effector Tregs. Naïve CD4+ T cells from the spleen and lymph nodes of congenically distinct mice (CD90.1+) were isolated with Naïve CD4+ T Cell Isolation Kit (Miltenyi Biotec) and were labeled with proliferation dye eFluor450 (5μM) (eBioscience) following the manufacturer’s protocol. Different ratios of Tregs (suppressor) and naïve CD4+ T cells (responder) were co-cultured with soluble anti-CD3 (1 μg/ml) and irradiated APCs. The proliferation of the CD4+ CD90.1+ T cells was measured by eFluor450 dilution by flow cytometry. The percentage of suppression was calculated by using the following formula:
In vivo administration of rapamycin
Mice were injected daily intraperitoneally with vehicle or rapamycin (300 μg/kg, LC Laboratories) daily for 6 days. Rapamycin was first reconstituted in DMSO and then diluted with Kolliphor EL (Cremophor, Sigma) and sterile water to a final 1:1:4 (DMSO/rapamycin: cremophor: sterile water) ratio.
In vitro Tregs generation
Naïve CD4+ T cells were isolated from the spleen and lymph nodes of WT mice and were activated with plate-bound anti-CD3 (3 μg/ml) and soluble anti-CD28 (2 μg/ml) in the presence of murine IL-2 (Peprotech, 10 ng/ml) and TGFβ (Peprotech, 10 ng/ml). In some instances, cells were activated with additional DMSO (vehicle) or rapamycin (LC laboratories, 100 nM). Cells were harvested at the indicated time point for subsequent analysis.
Metabolic assay
Tregs were prepared as described above. Activated cells (3 × 10⁵) were plated per well on poly-D lysine (Sigma, 50 μg/ml)-coated Seahorse XF96 cell culture microplate in XF Assay Medium Modified DMEM supplemented with 25 mM glucose, 2 mM L-glutamine, and 1 mM sodium pyruvate. The basal extracellular acidification rate (ECAR) was calculated based on the average of the initial readouts before the addition of oligomycin. Spare respiratory capacity (SRC) was determined by subtracting the basal OCR from the maximal oxygen consumption rate (OCR, detected following FCCP administration). Experiments were performed using XF 96 Extracellular Flux Analyzer (Agilent Technologies). The following were injected at the indicated time interval: oligomycin (Sigma, 1 μM), FCCP (Sigma, 1.5 μM), rotenone (Cayman Chemical, 2 μM) and antimycin A (Sigma, 1 μM).
Targeted metabolite analysis with LC-MS/MS
Targeted metabolite analysis was performed with liquid-chromatography tandem mass spectrometry (LC-MS/MS). Metabolites from sorted cells were extracted with 80% (v/v) methanol solution equilibrated at −80 °C, and the metabolite-containing supernatants were dried under nitrogen gas. Dried samples were re-suspended in 50% (v/v) acetonitrile solution and 70 μl of each sample were injected and analyzed on a 5500 QTRAP triple quadrupole mass spectrometer (AB Sciex) coupled to a Prominence ultra-fast liquid chromatography (UFLC) system (Shimadzu). The instrument was operated in selected reaction monitoring (SRM) with positive and negative ion-switching mode as described below. This targeted metabolomics method allows for analysis of over two hundreds of metabolites from a single 25-minute (min) LC-MS acquisition with a 3-millisecond dwell time and these analyzed metabolites. The optimized MS parameters were: ESI voltage was +5,000 V in positive ion mode and −4,500V in negative ion mode; dwell time was 3ms per SRM transition and the total cycle time was 1.57 seconds. Hydrophilic interaction chromatography (HILIC) separations were performed on a Shimadzu UFLC system using an amide column (Waters XBridge BEH Amide, 2.1 × 150 mm, 2.5 μm). The LC parameters were as follows: column temperature, 40 °C; flow rate, 0.30 ml/min. Solvent A, water with 0.1% formic acid; Solvent B, acetonitrile with 0.1% formic acid; a non-linear gradient from 99% B to 45% B in 25 min with 5 min of post-run time. Peak integration for each targeted metabolite in SRM transition was processed with MultiQuant software (v2.1, AB Sciex). The preprocessed data with integrated peak areas were exported from MultiQuant and re-imported into Metaboanalyst software for further data analysis including statistical analysis, fold change, principle components analysis and relative expression in a heatmap.
For [U-13C] glucose tracing experiment, a 20% (w/v) solution of [U-13C] glucose (Cambridge Isotope Laboratories) in PBS was sterile-filtered and 100 μl of this solution were injected 3 times with 15-minute interval into the tail vein of a restrained mouse without anesthesia. After 3 injections, mice was sacrificed and spleens were isolated for further purification of Tregs. Isolated Tregs were then flash-frozen and processed as described above.
Adoptive transfer
Tregs were generated as described above and 1 × 10⁶ cells were adoptively transferred retro-orbitally (r.o.) into congenically distinct wildtype host. At day 14 post transfer, cells isolated from spleen and lymph nodes were analyzed separately by flow cytometry.
B16-F10 tumor model
The B16-F10 melanoma cell line was purchased from ATCC. The cell line was tested and found to be mycoplasma-free by using a MycoAlert Mycoplasma Detection Kit (LONZA) every six months. Cells were cultured in RPMI media supplemented with 10% FBS, 10 mM HEPES (Corning), and antibiotics (Corning). Tumor cells (2×10⁵) were injected subcutaneously (s.c.) in the flank of the mice at Day 0. Fourteen days after tumor implantation, tumors were harvested from mice and digested in 2 mg/ml collagenase I (Gibco) with DNase I (Roche) in RPMI supplemented with 2% FBS. Cells were then stained with antibodies for subsequent flow analysis.
B16-F10 tumor model in Rag2−/− mice
Sorted naïve CD4+ and CD8+ T cells were mixed with sorted splenic eTregs from WT or T-Rptor−/− in a 1:05:0.02 ratio, respectively. Then a total of 7.5 × 10⁵ cell mixture was injected r.o. into Rag2−/− host. Two days post cell transfer, 2 × 10⁵ B16-F10 melanoma cells were injected s.c. into flanks of the mice. Tumor growth was monitored.
Statistical analysis
All graphs and statistical analysis were performed using GraphPad Prism software (v.7). A P value less than 0.05 was considered statistically significant.
Results
Effector Tregs have increased mTORC1 signaling compared to central Tregs
As defined by Smigiel et al, Tregs in the spleen can be divided into central Treg (cTreg) and effector Treg (eTreg) based on their CD44 and CD62L expression (12). Consistent with these findings, we observed CD44lo CD62Lhi (cTregs) and CD44hi CD62Llo (eTregs) populations with no difference in FoxP3 expression in the spleen (Figure 1A) of naïve wildtype C57BL/6 mice (WT). In as much as mTOR activity has been shown to regulate memory and effector CD8+ T cells, we hypothesized that mTOR activity might be differentially regulated in Tregs as well. To test this hypothesis, we compared cell size in the central and effector Tregs. Cell size is regulated by mTOR and mTORC1 controls the phosphorylation of S6 as well as the expression of CD98 (38, 39). Indeed, we observed increased cell size, p-S6, and CD98 expression in the eTregs as compared to the cTregs (Figures 1B–C). Furthermore, IRF4 has been shown to play a role in Treg function (4, 5, 9). Indeed, eTregs have higher IRF4 expression than cTregs (Figure 1C). In addition, immunoblot analysis showed increased phosphorylation of mTOR at S2448, demonstrating increased mTOR activity in eTregs compared to cTregs (Figure 1D). Correlating to the flow analysis (Figure 1C), eTregs also showed enhanced p-S6 and p-4EBP, both of which are downstream of mTORC1 (Figure 1D). Thus, similar to effector CD8+ T cells, eTregs display enhanced mTORC1 activity as compared to cTregs.
Figure 1.

Central and effector Tregs can be defined by mTORC1 activity
(a) CD44 and CD62L expression was examined among CD4+ FoxP3+ T cells from spleen (left). Central Tregs (cTreg) and effector Tregs (eTreg) were defined as previously described (12). Flow cytometry analysis of FoxP3 expression between cTregs and eTregs is shown on the right. (b–c) cTreg and eTreg are examined by (b) size, (c) p-S6S240/244, CD98, and IRF4. Geometric mean fluorescence intensity (gMFI) are shown in the plots. Dotted line in (c) represents isotype control. (d) Immunoblot analysis of the mTOR pathway, as measured by p-mTORS2448, p-S6S240/44, and p-4EBPT37/46 between cTreg and eTreg from spleen. β-actin is served as loading control. (e) Heatmap overlay of effector Treg molecules onto a t-SNE plot generated from splenic Tregs in WT mice. (f) Heatmap overlay of central Treg molecules from splenic Tregs. (g) CD44 and CD62L expression of cluster 1 and 2 generated from an unbiased k-mean clustering algorithm. (h) Heatmap of the expression of molecules from the cluster 1 and 2 populations. (i) Treg suppression assay from sorted cTreg and eTreg. Data are representative of at least three independent experiments.
We have shown thus far that we can define central and effector Tregs based on mTORC1 activity as well their CD44 and CD62L expression. To further define these distinct populations of Tregs, we took a multidimensional unbiased approach. A two-dimensional t-Distributed Stochastic Neighbor Embedding (t-SNE) plot was generated based on the expression levels of the effector (p-S6, IRF4, ICOS, KLRG1, PD-1, and CTLA-4) and central markers (CD62L and CD25) from splenic Tregs. We then overlaid the geometric MFI (gMFI) of these individual molecules onto the existing t-SNE plot to investigate their distribution patterns. Not to our surprise, Tregs that express effector molecules all clustered together on the t-SNE plot (Figure 1E). Alternatively, the central molecules such as CD62L and CD25 clustered together on the t-SNE plots (Figure 1F). Of note, the eTregs that express the highest expression of all effector molecules further cluster away from the CD62L expression population. Utilizing a different flow cytometry panel, we reconstructed the t-SNE analysis using different effector (CTLA-4, KLRG1, CD98, and Ki-67) and central (CD62L, CD25, and Bcl-2) Treg markers. We observed similar cell clustering with Ki-67 and CD98 clustering together with CTLA-4 expressing cells (Supplemental Figure 1A) whereas Bcl-2 clusters with CD62L expressing cells (Supplemental Figure 1B).
Based on the unbiased t-SNE analysis, we decided to apply an unbiased k-mean clustering to define two distinct groups of Tregs. The k-mean clustering algorithm again produced the distinct population of Tregs based on their CD44 and CD62L expression. Cluster 1 encompassed all the CD62Lhi central Tregs while cluster 2 encompassed all the CD62Llo Tregs (Figure 1G). Furthermore, the relative expression of central and effector Treg markers in these two clusters correlates with our previous findings (Figure 1E, F, and H). Taken together, these analyses demonstrate that the two populations of Tregs defined by CD62L expression can also be reconstructed based on mTORC1 activity.
Since we observed differential mTOR activity among these two population of Tregs, we wondered if their suppressive function might be different upon T cell receptor (TCR) stimulation. However, both central and effector Treg suppressed equally well in an in vitro suppression assay, suggesting there is no dramatic functional differences in response to direct TCR stimulation (Figure 1I).
Effector Tregs have increased glycolysis compared to central Tregs
Recently, the role of metabolic reprogramming in promoting T cell differentiation and function has been revealed (40). Along these lines, mTORC1 specifically has been shown to be crucial in promoting the metabolic reprogramming (39, 41, 42). Furthermore, the transcription factor IRF4 also regulates the glycolytic metabolism and differentiation of CD8+ T cells (43, 44). As such we wondered if there were differences in metabolic programming between cTregs and eTregs based on the differential mTORC1 activity and IRF4 expression illustrated from Figure 1. To further examine the glycolytic programming of central and effector Tregs, splenic Tregs were isolated from spleen and lymph nodes of FoxP3-GFP mice, and sorted based on GFP, CD44, and CD62L expression. Then, mRNA was extracted from these two subsets. Effector Tregs demonstrated an increase in the expression of hypoxia induced factor 1a (Hif1a) when compared to cTregs (Figure 2A). Moreover, eTregs also showed enhanced mRNA expression of hexokinase 2 (Hk2) and phosphofructose kinase (Pfkp), two important enzymes in the initial steps of the glycolysis (Figure 2A). Thus, eTregs have increased glycolytic machinery as compared to cTregs. As previously shown, Tregs preferentially utilize fatty acid oxidation as a major source of energy production compared to effector CD4+ T cells (45). We observed no differences between the two subsets with regard to Cpt1a expression (Figure 2A). Additionally, an increase in mitochondrial mass has been associated with long lasting memory cells (46). Thus, we employed MitoTracker Deep Red dye to assess mitochondrial mass in central and effector Tregs. Interestingly, we observed an increase in mitochondrial mass in the cTregs as compared to the eTregs (Figure 2B).
Figure 2.
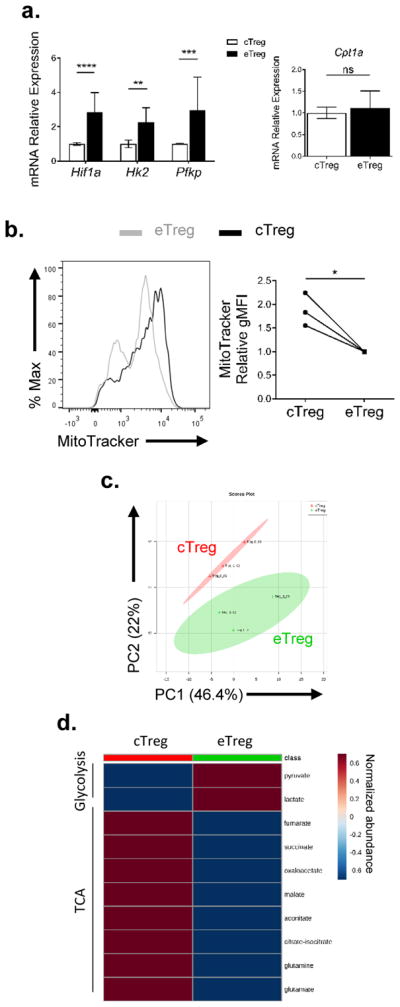
Central and effector Tregs have distinct metabolic requirements
(a) Tregs from FoxP3-GFP mice were sorted based on CD44 and CD62L expression. Comparison of mRNA expression of metabolic genes (Hif1a, Hk2, Pfkp, and Cpt1a) between sorted cTreg and eTreg. (b) Mitochondrial mass was compared between WT splenic cTreg and eTreg. A summary plot is shown on the right. (c–d) Targeted metabolic analysis was performed, and (c) a PCA plot and (d) heatmap showing glycolysis and TCA cycle metabolite from sorted cTreg and eTreg. *P < 0.05; **P < 0.005; ***P < 0.0005; ****P < 0.0001; ns, no significance (2way ANOVA with Bonferroni’s multiple comparisons test (a, left), Mann-Whitney t test (a, right), paired t test (b)). Data are representative of either two (c–d) or at least three (a–b) independent experiments.
To further investigate the metabolic status differences between central and effector Tregs, we sorted central and effector Tregs from the spleen and subjected these cells to targeted metabolomics analysis. Principle component analysis (PCA) of the metabolites accounts for 78% of differences between the two subsets and clearly distinguishes these two subsets of Tregs (Figure 2C). That is, the observed differences in mTORC1 activity correlates to distinct differences in metabolic programming. We further focused our analysis on glycolysis and TCA cycle metabolites. Interestingly, cTregs show a reduction in both pyruvate and lactate levels and an increase in TCA cycle intermediates compared to eTregs (Figure 2D). Overall our data demonstrate that effector and central Tregs display differential mTORC1 activity, which regulates differential metabolic reprogramming.
The role of mTORC1 in defining the central and effector Treg subsets
Our data thus far suggests that central and effector Tregs have different mTORC1 activity that correlates with differential metabolic programs. Next, we wanted to test the effect of mTORC1 inhibition on the two subsets. We treated WT or FoxP3-GFP mice with either vehicle or rapamycin (300 μg/kg) daily for 6 days. On day 6, we harvested the spleen of the mice for further analysis. First, we sorted splenic central and effector Tregs and confirmed mTORC1 inhibition by measuring the phosphorylation of S6 at S240/244, and 4EBP at T37/46 via immunoblotting (Supplemental Figure 2A). To address the phenotypic changes that occurred as a consequence of mTORC1 inhibition, we again generated t-SNE plots from splenic Tregs employing the markers defined in Figure 1E for central and effector Tregs. We then overlaid the Treg populations from mice that were treated with either vehicle or rapamycin (Figure 3A). The plot reveals phenotypic changes in the Treg populations derived from mice that were treated with rapamycin. We then applied an unbiased k-mean transformation to cluster the Tregs into two populations. Each cluster has a distinct CD44 and CD62L profile, with cluster 1 containing most of the CD62Lhi population and cluster 2 containing most of the CD62Llo population (Figure 3B). We then analyzed the changes in both clusters post-rapamycin treatment. The percentage of cluster 1 Tregs increased with a concomitant decrease in cluster 2 Tregs upon mTORC1 inhibition (Figure 3C). Not surprisingly, the ratio between central and effector Tregs increased in mice that were treated with rapamycin, suggesting a requirement for mTORC1 activity in effector Tregs (Figure 3D). Of note, Ki-67 was reduced in both central and effector Tregs upon rapamycin treatment (Supplemental Figure 2B).
Figure 3.
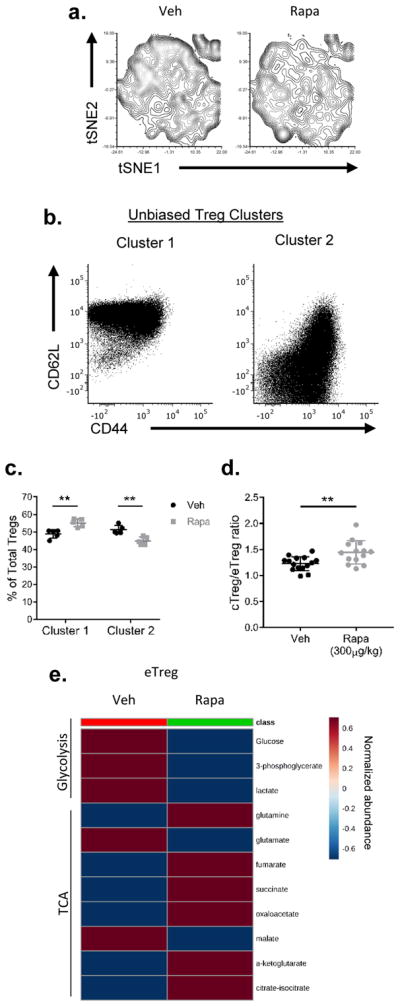
Central and effector Tregs are both sensitive to mTOR inhibition
WT mice were subjected to vehicle (Veh) or rapamycin (Rapa, 300 μg/kg) treatment for 6 days. Mice were sacrificed and the spleens were harvested. (a) t-SNE plot of splenic Tregs from mice treated with or without rapamycin. (b) Relative expression of markers in Tregs defined by clusters 1 and 2 generated from k-mean transformation. (c) Population changes of clusters 1 and 2 upon rapamycin treatment. (d) Ratio of cTreg and eTreg in the spleen. (e) Heatmap showing targeted metabolite differences in eTregs between vehicle and rapamycin treatment groups. **P < 0.005 (2way ANOVA with Bonferroni’s multiple comparisons test (c) or Mann-Whitney t test (d)). Data are representative of two (e) or at least three (a–d) independent experiments.
Furthermore, we also sought out metabolic changes resulting from treatment with rapamycin. We sorted splenic central and effector Tregs from rapamycin-treated mice and subjected the metabolite extracts to targeted metabolic analysis. There were marked differences in glycolysis and TCA cycle intermediates in rapamycin-treated eTregs (Figure 3E). Similar to what we observed in the mTORlo cTregs (Figure 2), glycolysis was reduced in eTregs treated with rapamycin (Figure 3E). Additionally, rapamycin-treated eTregs demonstrated increased TCA cycle intermediates (Figure 3E). Thus, from a metabolic perspective, the rapamycin-treated eTregs phenocopied the mTORlo cTregs. Taken together, these data suggest that mTOR signaling is important in regulating the homeostasis and metabolic status of both central and effector Tregs.
mTORC1-deficiency mitigates effector Treg function
Thus far we have demonstrated that high mTORC1 activity is associated with eTregs and promotes glycolysis while low mTORC1 activity is associated with cTregs and leads increased mitochondrial mass and TCA cycle intermediates (Figure 2). To further discern the role of mTOR in regulating Tregs, we employed mice in which the mTORC1 adaptor protein Raptor is selectively deleted in T cells (T-Rptor−/−). First, we noted that the splenic central and effector Treg ratio is similar between T-Rptor−/− and WT littermate control mice based on CD44 and CD62L expression (Figure 4A). On the other hand, T-Rptor−/− eTregs demonstrated decreased levels of the proliferation marker Ki-67 and decreased levels of the effector molecules ICOS, CD69, CTLA-4, CD39, and PD-1 (Figure 4B). Furthermore, T-Rptor−/− eTregs have decreased IRF4 expression (Figure 4C).
Figure 4.

mTORC1 is crucial in maintaining the effector Treg phenotype
(a) Percentage of splenic eTreg and cTreg were examined between WT and T-Rptor−/− mice. (b) Flow cytometry comparison of effector molecule expression between WT and T-Rptor−/− eTreg from spleen. (c) Flow cytometry comparison of IRF4 between WT and T-Rptor−/− eTreg from spleen. (d) Flow cytometry comparison of central Treg molecules between splenic eTreg among WT and T-Rptor−/−. (e) WT and T-Rptor−/− Treg were isolated from spleen and titrated in different ratio to responder cells to assess the ability of Tregs to suppress in vitro. *P < 0.05; **P < 0.005 (2way ANOVA with Bonferroni’s multiple comparisons test). Data are representative of at least three independent experiments.
Interestingly, while the eTregs from the T-Rptor−/− mice had reduced cell surface expression of effector molecules, these cells expressed increased levels of central Treg markers such as CD25 and Bcl-2 compared to WT eTregs (Figure 4D). The relative amount of phosphorylated STAT5 is also increased in the T-Rptor−/− eTregs and cTregs when compared to WT littermate control mice (Figure 4D and Supplemental Figure 3A). In addition, the pro-survival factor Bcl-2 was increased at protein and mRNA level in T-Rptor−/− cTreg than WT cTregs (Supplemental Figure 3B–C). Furthermore, CD25 expression was further enhanced in T-Rptor−/− cTregs (Supplemental Figure 3D). We also performed an in vivo [U-13C] glucose tracing experiment to examine glycolysis and TCA cycle intermediate metabolites in WT and T-Rptor−/− mice contributed from glucose. Tregs isolated from T-Rptor−/− mice showed a reduction of labeled 13C-glucose into glycolytic metabolites such as glucose-6-phosphate (G6P) and lactate, as well as the TCA cycle intermediates succinate and malate (Supplemental Figure 3E). Overall, the mTORC1 signaling deficient T-Rptor−/− eTregs have decreased proliferation and expression of effector Treg molecules. This is juxtaposed with a concomitant increase in the expression of molecules associated with central Tregs. Likewise, the T-Rptor−/− Tregs were overall less glycolytic, further demonstrating the important role of mTORC1 in glycolytic programming in Tregs.
The decrease in effector molecules in the absence of mTORC1 activity suggested that Tregs from the T-Rptor−/− mice would be less effective in suppressing T cell function. To this end, we performed an in vitro suppression assay using sorted Tregs from the spleen and lymph nodes of T-Rptor−/− mice and WT littermate control mice. Indeed, the T-Rptor−/− Tregs were less effective in suppressing proliferation when compared to the WT Tregs (Figure 4E). Notably, the T-Rptor−/− Tregs can still suppress effector T cell proliferation, just not as efficiently as WT Tregs.
Next, we wanted to determine the role of mTORC1 activity in regulating eTreg function in vivo. To this end, T-Rptor−/− mice and WT littermate control mice were inoculated subcutaneously with 2×10⁵ B16-F10 melanoma cells. On day 14, the tumors were harvested and evaluated for tumor infiltrating lymphocytes. We did not observe any differences in tumor area or mass between the WT and T-Rptor−/− mice at this time point (Figure 5A). Regardless of the similarity in tumor size, we observed a significant decrease in the overall percentage of tumor infiltrating FoxP3+ Tregs in the T-Rptor−/− mice when compared to the WT mice (Figure 5B). Moreover, the tumor infiltrating Tregs in the T-Rptor−/− mice consistently demonstrated significantly decreased cell surface expression of the Treg effector molecules ICOS, CLTA-4 and PD-1 (Figures 5C–E).
Figure 5.

mTORC1-deficient Tregs have decreased effector molecule expression
B16-F10 melanoma cells (2 × 10⁵) were inoculated subcutaneously in WT or T-Rptor−/− mice. (a) Tumor area and mass of B16-F10 tumors were measured at day 14 post-inoculation. (b) Percentage of tumor infiltrating Tregs between WT and T-Rptor−/− mice was examined. Summary is shown on the right. (c–e) Summary of flow cytometry analysis of effector molecules (c) ICOS, (d) CTLA-4, and (e) PD-1 between WT and T-Rptor−/− Tregs in tumors was examined. (f) Sorted splenic WT or T-Rptor−/− eTregs were combined with conventional CD4+ and CD8+ T cells and then adoptively transferred to Rag2−/− mice. Two days post cell transfer, mice were implanted subcutaneously with B16-F10 melanoma cells. Tumor growth was monitored over time. *P < 0.05; **P < 0.005; ***P < 0.0005; ns, no significance (Mann-Whitney t test). Data are representative of at least three (a–e) or two independent experiments (f).
To further address the intrinsic role for Rptor-deficient Tregs in anti-tumor immunity, we utilized an adoptive transfer model that was previously shown to address Treg function in a tumor setting (47). In short, sorted conventional CD4+ and CD8+ T cells were mixed with either splenic WT or T-Rptor−/− eTregs and then adoptively transferred into Rag2−/− hosts. Two days later, 2 × 10⁵ B16-F10 melanoma cells were injected into the flanks of the Rag2−/− mice. Tumor growth was monitored as a means of evaluating the ability of the transferred eTregs to suppress the anti-tumor immune response. Mice that received no T cells demonstrated the most rapid tumor growth (Figure 5F). Mice that received WT conventional CD4+/CD8+ T cells and WT eTregs demonstrated slightly slower tumor growth. On the other hand, mice that received WT CD4+/CD8+ T cells and T-Rptor−/− eTregs had the slowest tumor growth. That is, the T-Rptor−/− eTregs cells were less able to inhibit the anti-tumor response of the conventional T cells.
Inhibition of mTORC1 enhances generation of central Tregs
Activation of naïve CD4+ T cells (with anti-CD3 and anti-CD28) in the presence of exogenous TGFβ and IL-2 leads to the robust generation of FoxP3+ Tregs (19, 20, 22, 23) (Figure 6A). However, this method of promoting Treg generation also results in robust mTORC1 activation. Indeed, the vast majority of Tregs in such cultures display an eTregs phenotype CD44hi CD62Llo (Figure 6B). Furthermore, as previously shown in vivo, these CD62Llo Tregs demonstrate increased mTORC1 activity compared to CD62Lhi Tregs (Figure 6C). Note, in this figure the untreated cells are primarily CD4+ Foxp3− cells and the mTORC1 activity in this population of “effector” cells is comparable to the Tregs. Thus, utilizing the standard method of activating CD4+ T cells in the presence of exogenous TGFβ leads to the immediate generation of mTORC1hi eTregs.
Figure 6.

Tregs generated under mTOR suppression display a memory-like phenotype
Naïve CD4+ T cells were isolated and activated with plate-bound anti-CD3 (3 μg/ml) and soluble anti-CD28 (2 μg/ml) in the presence or absence of TGFβ (10 ng/mL) and IL-2 (10 ng/ml). Cells were either cultured in the presence or absence of rapamycin (100 nM). (a) FoxP3 expression between CD4+ T cells activated under either non-polarizing (NT) or Treg-polarizing condition (TGFβ) were analyzed on day 2. (b) Comparison of CD44 and CD62L expression among CD4+ FoxP3+ cells from (a). (c) mTORC1 activity among CD62Lhi and CD62Llo cells gated from CD4+ FoxP3+ cells. (d) FoxP3 expression of CD4+ T cells activated under Treg-polarizing condition (TGFβ) with or without rapamycin treatment on day 2. (e) Comparison of CD44 and CD62L expression among CD4+ FoxP3+ cells from (d). (f) Comparison of p-S6 level in cells generated under TGFβ with or without rapamycin conditions. (g) Extracellular acidification rate (ECAR) and (h) oxygen consumption rate (OCR) between cells generated under Treg-polarizing condition treated with or without rapamycin were measured. SRC was shown on the right. Oligo, oligomycin; R+A, rotenone and antimycin A. *P < 0.05; **P < 0.005 (Mann-Whitney t test). Data are representative of at least three independent experiments
Next, we stimulated naïve CD4+ T cells in the presence of TGFβ and IL-2 for 3 days with or without rapamycin. Under these Treg promoting conditions, there were similar percentages of FoxP3+ Tregs both in the presence and absence of rapamycin (Figure 6D). However, the presence of rapamycin markedly enhanced the generation of the CD62Lhi central Tregs (Figure 6E) with decreased p-S6 (Figure 6F). Metabolically, the rapamycin-treated Tregs showed a significantly lower basal glycolytic rate, as measured by extracellular acidification rate (ECAR), than non-treated Tregs (Figure 6G). Conversely, the rapamycin-treated Tregs possessed a higher oxygen consumption rate (OCR) and an increased spare respiratory capacity (Figure 6H).
The presence of rapamycin led to the robust generation of cTregs. Furthermore, these cells possessed increased SRC, which is a hallmark metabolic property of memory CD8+ T cells (46). Thus, we hypothesized that the Tregs generated in the presence of rapamycin would demonstrate increased persistence upon adoptive transfer. To test this hypothesis, Tregs were generated in vitro in the presence or absence of rapamycin and adoptively transferred into congenically distinct WT mice. Fourteen days after transfer, spleen and lymph nodes were harvested. We observed that the percentage of recovered Tregs from both the spleen and lymph nodes was significantly higher in the mice that received the rapamycin-treated cells (Figure 7A). Furthermore, most of the recovered cells from both the untreated or rapamycin treated mice showed higher proportions of CD62Lhi cells both in the spleen and lymph nodes, indicative of central Tregs (Figure 7B).
Figure 7.
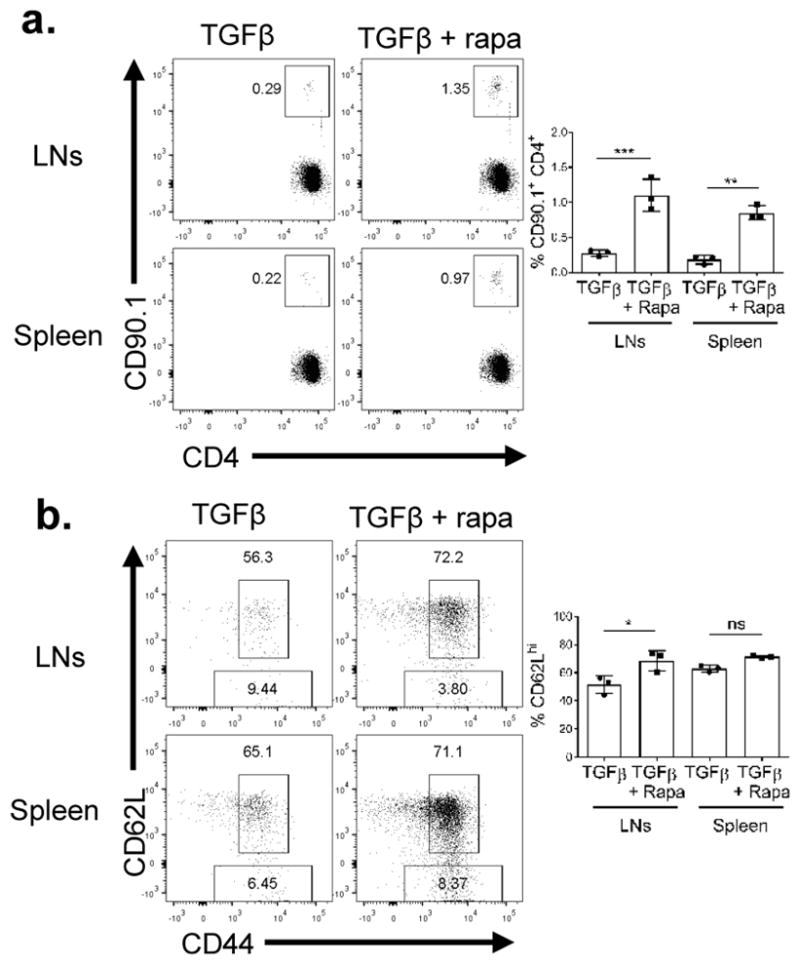
Tregs generatesuppd under mTOR suppression persist longer in vivo
Tregs (1×10⁶) generated as described in Figure 6 were adoptively transferred into congenically distinct hosts. Fourteen days post adoptive transfer, spleen and lymph nodes (LNs) were harvested. (a) Percentage of CD90.1+ CD4+ T cells recovery and (b) CD44 and CD62L expression were examined. *P < 0.05; **P < 0.005; ***P < 0.0005; ns, no significance (1way ANOVA with Tukey’s multiple comparison test). Data are representative of at least three independent experiments.
Discussion
Based on studies from our own lab and others we have proposed a model whereby mTOR signaling integrates cues from the immune microenvironment to regulate T cell activation, differentiation and function (30, 40, 48–50). Moreover, mTOR signaling also directly links environmental cues to modulate metabolism in support for cell growth and proliferation (39–41, 49). In this current work, we further define the role for mTOR in regulating the activation and differentiation of regulatory T cells. Previous studies by Smigiel et al. defined a population of cTreg and eTreg subsets based on selective homeostatic properties (12). Specifically, they defined cTregs as being CD44lo CD62Lhi CCR7hi cells located within the secondary lymphoid tissue and dependent upon access to IL-2 for long term survival. In contrast, effector Tregs are CD44hi CD62Llo CCR7lo and are found in the peripheral tissues and depend on ICOS signaling. Using this paradigm, we have been able to demonstrate that central Tregs are defined by lower mTORC1 activity (Figure 1C and 1D). Metabolically, cTregs are less glycolytic (Figure 2 and 6G) and have increased spare respiratory capacity (Figure 6H). Furthermore, such cells demonstrate robust persistence upon adoptive transfer (Figure 7). This is analogous to long-lived CD8+ memory T cells, which are also mTORC1lo and have increased SRC along with increased in mitochondrial mass to effector CD8+ T cells (35, 36, 46). Conversely, we observed increased mTORC1 activity in eTregs. Metabolically, eTregs demonstrated increased glycolytic programming (Figure 2), which is a characteristic of effector CD8+ T cells (40). Moreover, mice that received rapamycin treatment continuously for 6 days demonstrated increased central to effector Treg ratios, suggesting the need of mTORC1 activity for effector Treg conversion (Figure 3D). Furthermore, genetic deletion of Rptor mitigated the suppressor function of the eTregs. Interestingly, the T-Rptor−/− mice demonstrated equivalent percentages of phenotypic (CD44hi CD62Llo) eTregs, but such cells demonstrated decreased ICOS and PD-1 expression (Figure 4B) consistent with their defective suppressive function (Figure 4E and Figure 5F). In addition, T-Rptor−/− Tregs showed a reduction in glycolysis and TCA cycle metabolism from glucose (Supplemental Figure 3E). The functional manifestation of their defects was reflected in decreased tumor infiltration of Tregs from the T-Rptor−/− mice in vivo (Figure 5B). Overall, based on these results we propose that the CD44lo CD62Lhi mTORlo cells (described as cTregs) represents a pool of central “memory” Tregs while the CD44hi CD62Llo mTORhi cells depict the eTregs (Figure 8). In the absence of mTORC1 activity, as we demonstrated with T-Rptor−/− mice, eTregs fail to upregulate mTOR activity and downstream metabolic reprogramming while cTregs compartment did not change. This further indicates that the differential mTOR activity in regulating the function of the two subsets. Further, while decreased mTORC1 activity promotes the generation of cTreg, if such cells do not have the capability to upregulate mTORC1 activity (for example in the T-Rptor−/− cells), then they lose their effector Treg functional ability.
Figure 8.

Model for the regulation of Tregs by mTOR
Observations regarding the regulation of Tregs by mTOR have been complex and at times seemingly paradoxical. Several studies have shown that the strength of TCR signaling affects CD4+ T cell differentiation, particularly differential TCR-induced mTOR activity can modulate FoxP3 expression (51–57). Early studies employing rapamycin demonstrated that mTOR inhibition enhanced the generation of induced Tregs (iTregs) (25–28). Additionally, such findings were further supported by genetic knockout studies of mTOR signaling pathway components (30–32). Specifically, high Akt signaling induced by strong TCR activation can inhibit iTreg differentiation in the periphery (31, 58–60). In this report, we demonstrated that iTregs generated concomitantly with rapamycin showed decreased mTOR activity with an increased in SRC (Figure 6). These mTORlo Tregs phenocopied cTregs that were found in the peripheral tissues and were more long-lived in an adoptive transfer model (Figure 7). This phenomenon is not due to the stability of FoxP3 expression since the recovered T cells from the adoptive transfer experiment displayed equivalent levels of FoxP3 expression (Supplemental Figure 4). Alternatively, this increased longevity of Tregs can be explained by mTOR regulating the metabolic programming of these cells. The Tregs that were generated under mTOR inhibition resemble that of the central Tregs generated from the thymus.
Previous studies observed that mTOR signaling is elevated in peripheral Tregs from human and mice compared to conventional CD4+ T cells (33, 34, 61–64). This led to their conclusion that all peripheral Tregs have high mTOR activity and glycolysis. Further supporting the role of mTORC1 activity in promoting Treg function is the observation in mice that T-Rptor−/− Tregs, which lack mTORC1 activity, have been shown to be functionally defective (34). However, previous studies using a mixed population of Tregs cannot reveal the precise role of mTOR in regulating metabolism and function of Tregs. Thus, we demonstrated that there are two distinct mTORhi and mTORlo peripheral Tregs with differential metabolic phenotypes. Our revised model posits that mTOR activity is necessary for upregulation of glycolysis and Treg effector molecules in eTregs for their optimal function, while inhibition of mTOR promotes the generation of cTreg (memory) cells (Figure 8). In future studies, it will be interesting to examine mTORC1 activity in freshly isolated eTreg, cTreg, naïve and memory CD4+ CD25− CD45RO+ CD127+ human T cells.
Likewise, we observed that effector Tregs are more glycolytic while central “memory” Tregs possess increased SRC (Figure 2 and 6H). Recently, it has been reported that Tregs with hyper-mTOR activity and increased glycolysis possess decreased suppressive function (65–67). Although these studies seem to contradict our model that mTOR activity and upregulation of glycolysis are important for optimal effector Treg function, it is important to note that mTORC1 activity in these studies was induced through TLR stimulation. Under these conditions, these mTORhi glycolytic Tregs observed in those studies possessed decreased FoxP3 expression, which itself has been shown to maintain a stable Treg signature (65, 68–70). In our model, the expression of FoxP3 is equivalent in the effector and central “memory” Tregs (Figure 1A, right). Thus, we propose that robust TCR stimulation in the presence of a suppressive microenvironment (TGFβ) promotes mTORC1hi Treg effector cell generation. In contrast, when robust activation of Tregs occurs in the presence of inflammatory signals (TLR signaling or high PI3K signaling), this leads to decreased FoxP3 expression and consequently decreased suppression capability.
Our data also serves to better define the mechanism by which rapamycin promotes Tregs. While the addition of rapamycin has been shown to promote Tregs both in vivo and in vitro (25–28), a common technique for the generation of such cells in vitro has been maximal activation of naïve CD4+ T cells in the presence of TGFβ. Such conditions actually lead to robust mTORC1 activity. In our model, such strong stimulation leads initially to the maximal generation of effector Tregs (Figure 8). Over time, the Tregs remaining in these culture conditions become mTORlo memory Tregs (Figure 8, 5–7 days post activation). Alternatively, the addition of rapamycin to these culture conditions leads to the generation of central “memory” Tregs with increased SRC and persistence (Figure 6 and 7). Several studies have demonstrated the utility of adoptively transferring Tregs in order to inhibit autoimmunity, transplant rejection, or graft-versus-host disease (16, 71–74). From a clinical perspective, our data suggests that mTORC1 inhibition with rapamycin is an effective means of promoting robust memory Tregs for adoptive transfer. Likewise, our data suggests that the use of mTORC1 inhibitors in vivo might also promote the generation of long-lasting central “memory” Tregs (Figure 7).
In summary, our work helps to clarify the precise role of mTOR signaling in regulating Treg differentiation and function. Our studies serve to support and extend the model defining the distinct Tregs subsets discovered and defined by the Campbell lab by further defining these subsets based on mTOR activity and metabolic programming. In this regard, our results do not define a continuum of mTORC1 activity in activated Tregs but rather define the level of mTORC1 activity within defined populations of Tregs. In our revised model, we propose that FoxP3+ Tregs emerging from the thymus possess characteristics phenotypically and metabolically of central “memory” Tregs (Figure 8). Such central Tregs provide the pool of Tregs which will migrate to the tissues and become eTregs when encountering antigen (under non-inflammatory conditions). Similar to effector CD8+ T cells, these eTregs are characterized by increased mTOR activity, glycolysis, and effector molecule upregulation after antigen encounter. Furthermore, our model can account for the divergent methods of generating Tregs in vitro. We propose that strong stimulation of naïve CD4+ T cells leads to the generation of an mTORhi effector cell pool. Alternatively, after 5–7 days in culture, the remaining FoxP3+ cells are now mTORlo with decreased glycolysis and will behave like central “memory” Tregs. Likewise, the generation of central “memory” T cells in vitro can be markedly enhanced by adding rapamycin to Treg culture conditions.
Supplementary Material
Acknowledgments
We would to thank the members of the Powell lab for their critical review and discussion of this manuscript. We also thank Dr. William Bishai for the generous use of their mass-spectrometry instrument, and Dr. Charles Drake for providing the FoxP3-GFP mice.
Footnotes
This work was supported by the NIH (AI77610 and AI091481 to J.D.P., and 5P30CA006973 to the JHU Oncology Research Center) and the Bloomberg-Kimmel Institute for Cancer Immunotherapy (to J.D.P.).
References
- 1.Morikawa H, Sakaguchi S. Genetic and epigenetic basis of Treg cell development and function: from a FoxP3-centered view to an epigenome-defined view of natural Treg cells. Immunol Rev. 2014;259:192–205. doi: 10.1111/imr.12174. [DOI] [PubMed] [Google Scholar]
- 2.Cipolletta D, Feuerer M, Li A, Kamei N, Lee J, Shoelson SE, Benoist C, Mathis D. PPAR-gamma is a major driver of the accumulation and phenotype of adipose tissue Treg cells. Nature. 2012;486:549–553. doi: 10.1038/nature11132. [DOI] [PMC free article] [PubMed] [Google Scholar]
- 3.Koch MA, Tucker-Heard G, Perdue NR, Killebrew JR, Urdahl KB, Campbell DJ. The transcription factor T-bet controls regulatory T cell homeostasis and function during type 1 inflammation. Nat Immunol. 2009;10:595–602. doi: 10.1038/ni.1731. [DOI] [PMC free article] [PubMed] [Google Scholar]
- 4.Zheng Y, Chaudhry A, Kas A, deRoos P, Kim JM, Chu TT, Corcoran L, Treuting P, Klein U, Rudensky AY. Regulatory T-cell suppressor program co-opts transcription factor IRF4 to control T(H)2 responses. Nature. 2009;458:351–356. doi: 10.1038/nature07674. [DOI] [PMC free article] [PubMed] [Google Scholar]
- 5.Cretney E, Xin A, Shi W, Minnich M, Masson F, Miasari M, Belz GT, Smyth GK, Busslinger M, Nutt SL, Kallies A. The transcription factors Blimp-1 and IRF4 jointly control the differentiation and function of effector regulatory T cells. Nat Immunol. 2011;12:304–311. doi: 10.1038/ni.2006. [DOI] [PubMed] [Google Scholar]
- 6.Wang Y, Su MA, Wan YY. An essential role of the transcription factor GATA-3 for the function of regulatory T cells. Immunity. 2011;35:337–348. doi: 10.1016/j.immuni.2011.08.012. [DOI] [PMC free article] [PubMed] [Google Scholar]
- 7.Wohlfert EA, Grainger JR, Bouladoux N, Konkel JE, Oldenhove G, Ribeiro CH, Hall JA, Yagi R, Naik S, Bhairavabhotla R, Paul WE, Bosselut R, Wei G, Zhao K, Oukka M, Zhu J, Belkaid Y. GATA3 controls Foxp3(+) regulatory T cell fate during inflammation in mice. J Clin Invest. 2011;121:4503–4515. doi: 10.1172/JCI57456. [DOI] [PMC free article] [PubMed] [Google Scholar]
- 8.Yu F, Sharma S, Edwards J, Feigenbaum L, Zhu J. Dynamic expression of transcription factors T-bet and GATA-3 by regulatory T cells maintains immunotolerance. Nat Immunol. 2015;16:197–206. doi: 10.1038/ni.3053. [DOI] [PMC free article] [PubMed] [Google Scholar]
- 9.Levine AG, Arvey A, Jin W, Rudensky AY. Continuous requirement for the TCR in regulatory T cell function. Nat Immunol. 2014;15:1070–1078. doi: 10.1038/ni.3004. [DOI] [PMC free article] [PubMed] [Google Scholar]
- 10.Chung Y, Tanaka S, Chu F, Nurieva RI, Martinez GJ, Rawal S, Wang YH, Lim H, Reynolds JM, Zhou XH, Fan HM, Liu ZM, Neelapu SS, Dong C. Follicular regulatory T cells expressing Foxp3 and Bcl-6 suppress germinal center reactions. Nat Med. 2011;17:983–988. doi: 10.1038/nm.2426. [DOI] [PMC free article] [PubMed] [Google Scholar]
- 11.Linterman MA, Pierson W, Lee SK, Kallies A, Kawamoto S, Rayner TF, Srivastava M, Divekar DP, Beaton L, Hogan JJ, Fagarasan S, Liston A, Smith KG, Vinuesa CG. Foxp3+ follicular regulatory T cells control the germinal center response. Nat Med. 2011;17:975–982. doi: 10.1038/nm.2425. [DOI] [PMC free article] [PubMed] [Google Scholar]
- 12.Smigiel KS, Richards E, Srivastava S, Thomas KR, Dudda JC, Klonowski KD, Campbell DJ. CCR7 provides localized access to IL-2 and defines homeostatically distinct regulatory T cell subsets. J Exp Med. 2014;211:121–136. doi: 10.1084/jem.20131142. [DOI] [PMC free article] [PubMed] [Google Scholar]
- 13.Sakaguchi S, Sakaguchi N, Asano M, Itoh M, Toda M. Immunologic self-tolerance maintained by activated T cells expressing IL-2 receptor alpha-chains (CD25). Breakdown of a single mechanism of self-tolerance causes various autoimmune diseases. J Immunol. 1995;155:1151–1164. [PubMed] [Google Scholar]
- 14.Salomon B, Lenschow DJ, Rhee L, Ashourian N, Singh B, Sharpe A, Bluestone JA. B7/CD28 costimulation is essential for the homeostasis of the CD4+CD25+ immunoregulatory T cells that control autoimmune diabetes. Immunity. 2000;12:431–440. doi: 10.1016/s1074-7613(00)80195-8. [DOI] [PubMed] [Google Scholar]
- 15.Kohm AP, Carpentier PA, Anger HA, Miller SD. Cutting edge: CD4+CD25+ regulatory T cells suppress antigen-specific autoreactive immune responses and central nervous system inflammation during active experimental autoimmune encephalomyelitis. J Immunol. 2002;169:4712–4716. doi: 10.4049/jimmunol.169.9.4712. [DOI] [PubMed] [Google Scholar]
- 16.Mottet C, Uhlig HH, Powrie F. Cutting edge: cure of colitis by CD4+CD25+ regulatory T cells. J Immunol. 2003;170:3939–3943. doi: 10.4049/jimmunol.170.8.3939. [DOI] [PubMed] [Google Scholar]
- 17.Hori S, Nomura T, Sakaguchi S. Control of regulatory T cell development by the transcription factor Foxp3. Science. 2003;299:1057–1061. doi: 10.1126/science.1079490. [DOI] [PubMed] [Google Scholar]
- 18.Fontenot JD, Gavin MA, Rudensky AY. Foxp3 programs the development and function of CD4+CD25+ regulatory T cells. Nat Immunol. 2003;4:330–336. doi: 10.1038/ni904. [DOI] [PubMed] [Google Scholar]
- 19.Chen W, Jin W, Hardegen N, Lei KJ, Li L, Marinos N, McGrady G, Wahl SM. Conversion of peripheral CD4+CD25- naive T cells to CD4+CD25+ regulatory T cells by TGF-beta induction of transcription factor Foxp3. J Exp Med. 2003;198:1875–1886. doi: 10.1084/jem.20030152. [DOI] [PMC free article] [PubMed] [Google Scholar]
- 20.Fu S, Zhang N, Yopp AC, Chen D, Mao M, Chen D, Zhang H, Ding Y, Bromberg JS. TGF-beta induces Foxp3 + T-regulatory cells from CD4 + CD25 - precursors. Am J Transplant. 2004;4:1614–1627. doi: 10.1111/j.1600-6143.2004.00566.x. [DOI] [PubMed] [Google Scholar]
- 21.Thornton AM, Donovan EE, Piccirillo CA, Shevach EM. Cutting edge: IL-2 is critically required for the in vitro activation of CD4+CD25+ T cell suppressor function. J Immunol. 2004;172:6519–6523. doi: 10.4049/jimmunol.172.11.6519. [DOI] [PubMed] [Google Scholar]
- 22.Kretschmer K, Apostolou I, Hawiger D, Khazaie K, Nussenzweig MC, von Boehmer H. Inducing and expanding regulatory T cell populations by foreign antigen. Nat Immunol. 2005;6:1219–1227. doi: 10.1038/ni1265. [DOI] [PubMed] [Google Scholar]
- 23.Li MO, Sanjabi S, Flavell RA. Transforming growth factor-beta controls development, homeostasis, and tolerance of T cells by regulatory T cell-dependent and -independent mechanisms. Immunity. 2006;25:455–471. doi: 10.1016/j.immuni.2006.07.011. [DOI] [PubMed] [Google Scholar]
- 24.Mucida D, Park Y, Kim G, Turovskaya O, Scott I, Kronenberg M, Cheroutre H. Reciprocal TH17 and regulatory T cell differentiation mediated by retinoic acid. Science. 2007;317:256–260. doi: 10.1126/science.1145697. [DOI] [PubMed] [Google Scholar]
- 25.Battaglia M, Stabilini A, Migliavacca B, Horejs-Hoeck J, Kaupper T, Roncarolo MG. Rapamycin promotes expansion of functional CD4+CD25+FOXP3+ regulatory T cells of both healthy subjects and type 1 diabetic patients. J Immunol. 2006;177:8338–8347. doi: 10.4049/jimmunol.177.12.8338. [DOI] [PubMed] [Google Scholar]
- 26.Valmori D, Tosello V, Souleimanian NE, Godefroy E, Scotto L, Wang Y, Ayyoub M. Rapamycin-mediated enrichment of T cells with regulatory activity in stimulated CD4+ T cell cultures is not due to the selective expansion of naturally occurring regulatory T cells but to the induction of regulatory functions in conventional CD4+ T cells. J Immunol. 2006;177:944–949. doi: 10.4049/jimmunol.177.2.944. [DOI] [PubMed] [Google Scholar]
- 27.Turnquist HR, Raimondi G, Zahorchak AF, Fischer RT, Wang Z, Thomson AW. Rapamycin-conditioned dendritic cells are poor stimulators of allogeneic CD4+ T cells, but enrich for antigen-specific Foxp3+ T regulatory cells and promote organ transplant tolerance. J Immunol. 2007;178:7018–7031. doi: 10.4049/jimmunol.178.11.7018. [DOI] [PubMed] [Google Scholar]
- 28.Strauss L, Czystowska M, Szajnik M, Mandapathil M, Whiteside TL. Differential responses of human regulatory T cells (Treg) and effector T cells to rapamycin. PLoS One. 2009;4:e5994. doi: 10.1371/journal.pone.0005994. [DOI] [PMC free article] [PubMed] [Google Scholar]
- 29.Zeiser R, Leveson-Gower DB, Zambricki EA, Kambham N, Beilhack A, Loh J, Hou JZ, Negrin RS. Differential impact of mammalian target of rapamycin inhibition on CD4+CD25+Foxp3+ regulatory T cells compared with conventional CD4+ T cells. Blood. 2008;111:453–462. doi: 10.1182/blood-2007-06-094482. [DOI] [PMC free article] [PubMed] [Google Scholar]
- 30.Delgoffe GM, Kole TP, Zheng Y, Zarek PE, Matthews KL, Xiao B, Worley PF, Kozma SC, Powell JD. The mTOR kinase differentially regulates effector and regulatory T cell lineage commitment. Immunity. 2009;30:832–844. doi: 10.1016/j.immuni.2009.04.014. [DOI] [PMC free article] [PubMed] [Google Scholar]
- 31.Haxhinasto S, Mathis D, Benoist C. The AKT-mTOR axis regulates de novo differentiation of CD4+Foxp3+ cells. J Exp Med. 2008;205:565–574. doi: 10.1084/jem.20071477. [DOI] [PMC free article] [PubMed] [Google Scholar]
- 32.Chang X, Lazorchak AS, Liu D, Su B. Sin1 regulates Treg-cell development but is not required for T-cell growth and proliferation. Eur J Immunol. 2012;42:1639–1647. doi: 10.1002/eji.201142066. [DOI] [PMC free article] [PubMed] [Google Scholar]
- 33.Procaccini C, De Rosa V, Galgani M, Abanni L, Cali G, Porcellini A, Carbone F, Fontana S, Horvath TL, La Cava A, Matarese G. An oscillatory switch in mTOR kinase activity sets regulatory T cell responsiveness. Immunity. 2010;33:929–941. doi: 10.1016/j.immuni.2010.11.024. [DOI] [PMC free article] [PubMed] [Google Scholar]
- 34.Zeng H, Yang K, Cloer C, Neale G, Vogel P, Chi H. mTORC1 couples immune signals and metabolic programming to establish T(reg)-cell function. Nature. 2013;499:485–490. doi: 10.1038/nature12297. [DOI] [PMC free article] [PubMed] [Google Scholar]
- 35.Araki K, Turner AP, Shaffer VO, Gangappa S, Keller SA, Bachmann MF, Larsen CP, Ahmed R. mTOR regulates memory CD8 T-cell differentiation. Nature. 2009;460:108–112. doi: 10.1038/nature08155. [DOI] [PMC free article] [PubMed] [Google Scholar]
- 36.Pollizzi KN, Patel CH, Sun IH, Oh MH, Waickman AT, Wen J, Delgoffe GM, Powell JD. mTORC1 and mTORC2 selectively regulate CD8(+) T cell differentiation. J Clin Invest. 2015;125:2090–2108. doi: 10.1172/JCI77746. [DOI] [PMC free article] [PubMed] [Google Scholar]
- 37.Zhang L, Tschumi BO, Lopez-Mejia IC, Oberle SG, Meyer M, Samson G, Ruegg MA, Hall MN, Fajas L, Zehn D, Mach JP, Donda A, Romero P. Mammalian Target of Rapamycin Complex 2 Controls CD8 T Cell Memory Differentiation in a Foxo1-Dependent Manner. Cell Rep. 2016;14:1206–1217. doi: 10.1016/j.celrep.2015.12.095. [DOI] [PubMed] [Google Scholar]
- 38.Zheng Y, Delgoffe GM, Meyer CF, Chan W, Powell JD. Anergic T cells are metabolically anergic. J Immunol. 2009;183:6095–6101. doi: 10.4049/jimmunol.0803510. [DOI] [PMC free article] [PubMed] [Google Scholar]
- 39.Saxton RA, Sabatini DM. mTOR Signaling in Growth, Metabolism, and Disease. Cell. 2017;168:960–976. doi: 10.1016/j.cell.2017.02.004. [DOI] [PMC free article] [PubMed] [Google Scholar]
- 40.Pollizzi KN, Powell JD. Integrating canonical and metabolic signalling programmes in the regulation of T cell responses. Nat Rev Immunol. 2014;14:435–446. doi: 10.1038/nri3701. [DOI] [PMC free article] [PubMed] [Google Scholar]
- 41.Duvel K, Yecies JL, Menon S, Raman P, Lipovsky AI, Souza AL, Triantafellow E, Ma Q, Gorski R, Cleaver S, Vander Heiden MG, MacKeigan JP, Finan PM, Clish CB, Murphy LO, Manning BD. Activation of a metabolic gene regulatory network downstream of mTOR complex 1. Mol Cell. 2010;39:171–183. doi: 10.1016/j.molcel.2010.06.022. [DOI] [PMC free article] [PubMed] [Google Scholar]
- 42.Cheng SC, Quintin J, Cramer RA, Shepardson KM, Saeed S, Kumar V, Giamarellos-Bourboulis EJ, Martens JH, Rao NA, Aghajanirefah A, Manjeri GR, Li Y, Ifrim DC, Arts RJ, van der Veer BM, Deen PM, Logie C, O’Neill LA, Willems P, van de Veerdonk FL, van der Meer JW, Ng A, Joosten LA, Wijmenga C, Stunnenberg HG, Xavier RJ, Netea MG. mTOR- and HIF-1alpha-mediated aerobic glycolysis as metabolic basis for trained immunity. Science. 2014;345:1250684. doi: 10.1126/science.1250684. [DOI] [PMC free article] [PubMed] [Google Scholar]
- 43.Vasanthakumar A, Moro K, Xin A, Liao Y, Gloury R, Kawamoto S, Fagarasan S, Mielke LA, Afshar-Sterle S, Masters SL, Nakae S, Saito H, Wentworth JM, Li P, Liao W, Leonard WJ, Smyth GK, Shi W, Nutt SL, Koyasu S, Kallies A. The transcriptional regulators IRF4, BATF and IL-33 orchestrate development and maintenance of adipose tissue-resident regulatory T cells. Nat Immunol. 2015;16:276–285. doi: 10.1038/ni.3085. [DOI] [PubMed] [Google Scholar]
- 44.Raczkowski F, Ritter J, Heesch K, Schumacher V, Guralnik A, Hocker L, Raifer H, Klein M, Bopp T, Harb H, Kesper DA, Pfefferle PI, Grusdat M, Lang PA, Mittrucker HW, Huber M. The transcription factor Interferon Regulatory Factor 4 is required for the generation of protective effector CD8+ T cells. Proc Natl Acad Sci U S A. 2013;110:15019–15024. doi: 10.1073/pnas.1309378110. [DOI] [PMC free article] [PubMed] [Google Scholar]
- 45.Michalek RD, V, Gerriets A, Jacobs SR, Macintyre AN, MacIver NJ, Mason EF, Sullivan SA, Nichols AG, Rathmell JC. Cutting edge: distinct glycolytic and lipid oxidative metabolic programs are essential for effector and regulatory CD4+ T cell subsets. J Immunol. 2011;186:3299–3303. doi: 10.4049/jimmunol.1003613. [DOI] [PMC free article] [PubMed] [Google Scholar]
- 46.van der Windt GJ, Everts B, Chang CH, Curtis JD, Freitas TC, Amiel E, Pearce EJ, Pearce EL. Mitochondrial respiratory capacity is a critical regulator of CD8+ T cell memory development. Immunity. 2012;36:68–78. doi: 10.1016/j.immuni.2011.12.007. [DOI] [PMC free article] [PubMed] [Google Scholar]
- 47.Kurtulus S, Sakuishi K, Ngiow SF, Joller N, Tan DJ, Teng MW, Smyth MJ, Kuchroo VK, Anderson AC. TIGIT predominantly regulates the immune response via regulatory T cells. J Clin Invest. 2015;125:4053–4062. doi: 10.1172/JCI81187. [DOI] [PMC free article] [PubMed] [Google Scholar] [Retracted]
- 48.Delgoffe GM, Pollizzi KN, Waickman AT, Heikamp E, Meyers DJ, Horton MR, Xiao B, Worley PF, Powell JD. The kinase mTOR regulates the differentiation of helper T cells through the selective activation of signaling by mTORC1 and mTORC2. Nat Immunol. 2011;12:295–303. doi: 10.1038/ni.2005. [DOI] [PMC free article] [PubMed] [Google Scholar]
- 49.Pollizzi KN, Powell JD. Regulation of T cells by mTOR: the known knowns and the known unknowns. Trends Immunol. 2015;36:13–20. doi: 10.1016/j.it.2014.11.005. [DOI] [PMC free article] [PubMed] [Google Scholar]
- 50.Powell JD, Pollizzi KN, Heikamp EB, Horton MR. Regulation of immune responses by mTOR. Annu Rev Immunol. 2012;30:39–68. doi: 10.1146/annurev-immunol-020711-075024. [DOI] [PMC free article] [PubMed] [Google Scholar]
- 51.Pollizzi KN, Waickman AT, Patel CH, Sun IH, Powell JD. Cellular size as a means of tracking mTOR activity and cell fate of CD4+ T cells upon antigen recognition. PLoS One. 2015;10:e0121710. doi: 10.1371/journal.pone.0121710. [DOI] [PMC free article] [PubMed] [Google Scholar]
- 52.Turner MS, Kane LP, Morel PA. Dominant role of antigen dose in CD4+Foxp3+ regulatory T cell induction and expansion. J Immunol. 2009;183:4895–4903. doi: 10.4049/jimmunol.0901459. [DOI] [PMC free article] [PubMed] [Google Scholar]
- 53.Miskov-Zivanov N, Turner MS, Kane LP, Morel PA, Faeder JR. The duration of T cell stimulation is a critical determinant of cell fate and plasticity. Sci Signal. 2013;6:ra97. doi: 10.1126/scisignal.2004217. [DOI] [PMC free article] [PubMed] [Google Scholar]
- 54.Qiao G, Zhao Y, Li Z, Tang PQ, Langdon WY, Yang T, Zhang J. T cell activation threshold regulated by E3 ubiquitin ligase Cbl-b determines fate of inducible regulatory T cells. J Immunol. 2013;191:632–639. doi: 10.4049/jimmunol.1202068. [DOI] [PMC free article] [PubMed] [Google Scholar]
- 55.van Panhuys N, Klauschen F, Germain RN. T-cell-receptor-dependent signal intensity dominantly controls CD4(+) T cell polarization In Vivo. Immunity. 2014;41:63–74. doi: 10.1016/j.immuni.2014.06.003. [DOI] [PMC free article] [PubMed] [Google Scholar]
- 56.Tubo NJ, Jenkins MK. TCR signal quantity and quality in CD4(+) T cell differentiation. Trends Immunol. 2014;35:591–596. doi: 10.1016/j.it.2014.09.008. [DOI] [PMC free article] [PubMed] [Google Scholar]
- 57.O’Hagan KL, Choi J, Pryshchep O, Chernoff J, Phee H. Pak2 Links TCR Signaling Strength to the Development of Regulatory T Cells and Maintains Peripheral Tolerance. J Immunol. 2015;195:1564–1577. doi: 10.4049/jimmunol.1500843. [DOI] [PMC free article] [PubMed] [Google Scholar]
- 58.Sauer S, Bruno L, Hertweck A, Finlay D, Leleu M, Spivakov M, Knight ZA, Cobb BS, Cantrell D, O’Connor E, Shokat KM, Fisher AG, Merkenschlager M. T cell receptor signaling controls Foxp3 expression via PI3K, Akt, and mTOR. Proc Natl Acad Sci U S A. 2008;105:7797–7802. doi: 10.1073/pnas.0800928105. [DOI] [PMC free article] [PubMed] [Google Scholar]
- 59.Gottschalk RA, Corse E, Allison JP. TCR ligand density and affinity determine peripheral induction of Foxp3 in vivo. J Exp Med. 2010;207:1701–1711. doi: 10.1084/jem.20091999. [DOI] [PMC free article] [PubMed] [Google Scholar]
- 60.Hawse WF, Boggess WC, Morel PA. TCR Signal Strength Regulates Akt Substrate Specificity To Induce Alternate Murine Th and T Regulatory Cell Differentiation Programs. J Immunol. 2017;199:589–597. doi: 10.4049/jimmunol.1700369. [DOI] [PMC free article] [PubMed] [Google Scholar]
- 61.Procaccini C, Carbone F, Di Silvestre D, Brambilla F, De Rosa V, Galgani M, Faicchia D, Marone G, Tramontano D, Corona M, Alviggi C, Porcellini A, La Cava A, Mauri P, Matarese G. The Proteomic Landscape of Human Ex Vivo Regulatory and Conventional T Cells Reveals Specific Metabolic Requirements. Immunity. 2016;44:406–421. doi: 10.1016/j.immuni.2016.01.028. [DOI] [PMC free article] [PubMed] [Google Scholar]
- 62.Vukmanovic-Stejic M, Agius E, Booth N, Dunne PJ, Lacy KE, Reed JR, Sobande TO, Kissane S, Salmon M, Rustin MH, Akbar AN. The kinetics of CD4+Foxp3+ T cell accumulation during a human cutaneous antigen-specific memory response in vivo. J Clin Invest. 2008;118:3639–3650. doi: 10.1172/JCI35834. [DOI] [PMC free article] [PubMed] [Google Scholar]
- 63.Vukmanovic-Stejic M, Zhang Y, Cook JE, Fletcher JM, McQuaid A, Masters JE, Rustin MH, Taams LS, Beverley PC, Macallan DC, Akbar AN. Human CD4+ CD25hi Foxp3+ regulatory T cells are derived by rapid turnover of memory populations in vivo. J Clin Invest. 2006;116:2423–2433. doi: 10.1172/JCI28941. [DOI] [PMC free article] [PubMed] [Google Scholar]
- 64.De Rosa V, Galgani M, Porcellini A, Colamatteo A, Santopaolo M, Zuchegna C, Romano A, De Simone S, Procaccini C, La Rocca C, Carrieri PB, Maniscalco GT, Salvetti M, Buscarinu MC, Franzese A, Mozzillo E, La Cava A, Matarese G. Glycolysis controls the induction of human regulatory T cells by modulating the expression of FOXP3 exon 2 splicing variants. Nat Immunol. 2015;16:1174–1184. doi: 10.1038/ni.3269. [DOI] [PMC free article] [PubMed] [Google Scholar]
- 65.Gerriets VA, Kishton RJ, Johnson MO, Cohen S, Siska PJ, Nichols AG, Warmoes MO, de Cubas AA, MacIver NJ, Locasale JW, Turka LA, Wells AD, Rathmell JC. Foxp3 and Toll-like receptor signaling balance Treg cell anabolic metabolism for suppression. Nat Immunol. 2016;17:1459–1466. doi: 10.1038/ni.3577. [DOI] [PMC free article] [PubMed] [Google Scholar]
- 66.Huynh A, DuPage M, Priyadharshini B, Sage PT, Quiros J, Borges CM, Townamchai N, Gerriets VA, Rathmell JC, Sharpe AH, Bluestone JA, Turka LA. Control of PI(3) kinase in T-reg cells maintains homeostasis and lineage stability. Nature Immunology. 2015;16:188-+. doi: 10.1038/ni.3077. [DOI] [PMC free article] [PubMed] [Google Scholar]
- 67.Shrestha S, Yang K, Guy C, Vogel P, Neale G, Chi H. Treg cells require the phosphatase PTEN to restrain TH1 and TFH cell responses. Nat Immunol. 2015;16:178–187. doi: 10.1038/ni.3076. [DOI] [PMC free article] [PubMed] [Google Scholar]
- 68.Lal G, Yin N, Xu J, Lin M, Schroppel S, Ding Y, Marie I, Levy DE, Bromberg JS. Distinct inflammatory signals have physiologically divergent effects on epigenetic regulation of Foxp3 expression and Treg function. Am J Transplant. 2011;11:203–214. doi: 10.1111/j.1600-6143.2010.03389.x. [DOI] [PMC free article] [PubMed] [Google Scholar]
- 69.Liu H, Komai-Koma M, Xu D, Liew FY. Toll-like receptor 2 signaling modulates the functions of CD4+ CD25+ regulatory T cells. Proc Natl Acad Sci U S A. 2006;103:7048–7053. doi: 10.1073/pnas.0601554103. [DOI] [PMC free article] [PubMed] [Google Scholar]
- 70.Sutmuller RP, den Brok MH, Kramer M, Bennink EJ, Toonen LW, Kullberg BJ, Joosten LA, Akira S, Netea MG, Adema GJ. Toll-like receptor 2 controls expansion and function of regulatory T cells. J Clin Invest. 2006;116:485–494. doi: 10.1172/JCI25439. [DOI] [PMC free article] [PubMed] [Google Scholar]
- 71.Taylor PA, Lees CJ, Blazar BR. The infusion of ex vivo activated and expanded CD4(+)CD25(+) immune regulatory cells inhibits graft-versus-host disease lethality. Blood. 2002;99:3493–3499. doi: 10.1182/blood.v99.10.3493. [DOI] [PubMed] [Google Scholar]
- 72.Tang Q, Henriksen KJ, Bi M, Finger EB, Szot G, Ye J, Masteller EL, McDevitt H, Bonyhadi M, Bluestone JA. In vitro-expanded antigen-specific regulatory T cells suppress autoimmune diabetes. J Exp Med. 2004;199:1455–1465. doi: 10.1084/jem.20040139. [DOI] [PMC free article] [PubMed] [Google Scholar]
- 73.Hippen KL, Merkel SC, Schirm DK, Nelson C, Tennis NC, Riley JL, June CH, Miller JS, Wagner JE, Blazar BR. Generation and large-scale expansion of human inducible regulatory T cells that suppress graft-versus-host disease. Am J Transplant. 2011;11:1148–1157. doi: 10.1111/j.1600-6143.2011.03558.x. [DOI] [PMC free article] [PubMed] [Google Scholar]
- 74.Bluestone JA, Buckner JH, Fitch M, Gitelman SE, Gupta S, Hellerstein MK, Herold KC, Lares A, Lee MR, Li K, Liu W, Long SA, Masiello LM, Nguyen V, Putnam AL, Rieck M, Sayre PH, Tang Q. Type 1 diabetes immunotherapy using polyclonal regulatory T cells. Sci Transl Med. 2015;7:315ra189. doi: 10.1126/scitranslmed.aad4134. [DOI] [PMC free article] [PubMed] [Google Scholar]
Associated Data
This section collects any data citations, data availability statements, or supplementary materials included in this article.