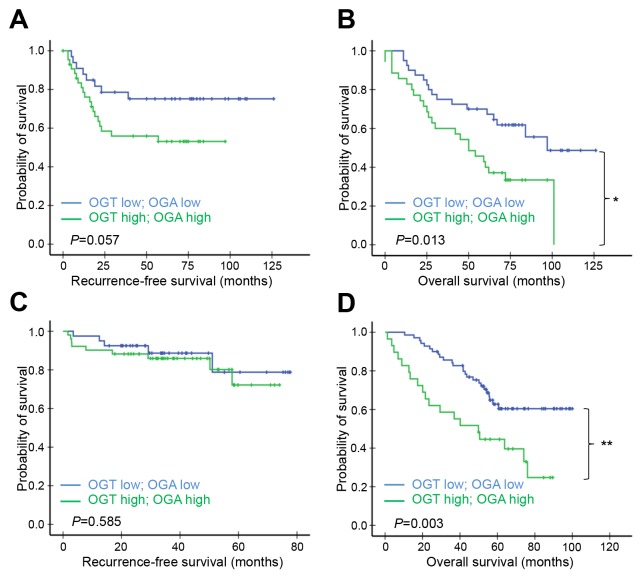
Figure 4. Kaplan–Meier survival analysis of patients according to both OGT and OGA levels.
Patients in cohort A (A, B) or B (C, D) whose lung adenocarcinomas expressed both OGT and OGA at high or low levels were compared. RFS (A & C) and OS (B & D) curves were plotted for each group. P-values derived from the log-rank test were indicated in each comparison. *P<0.05.

