

Abstract
Aims
PUR0200 is a tiotropium bromide formulation engineered with the iSPERSE dry powder delivery technology. PUR0200 is being developed as a bioequivalent alternative to tiotropium bromide, delivered using Spiriva® HandiHaler® (HH). We investigated the bronchodilator effects, pharmacokinetics and safety of PUR0200 in patients with chronic obstructive pulmonary disease (COPD).
Methods
This was a randomized, placebo‐controlled, crossover study using different PUR0200 doses and the comparator tiotropium HH. In vitro aerodynamic particle size distribution (aPSD) characterization of PUR0200 and tiotropium HH are presented. The main endpoints included forced expiratory volume in 1 s (FEV1) trough and (0–24 h) and pharmacokinetic parameters.
Results
The increased fine‐particle fraction of PUR0200 demonstrated by testing using the next‐generation impactor increased the proportion of drug available for lung deposition compared with the tiotropium HH. There was a numerical dose–response effect for PUR0200 on FEV1, with 3 μg demonstrating a lower effect than higher doses. The placebo‐adjusted mean (95% confidence interval) increases from baseline at 24 h postdose were 150 ml (100–200), 210 ml (160–270) and 200 ml (140–250) for 3 μg, 6 μg and 9 μg doses of PUR0200, respectively. Tiotropium HH (18 μg) caused a mean 169 ml (standard deviation 157ml) improvement in trough FEV1, which was not significantly different to the PUR0200 effects at any of the tested doses.
Conclusions
PUR0200 treatment caused bronchodilation in COPD patients that was similar in magnitude to that caused by tiotropium HH. This enabled a similar clinical effect on lung function to be achieved with PUR0200 using a lower metered dose of tiotropium compared with tiotropium HH.
Keywords: COPD, FEV1, pharmacokinetics, PUR0200, tiotropium
What is Already Known about this Subject
Tiotropium is a widely used bronchodilator used to treat chronic obstructive pulmonary disease (COPD).
Tiotropium in clinical practice is often delivered using Spiriva® HandiHaler® (HH).
What this Study Adds
PUR0200 is a tiotropium formulation engineered with a novel dry powder delivery technology. PUR0200 treatment (3 μg, 6 μg and 9 μg) caused similar bronchodilation in COPD patients compared with tiotropium HH (18 μg). PUR0200 achieved a similar clinical effect using a lower metered dose of tiotropium compared with tiotropium HH.
Introduction
Chronic obstructive pulmonary disease (COPD) is characterized by poorly reversible airflow obstruction that arises owing to the inhalation of noxious particles. The typical symptoms are dyspnoea, cough and reduced exercise capacity. COPD patients also suffer with exacerbations, which are acute worsenings of symptoms beyond the usual daily variability 1. Inhaled long‐acting bronchodilators are commonly used to treat COPD symptoms and prevent exacerbations 1, 2. Tiotropium bromide is a long‐acting http://www.guidetopharmacology.org/GRAC/ObjectDisplayForward?objectId=15&familyId=2&familyType=GPCR antagonist (LAMA), administered once a day, and has been widely used in clinical practice for many years 3, 4, 5; this bronchodilator significantly improves symptoms and exercise performance, in addition to reducing exacerbation rates 4, 6.
PUR0200 is a tiotropium bromide formulation engineered in a novel dry powder delivery technology called iSPERSE. iSPERSE utilizes spray drying with proprietary compositions to create aerodynamically small particles that are highly respirable and have relatively high density. This novel delivery technology incorporates salt‐based excipients to create small, dense and dispersible particles that do not require lactose carrier particles to facilitate drug dispersion and delivery 7, 8, 9. This allows improved drug delivery efficiency to the lung, and can be used to formulate various drug classes for delivery to the lungs by inhalation 8, 9, 10. PUR0200 is being developed as a bioequivalent alternative to tiotropium bromide delivered using Spiriva® HandiHaler® (HH).
We report an investigation of the bronchodilator effects, pharmacokinetics and safety of PUR0200 in COPD patients. This was a randomized, placebo‐controlled, crossover study using different PUR0200 doses and the active comparator tiotropium HH. We also present comparative in vitro aerodynamic particle size distribution (aPSD) characterization of PUR0200 and tiotropium HH.
Methods
Patients
COPD patients were recruited at the Medicines Evaluation Unit based at the University Hospital of South Manchester NHS Foundation Trust (UK). The study was approved by South‐Wales (East) Research Ethics Committee (13/WA/0149) and all subjects provided written informed consent (http://clinicaltrials.gov NCT01921712).
Study design
This was a single‐centre, single‐dose, randomized, placebo and active‐controlled, double‐blind, dose‐ranging, five‐way crossover study in patients with COPD, with an age range 40–75 years. COPD patients with a postbronchodilator FEV1 35–80% of predicted normal and a postbronchodilator FEV1/forced vital capacity (FVC) ratio <0.7 at screening were recruited. Patients were required to demonstrate ≥100 ml reversibility to 80 μg inhaled ipratropium bromide.
Eligible subjects participated in five treatment visits, separated by washout periods of ≥7 days. Subjects were randomized to receive single doses of PUR0200 (3 μg, 6 μg, 9 μg) using a dry‐powder inhaler (DPI) (RS01 Model 7 high‐resistance DPI; Plastiape S.p.A., Osnago, Italy), placebo or open‐label tiotropium 18 μg delivered using the tiotropium HH. Doses were administered between 08.00 h and 10.00 h at each treatment visit. Study staff blinded to treatment allocations performed study procedures. The patients were randomized using a computer‐generated randomization schedule. During each treatment visit, the predose FEV1 was required to be within 15% of the predose value at the first treatment visit; if this was not the case, the visit was rescheduled. Study procedures at each treatment visit comprised serial spirometry at predose, 15 min and 30 min, and 1, 2, 4, 6, 8, 10, 12, 14, 20, 22 and 24 h postdose. Blood samples for pharmacokinetics were obtained to determine plasma tiotropium bromide concentrations at predose and 5, 15 and 30 min, and 1,2, 4, 6, 12 and 24 h postdose. Heart rate, blood pressure, temperature and respiration rate were performed predose and 1, 4, 8, 12 and 24 h postdose. Twelve‐lead electrocardiograms (ECGs) were obtained at predose and 24 h postdose. Full blood count, biochemistry and urine analysis were taken at the screening visit and 24 h postdose.
Inhaled LAMAs were not permitted within 10 days prior to the screening visit and for the duration of the study; these were replaced by inhaled ipratropium bromide, which was prescribed for regular use. Rescue salbutamol was allowed as needed. Subjects were required to withhold salbutamol and ipratropium bromide for at least 8 h before each treatment visit. Inhaled long‐acting β2‐receptor agonists (LABAs) were withheld for 24 h prior to screening and for the duration of the study. Regular use of inhaled corticosteroids (ICSs) was permitted during the study; ICS/LABA combination products were separated into their individual mono‐product components at screening, in order to facilitate LABA withhold before treatment visits, while continuing regular ICS treatment. Treatment visits were rescheduled if patients failed to withhold bronchodilators for the required period.
Spirometry
Spirometry was performed in accordance with American Thoracic Society/European Respiratory Society (ATS/ERS) guidelines 11; patients had to perform at least three technically acceptable manoeuvres with the two highest forced expiratory volume in 1 s (FEV1) and forced vital capacity (FVC) values lying ≤150 ml apart; the highest values were selected for analysis.
Laboratory analysis
Pharmacokinetic measurements of tiotropium in the plasma were performed by Quotient Bio Analytical Sciences (Nottingham, UK) using liquid chromatography–tandem mass spectrometry after solid phase extraction. The calibrated range of the method was 0.5–50 pg ml–1.
Cascade impaction
aPSDs were determined using a multi‐stage next‐generation impactor (NGI) (MSP Corporation, Shoreview, MN, USA) with an Alberta Idealized Throat (AIT) (Copley Scientific, Nottingham, UK) 12, a physical throat mimetic with geometries based on human anatomy. PUR0200 formulations were filled by hand into size 3 hydroxypropylmethylcellulose capsules (V‐Caps, Capsugel, Greenwood, SC, USA) and emitted into the impactor at a flow rate of 60 l min–1 (approximate 4 kPa pressure drop) from the RS01 Model 7 high‐resistance DPI (Plastiape S.p.A., Osnago, Italy). Spiriva HH (Boehringer Ingelheim International GmbH, Ingelheim am Rhein, Germany) was emitted into the impactor at 39 l min–1 (approximate 4 kPa pressure drop) from the HH DPI. Tiotropium deposition in the AIT and the NGI, and retention in the capsules and DPI were measured using reverse‐phase high‐performance liquid chromatography. The mass median aerodynamic diameter (MMAD), geometric standard deviation (GSD), impactor stage mass (ISM), fine‐particle dose (FPD) and mouth/throat (M/T) deposition were calculated using Excel (Microsoft, Redmond, WA, USA). ISM is the mass of drug that passes through the AIT adaptor on the NGI and is recovered from all stages within the impactor.
Statistical analyses
Data from 28 evaluable patients were determined to have 80% power to detect a 140 ml difference in mean trough FEV1 at 24 h when comparing PUR0200 with placebo, assuming a standard deviation of 250 ml. Statistical analysis of spirometry parameters was performed using mixed‐effects modelling techniques, with a P‐value <0.05 defined as significant. The model included terms for treatment and sequence fitted as fixed effects, and subject nested within sequence was fitted as a random effect. Baseline values were fitted as covariates, where baseline was defined as the actual FEV1 value at the predose time point. Point estimates and 95% confidence intervals (CIs) for the difference in the adjusted arithmetic means for all pairwise treatment comparisons were obtained, where the difference in the adjusted arithmetic means was defined as each dose of PUR0200 or tiotropium HH vs. placebo, and PUR0200 vs. tiotropium HH.
Pharmacokinetic parameters were calculated using a noncompartmental analysis. The incidence of adverse events (AEs) was compared between treatment groups, with summary tables by treatment group with descriptive statistics to summarize data. All analyses were performed using Statistical Analysis Systems (SAS®) Software (release 8.2) on a Windows 7 operating system and Phoenix WinNonLin 6.1 (Pharsight Corporation, Phoenix, Arizona, USA).
Nomenclature of targets and ligands
Key protein targets and ligands in this article are hyperlinked to corresponding entries in http://www.guidetopharmacology.org,thecommon portal for data from the IUPHAR/BPS Guide to PHARMACOLOGY 13, and are permanently archived in the Concise Guide to PHARMACOLOGY 2017/18 14.
Results
In vitro aPSDs
The aPSDs of PUR0200 and tiotropium HH were determined using a multi‐stage NGI in combination with the AIT. The amount of tiotropium in each size fraction of the 3 μg and 6 μg PUR0200 formulations and tiotropium HH are shown in Table 1. The lactose blend tiotropium HH formulation resulted in significantly more predicted M/T deposition of tiotropium than either of the PUR0200 formulations. Of the 18 μg nominal dose, 5.48 μg (30.4%) of tiotropium deposited in the throat of the impactor, whereas only 0.57 μg (19%) and 1.19 μg (19.8%) of tiotropium deposited in the throat for 3 μg and 6 μg PUR0200, respectively. The MMADs of the PUR0200 formulations (3.22 μm and 3.27 μm) were similar to that of tiotropium HH (3.36 μm). The ISM and FPD <5 μm are predictors of the lung dose of each formulation 15. The 3 μg and 6 μg PUR0200 nominal doses resulted in formulations with predicted lung doses (ISM and FPD <5 μm) lower and higher, respectively, compared with the lung dose of 18 μg tiotropium HH. Both PUR0200 formulations had a slightly higher FPD <2 μm than tiotropium HH.
Table 1.
Aerodynamic particle size distributions
| Parameter | 3 μg PUR0200 | 6 μg PUR0200 | 18 μg HH |
|---|---|---|---|
| Nominal dose (μg) | 3 | 6 | 18 |
| MMAD (μm) | 3.22 (0.01) | 3.27 (0.04) | 3.36 (0.03) |
| GSD | 1.94 (0.05) | 2.13 (0.02) | 1.59 (0.01) |
| Mouth–throat (μg) | 0.57 (0.01) | 1.19 (0.03) | 5.48 (0.31) |
| ISM (μg) | 1.97 (0.03) | 3.93 (0.04) | 2.87 (0.16) |
| FPD <5.0 μm (μg) | 1.54 (0.00) | 2.94 (0.01) | 2.24 (0.11) |
| FPD <3.0 μm (μg) | 0.90 (0.02) | 1.77 (0.01) | 1.15 (0.05) |
| FPD <2.0 μm (μg) | 0.48 (0.02) | 1.05 (0.02) | 0.37 (0.03) |
Data are presented as mean (standard deviation) of tests performed in triplicate. All doses are doses of tiotropium. FPD, fine particle dose; GSD, geometric standard deviation; ISM, impactor stage mass; MMAD, mass median aerodynamic diameter
Clinical study
The number of patients screened (n = 67) and randomized (n = 38) are shown in Figure 1, with the reasons for screen failure. The demography of the randomized patients at screening is shown in Table 2. The mean postbronchodilator FEV1 was 61% predicted, with a reversibility of 17.6%. A total of 35 patients completed all five treatment periods; three subjects were withdrawn because of AEs (COPD exacerbation, worsening of COPD symptoms and syncope, respectively).
Figure 1.

Consolidated Standards of Reporting Trials (CONSORT) flow diagram showing reasons for screen failure and withdrawal after randomization
Table 2.
Subject demographics and baseline characteristics
| Age (years) | 62.8 (7.5) |
| Male n (%) | 17 (45) |
| Female n (%) | 21 (55) |
| Height (m) | 1.65 (0.01) |
| BMI (kg m –2 ) | 28.2 (4.9) |
| Current smokers n (%) | 39.5 |
| Smoking history (pack‐years) a | 43.5 (12–102) |
| Postbronchodilator FEV 1 /FVC (%) | 49 (10) |
| Postbronchodilator FEV 1 (l) | 1.54 (0.39) |
| Postbronchodilator FEV 1 (% predicted) | 61 (12) |
| Reversibility (ml) | 224 (128) |
| Reversibility (%) | 17.6 (10.3) |
| Postbronchodilator FVC (l) | 3.21 (0.8) |
Data shown as mean (standard deviation). BMI, body mass index; FEV1, forced expiratory volume in 1 s; FVC, forced vital capacity
Data shown as median (range)
Pulmonary function
Figure 2 shows the time profile of bronchodilation over 24 h. An increase in mean absolute FEV1 was apparent within 30 min postdose following inhalation of 3 μg, 6 μg and 9 μg PUR0200 and 18 μg tiotropium HH, and remained above baseline levels for the duration of the 24‐h assessment period. The observed mean differences and percentage changes from baseline in area under the curve (AUC) from zero to 24 h (AUC(0–24 h)) for FEV1 and trough FEV1 (24 h postdose) were statistically significant when comparing each PUR0200 dose with placebo (Table 3 and Figure 3). For FEV1 AUC(0–24 h) and trough FEV1, the 6 μg and 9 μg PUR0200 dose levels resulted in a numerically larger increase than 3 μg PUR0200 and 18 μg tiotropium HH, whereas the magnitude of effect at 3 μg was numerically comparable to that observed for 18 μg tiotropium HH. For FEV1 AUC(0–24 h), statistical analysis showed no difference between 18 μg tiotropium HH and 6 μg and 9 μg PUR0200, although the mean differences were 0.98 and 0.94 (h.l), respectively.
Figure 2.

Mean change from baseline forced expiratory volume in 1 s (FEV1) over 24 h after a single dose of 3 μg, 6 μg and 9 μg inhaled PUR0200, placebo and HandiHaler® (HH) 18 μg. Mean and standard deviation are shown (n = 36 for 3 μg, 9 μg and HH 18 μg, and n = 34 for 6 μg and placebo)
Table 3.
Summary of pulmonary function data for PUR0200 and tiotropium HandiHaler® (HH) 18 μg
| Placebo (N = 35) | PUR0200 Dose level | HH 18 μg (N = 36) | |||
|---|---|---|---|---|---|
| 3 μg (N = 36) | 6 μg (N = 35) | 9 μg (N = 38) | |||
| Trough FEV 1 change from baseline (l) (SD) | 0.001 (0.100) | 0.151 (0.120) | 0.218 (0.145) | 0.198 (0.164) | 0.169 (0.157) |
|
Placebo
Mean difference ( P ‐value) (95% CI) |
– | 0.15 (<0.001) (0.10, 0.20) | 0.21 (<0.001) (0.16, 0.27) | 0.20 (<0.001) (0.14, 0.25) | NA |
|
HH 18 μg
Mean difference ( P ‐value) (95% CI) |
NA | −0.02 (0.55) (−0.07, 0.04) | 0.05 (0.088) (−0.01, 0.10) | 0.03 (0.27) (−0.02, 0.08) | – |
| FEV 1 change from baseline AUC (0–24 h) (h.l) | −0.763 (2.24) | 4.09 (2.89) | 5.22 (3.01) | 5.19 (3.18) | 4.25 (3.44) |
|
Placebo
Mean difference ( P ‐value) (95% CI) |
‐ | 4.78 (<0.001) (3.57, 5.99) | 5.92 (<0.001) (4.69, 7.14) | 5.88 (<0.001) (4.67, 7.09) | NA |
|
HH 18 μg
Mean difference ( P ‐value) (95% CI) |
NA | −0.16 (0.79) (−1.35, 1.03) | 0.98 (0.11) (−0.23, 2.19) | 0.94 (0.12) (−0.24, 2.13) | ‐ |
| Trough FVC change from baseline (l) (SD) | 0.007 (0.176) | 0.171 (0.227) | 0.277 (0.211) | 0.199 (0.312) | 0.222 (0.311) |
|
Placebo
Mean difference ( P ‐value) (95% CI) |
‐ | 0.164 (0.006) (0.047, 0.281) | 0.268 (<0.001) (0.149, 0.388) | 0.188 (0.002) (0.071, 0.305) | NA |
|
HH 18 μg
Mean difference ( P ‐value) (95% CI) |
NA | −0.047 (0.43) (−0.162, 0.069) | 0.058 (0.34) (−0.060, 0.176) | −0.023 (0.12) (−0.137, 0.093) | ‐ |
AUC(0–24 h), area under the curve from zero to 24 h; CI, confidence interval; FVC, forced vital capacity; FEV1, forced expiratory volume in 1 s; NA, not available; SD, standard deviation
Figure 3.
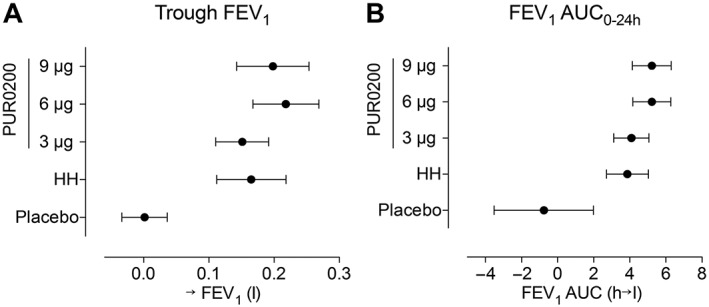
(A) Trough forced expiratory volume in 1 s (FEV1) and (B) area under the curve from zero to 24 h (AUC(0–24 h)) for FEV1 (FEV1 AUC0–24 h) after 3 μg, 6 μg and 9 μg of inhaled PUR0200, placebo and tiotropium 18 μg. Mean and standard deviation are shown (n = 36 for 3 μg, 9 μg and HandiHaler® (HH) 18 μg, and n = 34 for 6 μg and placebo)
The increases from baseline in trough FEV1 were 151 ml, 218 ml and 198 ml for 3 μg, 6 μg and 9 μg doses of PUR0200, respectively (Table 3 and Figure 3). Tiotropium HH caused a 169 ml improvement in trough FEV1; this was not significantly different to the PUR0200 effects at any of the tested doses. The greatest numerical increase compared with placebo was observed at the 6 μg PUR0200 dose level (placebo‐adjusted mean difference 210 ml; P < 0.001). The pattern of results for trough FVC was similar to trough FEV1 (Table 3); all PUR0200 doses caused increases from baseline in trough FVC, with the greatest increase compared with placebo observed with 6 μg PUR0200 (placebo‐adjusted mean difference 277 ml; P < 0.001). Tiotropium HH also improved trough FVC, with no significant differences compared with PUR0200 at any of the doses studied.
Pharmacokinetic analysis
Absorption of tiotropium into the systemic circulation was very rapid following inhalation of PUR0200 and tiotropium HH, with peak plasma concentrations (Cmax) observed for each formulation at the first time point examined (5 min) at all dose levels (Figure 4). Geometric mean values of Cmax for 3 μg PUR0200 and 18 μg tiotropium HH were similar, but Cmax was higher for both 6 μg and 9 μg PUR0200 dose levels (Table 4). Overall systemic exposure to tiotropium (see AUC results) increased in a dose‐proportional manner. Geometric mean values for AUC(0–6 h), AUC(0–24 h) and AUC(0–∞) were similar for 6 μg PUR0200 and 18 μg tiotropium HH, but were lower for 3 μg PUR0200 and higher for 9 μg PUR0200.
Figure 4.

Pharmacokinetics of PUR0200 and HandiHaler® (HH) 18 μg. Geometric mean plasma concentrations of tiotropium bromide for PUR0200 and HH 18 μg over time. (A) Linear‐log plot of plasma concentrations over the first 6 h following dosing, and (B) Log–log plot of plasma concentrations over the 24 h after dosing
Table 4.
Summary of pharmacokinetic data for PUR0200 and tiotropium HandiHaler® (HH) 18 μg
| Dose | Cmax (pgml−1) | tmax (h) | t½ (h) | AUC(0–24 h) (pgml−1h) | AUC(0–∞) (pgml−1h) | AUC(0–2 h) (pgml−1h) | AUC(0–6 h) (pgml−1h) |
|---|---|---|---|---|---|---|---|
| 3 μg PUR0200 | 7.85 (105.1) | 0.080 (0.08–1.92) | 2.2 | 8.77 (86.2) | 8.48 (94.0) | 4.70 (64.4) | 6.94 (69.9) |
| 6 μg PUR0200 | 15.9 (85.4) | 0.080 (0.08–0.17) | 4.1 | 21.2 (59.8) | 17.7 (68.7) | 9.08 (58.9) | 14.2 (51.2) |
| 9 μg PUR0200 | 29.6 (66.3) | 0.080 (0.08–0.17) | 5.4 | 38.0 (51.2) | 30.1 (57.0) | 15.8 (50.2) | 24.2 (46.5) |
| HH 18 μg | 7.22 (91.5) | 0.080 (0.08–5.92) | 4.9 | 24.7 (61.4) | 20.3 (52.7) | 6.56 (70.5) | 14.0 (50.7) |
Data shown as geometric mean (percentage coefficient of variation) with the exception of tmax, for which the median (range) is shown. n = 35 for PUR0200 3 μg and 6 μg; n = 36 for PUR0200 9 μg and HH 18 μg. Cmax, maximal observed plasma drug concentration; tmax, time at which Cmax occurs; t½, elimination half‐life
The rate of tiotropium absorption for PUR0200 was similar across doses but differed from that of tiotropium HH. From the mean profiles, the initial Cmax value for tiotropium HH was similar to that of the 3 μg PUR0200 dose level; however, the subsequent initial distribution phase for tiotropium HH was slower than for PUR0200, resulting in a shift in the differences between AUC(0–2 h) and AUC(0–6 h). The PUR0200 terminal half‐life ranged from 2.0 h to 5.5 h; This was similar for tiotropium HH and the 6 μg and 9 μg PUR0200 dose levels.
The relationships between pharmacokinetic parameters and lung function were analysed. Figure 5 shows that there was no relationship between Cmax or AUC(0–24 h) and the increase from baseline in trough FEV1.
Figure 5.

Relationship of pharmacokinetics with change (Δ) in trough forced expiratory volume in 1 s (FEV1). (A) shows area under the curve from zero to 24 h (AUC0–24 h) and (B) shows maximal observed plasma drug concentration (Cmax). HH, HandiHaler®
Safety
PUR0200 was generally well tolerated. No clinically significant differences in blood pressure, heart rate or ECG parameters (including QTc) were observed between active treatment and placebo. The most common AE was cough, which was observed at a similar frequency after dosing with PUR0200 and placebo [29 (78.4%), 25 (71.4%), 28 (73.7%) and 28 (80.0%) subjects after 3 μg, 6 μg and 9 μg PUR0200, and placebo, respectively). In all cases, the cough was mild and transient in nature, resolving within a minute of dosing. Only one individual reported a cough following the administration of tiotropium HH.
Discussion
PUR0200 treatment caused bronchodilation in COPD patients that was similar in magnitude to that caused by tiotropium delivered using the HH device. There was a numerical dose–response effect for PUR0200 on FEV1, with 3 μg demonstrating a lower effect than higher doses. The increased fine‐particle fraction of PUR0200 demonstrated by the NGI cascade impaction system increases the proportion of drug available for lung deposition compared with the tiotropium HH. This enabled a similar clinical effect on lung function to be achieved with PUR0200 using a lower metered dose of tiotropium compared with tiotropium HH.
Particle engineering technologies allow the manufacture of dry powder drug products with improved delivery efficiency over traditional lactose blend formulations. PUR0200 utilizes iSPERSE, which is a novel delivery technology using salt‐based excipients to create small particles without the need for lactose carrier particles to facilitate drug dispersion and delivery 7, 8, 9, 10. In the present study, PUR0200 formulations were engineered to have a similar aPSD as tiotropium HH, a lactose blend formulation of tiotropium bromide, and different strengths were used to achieve different lung doses. Owing to the absence of large lactose carrier particles, PUR0200 formulations result in significantly less predicted oral deposition of tiotropium bromide than tiotropium HH. Using an NGI cascade impaction system and a realistic throat adaptor, 7.70 μg of tiotropium bromide in tiotropium HH is retained in the capsule or DPI after actuation. Of the dose that enters the impactor, more than 50% of the dose (5.48 μg) is recovered from the M/T component of the impactor. By contrast, independent of the drug load, only 7% of the nominal dose of PUR0200 is retained in the capsule or DPI and significantly less tiotropium is deposited in the throat component of the impactor. The efficiency of PUR0200 delivery enables the bracketing of the 18 μg tiotropium HH lung dose (e.g. FPD <5 μm) with nominal doses of 3 μg and 6 μg, while achieving less oral deposition (Table 1). The data from the NGI cascade impaction system was used to base dose selection for the clinical study and indicated no need to investigate PUR0200 doses lower than 3 μg clinically.
An FEV1 change of 100 ml has been proposed as a minimal clinically important difference (MCID) for COPD therapies; changes of this magnitude are considered to be associated with health improvements which patients can perceive 16. All PUR0200 doses achieved this MCID threshold over the 24‐h period, consistent with a once a day dosing regimen. The lowest tested dose of PUR0200 (3 μg) exhibited a lower effect numerically compared with 6 μg and 9 μg PUR0200, for both trough FEV1 and FEV1 AUC0–24 h. The results from different lung function endpoints (both FEV1 and FVC) indicate that a plateau of maximal effect was achieved with PUR0200 between 6 μg and 9 μg. This suggests that further clinical studies of PUR0200 should be performed using doses up to 6 μg. It should be noted that the population in the present study was enriched by the inclusion criteria for bronchodilator reversibility (>100 ml), which probably leads to a higher observed FEV1 treatment difference compared with placebo than would be observed in an unselected COPD population. Nevertheless, this study population and design is appropriate for making comparisons between active treatments 17, 18, and enhances the ability to observe dose–response relationships. The study was statistically powered to compare active treatments with placebo, so the differences in lung function improvement between doses was not confirmed as statistically significant. Previous placebo‐controlled crossover studies in COPD patients with similar sample sizes to the current study have also been designed to evaluate formally treatment differences of long‐acting bronchodilators vs. placebo but have not been powered for comparisons between active treatments 18, 19. Nevertheless, these previous studies made inferences regarding dose–response relationships based on numerical differences, and we feel that it is reasonable to take a similar approach in the present study.
The relatively large numerical differences between tiotropium HH and the 6 μg and 9 μg PUR0200 doses were not statistically significant. However, the numerical effect of tiotropium HH on FEV1 appeared more similar to 3 μg PUR0200. Larger studies of longer duration are needed to define more accurately the dose–response relationship of PUR0200 and compare it with that of tiotropium HH. Nevertheless, the results of the present study demonstrate that tiotropium delivered by iSPERSE causes at least a similar bronchodilatory effect to tiotropium HH, while using a lower metered dose.
Pharmacokinetic analysis showed that overall systemic exposure (AUC0–24 h) to PUR0200 increased in a dose‐proportional fashion. The overall systemic exposures of 6 μg PUR0200 and 18 μg tiotropium HH were similar, whereas 6 μg PUR0200 resulted in a Cmax that was 2.2 times higher than 18 μg tiotropium HH. The combination of increased fine‐particle fraction and lower oral deposition using iSPERSE means that a higher fraction of the systemic exposure occurs through lung absorption compared with tiotropium HH. As tiotropium bromide has a reported oral bioavailability of 2–3% 20, similar total exposure is achieved with PUR0200, despite a lower nominal dose.
It is interesting that total systemic exposure suggests a similarity between 6 μg PUR0200 and 18 μg tiotropium HH, but that lung function data suggest a greater effect of 6 μg PUR0200 compared with 18 μg tiotropium HH. This difference in lung function was associated with a higher Cmax for 6 μg PUR0200, suggesting that Cmax was the more relevant parameter for predicting lung function responses. Lung absorption is the dominant contributor to Cmax; the increased FPD <5 μm and FPD <2 μm with 6 μg PUR0200 compared with 18 μg tiotropium HH is predicted to cause increased delivery to the small airways, and is the likely cause of a higher Cmax and greater effects on lung function. By contrast, 3 μg PUR0200 results in a similar Cmax to 18 μg tiotropium HH and significantly lower total exposure, suggesting that the 3 μg PUR0200 formulation results in a similar lung dose of tiotropium to tiotropium HH. This is supported by the similar lung function improvements with 3 μg PUR0200 compared with 18 μg tiotropium HH. The PUR0200 profile of a similar lung dose but lower total exposure seems to arise from differences in aPSD profiles that result in differences in tiotropium absorption in the gastrointestinal or respiratory tract.
This was a single‐dose study, where PUR0200 was generally well tolerated. Cough was the most frequently encountered side effect associated with both PUR0200 and placebo. In all cases, this was mild and self‐limiting. PUR0200 and placebo were administered using the commercially available Monodose RS01 Model 7 DPI. This has been used in clinical studies using different dry powder formulations 21. This capsule‐based inhaler was preferred for PUR0200 as it is the same device type as tiotropium HH, and has a relatively high resistance, requiring the generation of a large inspiratory flow 22. It is possible that coughing was related to drug impaction in the upper pharynx, possibly during lower than optimal inspiratory flow during inhalation. The iSPERSE technology used to create the PUR0200 formulation could be investigated using alternative inhaler devices. It could also be used to develop other formulations of bronchodilators or anti‐inflammatory drugs for the treatment of obstructive lung diseases.
In summary, PUR0200 demonstrated significant improvements in lung function that were comparable with the effects of tiotropium delivered using Tiotropium HH. PUR0200 allows similar lung function improvements and lower systemic exposure to tiotropium compared with tiotropium HH while using a lower nominal dose.
Competing Interests
D.S. has received sponsorship to attend and speak at international meetings; honoraria for lecturing or attending advisory boards; and research grants from the following companies: Apellis, AstraZeneca, Boehringer Ingelheim, Chiesi, Cipla, Genentech, GlaxoSmithKline, Glenmark, Johnson & Johnson, Menarini, Mundipharma, Novartis, Peptinnovate, Pfizer, Pulmatrix, Skypharma, Teva, Therevance and Verona. A.R. has no conflicts of interest to declare. K.K. and D.H. are employees of Pulmatrix. T.S. has previously been a consultant to Pulmatrix.
The authors acknowledge the efforts of the Pulmatrix Formulation and Process Development Groups and Quotient Clinical for the manufacturing and characterization of PUR0200 to support the trial. This study was funded by Pulmatrix Inc.
Singh, D. , Ravi, A. , Kane, K. , Schmalbach, T. , and Hava, D. L. (2018) The pharmacokinetics, pharmacodynamics and tolerability of PUR0200, a novel tiotropium formulation, in chronic obstructive pulmonary disease. Br J Clin Pharmacol, 84: 2097–2105. 10.1111/bcp.13645.
References
- 1. Vogelmeier CF, Criner GJ, Martinez FJ, Anzueto A, Barnes PJ, Bourbeau J, et al Global strategy for the diagnosis, management, and prevention of chronic obstructive lung disease 2017 report. GOLD executive summary. Am J Respir Crit Care Med 2017; 195: 557–582. [DOI] [PubMed] [Google Scholar]
- 2. Singh D, Roche N, Halpin D, Agusti A, Wedzicha JA, Martinez FJ. Current controversies in the pharmacological treatment of chronic obstructive pulmonary disease. Am J Respir Crit Care Med 2016; 194: 541–549. [DOI] [PubMed] [Google Scholar]
- 3. Tashkin DP, Celli B, Senn S, Burkhart D, Kesten S, Menjoge S, et al A 4‐year trial of tiotropium in chronic obstructive pulmonary disease. N Engl J Med 2008; 359: 1543–1554. [DOI] [PubMed] [Google Scholar]
- 4. Tonnel AB, Perez T, Grosbois JM, Verkindre C, Bravo ML, Brun M, et al Effect of tiotropium on health‐related quality of life as a primary efficacy endpoint. Int J Chron Obstruct Pulmon Dis 2008; 3: 301–310. [DOI] [PMC free article] [PubMed] [Google Scholar]
- 5. Maesen FPV, Smeets JJ, Sledsens TJH, Wald FDM, Cornelissen PJG, on behalf of a Dutch study group . Tiotropium bromide, a new long‐acting bronchodilator: a pharmacodynamic study in patients with chronic obstructive pulmonary disease. Eur Respir J 1995; 8: 1506–1513. [PubMed] [Google Scholar]
- 6. Vogelmeier C, Hederer B, Glaab T, Schmidt H, Rutten‐van Mölken MPMH, Beeh KM, et al Tiotropium versus salmeterol for the prevention of exacerbations of COPD. N Engl J Med 2011; 364: 1093–1103. [DOI] [PubMed] [Google Scholar]
- 7. Telko MJ, Hickey AJ. Dry powder inhaler formulation. Respir Care 2005; 50: 1209–1227. [PubMed] [Google Scholar]
- 8. Lawlor C, Clarke R, Sung J. Development of an iSPERSE based platform for the delivery of macromolecules via dry powder formulations. Respir Drug Deliv 2012; 3: 709–712. [Google Scholar]
- 9. Sung J, Manzanedo D, Ku A, Kenyon J, Trautman B, DeHann W, et al iSPERSE: formulation and in vitro characterization of a novel dry powder drug delivery technology. RDD Europe 2011; 2: 411–414. [Google Scholar]
- 10. Lawlor C, Tauber M, Brogan J, Zhu L, Currie D, Trautman B, et al Levofloxacin dry powders engineered for efficient pulmonary delivery and stability. Respir. Drug Deliv 2014; 2: 549–552. [Google Scholar]
- 11. Miller MR, Hankinson J, Brusasco V, Burgos F, Casaburi R, Coates A, et al Standardisation of spirometry. Eur Respir J 2005; 26: 319–338. [DOI] [PubMed] [Google Scholar]
- 12. Zhang Y, Gilbertson K, Finlay WH. In vivo–in vitro comparison of deposition in three mouth–throat models with Qvar and Turbuhaler inhalers. J Aerosol Med 2007; 20: 227–235. [DOI] [PubMed] [Google Scholar]
- 13. Harding SD, Sharman JL, Faccenda E, Southan C, Pawson AJ, Ireland S, et al The IUPHAR/BPS guide to PHARMACOLOGY in 2018: updates and expansion to encompass the new guide to IMMUNOPHARMACOLOGY. Nucl Acids Res 2018; 46: D1091–D1106. [DOI] [PMC free article] [PubMed] [Google Scholar]
- 14. Alexander SPH, Christopoulos A, Davenport AP, Kelly E, Marrion NV, Peters JA, et al The Concise Guide to PHARMACOLOGY 2017/18: G protein‐coupled receptors. Br J Pharmacol 2017; 174: S17–S129. [DOI] [PMC free article] [PubMed] [Google Scholar]
- 15. Olsson B, Borgstrom L, Lundback H, Svensson M. Validation of a general in vitro approach for prediction of total lung deposition in healthy adults for pharmaceutical inhalation products. J Aerosol Med Pulm Drug Deliv 2013; 26: 355–369. [DOI] [PubMed] [Google Scholar]
- 16. Donohue JF. Minimal clinically important differences in COPD lung function. COPD 2005; 2: 111–124. [DOI] [PubMed] [Google Scholar]
- 17. Singh D, Scuri M, Collarini S, Vezzoli S, Mariotti F, Muraro A, et al Bronchodilator efficacy of extrafine glycopyrronium bromide: the Glyco 2 study. Int J Chron Obstruct Pulmon Dis 2017; 12: 2001–2014. [DOI] [PMC free article] [PubMed] [Google Scholar]
- 18. Leaker BR, Barnes PJ, Jones CR, Tutuncu A, Singh D. Efficacy and safety of nebulized glycopyrrolate for administration using a high efficiency nebulizer in patients with chronic obstructive pulmonary disease. Br J Clin Pharmacol 2015; 79: 492–500. [DOI] [PMC free article] [PubMed] [Google Scholar]
- 19. Singh D, Ravi A, Reid F, Buck H, O'Connor G, Down G. Bronchodilator effects, pharmacokinetics and safety of PSX1002‐GB, a novel glycopyrronium bromide formulation, in COPD patients: a randomised crossover study. Pulm Pharmacol Ther 2016; 37: 9–14. [DOI] [PubMed] [Google Scholar]
- 20. Price D, Sharma A, Cerasoli F. Biochemical properties, pharmacokinetics and pharmacological response of tiotropium in chronic obstructive pulmonary disease patients. Expert Opin Drug Metab Toxicol 2009; 5: 417–424. [DOI] [PubMed] [Google Scholar]
- 21. Bilton D, Bellon G, Charlton B, Cooper P, De Boeck K, Flume PA, et al Pooled analysis of two large randomised phase III inhaled mannitol studies in cystic fibrosis. J Cyst Fibros 2013; 12: 367–376. [DOI] [PubMed] [Google Scholar]
- 22. Scichilone N, Benfante A, Bocchino M, Braido F, Paggiaro PL, Papi A, et al Which factors affect the choice of inhaler in chronic obstructive respiratory diseases. Pulm Pharmacol Ther 2015; 31: 63–67. [DOI] [PubMed] [Google Scholar]