

Abstract
Aims
The purpose of this study was to characterize pharmacokinetics (PK) of PF‐04236921, a novel anti‐interleukin‐6 monoclonal antibody, and its pharmacokinetic/pharmacodynamic (PK/PD) relationship on serum C‐reactive protein (CRP) in healthy volunteers and patients with rheumatoid arthritis (RA), systemic lupus erythematosus (SLE) and Crohn's disease (CD).
Methods
Population modelling analyses were conducted using nonlinear mixed effects modelling. Data from two phase 1 healthy volunteer studies, a phase 1 RA study, a Phase 2 CD study and a Phase 2 SLE study were included.
Results
A two‐compartment model with first order absorption and linear elimination and a mechanism‐based indirect response model adequately described the PK and PK/PD relationships, respectively. Central compartment volume of distribution (Vc) positively correlated with body weight. Clearance (CL) negatively correlated with baseline albumin concentration and positively correlated with baseline CRP and creatinine clearance, and was slightly lower in females. After correcting for covariates, CL in CD subjects was approximately 60% higher than other populations. Maximum inhibition of PF‐04236921 on CRP production (I max) negatively correlated with baseline albumin. I max positively correlated with baseline CRP and the relationship was captured as a covariance structure in the PK/PD model.
Conclusion
Integrated population PK and PK/PD models of PF‐04236921 have been developed using pooled data from healthy subjects and autoimmune patients. The current model enables simulation of PF‐04236921 PK and PD profiles under various dosing regimens and patient populations and should facilitate future clinical study of PF‐04236921 and other anti‐interleukin‐6 monoclonal antibodies.
Keywords: modelling and simulation, monoclonal antibodies, pharmacokinetic–pharmacodynamic, pharmacokinetics
What is Already Known about this Subject
Inhibition of interleukin (IL)‐6 signalling may offer a therapeutic approach for autoimmune diseases.
PF‐04236921 is a novel fully human anti‐IL‐6 monoclonal antibody binding to and neutralizing IL‐6 signalling.
While the safety and efficacy of PF‐04236921 in CD and SLE have been reported, the pharmacokinetics and pharmacodynamics properties of PF‐04236921 have not been published.
What this Study Adds
The current work provided integrated analyses of the PK of PF‐04236921 and the exposure‐response relationship of PF‐04236921 on serum C‐reactive protein reduction using pooled Phase 1–2 data from 5 trials.
A population modelling with covariate testing was conducted to compare the PK and PK/PD parameters of an antibody in healthy subjects, RA, CD and SLE patients.
A 60% higher clearance of PF‐04236921 in CD as compared with healthy subjects and RA and SLE population was reported.
Baseline albumin and C‐reactive protein were identified as impactful factors on the I max.
Introduction
The proinflammatory cytokine http://www.guidetopharmacology.org/GRAC/LigandDisplayForward?ligandId=4998 has been implicated in the pathophysiology of autoimmune diseases including rheumatoid arthritis (RA), Crohn's disease (CD) and systemic lupus erythematosus (SLE), and represents a rational therapeutic target 1, 2, 3. Tocilizumab, a monoclonal antibody that targets the http://www.guidetopharmacology.org/GRAC/ObjectDisplayForward?objectId=1708, has been approved for the treatment of RA and Castleman's Disease 4.
PF‐04236921 is a fully human IgG2 monoclonal antibody (mAb) that binds to and neutralizes IL‐6. PF‐ 04236921 has been tested in healthy volunteers and RA subjects in Phase 1 studies 5 and in SLE 6 and CD subjects 2 in Phase 2 studies. Concentrations of serum IL6 were low and variable, creating a challenge for using this marker to measure pharmacology. Therefore, serum C‐reactive protein (CRP), whose hepatic production is predominantly mediated by IL6 7, was used as the pharmacology marker for PF‐04236921. Overall, PF‐04236921 demonstrated desirable pharmacokinetic (PK) and pharmacodynamic (PD) properties supporting sustained target inhibition, and low incidence of immunogenicity upon single and multiple dose administrations 2, 5, 6. Efficacy and safety findings were discussed previously.
PK and PD of mAbs in treatment of autoimmune disease can be influenced by patient and disease factors such as sex, body size, concomitant use of immunosuppressive agents, disease status, serum albumin concentration and immune status 8, 9. While population modelling analyses of anti‐IL6 mAbs including siltuximab 10, sirukumab 11 and olokizumab 12 have been reported in literature in individual studies, no integrated analysis of an anti‐IL6 mAb using pooled study populations has been reported. The objectives of current work were to conduct population PK and PK/PD model analysis of PF‐04236921 using pooled data from the Phase 1 and 2 studies, and to understand factors contributing to inter‐subject variability in PF‐04236921 PK and PD.
Methods
Clinical studies and PK and CRP assessments
Data for the modelling came from five clinical studies of PF‐04236921 including two phase 1 single dose studies in healthy volunteers [Studies B0151001 and B0151004 for intravenous (IV) and subcutaneous (SC) administration, respectively], a phase 1 multiple dose study in RA patients receiving background methotrexate (Study B0151002), a phase 2 proof‐of‐concept/dose‐ranging study in moderate to severe CD subjects (Study B0151003) and a phase 2 proof‐of‐concept/dose‐ranging study in patients with moderate to severe SLE (Study B0151006).
Details of these clinical studies including their trial registration numbers and PK and CRP sample collections are presented in Table 1. All protocols and consent forms were reviewed and approved by each institutional review board subject to applicable laws and regulations and ethical principles consistent with the Declaration of Helsinki.
Table 1.
Summary of clinical studies included in the analysis
| Study (Trial Registration Number) | Study description | Population | Number of PF‐04236921 active treatment group subjects | Dosing regimen | PK sampling schedule | CRP sampling schedule |
|---|---|---|---|---|---|---|
| B0151001 | Phase 1 single ascending dose | Healthy volunteers | 36 | 7, 22, 44, 112, 284, 500 and 700 mg, i.v., single | Hour 0, 1.25, 2, 4 and 8 on Day 1, Day 2, 3, 4, 7, 14 and 28, additional outpatient visits (every 45 days from Day 28), follow up (or early withdrawal) | Hour 0 on Day 0, Day 2, 4, 7, 14 and 28, additional outpatient visits, follow up (or early withdrawal) |
|
B0151002
(NCT00838565) |
Phase 1 multiple ascending dose | Subjects with rheumatoid arthritis | 31 | 1, 10, 30, 100 and 250 mg, i.v., on Day 1, 28 and 56 | Hour 0 and 1.25 on Day 1, 28 and 56, Hour 0 on Day 7, 14, 35, 42, 63, 70 and 84, follow‐up visits (every 45 days from Day 84), End of Study (or early withdrawal) | Screening, Hour 0 on Day 1, 7, 14, 28, 35, 42, 56, 63, 70 and 84, follow‐up visits, End of Study (or early withdrawal) |
|
B0151004
(NCT01166555) |
Phase 1 subcutaneous PK study | Healthy volunteer | 10 | 200 mg SC, single | Hour 0, 4, 8, 12, 24, 48, 72, 96, 120, 144, 168, 216, 264 and 312 | Hour 0, 4, 8, 12, 24, 48, 72, 96, 120, 144, 168, 216, 264 and 312 |
|
B0151003
(NCT01287897) |
Phase 2 Proof‐of‐concept and dose‐ranging study | Subject with moderate to severe refractory CD who are anti‐TNF inadequate responders | 178 | 10, 50 and 200 mg SC; total two doses: Day 1 and Week 4 | Week 0 (prior to dosing), 2, 4 (prior to dosing), 6, 8, 10, 12, 16, 20, 24, 28, 32, 36, early‐ and post‐withdrawal visits, Week 40 or End of Study | Screening, Week 0 (prior to dosing), 2,,4 (prior to dosing), 6, 8, 10 and 12, early‐withdrawal and post‐withdrawal |
| B0151006 (NCT01405196) | Phase 2 Proof‐of‐concept and dose‐ranging study | Subjects with active generalized SLE | 138 | 10, 50 and 200 mg SC; total three doses: Day 1, Week 8 and Week 16 | Week 0 (prior to dosing), 2, 4, 6, 8 (prior to dosing), 12, 16 (prior to dosing), 20, 24, 28, 32, 36 and 44, early‐ and postwithdrawal visits, End of Study | Week 0 (prior to dosing), 2, 4, 6, 8 (prior to dosing), 12, 20 and 24, early‐withdrawal visit, Week 52 or End of Study |
PK, pharmacokinetics; CRP, C‐reactive protein; SC, subcutaneous
Serum samples were analysed for PF‐04236921 concentrations using a validated, sensitive and specific enzyme‐linked immunosorbent assay. The lower limit of quantitation (LLOQ) of the PK assay was 100 ng ml–1. A high sensitivity CRP assay based on the principle of particle‐enhanced immunological agglutination was validated for the quantitation of CRP. The LLOQ of the CRP assay ranged from 0.01 to 0.02 mg dl–1.
Modelling building strategy and software
Population analysis was conducted using NONMEM software Version 7.2 and 7.3 (ICON, Ellicott City, MD, USA) and final analyses were performed using NONMEM 7.3. Graphical and all other statistical analyses, including evaluation of NONMEM outputs, were performed using R version 3.0.2 and 3.1.2 (R Foundation for Statistical Computing, Vienna, Austria). Model‐based simulations were conducted using Perl‐speaks‐NONMEM (PsN) Version 3.5.4 and 4.2.0 13. The NONMEM first order conditional estimation method with η‐εinteraction was employed for all model runs.
The modelling analysis was conducted following the order of base model development, covariate model development, final model development and model quantitation (goodness of fit) as described in detail below. Overall, for PK structure model development, a base PK model was first developed using the rich‐time course data from B0151001 and B0151004. The base structure model was subsequently applied to the pooled data for all five studies for refinement. Once a PK structure model was developed, the impacts of covariates of interest on the PK parameters were assessed for a full PK model development. After completion of the population PK analysis, population PK/PD analysis was conducted using the Population PK Parameters and Data (PPP&D) method 14, where PD model parameters were estimated conditioning on the PK parameter estimates obtained from the population PK model as well as on the PK data themselves.
Population PK modelling
Compartmental PK models with linear elimination were tested as starting baseline model; however, alternative models incorporating nonlinear elimination were also evaluated. Since the range of the observed concentrations was large, serum PF‐04236921 concentrations were logarithmically transformed before model fitting. The number of PK samples with PF‐04236921 concentrations below the limit of quantitation were low, 8.5% of all postdose PK data, and excluded from the current analysis.
For random model development, interindividual variability (IIV) in the PK parameters was modelled using multiplicative exponential random effects. Specifically, CL for the ith individual, CL i, has the following form:
where CL i is the typical individual (population mean) value of the parameter and η CL,i denotes the individual random effect with mean zero and variance ω2 CL.
The multivariate vector of interindividual random effects has variance–covariance matrix Ω. For example, η CL,i and η Vc,i have the following covariance structure:
where ωCL × Vcrepresents covariance for η CL,i and η Vc,i, which is fixed to zero if the random effect parameters are assumed to be independent.
IIV was modelled by log transforming both sides approach with an additive error model. An observed serum concentration for the ith individual at time t ij (Y ij) was specified by:
where F ij represents a model‐predicted concentration. The error term ε ij was assumed to follow a normal distribution independently with mean zero and common variance σ 2. To explain IIV for the residual error, an interindividual random effect η error,i was incorporated into the error term as .
For covariate model development, demographic characteristics (body weight, age, body mass index, sex) and baseline concentrations of laboratory data [albumin (ALB), creatinine clearance (CLCR) and CRP] were available in these studies and evaluated as potential covariates of interest. Because body size, specifically body weight, has been identified as the most significant covariate on the PK (clearance and volume of distribution) of many monoclonal antibodies 15, a power model on body weight was incorporated to each disposition parameter (CL, Vc, Q, Vp) in the structural PK model before proceeding to the covariate modelling. Immunogenicity was not tested as a potential covariate given the very low incidence of ADA across all these clinical studies 2, 6.
For the final PK model development, covariate modelling was conducted systematically using step‐wise covariate modelling (SCM) approaches implemented in PsN. The procedure involved stepwise testing of relationships in a forwards inclusion [difference in objective function values (ΔOFV) of 3.84, P < 0.05, df = 1] and backwards exclusion (ΔOFV of 6.63, p < 0.01, df = 1) procedure. Clinical relevance of the relationship was also considered.
Continuous covariates were tested using a power model. For example, the model for P is expressed as follows:
where P i represents the model predicted parameter for the typical individual with covariate xi. The P represents the population central tendency for the individual P i. The median (x) represents the median value for the covariate in the subjects studied and θ x represents a scale factor.
The following linear model was to be tested as applicable:
where θ x represents a linear slope for the covariate x.
The categorical covariates were modelled using the general equation:
where COV i = θ x for test group and COV i = 1 for reference group.
Population PK/PD model for serum CRP response
For the PK/PD modelling, serum CRP concentrations below the LLOQ were analysed as LLOQ/2. The below the limit of quantitation data accounted for 9.4% of the total CRP data. Serum concentrations of CRP were logarithmically transformed before model fitting.
An indirect response model (as shown below) that is relevant to the anti‐IL‐6 mechanism of action for PF‐04236921 was tested as the base structure model in the current study.
where the C and R represent serum PF‐04236921 and CRP concentrations, respectively. The Kin and Kout refer to a zero‐order synthesis rate and a first‐order elimination rate for CRP, respectively. The I max represents a maximum inhibition of PF‐04236921 on the synthesis rate and IC 50 represents serum PF‐04236921 concentration that leads to 50% of I max; γ represents Hill coefficient. The BLCRP refers to baseline CRP level. The PD parameters were estimated separately for each disease (i.e. healthy subjects, patients with RA, CD and SLE).
Systematic model selection approach such as SCM was not performed thoroughly due to difficulty in NONMEM convergence and estimation runtime. Covariate models were investigated based on visual inspection of relationships between η (s) and covariates, limited forward inclusion by adding a covariate one at a time (up to three covariate combinations), and stability of the parameter estimation.
Continuous and categorical covariates were incorporated into the model in a same manner as PK covariate modelling. Inter‐ and intraindividual variabilities in the PD parameters were modelled using the same approach as PK error model described in the previous section.
Model qualification for PK and PK/PD models
The model was evaluated by diagnostic plots, nonparametric bootstrapping and visual predictive check (VPC). The η‐ and ε‐shrinkage were also calculated 16.
Diagnostics plots included observed PF‐04236921 or CRP concentrations vs. population predicted concentrations (PRED) or individual predicted concentrations and conditional weighted residuals (CWRES) vs. PRED or time.
For the final PK model, nonparametric bootstrapping with 1000 datasets (i.e. obtained from random sampling with replacement; each with subject number equivalent to the actual dataset) was performed to check the performance of the model. The bootstrap datasets were stratified by study to maintain the distributions consistent with the source dataset. For the bootstrap runs, descriptive statistics for each parameter estimate (2.5th, 50th and 97.5th percentiles) were summarized to evaluate validity of the final parameter estimates and their 95% CIs calculated based on normal approximation under the final model.
For the PK/PD final model, median and 95% CI (mean ± 1.96 × standard deviation) for all the fixed and random effects parameters were obtained from a limited nonparametric bootstrap. The procedure was same as bootstrap in the PK modelling but the number of the datasets was set to 30 due to limited computer resources in performing the bootstrap with long run time. For each bootstrap dataset, the final PK model was fit to the PK data to obtain the PK parameter estimates first and then the PD parameters were estimated with the PK parameter estimates fixed (see the PPP&D approach as described previously). For the bootstrap success runs (30 runs), the median and 95% CI for each parameter were compared with the corresponding final parameter estimate.
VPC was performed by correcting for differences within each bin originating from independent variables and covariates in the PK and PK/PD models, prediction‐corrected VPC (pcVPCs) 17. The pcVPCs were performed with 1000 datasets same design as the original dataset and using the final parameter estimates. Observed and simulated PF‐04236921 or CRP concentrations time courses (10th, 50th and 90th percentiles) were plotted to confirm whether each observed time course fell within the corresponding 95% prediction interval.
Nomenclature of targets and ligands
Key protein targets and ligands in this article are hyperlinked to corresponding entries in http://www.guidetopharmacology.org, the common portal for data from the IUPHAR/BPS Guide to PHARMACOLOGY 18, and are permanently archived in the Concise Guide to PHARMACOLOGY 2017/18 19.
Results
Observed PK and CRP data
Baseline characteristics and demographics of subjects in the five studies are summarized in Table 2.
Table 2.
Subject demographics (median [range]) of dataset used for the population pharmacokinetic and pharmacodynamic analysisa
| Study Population (administration route) | B0151001 HV (IV) | B0151004 HV (SC) | B0151002 RA (IV) | B0151003 CD (SC) | B0151006 SLE (SC) |
|---|---|---|---|---|---|
| n | 48 | 10 | 39 | 247 | 183 |
| Drug/placebo | 36/12 | 10/0 | 30/9 | 178/69 | 138/45 |
| M/F | 47/1 | 10/0 | 6/33 | 106/141 | 15/168 |
| W/B/A/O | 21/21/1/5 | 10/0/0/0 | 14/2/23/0 | 238/3/4/2 | 139/24/2/18 |
| Age (years) | 33 | 43 | 55 | 37 | 39 |
| [18, 55] | [20, 50] | [23, 70] | [18, 73] | [18, 72] | |
| Body weight (kg) | 79 | 82 | 61 | 70 | 73 |
| [56, 99] | [66, 94] | [45, 128] | [30, 153] | [38, 157] | |
| Body mass index (kg m –2 ) | 25.4 | 25.6 | 23.3 | 23.9 | 27.6 |
| [19.4, 30.4] | [22.1, 28.1] | [18.3, 44.3] | [14.0, 48.4] | [15.0, 54.1] | |
| CLcr (ml min –1 ) | 116 | 123 | 93.3 | 110 | 119 |
| [74.7, 177] | [108, 148] | [51.6, 192] | [51.4, 298] | [47.0, 329] | |
| Albumin (g dl –1 ) | 4.5 | 4.5 | 4.2 | 4.0 | 3.9 |
| [3.7, 5.0] | [4.2, 4.8] | [3.2, 4.7] | [2.3, 5.0] | [2.6, 4.8] | |
| CRP (mg l –1 ) | 0.9 | 0.8 | 7.4 | 19.4 | 2.9 |
| [0.2, 27.6] | [0.1, 3.3] | [0.6, 67.0] | [0.1, 139.8] | [0.1, 187.0] |
This population includes subjects with at least one PK or PD observation. M, male; F, female; W, White; B, Black; A, Asian; O, others; HV, healthy volunteers; RA, rheumatoid arthritis; CD, Crohn's disease; SLE, systemic lupus erythematosus; IV, intravenous administration; SC, subcutaneous administration; CLcr, creatinine clearance
Figure 1 presents the observed median serum PF‐04236921 concentration vs. time (Figure 1a) and the observed median CRP concentrations vs. time (Figure 1b) by study and dose. Serum PF‐04236921 concentration declined multi‐exponentially after reaching Cmax. Based on noncompartmental PK analyses (data not shown), Cmax and AUC of PF‐04236921 increased with dose in an approximately dose‐proportional manner in these studies. Serum CRP concentrations post‐treatment decreased in an approximately dose‐related manner in these studies. In addition, there appeared to be a temporal delay in the CRP reduction as compared with PK. For example, while Cmax in serum PF‐04236921 concentration reached at approximately 120 h following a single dose SC administration of PF‐04236921 of 200 mg dose in Study B0151004, a maximal CRP reduction was not reached until after 216 h (median) post‐treatment.
Figure 1.
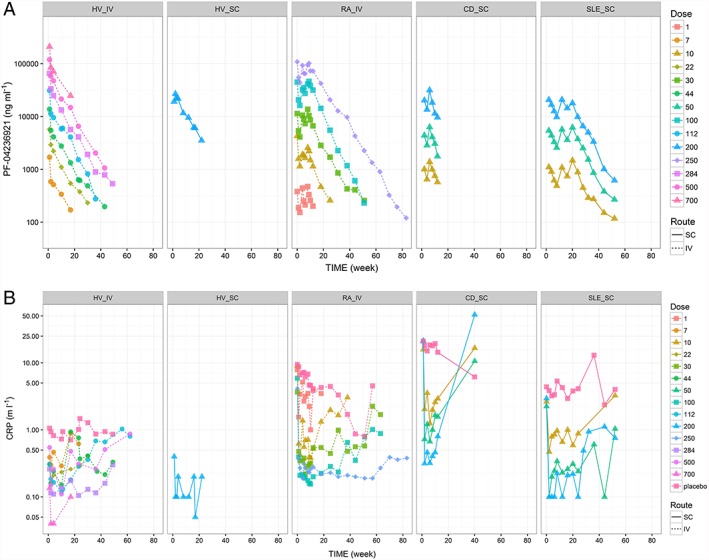
Observed median serum PF‐04236921 concentrations vs. time stratifying by protocol and dose (a) and observed median serum CRP concentrations vs. time by protocol and dose (b). HV_IV = B0151001, HV_SC = B0151004, RA_IV = B0151002, CD_SC = B0151003, SLE_SC = B0151006. Median PF‐04236921 and CRP concentrations at individual visits derived based on fewer than three observations were excluded from the plots. HV = healthy volunteers; RA = rheumatoid arthritis; CD = Crohn's disease; SLE = systemic lupus erythematosus; IV = intravenous administration; SC = subcutaneous administration
Final PK model
A two‐compartment structure model with first‐order absorption and elimination adequately described the rich time‐course PK data in the two Phase 1 studies for healthy subjects. Including nonlinear elimination did not significantly improve the model fitting based on OFV. Bioavailability was estimated to be 100% and was fixed to 100% in the base model. Fixing the SC bioavailability to 100% was supported by comparable dose‐normalized AUCinf estimates of PF‐04236921 following a single dose SC administration of 200 mg [geometric mean of 262 050 (ng h ml–1) mg–1] in Study B0151004 and a single dose IV administration at similar doses of 112 mg [geometric mean of 257 411 (ng h ml–1) mg–1] and 284 mg [geometric mean of 214 472 (ng h ml–1) mg–1] in Study B0151001. The corresponding F estimates based on noncompartmental PK analysis using the AUC following the IV administrations of 112 mg and 284 mg were 102% and 122%, respectively.
Following the initial base model development using the rich time‐course data, the base PK model was applied to the data from all five studies for model refinement. One RA patient with CWRES > 6 was excluded for further analysis, since the observed PK profile was significantly different from the predicted profile, such that inclusion of the data might result in instability of model parameter estimation. CL was estimated separately for the individual population, which was supported by a significant reduction of OFV by 196.695 as compared with estimating a single CL for all population. Including IIV for ka, CL, Vc and Vp estimates was supported by the data. Guided by reduction in OFV, correlation between η CL,i, η Vc,i and η Vp,i was included, whereas η ka,i was assumed as independent. The IIV for Q (η Q,i) was assumed to be dependent on η Vc,i, where the η Q,i was expressed as a product of a constant and η Vc,i (i.e. η Q,i = θ IIV on Q·η Vc,i). Addition of the η Q,i dependent on η Vc,i decreased OFV significantly (ΔOFV = –50.624). Regarding residual error, incorporation of IIV into the error term (addition of η error,i on ε ij, please see the method section) improved not only OFV (ΔOFV = –607.810) but also normality of distribution for the residual errors (CWRES and IWRES). Variance of the residual error (σ2) was estimated for healthy subjects with rich IV PK data (Study B0151001), healthy subjects with rich SC PK data (Study B0151004) and patients with sparse PK data (Study B0151002, B0151003 and B0151006), separately (ΔOFV = –48.304).
Figure 2 shows the relationships between covariates of interest and individual parameter random effects η (s) estimates based on the base model (Figure 2a) and final models (Figure 2b; empirical Bayes estimates). For the base model, age and ALB appeared to negatively associate with CL, whereas CLcr and CRP seemed to positively correlate with CL. Age also slightly related to Vc. In the stepwise covariate modelling (SCM), ALB was selected as the most influential covariate for CL (ΔOFV = –77.561 in the backward elimination step), followed by CLcr, CRP and SEX (ΔOFV = –17.695, –12.517 and – 7.360, respectively). The condition number of the final model was <1000 (498), indicating no appreciable collinearity among the covariates. No significant covariates were identified for any other PK parameters. The final form for each PK parameter for individual i is given below.
Figure 2.

Relationships between baseline covariates of interest and post‐hoc η (s) based on (a) pharmacokinetic (PK) base model; (b) PK final model; (c) PK/pharmacodynamic base model; and (d) PK/pharmacodynamic final model. Note: Each red line represents a smoother (loess) line. BWT = body weight; BMI = body mass index; CLcr = creatinine clearance; ALB = albumin; CRP_log = log‐transformed C‐reactive protein; RACE {W = White; B = Black; A = Asian; O = others}; Study {HV1 = B0151001; HV2 = B0151004; RA = B0151002; CD = B0151003; SLE = B0151006}. ETA CL, ETA Vc, ETA Vp, ETA Ka and ETA Eps represent individual empirical Bayes estimates for CL, Vc, Vp, ka and η for residual error in PK (ε), respectively. ETA BL, ETA Imax, ETA IC50 and ETA Eps represent individual empirical Bayes estimates for BLCRP, I max, IC 50 and η for residual error in PD (ε), respectively
SEXi = 1 male, 2 for female
θ CL estimated for healthy, RA, CD, and SLE subjects, respectively.
where θX and ηX represent fixed and random effect parameters, respectively.
The SCM step resulted in decrease in OFV by 153.380. The IIV for CL reduced from 42.1% in the final base model to 36.5% in the final PK model.
The parameter estimates for the final PK model are shown in Table 3. In general, the PK parameters were precisely estimated. Parameter estimate (%RSE) for CL in healthy volunteers and patients with RA and SLE ranged from 0.00546 to 0.00643 l h–1 (4.81–7.52%), which was similar across the subpopulations. The parameter estimate in patients with CD was 0.00946 l h–1 (4.10%), which was about 1.6 times higher than the average CL of the other subpopulations. The Vc and Vp were estimated to be 3.03 l (2.48%) and 3.58 l (3.36%), respectively. Moderate IIV was found (21.2% to 40.1%).
Table 3.
Parameter estimates of the population pharmacokinetic (A) and pharmacodynamic (B) models
| (A) PK model parameters | ||||
|---|---|---|---|---|
| Final model (pharmacokinetics) | ||||
| Parameter | Estimate | (RSE) | Bootstrap median | [95%CI] |
| θ CL,HV [l h –1 ] | 0.00546 | (4.81%) | 0.00545 | [0.00494, 0.00605] |
| θ CL,RA [l h –1 ] | 0.00588 | (7.52%) | 0.00581 | [0.00507, 0.00679] |
| θ CL,CD [l h –1 ] | 0.00946 | (4.10%) | 0.00946 | [0.00876, 0.0103] |
| θ CL,SLE [l h –1 ] | 0.00643 | (5.62%) | 0.00637 | [0.00572, 0.00715] |
| θ BWT on CL | 0.298 | (32.2%) | 0.298 | [0.116, 0.493] |
| θ ALB on CL | –1.53 | (12.5%) | –1.52 | [–1.92, –1.16] |
| θ CLcr on CL | 0.287 | (25.0%) | 0.281 | [0.142, 0.427] |
| θ CRP on CL | 0.0470 | (29.2%) | 0.0471 | [0.0223, 0.0749] |
| θ SEX on CL | 0.862 | (4.79%) | 0.865 | [0.786, 0.955] |
| θ Vc [l] | 3.03 | (2.48%) | 3.02 | [2.88, 3.21] |
| θ BWT on Vc | 0.550 | (18.8%) | 0.549 | [0.302, 0.768] |
| θ Q [l h –1 ] | 0.0245 | (9.70%) | 0.0241 | [0.0195, 0.0287] |
| θ BWT on Q | 0.845 | (30.8%) | 0.857 | [0.285, 1.41] |
| θ IIV on Q a | 2.73 | (33.9%) | 2.64 | [1.29, 4.72] |
| θ Vp [l] | 3.58 | (3.36%) | 3.54 | [3.33, 3.76] |
| θ BWT on Vp | 0.840 | (13.6%) | 0.848 | [0.586, 1.08] |
| θ ka [h –1 ] | 0.00607 | (8.94%) | 0.00603 | [0.00475, 0.00728] |
| Interindividual variability [%] b | ||||
| CV ( η CL) | 36.5 | (4.78%) | 36.0 | [32.4, 39.3] |
| CV ( η Vc) | 21.5 | (22.3%) | 20.8 | [13.5, 32.3] |
| CV ( η Vp) | 38.6 | (13.4%) | 36.6 | [26.6, 47.0] |
| CV ( η ka) | 21.2 | (21.7%) | 20.6 | [6.70, 51.1] |
| CV ( η error) | 40.1 | (7.93%) | 40.2 | [33.7, 46.3] |
| ρ( η CL , η VC ) c | 0.710 | (23.4%) | 0.736 | [0.580, 0.883] |
| ρ( η CL , η VP ) c | 0.606 | (21.9%) | 0.612 | [0.467, 0.731] |
| ρ( η VC , η VP ) c | 0.907 | (21.6%) | 0.903 | [0.769, 0.981] |
| Residual variability [%] | ||||
| CV (HV.IV) | 10.7 | (9.77%) | 10.6 | [9.11, 12.7] |
| CV (HV.SC) | 28.3 | (9.80%) | 27.9 | [22.9, 33.8] |
| CV (RA, CD, SLE) | 17.9 | (3.79%) | 17.9 | [16.5, 19.3] |
| (B) PD model parameters | ||||
|---|---|---|---|---|
| Final model (pharmacodynamics) | ||||
| Parameter | Estimate | (RSE) | Bootstrap medianf | [95%CI] f |
| θ BLCRP,HV [mg l –1 ] | 1.16 | (13.2%) | 1.16 | [0.850, 1.45] |
| θ BLCRP,RA [mg l –1 ] | 7.81 | (15.6%) | 7.73 | [5.18, 11.2] |
| θ BLCRP,CD [mg l –1 ] | 15.5 | (7.66%) | 15.7 | [13.1, 18.1] |
| θ BLCRP,SLE [mg l –1 ] | 2.42 | (9.17%) | 2.49 | [2.15, 2.94] |
| IC 50 , HV [ng ml –1 ] | 391 | (22.0%) | 369 | [251, 511] |
| IC 50 , RA [ng ml –1 ] | 41.8 | (11.3%) | 40.8 | [17.5, 65.7] |
| IC 50 , CD [ng ml –1 ] | 194 | (6.74%) | 192 | [150, 244] |
| IC 50,SLE [ng ml –1 ] | 388 | (19.8%) | 345 | [217, 499] |
| I max,HV [%] | 88.1 | (9.08%) | 88.3 | [83.4, 92.7] |
| I max,RA [%] | 97.0 | (7.32%) | 97.1 | [95.2, 98.8] |
| I max,CD [%] | 98.9 | (4.60%) | 98.9 | [98.3, 99.4] |
| I max,SLE [%] | 93.2 | (5.40%) | 93.3 | [90.6, 96.3] |
| θ Kout [h –1 ] | 0.0238 | (4.90%) | 0.0238 | [0.0225, 0.0251] |
| θ γ,HV, RA, CD | 1 fix | NA | 1 fix | NA |
| θ γ,SLE | 1.55 | (16.2%) | 1.42 | [1.20, 1.69] |
| θ ALB onBLCRP | –3.69 | (15.6%) | –3.75 | [–4.77, ‐2.75] |
| θ ALB onImax | –1.53 | (19.9%) | –1.57 | [–2.61, ‐0.709] |
| Inter‐individual variability [%] d | ||||
| CV ( η Base) | 95.9 | (4.03%) | 95.4 | [88.8, 101] |
| CV ( η IC50) | 120 | (9.49%) | 119 | [90.5, 144] |
| CV ( η Imax) | 111 | (6.69%) | 112 | [95.5, 125] |
| CV ( η error) | 53.4 | (24.0%) | 49.7 | [40.1, 60.3] |
| ρ ( η Base , η Imax) e | 0.852 | (12.0%) | 0.841 | [0.729, 0.988] |
| Residual variability [%] | ||||
| CV | 45.3 | (7.50%) | 45.8 | [42.5, 49.7] |
IC 50 was estimated as IC 50 = exp (θ IC50); I max was estimated as I max = exp (θ Imax)/(1 + exp (θ Imax)); RSE is shown as RSE for each θ. CD, Crohn's disease; HV, healthy volunteers; IV, intravenous administration; NA, not applicable; RA, rheumatoid arthritis; SC, subcutaneous administration; SLE, systemic lupus erythematosus
Fixed effect parameter for inter‐individual variability of Q (η Q = η Vc ·θ IIV on Q)
%CV = √(ω2)·100, RSE(%CV) = SE (ω2)/ (2ω2)
ρ = correlation coefficient (RSE for ωη1, η2)
%CV = √(ω2) × 100, RSE (CV) = SE (ω2)/(2ω2);
ρ = correlation coefficient (RSE for ωη1, η2)
Bootstrap median and 95% CI (mean ± 1.96 × standard deviation) were obtained based on bootstrap runs which successfully converged (30 runs)
Figure 3 shows prediction‐ and residual‐based diagnostic plots for the final model. There was no systematic bias or lack of fit observed, suggesting adequacy of the final PK model in describing the data. The nonparametric bootstrap median [95%CI] values were consistent to those of the final parameter estimates (Table 3). The final model was also evaluated by pcVPCs from 1000 simulations. Figure 4 shows pcVPC plots for the five studies. Although a slight underestimation of the model was observed in the RA population (median prediction concentrations were 16–24% lower than the observed concentrations for 12 weeks), the predicted concentration–time profiles were generally consistent with the observed profiles across the populations. The η‐shrinkage for CL, Vc, Vp and ε were low (1.7, 7.3, 5.6 and –0.5%, respectively). Moderate η‐shrinkage was observed for ka (59%), which reflected little PK information in the absorption phase in patients with CD and SLE. The ε‐shrinkage was 4.3%. In consideration of all the evaluation results, the final PK model adequately described serum PF‐04236921 concentration–time profiles in healthy volunteers and patients with RA, CD, or SLE.
Figure 3.

Goodness‐of‐fit plots for the final pharmacokinetic (a) and for pharmacodynamic model of C‐reactive protein response (b). Left panels: Scatter plots of observed concentrations (DV) vs. population predicted concentrations (PRED) and DV vs. individual predicted concentrations (IPRED). Right panels: Scatter plots of residuals normalized by the standard deviation of the data (conditional weighted residuals, CWRES) vs. PRED and CWRES vs. time after the first dose. Note: Each red line represents a smoother (loess) line. For CWRES vs. time plot, time value zero was replaced with 0.1 to show the point at time = 0 in the log scale
Figure 4.

Upper panels (a) show prediction‐corrected visual predictive check plot for PF‐04236921 concentrations stratifying by protocol. Lower panels (b) show prediction‐corrected visual predictive check plot for C‐reactive protein (CRP) concentrations stratifying by protocol. Note: For each panel, the black line (black dashed lines) represents observed median (10, 90 percentiles) PF‐04236921 and CRP prediction‐corrected concentrations time course. The red line (red dashed lines) represents predicted median (10, 90 percentiles) PF‐04236921 and CRP prediction‐corrected concentrations time course. The blue areas represent model‐predicted 95% intervals of 10, 50 and 90 percentiles of the time course. The closed circles indicate observed individual PF‐04236921 and CRP prediction‐corrected concentration time data. HV IV = healthy volunteers IV; HV SC = healthy volunteers SC; RA IV = RA patients IV; CD SC = CD patients SC; and SLE SC = SLE patients SC. RA = rheumatoid arthritis; CD = Crohn's disease; SLE = systemic lupus erythematosus; IV = intravenous administration; SC = subcutaneous administration
Final PK/PD model for CRP
Following the population PK modelling, PK/PD modelling was conducted by sequentially fitting PK and CRP data using PPP&D approach, which incorporated the PK parameter estimates. Typical values of BLCRP, I max and IC 50 were estimated for healthy subjects, RA, CD and SLE patients, separately, which was supported by a significant reduction of OFV by 542.285 as compared with estimating a single BLCRP, I max and IC 50 for all population. Kout was handled as a common parameter for all the population since separate Kout estimation for each disease condition did not lead to significantly better model fitting of the data (ΔOFV = –3.142, df = 3) based on model evaluations. IIV for BLCRP, I max and IC 50 (η BLCRP, η Imax and η IC50) was incorporated into the model. Since correlation between η BLCRP and η Imax was observed, covariance structure ( ) was incorporated, resulting in significant decrease in OFV (ΔOFV = –303.853). In the final model, the correlation coefficient ( ) was estimated to be 0.852, suggesting high correlation between baseline CRP and I max. The Hill coefficient γ was fixed to 1.0 for HV, RA and CD because of insignificance of the estimation, but estimated separately for SLE (ΔOFV = –8.738). Similar to the PK model, incorporation of IIV into the residual error (η error,i on εij) improved normality of the residual distribution as well as the OFV (ΔOFV = –846.549). Placebo response (CRP time course in placebo group) appeared constant (Supplemental Figure S1). Therefore, this PK/PD model assumed placebo response (CRP) was constant during the study period. The final forms for the PK/PD model parameters for individual i are given below:
θ BLCR, θ IC50, θ Imax estimated for healthy, RA, CD, and SLE subjects, respectively.
SLEi = 1forSLE patietns otherweise SLEi = 0.
where θX and ηX represent fixed and random effect parameters, respectively.
As reported in Table 3, with the indirect response model, the typical value of baseline CRP concentrations were estimated to be 1.16, 7.81, 15.5 and 2.42 mg l–1 in healthy, RA, CD and SLE subjects, respectively. The higher baseline CRP levels in the Phase 2 study in CD can be partly attributed to the baseline entry criteria of CRP > 5 mg l–1. The estimated Kout value for serum CRP was 0.0238 h–1, which corresponded to a turnover half‐life of ~ 1 day and consistent with the approximately 5‐day delay of the maximal CRP reduction relative to the maximal PK. The estimated I max values were 88.1, 97.0, 98.9 and 93.2% for healthy, RA, CD and SLE subjects, respectively. The respective estimated IC 50 values were 391, 41.8, 194 and 388 ng ml–1.
Relationships between covariates and empirical Bayes estimates η (s) derived from the model are presented in Figure 2c and 2d. As expected, observed baseline CRP was clearly correlated to η BLCRP, suggesting the model adequately predicted the individual baseline values. Observed baseline CRP also appeared to be correlated to η Imax, which supported adequacy of the base model where the BLCRP–I max relation was incorporated as a covariance structure for η BLCRP and η Imax (ωBLCRP × Imax). In the η vs. covariate plot, ALB seemed negatively correlated to η BLCRP and η Imax. For the other covariates, no major relationship was observed. When conducting analysis using models with each covariate or combination of the covariates added, ALB on BLCRP (ΔOFV = –31.017) and ALB on I max (ΔOFV = –47.996) were considered as influential covariates. These results were consistent with the relationship observed in the η vs. covariate plot. As a result, effects of ALB on BLCRP and ALB on I max were added to the base model, which was determined as the final PK/PD model. The final PK/PD model parameter estimates are shown in Table 3.
Figure 3 shows diagnostic plots for the final PK/PD model, supporting goodness of fit of the final PK/PD model. The nonparametric bootstrap median values [95%CI] for the final PK/PD parameters shown in Table 3 are consistent to the corresponding final parameter estimates and its 95%CIs derived from variance–covariance matrix for the parameter estimate. The pcVPC plots for each population shown in Figure 4 also demonstrated adequacy of the model. The η‐shrinkage for BLCRP, I max , IC 50 and ε were low (3.8%, 10.9%, 12.6% and – 10.7%, respectively). The negative η‐shrinkage for ε was considered due to some outliers (seven η error exceeded 4 × ωerror). The η‐shrinkage for ε without the outliers was 1.9%. The ε‐shrinkage was also low (2.4%). Based on these evaluation results, it is considered that the final PK/PD model adequately describes relationships between serum PF‐04236921 concentration‐ and CRP‐time profiles.
Discussion
In this study, integrated PK model and PK/PD model of PF‐04236921 on serum CRP were developed to describe simultaneously the data from healthy subjects and RA, CD and SLE patients across five trials. The effects of different potential covariates on the PK and PK/PD were also evaluated.
The final structure PK model of PF‐04236921 was a two‐compartmental model with first order absorption and linear elimination from the central compartment. All parameters were estimated with sufficient level of certainty and identifiability. The population average SC bioavailability of 100% is within the reported range for mAb (50–100%) in the literature 20 albeit at the high end, which suggests a minimal loss of PF‐04236921 SC dose through presystemic catabolism and/or a presystemic loss of the mAb balanced with FcRn recycling 21. The population average of Vc and Vp were 3.03 and 3.58 l, respectively, which are within the typical range (3–5 l) of Vc and Vp for monoclonal antibodies 9, 15, 22. However, the population average CL in healthy subjects and RA and SLE subjects, ranging from 0.00546 to 0.00643 l h–1 (0.131–0.154 l day–1), is slightly lower than the typical value of CL of endogenous IgG (0.211 l day–1) and the reported typical range of CL for monoclonal antibodies (0.2–0.5 l day–1) 15. In general, the primary route of antibody elimination is via proteolytic catabolism after receptor‐mediated endocytosis in the cells of the reticuloendothelial system. Antibody salvage and recirculation mediated by the Brambell receptor (FcRn) plays an important role in protecting IgG antibodies and albumin from ongoing catabolic activities, thus decreasing their CL 15. It was initially hypothesized that the slightly lower clearance value of PF‐04236921 than the literature values could be due to a higher affinity of PF‐04236921 to FcRn. For some antibodies, nonclinical data have indicated that a higher binding affinity of antibody to FcRn may decrease the clearance 23, 24. However, preliminary in vitro studies of PF‐04236921 ruled out this hypothesis because the binding affinity of PF‐04236921 to Fc domain of the human FcRn appeared to be comparable to reference mAb that possess typical T1/2 of ~ 28 days (data not shown). The exact mechanism underlying the slightly lower clearance of PF‐04236921 remains unknown and needs to be further explored. Based on the β‐phase elimination rate constant derived from this final PK model, the resulting half‐life was approximately 32–39 days in healthy subjects and RA or SLE subjects.
Of the baseline demographic and pathophysiological covariates tested, baseline ALB followed by baseline CLCR and CRP, and SEX were identified as significant covariates for CL after incorporating power models on body weight to all PK parameters (CL, Vc, Q and Vp) in the structure model. Low baseline albumin and high baseline CRP are associated with increases in CL for PF‐04236921, which is consistent with the understanding of the clearance mechanisms of antibody under normal and inflammatory conditions. IgG and albumin are known to have similar degradation mechanisms 9, 15, 21. In patients with serum albumin concentrations below normal range and elevated CRP levels, both markers of systemic inflammation, antibody clearance tends to be higher than patients with median laboratory values 9. Additionally, negative correlation between baseline albumin and CL were reported for infliximab in patients with ulcerative colitis 25 and ustekinumab in ulcerative colitis and CD 26 based on population PK analysis.
While it is less common that a significant effect of CLcR on total clearance is identified compared with the effects of body weight or sex, CLcR has been reported as a significant covariate affecting apparent clearance for tanezumab 27, ustekinumab 28 and onartuzumab 29. Although renal clearance is not considered important for elimination of monoclonal antibodies due to the size‐limited inefficient filtration of antibodies through the glomerulus, expression of FcRn in proximal renal cells has been suggested to contribute to transfer of IgG in urine by transcytosis, which may explain the covariate effect of CLCR on the total CL 27. Nevertheless, the effect of Clcr on clearance of PF‐04236921 was considered minor as the CL varied only by 6% when CLcr changed by 20% (data not shown).
Higher CL and Vd in males as compared with females are frequently reported for monoclonal antibodies. Based on our analysis, the clearance of PF‐04236921 was 14% lower in female as compared with males (Table 3). While the underlying mechanism are not fully understood, it was suggested that this slower clearance and lower Vd of monoclonal antibodies in females compared with males may be due to a higher expression of the FcRn receptor in females caused by differences in inflammatory cytokines and/or hormonal expression that are known to modulate FcRn expression and/or lower expression of FcRn in males due to higher muscle mass 27.
Lastly, after incorporating the body weight effects in the PK structure model and adjusting for the four significant covariates, the population estimate of CL in CD subjects (0.00946 l kg–1) was approximately 60% higher as compared with the other populations, suggesting a higher dose level may be required in CD to achieve comparable exposure. The higher CL of PF‐04236921 in CD is consistent with the reported qualitative correlation between the intestinal clearance of monomeric IgG in active CD and UC and the severity of the intestinal lesion 30. However, this concept of a drug‐losing enteropathy is currently entirely hypothetical and requires further exploration.
Although therapeutic mAbs have been commercially available for 2 decades, limited PK/PD analysis has been reported particularly from integrated cross‐study analysis. In the present study, the final PK/PD model of PF‐04236921 on serum CRP was an indirect response model in which PF‐04236921 inhibits the Kin of CRP. Because IL‐6 has been identified as the primary inducer of CRP synthesis by hepatocytes 7, the indirect response model is consistent with the underlying anti‐IL6 mechanism of action of PF‐04236921. The estimated Kout value of 0.0238 h–1 was comparable with the CRP turnover rate of 0.026–0.033 h–1 reported in literature 10, 31. This supports the physiological relevance of the Kout parameter.
As expected, baseline serum CRP levels were higher in the patients than healthy subjects [7‐, 14‐ and 2‐folder higher in RA, CD (with a baseline entry criterion of CRP ≥ 5 mg l–1) and SLE patients, respectively]. In the single ascending dose study in healthy volunteers (Study B0151001), the serum CRP reduction post treatment appeared to be dose‐dependent, despite of low CRP baseline and large intrasubject variability. In contrast, no clear dose‐dependent CRP suppression was reported for anti‐IL6 mAb sirukumab 11 and olokizumab 12 in Phase I studies in healthy volunteers. The discrepancy may be because the doses tested in the previous studies were likely too high. In the study for sirukumab, even the lowest dose tested was associated with approximately 50% CRP inhibition 11. These findings suggest that when assessing PK/PD relationship in healthy subjects, it is particularly important to study over a broad dose range that encompass incomplete to nearly complete target modulation and over a long study duration. Evidence of PK/PD relationship in the first‐in‐human (FIH) study could provide valuable proof‐of‐mechanism understanding in early development.
The estimated I max value of 88% in healthy subjects was slightly lower than the I max ranging from 93 to 99% in RA, CD and SLE subjects, which may be attributed to the lower baseline CRP levels in healthy subjects compared to patients. The estimated IC 50 values were 391, 42, 194 and 388 ng ml–1 in healthy subjects, RA, CD and SLE patients, respectively. The IC 50 estimate in RA appeared to be lower than in other populations; however, the exact value of the IC 50 values in RA need to be interpreted with caution. As shown in the scattered plots for observed individual percent of change from baseline of serum concentrations of CRP vs. corresponding serum concentrations of PF‐04236921 (Supplemental Figure S2), the percent of changes of baseline did not reach –50% until serum concentrations of PF‐04236921 reached >100 ng ml–1 in CD and SLE subjects but were reached at serum concentrations of PF‐04236921 <100 ng ml–1 in RA subjects. Because the serum concentrations of PF‐04236921 <100 ng ml–1, which was the LLOQ of the PK assay, were <10% of the total PK data and thus excluded in the current study, the IC 50 estimate in RA was extrapolated from the current PK/PD model beyond the current available data; thus, need to be interpreted with caution.
Baseline CRP and albumin concentrations were identified as two impactful factors on the PD parameters. The I max estimates of PF‐04236921 on serum CRP negatively associated with baseline albumin concentrations. Additionally, because acute and chronic inflammatory responses can cause low serum albumin levels and elevated CRP levels, it was not surprising that baseline albumin concentrations negatively associated with baseline CRP levels. However, even after correcting for the covariate effects of baseline albumin on the I max and baseline CRP, a positive correlation still existed between baseline CRP and unexplained IIV in I max. The remaining CRP‐Imax relation was incorporated as a covariance structure for η BLCRP and η Imax. Based on the covariance, correlation between η BLCRP and η Imax was highly positive (ρ = 0.852). Instead of incorporating the covariance structure for η BLCRP and η Imax, adding baseline CRP (estimated BLCR) as a covariate for I max led to substantial increase in the OFV (ΔOFV = 82.644), thus, WAS not selected for the final model.
Lastly, we used the typical PK and PD parameter estimates simulated the steady‐state serum CRP response (% of baseline) following a SC administration of PF‐04236921 ranging up to 1000 mg (Week 0, 4 and 12 administration) in typical healthy subjects, and RA, CD and SLE patients. Based on the simulated steady‐state dose–response (Supplemental Figure S3), the steady‐state ED50 values was approximately 5, 0.6, 5 and 6 mg in healthy, RA, CD and SLE subjects, respectively. The steady‐state ED90 values were predicted to be >1000, 7, 51 and 43 mg, in healthy, RA, CD and SLE subjects, respectively. The steady‐state ED50 and ED90 estimates in CD and SLE are in general consistent with the observed responses in serum concentrations of CRP in the dose‐ranging study studies B0151003 in CD 2 and B0151006 in SLE 6. For example, following administration of multiple SC doses of 10 mg, 50 mg and 200 mg of PF‐04236921 on Day 1 and 28, median percentages of change from baseline in CRP concentrations were – 66, –86 and – 96%, compared with –12% for placebo at Week 12 in CD patients 2.
In conclusion, the current population modelling thoroughly studied and compared the anti‐IL6 antibody PK and PD parameters in healthy volunteers, RA, CD and SLE subjects using population PK and PK/PD modelling approach. The current model enables simulation of PF‐04236921 PK and PD profiles under various dosing regimens and patient populations and should facilitate future clinical study of PF‐04236921 and other anti‐IL6 monoclonal antibodies. Furthermore, the current population PK/PD model with its physiologically relevant model structure and parameter estimates can be easily integrated into models of a different level of mechanistic details to enhance model‐based drug discovery and development. As previously published 32, we developed a multiscale system‐level model of IL‐6–mediated immune regulation in Crohn's disease. The multiscaled model integrated intracellular signalling with organ‐level dynamics of pharmacological markers underlying the disease including CRP and linking it to the PK and PD data of anti‐IL6 and anti‐IL‐receptor therapeutic agents. It would be of great value to reverse translate and integrate the PK/PD understanding from the current population analysis into the system model to further advance the multiscale model development. In addition, the current models can be expanded to incorporate efficacy and safety data for characterization of exposure–response relationships in efficacy and safety, and to guide the development of safer and more effective treatment paradigms with anti‐IL6 therapeutic agents.
Competing Interests
C.L., S.S. and J.B. are all employees and shareholders of Pfizer Inc.
The authors would like to thank the subjects, investigators and site personnel, and study teams who were involved in the Phase 1 to Phase 2 studies of the anti‐IL6 mAb, PF‐04236921. The authors would also like to acknowledge the additional reviewers of this manuscript including Akiyuki Suzuki and Steven W. Martin. The authors would like to thank Yoshiro Tomono of Pfizer Japan Inc. for providing analytical support in this study. The studies were sponsored by Pfizer Inc.
Supporting information
Figure S1 Upper panels show observed placebo response (individual C‐reactive protein concentrations vs. time plots by protocol for placebo group only). Lower panels zoom the profile from time 0 to 3000 h. Note: Each line represents a smooth local regression calculated from loess function of R software. HV_IV = B0151001; HV_SC = B0151004; RA_IV = B0151002; CD_SC = B0151003; SLE_SC = B0151006. HV = healthy volunteers; RA = rheumatoid arthritis; CD = Crohn's disease; SLE = systemic lupus erythematosus; IV = intravenous administration; SC = subcutaneous administration
Figure S2 Relationships between observed serum C‐reactive protein (CRP) concentration (% ratio to the baseline) and observed serum PF‐04236921 concentration on the same day. Note: Each solid line represents the CRP ratio vs. serum PF‐04236921 concentration (Cp) profile predicted from a sigmoid Emax model [CRP ratio = 100*(1 – Imax*CpHill/(IC50Hill + CpHill)]. The parameters (Imax, IC50 and Hill) were estimated to be 61.2%, 1170 ng ml–1, 0.941 for HV; 95.2%, 24.2 ng ml–1, 0.725 for RA; 98.3%, 150 ng ml–1, 0.966 for CD; and 95.3%, 317 ng ml–1, 0.912 for SLE, respectively. Each dashed line indicates 50% of the CRP ratio. HV_IV = B0151001; HV_SC = B0151004; RA_IV = B0151002; CD_SC = B0151003; SLE_SC = B0151006. HV = healthy volunteers; RA = rheumatoid arthritis; CD = Crohn's disease; SLE = systemic lupus erythematosus; IV = intravenous administration; SC = subcutaneous administration
Figure S3 Left panel shows predicted CRP ratios to the baseline (%) vs. time profile following subcutaneous (SC) administrations of PF‐04236921 50 mg (week 0, 4 and 12) in a typical healthy, RA, CD or SLE subject. Right panel shows predicted dose response profile at week 12 following SC administrations of PF‐04236921 up to 1000 mg (week 0, 4 and 12) to a typical healthy, RA, CD, or SLE subject. Note: The typical individual is a male with body weight 72 kg, albumin 4.0 g dl–1, creatinine clearance (CLcr) 113 ml min–1 and baseline CRP 1.16 mg l–1 (HV), 7.81 mg l–1 (RA), 15.5 mg l–1 (CD), or 2.42 mg l–1 (SLE). The ED50 and ED90 show doses corresponding to 50% and 90% CRP inhibitions (dashed lines). HV = healthy volunteers; RA = rheumatoid arthritis; CD = Crohn's disease; SLE = systemic lupus erythematosus
Li, C. , Shoji, S. , and Beebe, J. (2018) Pharmacokinetics and C‐reactive protein modelling of anti‐interleukin‐6 antibody (PF‐04236921) in healthy volunteers and patients with autoimmune disease. Br J Clin Pharmacol, 84: 2059–2074. 10.1111/bcp.13641.
Trial Registration Number: NCT00838565 (B0151002), NCT01287897 (B0151003), NCT01166555 (B0151004), NCT01405196 (B0151006).
References
- 1. Catarzi S, Favilli F, Romagnoli C, Marcucci T, Picariello L, Tonelli F, et al Oxidative state and IL‐6 production in intestinal myofibroblasts of Crohn's disease patients. Inflamm Bowel Dis 2011; 17: 1674–1684. [DOI] [PubMed] [Google Scholar]
- 2. Danese S, Vermeire S, Hellstern P, Panaccione R, Rogler G, Fraser G, et al Randomised trial and open‐label extension study of an anti‐interleukin‐6 antibody in Crohn's disease (ANDANTE I and II). Gut 2017; gutjnl‐2017‐314562. [DOI] [PMC free article] [PubMed] [Google Scholar]
- 3. Ito H. IL‐6 and Crohn's disease. Curr Drug Targets Inflamm Allergy 2003; 2: 125–130. [DOI] [PubMed] [Google Scholar]
- 4. Tanaka T, Narazaki M, Kishimoto T. Anti‐interleukin‐6 receptor antibody, tocilizumab, for the treatment of autoimmune diseases. FEBS Lett 2011; 585: 3699–3709. [DOI] [PubMed] [Google Scholar]
- 5. Fogel R, Sridharan S, Li C, Bradley J, Riese R, Labadie R, et al Safety, pharmacokinetics, and pharmacodynamics of a human anti‐IL6 monoclonal antibody PF‐04236921 in healthy subjects. Ann Rheum Dis 2013; 71 (Suppl 3): 680. [Google Scholar]
- 6. Wallace DJ, Strand V, Merrill JT, Popa S, Spindler AJ, Eimon A, et al Efficacy and safety of an interleukin 6 monoclonal antibody for the treatment of systemic lupus erythematosus: a phase II dose‐ranging randomised controlled trial. Ann Rheum Dis 2017; 76: 534–542. [DOI] [PMC free article] [PubMed] [Google Scholar]
- 7. Vermeire S, Van Assche G, Rutgeerts P. C‐reactive protein as a marker for inflammatory bowel disease. Inflamm Bowel Dis 2004; 10: 661–665. [DOI] [PubMed] [Google Scholar]
- 8. Gill KL, Machavaram KK, Rose RH, Chetty M. Potential sources of inter‐subject variability in monoclonal antibody pharmacokinetics. Clin Pharmacokinet 2016; 55: 789–805. [DOI] [PubMed] [Google Scholar]
- 9. Ordas I, Mould DR, Feagan BG, Sandborn WJ. Anti‐TNF monoclonal antibodies in inflammatory bowel disease: pharmacokinetics‐based dosing paradigms. Clin Pharmacol Ther 2012; 91: 635–646. [DOI] [PubMed] [Google Scholar]
- 10. Puchalski T, Prabhakar U, Jiao Q, Berns B, Davis HM. Pharmacokinetic and pharmacodynamic modeling of an anti‐interleukin‐6 chimeric monoclonal antibody (siltuximab) in patients with metastatic renal cell carcinoma. Clin Cancer Res 2010; 16: 1652–1661. [DOI] [PubMed] [Google Scholar]
- 11. Xu Z, Bouman‐Thio E, Comisar C, Frederick B, Van Hartingsveldt B, Marini JC, et al Pharmacokinetics, pharmacodynamics and safety of a human anti‐IL‐6 monoclonal antibody (sirukumab) in healthy subjects in a first‐in‐human study. Br J Clin Pharmacol 2011; 72: 270–281. [DOI] [PMC free article] [PubMed] [Google Scholar]
- 12. Kretsos K, Golor G, Jullion A, Hickling M, McCabe S, Shaw S, et al Safety and pharmacokinetics of olokizumab, an anti‐IL‐6 monoclonal antibody, administered to healthy male volunteers: A randomized phase I study. Clin Pharmacol Drug Dev 2014; 3: 388–395. [DOI] [PubMed] [Google Scholar]
- 13. Lindbom L, Ribbing J, Jonsson EN. Perl‐speaks‐NONMEM (PsN) – a Perl module for NONMEM related programming. Comput Methods Programs Biomed 2004; 75: 85–94. [DOI] [PubMed] [Google Scholar]
- 14. Zhang L, Beal SL, Sheiner LB. Simultaneous vs. sequential analysis for population PK/PD data I: best‐case performance. J Pharmacokinet Pharmacodyn 2003; 30: 387–404. [DOI] [PubMed] [Google Scholar]
- 15. Dirks NL, Meibohm B. Population pharmacokinetics of therapeutic monoclonal antibodies. Clin Pharmacokinet 2010; 49: 633–659. [DOI] [PubMed] [Google Scholar]
- 16. Savic RM, Karlsson MO. Importance of shrinkage in empirical bayes estimates for diagnostics: problems and solutions. AAPS J 2009; 11: 558–569. [DOI] [PMC free article] [PubMed] [Google Scholar]
- 17. Bergstrand M, Hooker AC, Wallin JE, Karlsson MO. Prediction‐corrected visual predictive checks for diagnosing nonlinear mixed‐effects models. AAPS J 2011; 13: 143–151. [DOI] [PMC free article] [PubMed] [Google Scholar]
- 18. Harding SD, Sharman JL, Faccenda E, Southan C, Pawson AJ, Ireland S, et al The IUPHAR/BPS Guide to PHARMACOLOGY in 2018: updates and expansion to encompass the new guide to IMMUNOPHARMACOLOGY. Nucl Acids Res 2018; 46: D1091–D1106. [DOI] [PMC free article] [PubMed] [Google Scholar]
- 19. Alexander SPH, Fabbro D, Kelly E, Marrion NV, Peters JA, Faccenda E, et al The Concise Guide to PHARMACOLOGY 2017/18: Catalytic receptors. Br J Pharmacol 2017; 174 (Suppl 1): S225–S271. [DOI] [PMC free article] [PubMed] [Google Scholar]
- 20. Lobo ED, Hansen RJ, Balthasar JP. Antibody pharmacokinetics and pharmacodynamics. J Pharm Sci 2004; 93: 2645–2668. [DOI] [PubMed] [Google Scholar]
- 21. Wang W, Wang EQ, Balthasar JP. Monoclonal antibody pharmacokinetics and pharmacodynamics. Clin Pharmacol Ther 2008; 84: 548–558. [DOI] [PubMed] [Google Scholar]
- 22. Keizer RJ, Huitema AD, Schellens JH, Beijnen JH. Clinical pharmacokinetics of therapeutic monoclonal antibodies. Clin Pharmacokinet 2010; 49: 493–507. [DOI] [PubMed] [Google Scholar]
- 23. Ghetie V, Popov S, Borvak J, Radu C, Matesoi D, Medesan C, et al Increasing the serum persistence of an IgG fragment by random mutagenesis. Nat Biotechnol 1997; 15: 637–640. [DOI] [PubMed] [Google Scholar]
- 24. Hinton PRXJ, Johlfs MG, Tang MT, Keller S, Tsurushita N. An engineered human IgG1 antibody with longer serum half‐life. J Immunol 2006; 176: 346–356. [DOI] [PubMed] [Google Scholar]
- 25. Fasanmade AA, Adedokun OJ, Ford J, Hernandez D, Johanns J, Hu C, et al Population pharmacokinetic analysis of infliximab in patients with ulcerative colitis. Eur J Clin Pharmacol 2009; 65: 1211–1228. [DOI] [PMC free article] [PubMed] [Google Scholar]
- 26. Rosario M, Dirks NL, Gastonguay MR, Fasanmade AA, Wyant T, Parikh A, et al Population pharmacokinetics‐pharmacodynamics of vedolizumab in patients with ulcerative colitis and Crohn's disease. Aliment Pharmacol Ther 2015; 42: 188–202. [DOI] [PMC free article] [PubMed] [Google Scholar]
- 27. Jonsson EN, Xie R, Marshall SF, Arends RH. Population pharmacokinetics of tanezumab in phase 3 clinical trials for osteoarthritis pain. Br J Clin Pharmacol 2016; 81: 688–699. [DOI] [PMC free article] [PubMed] [Google Scholar]
- 28. Zhu Y, Hu C, Lu M, Liao S, Marini JC, Yohrling J, et al Population pharmacokinetic modeling of ustekinumab, a human monoclonal antibody targeting IL‐12/23p40, in patients with moderate to severe plaque psoriasis. J Clin Pharmacol 2009; 49: 162–175. [DOI] [PubMed] [Google Scholar]
- 29. Xin Y, Jin D, Eppler S, Damico‐Beyer LA, Joshi A, Davis JD, et al Population pharmacokinetic analysis from phase I and phase II studies of the humanized monovalent antibody, onartuzumab (MetMAb), in patients with advanced solid tumors. J Clin Pharmacol 2013; 53: 1103–1111. [DOI] [PubMed] [Google Scholar]
- 30. Kapel N, Meillet D, Favennec L, Magne D, Raichvarg D, Gobert JG. Evaluation of intestinal clearance and faecal excretion of alpha 1‐antiproteinase and immunoglobulins during Crohn's disease and ulcerative colitis. Eur J Clin Chem Clin Biochem 1992; 30: 197–202. [DOI] [PubMed] [Google Scholar]
- 31. Mauger JF, Levesque J, Paradis ME, Bergeron N, Tchernof A, Couture P, et al Intravascular kinetics of C‐reactive protein and their relationships with features of the metabolic syndrome. J Clin Endocrinol Metab 2008; 93: 3158–3164. [DOI] [PubMed] [Google Scholar]
- 32. Dwivedi G, Fitz L, Hegen M, Martin SW, Harrold J, Heatherington A, et al A multiscale model of interleukin‐6‐mediated immune regulation in Crohn's disease and its application in drug discovery and development. CPT Pharmacometrics Syst Pharmacol 2014; 3: e89. [DOI] [PMC free article] [PubMed] [Google Scholar]
Associated Data
This section collects any data citations, data availability statements, or supplementary materials included in this article.
Supplementary Materials
Figure S1 Upper panels show observed placebo response (individual C‐reactive protein concentrations vs. time plots by protocol for placebo group only). Lower panels zoom the profile from time 0 to 3000 h. Note: Each line represents a smooth local regression calculated from loess function of R software. HV_IV = B0151001; HV_SC = B0151004; RA_IV = B0151002; CD_SC = B0151003; SLE_SC = B0151006. HV = healthy volunteers; RA = rheumatoid arthritis; CD = Crohn's disease; SLE = systemic lupus erythematosus; IV = intravenous administration; SC = subcutaneous administration
Figure S2 Relationships between observed serum C‐reactive protein (CRP) concentration (% ratio to the baseline) and observed serum PF‐04236921 concentration on the same day. Note: Each solid line represents the CRP ratio vs. serum PF‐04236921 concentration (Cp) profile predicted from a sigmoid Emax model [CRP ratio = 100*(1 – Imax*CpHill/(IC50Hill + CpHill)]. The parameters (Imax, IC50 and Hill) were estimated to be 61.2%, 1170 ng ml–1, 0.941 for HV; 95.2%, 24.2 ng ml–1, 0.725 for RA; 98.3%, 150 ng ml–1, 0.966 for CD; and 95.3%, 317 ng ml–1, 0.912 for SLE, respectively. Each dashed line indicates 50% of the CRP ratio. HV_IV = B0151001; HV_SC = B0151004; RA_IV = B0151002; CD_SC = B0151003; SLE_SC = B0151006. HV = healthy volunteers; RA = rheumatoid arthritis; CD = Crohn's disease; SLE = systemic lupus erythematosus; IV = intravenous administration; SC = subcutaneous administration
Figure S3 Left panel shows predicted CRP ratios to the baseline (%) vs. time profile following subcutaneous (SC) administrations of PF‐04236921 50 mg (week 0, 4 and 12) in a typical healthy, RA, CD or SLE subject. Right panel shows predicted dose response profile at week 12 following SC administrations of PF‐04236921 up to 1000 mg (week 0, 4 and 12) to a typical healthy, RA, CD, or SLE subject. Note: The typical individual is a male with body weight 72 kg, albumin 4.0 g dl–1, creatinine clearance (CLcr) 113 ml min–1 and baseline CRP 1.16 mg l–1 (HV), 7.81 mg l–1 (RA), 15.5 mg l–1 (CD), or 2.42 mg l–1 (SLE). The ED50 and ED90 show doses corresponding to 50% and 90% CRP inhibitions (dashed lines). HV = healthy volunteers; RA = rheumatoid arthritis; CD = Crohn's disease; SLE = systemic lupus erythematosus