

Tissue-specific autoimmunity requires recognition of selected antigens presented by susceptible major histocompatibility complex (MHC) alleles. However, it remains unclear why certain self-antigens dominate the response and are indispensable for triggering autoreactivity. We address this question by examining spontaneous presentation of insulin, a self-antigen essential for initiating autoimmune type 1 diabetes (T1D) in the non-obese diabetic (NOD) mice1,2. A major set of pathogenic CD4 T cells specifically recognizes the 12-20 segment of the insulin B-chain (B:12-20), an epitope generated from direct presentation of insulin peptides by antigen presenting cells (APCs)3,4. These T cells do not respond to APCs given insulin protein, whose processing leads to presentation of an alternative segment, 13-21, a one residue shift4. CD4 T cells to B:12-20 escape thymic negative selection and cause diabetes, while those to B:13-21 are weakly involved in the autoimmune process3–5. Although presentation of B:12-20 is evident in the islets3,6, insulin-specific germinal centres can be formed in various lymphoid tissues, suggesting widespread presentation7,8. Here, using live imaging we document insulin recognition disseminated throughout various lymph nodes (LNs). Furthermore, we identify catabolized insulin fragments containing defined pathogenic epitopes in beta-cell granules of mice and humans. Upon glucose challenge, these fragments are released into the circulation and recognized by CD4 T cells, imprinting an activation state manifested by transcriptional reprogramming and enhanced diabetogenicity. Therefore, a tissue like pancreatic islets by releasing catabolized products imposes a constant threat to self-tolerance. These findings reveal a novel self-recognition pathway underlying a primary autoantigen and provide a foundation for assessing antigenic targets that precipitate pathogenic outcomes by sensitizing lymphoid tissues systemically.
Based on previous studies demonstrating constrained T-cell migration during limited antigen recognition9–12, we imaged insulin presentation in peripheral LNs by two-photon microscopy of LN explants following transfer of insulin-specific T cells (Fig. 1a). These were transferred together with wild-type (WT) CD4 T cells as a control, each labelled with a different fluorescent probe (Fig. 1b). We tracked the two sets of individual T cells within the same region of LNs and quantified their motility (Extended Data Fig. 1a). Examination of a control CD4 T cell (10E11) recognizing hen egg-white lysozyme (HEL) confirmed that limited antigen recognition insufficient to trigger cell division can be assessed by a decrease in the mean track velocities of T cells (Fig. 1c, Extended Data Fig. 1b, Supplementary Video 1).
Figure 1. Peripheral insulin presentation is systemic, epitope-specific, and occurs physiologically.
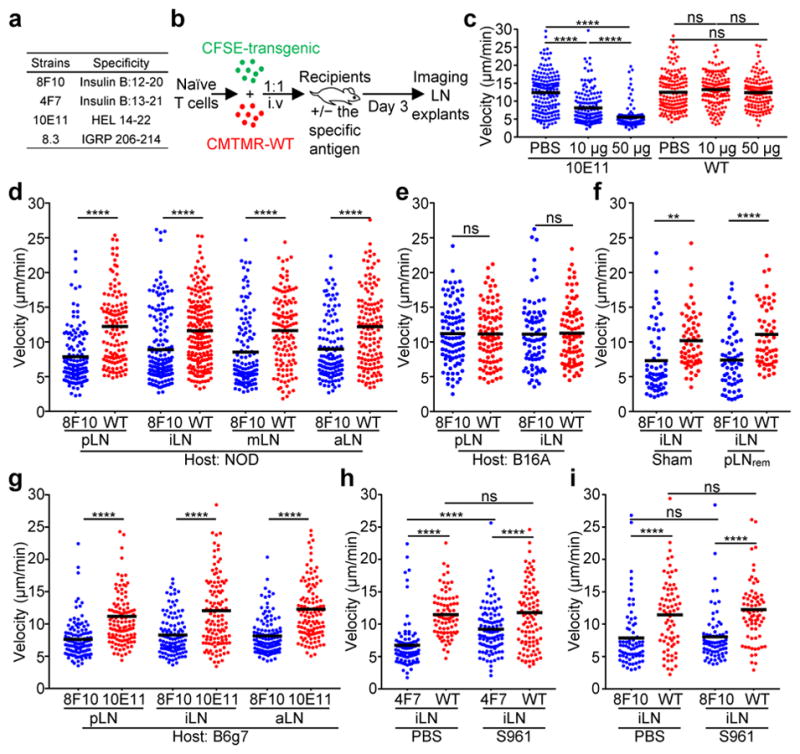
a, Summary of the antigen-specific T cells examined. b, The scheme of the two-photon imaging model. The panels (c–i) show mean track velocities (μm/min) of: c, 10E11 and WT CD4 T cells in recipients given the indicated amounts of HEL. d, e, 8F10 and WT CD4 T cells in NOD (d) or B16A (e) recipients. f, 8F10 and WT CD4 T cells in NOD mice after surgical removal of the pLNs (pLNrem) or control surgery (sham). g, 8F10 and 10E11 CD4 T cells in B6g7 recipients 24h post transfer. h, i, 4F7 and WT (h) or 8F10 and WT (i) CD4 T cells in NOD mice infused with S961 or PBS. Data are pooled results from at least three independent experiments. Each dot represents individual T cell tracks, and the bar denotes the mean. ns, not significant; **, P < 0.001; ****, P < 0.0001; one-way ANOVA with Sidak’s multiple comparisons test.
Widespread presentation of insulin peptides was manifested by reduced motility of the B:12-20-reactive 8F10 T cells in the pancreatic (pLN), inguinal (iLN), mesenteric (mLN) and axillary (aLN) LNs of NOD mice, relative to WT CD4 T cells (Fig. 1d, Supplementary Video 2). Such presentation was constant from day 1 to 5 (Extended Data Fig. 1c). It was unaffected by switching the labelling of the fluorescent probes (Extended Data Fig. 1d). The diffused pattern of motility arrest rather than cluster formation indicated that presentation of insulin peptides was limiting and not restricted to selected APCs. Reduced 8F10 T cell motility was also found in mice lacking B cells (μMT) or XCR1+ dendritic cells (DCs; Batf3−/−) (Extended Data Fig. 1e).
Three experiments interrogated key parameters of antigen recognition by 8F10 T cells. First, we examined the B16A mouse that lacks both insulin-1 and insulin-2 but expresses a proinsulin transgene with a tyrosine-to-alanine substitution at the 16th position of the B-chain1. This mutant insulin is bioactive but not immunogenic to B:12-20- or B:13-21-specific T cells. There was no motility arrest of the 8F10 T cells in the B16A recipients, demonstrating specific epitope recognition (Fig. 1e, Supplementary Video 3). Second, we investigated whether a prior recirculation through the pLN was required for insulin recognition in other sites. Surgical removal of pLNs (pLNrem) did not influence the motility arrest of 8F10 T cells in the iLNs (Fig. 1f). Third, motility arrest of 8F10 T cells was detected in the diabetes-resistant B6 mice harbouring the I-Ag7 haplotype (B6g7) (Fig. 1g) but not the NOD.H2b hosts (Extended Data Fig. 1f). Thus, peripheral insulin presentation to 8F10 T cells requires I-Ag7 and is not restricted to the NOD strain.
The 4F7 T cells specific to the B:13-21 epitope also showed a significant velocity decrease in the pLNs and iLNs of NOD recipients (Extended Data Fig. 1g). In contrast, the 8.3 CD8 T cells recognizing the islet-specific glucose-6-phosphatase-related protein (IGRP)13, an antigen expressed in the endoplasmic reticulum of beta-cells, showed reduced motility in the pLN but not in the iLN (Extended Data Fig. 1h). Thus, insulin epitopes, but not those from this cell-associated antigen, are systemically available.
Considering that the low concentrations of circulating insulin (~40 pM) may depend on insulin receptor (IR)-mediated uptake by APCs, we examined the effects of S961, an IR antagonist14. In culture assays, S961 substantially impaired the ability of ConA-activated macrophages to present insulin (Extended Data Fig.1i). In vivo blockade of IR was manifested by a sustained increase of blood glucose levels in mice infused with S961 via osmotic pumps (Extended Data Fig. 1j), permitting two-photon imaging (Extended Data Fig. 1k). A significant reduction in 4F7 T cell velocity was observed in mice given PBS (Fig. 1h, Supplementary Video 4). Although motility was also arrested after S961 administration, the reduction was significantly less than in the control mice (Fig. 1h, Supplementary Video 4). Therefore, blockade of IR-mediated uptake of insulin partially abrogated recognition of the 4F7 T cells, suggesting free insulin peptides as an additional source of the B:13-21 epitope. In contrast, the motility arrest of 8F10 T cells remained at a comparable level in recipients given PBS or S961 (Fig. 1i, Supplementary Video 5), indicating that B:12-20 was independent of IR-mediated uptake of insulin. Therefore, this epitope must derive from insulin peptides reaching the peripheral lymphoid organs. Importantly, APCs expressing autoimmune regulator (Aire)15 were not a major source of insulin peptides (Extended Data Fig. 1l).
Insulin peptides were identified in beta-cell granules by peptide-specific monoclonal antibodies (MoAbs) and mass spectrometry analysis. The MoAb AIP reactive to B:9-23 was previously studied3,6, and a new MoAb (clone 6F3.B8) was generated by immunization with the entire insulin B-chain (B:1-30). The two MoAbs were not cross-reactive and neither recognized native insulin (Extended Data Fig. 2a–d). Notably, presentation of B:1-30 activated insulin-reactive T cells without the need of internal processing (Extended Data Fig. 2e).
We previously identified B:9-23 in a set of LAMP1-positive vesicles in beta-cells3. These vesicles were distinct from the insulin-containing dense core granules and could be separated from them by differential centrifugation6. They are compatible with the crinophagic-bodies that result from fusion of the dense core granules to lysosomes as a means to maintain cellular homeostasis16–18. Importantly, they contained peptides preferentially reactive to 8F10 T cells6. Immunofluorescent staining with AIP showed a punctate pattern of B:9-23 in beta-cells from NOD.Rag1−/− or B6g7.Rag1−/− mice (Fig. 2a). In contrast, the B:1-30 staining by 6F3.B8 was more diffuse in nearly all the beta-cells and costained with insulin (Fig. 2b). Using double immunogold-labelling antibodies, B:1-30 was detected in granules containing insulin (Fig. 2c). Many granules (106 out of 317, 33%) contained both B:1-30 and insulin (Fig. 2d), and the rest had insulin only (Fig. 2e). The AIP staining of islets was not satisfactory after labelling with immunogold.
Figure 2. Intrinsic generation of insulin peptides in beta-cell granules.

a, b, Immunofluorescence microscopy of isolated islets stained for B:9-23 (a) or B:1-30 (b), as well as CD11c and insulin. Data are representative of 50 islets per group in three independent experiments. c, Immunogold electron microscopy showing anti-B:1-30 (large gold) and anti-insulin (small gold) in a representative beta-cell. A representative granule that contains both B:1-30 and insulin (d) or insulin only (e) is depicted. The arrowhead in (d) denote the B:1-30 peptide. Data are representative of 317 granules analyzed in three independent experiments. f, Competitive ELISA showing quantification of insulin, B:1-30 and B:9-23 in granules isolated by 5,000 xG (5k) or 25,000 xG (25k) centrifugation; islets were from B6g7 mice. Each line represents one paired experiment using 4–8 mice. ns, not significant; *, P < 0.05, **, P < 0.01; two-tailed paired Student’s t-test. g, Peptide coverage of insulin B-chain by sequences identified in 25k (red) and 5k (blue) beta-cell granules using nLC-MS/MS analysis. Shown is the alignment of individual peptides (each line) with the insulin-2 B:1-30 segment. Data are from four independent analyses using islets from 8–10 1mice per strain. h, Log2 peak area showing the relative abundance of individual insulin B-chain peptides (purple) identified in the 25k and 5k granules among all the insulin peptides including the C-peptides (box). The dashed-line boxes denote B:1-30 with a high abundance.
The regular secretory granules obtained by 25,000 xG centrifugation (25k) contained significantly higher amounts of insulin than the 5,000 xG fraction (5k) representing the crinophagic-bodies (Fig. 2f). B:1-30 was primarily found in the 25k but not the 5k fraction, however, its concentration was about 10 times lower than that of insulin (Fig. 2f). In contrast, B:9-23 was significantly more abundant in the 5k granules (Fig. 2f).
The peptidome in the two sets of granules was analyzed by nanoflow liquid chromatography-tandem mass spectrometry (nLC-MS/MS) in B6g7, B6 and 3-week old female NOD mice. Consistent among all the three strains, the 25k granules mostly contained C-peptides, the intact B:1-30, and a few small peptides from the B-chain (Fig. 2g–h, Supplementary Table 1, Extended Data Fig. 3a). In striking contrast, the 5k granules besides C-peptides had more diverse short sequences covering the entire B-chain (Fig. 2g–h, Supplementary Table 1). Importantly, peptides relevant to the 9-23 region, such as B:9-23 and B:11-23 (Extended Data Fig. 3b), were exclusively identified in the 5k granules of all the three mouse strains. Manual interrogation of unassigned spectra only identified two putative hybrid peptides in the 5k granules (Extended Data Fig. 3c), a C-peptide- islet amyloid polypeptide (IAPP) fusion, and insulin-2 C-peptide N-terminus fused with the C-terminus of insulin-1 C-peptide. Peptides from other proteins were identified in much smaller amounts relative to insulin. These will be the subject of future analysis.
Examination of the two sets of beta-cell granules from human islets revealed a striking similarity of peptide segregation with mice (Extended Data Fig. 4a, Supplementary Table 1). The human 25k granules contained the intact B-chain and a limited number of short sequences. However, diverse short peptides were found in the 5k set, and a sequence representing B:11-30 (Extended Data Fig. 4b) contained the HLA-DQ8-binding B:11-23 determinant recognized by peripheral T cells in T1D subjects19.
Insulin was secreted from islets stimulated with 25 mM glucose (Fig. 3a), along with much lower concentrations of peptides reactive with 6F3.B8 (Fig. 3b) or AIP (Fig. 3c). Secretion of insulin or insulin peptides was not affected when complete protease inhibitors were used during glucose challenges (Extended Data Fig. 5a), indicating that the peptides were not generated extracellularly.
Figure 3. Secretion of insulin peptides into the circulation upon glucose stimulation.

a–c, Competitive ELISA showing quantification of insulin (a), B:1-30 (b) and B:9-23 (c) secreted from islets of B6g7 mice after stimulation with 2.5 mM or 25 mM glucose. Each point represents an independent experiment. ns, not significant; *, P < 0.05, **, P < 0.01; ***, P < 0.005; two-tailed paired Student’s t-test. d, A 10×10 dot plot representing the coverage of insulin peptide sequences identified by nLC-MS/MS in culture supernatants of islets stimulated with 25 mM glucose. Each dot represents 1% coverage of the total. e, Summary of selected insulin peptides containing defined immunogenic epitopes. The underlined epitopes include B:12-20 (red), B:13-21 (blue), B:15-23 (green), and A:14-20 (black). In B–C spanning peptides, the residues of the B-chain were in bold. f, Log2 peak area showing the relative abundance of individual B:9-23-associated peptides (blue), B–C spanning peptides (red) and the A:14-20 peptide (cyan) among all insulin peptides (box). g, The MS spectrum of a peptide sequence identified in mouse urine containing all residues of the insulin B:9-23 peptide with oxidation of the cysteine to cysteic acid (lower case c).
The insulin peptides released from beta-cells were characterized by nLC-MS/MS. Most sequences were derived from the C-peptide, along with B-chain-derived sequences relevant to the 9-23 region and spanning the B-chain/C-peptide (B-C) junction (Fig. 3d, Supplementary Table 2). Many of the peptides were identical or relevant to previously identified pathogenic epitopes using diabetogenic T cells as probes1,3,4,20–22 (Fig. 3e, Extended Data Fig. 5b–e). Strikingly, the intact B-chain shared identical sequences with those identified in the 25k granules, whereas B:9-23 and B:11-23 were identical to those in the 5k granules (Fig. 3e, Supplementary Table 2). Synthetic versions of B:9-23-associated peptides activated both B:12-20- and B:13-21-reactive T cells (Extended Data Fig. 6). Overall, these peptides with potential immunogenicity showed a low relative abundance (Fig. 3f, Supplementary Table 2).
Using an antibody capture approach, we identified B:9-23 with oxidized cysteine to cysteic acid in the urine (Fig. 3g), a modification which can occur during sample preparation (Extended Data Fig. 7a). This finding indicates the presence of B:9-23 in the circulation. Indeed, fluorochrome-labelled B:9-23 upon intravenous injection was rapidly displayed by I-Ag7-expressing APCs in the spleen but not thymus (Extended Data Fig. 7b–c).
The widespread presentation of insulin peptides in lymphoid tissues influenced the biology of the T cells. We generated a bone marrow (BM) chimera model in which a low number of BM stem cells from CD45.2 8F10 mice deficient with T-cell receptor alpha chain (8F10TCRα−/−) were transferred into non-lethally irradiated NOD or B16A hosts (CD45.1) (Fig. 4a). This approach resulted in the development of a limited number of 8F10 T cells (0.5–2%) within the endogenous CD4 T-cell repertoire (Extended Data Fig. 8a). The 8F10 T cells were then isolated from iLNs of either host and subjected to RNA sequencing (RNAseq) (Fig. 4a).
Figure 4. Acquisition of an effector-like phenotype by 8F10 T cells during antigen recognition.

a, The scheme of the experimental design for b–f. b, Pearson’s correlation matrix showing hierarchical clustering of the 8F10-NOD and 8F10-B16A T cell RNAseq samples. c, GSEA enrichment plots showing a significant correlation (determined by false discovery rate [FDR] q < 0.05) of genes upregulated in the 8F10-NOD samples with four Hallmark datasets associated with metabolism pathways. d, GSEA enrichment plots showing a significant correlation of genes upregulated in the 8F10-NOD samples with three immunological signature datasets depicting T cell activation and effector function. e, A Venn diagram showing the number of overlapping genes of three gene sets in (d). f, Diabetes incidence of NOD.Rag1−/− recipients adoptively transferred with 8F10 T cells isolated from the iLNs of NOD or B16A mice 6 weeks after BM chimera. **, P < 0.005; log-rank test. Data represent cumulative results of three independent transfers.
A difference in the transcriptomes of 8F10 T cells sourced from the NOD (8F10-NOD) or B16A (8F10-B16A) hosts was revealed by hierarchical clustering using Pearson’s correlation (Fig. 4b). Gene set enrichment analysis (GSEA) showed a significant correlation of transcripts upregulated in the 8F10-NOD T cells with biological pathways involving oxidative phosphorylation (OXPHOS), Myc targets, fatty acid metabolism, mTOR complex 1 (mTORC1) signaling, and DNA repair (Extended Data Fig. 8b). Remarkably, the four top-ranked gene sets (Fig. 4c) were metabolic pathways involving transcripts encoding key kinases, intermediates, and transcriptional factors (Extended Data Fig. 8c) shown to support T cell proliferation and functions23.
The metabolic reprogramming in 8F10-NOD T cells was associated with an effector-like phenotype (Fig. 4d). The sets of 8F10-NOD-upregulated genes were those reported to be highly expressed in CD4 T cells upon stimulation24, or in CD8 T cells at the peak of expansion versus the contraction phase25, or in CD8 effectors versus exhaustion26. The transcripts enriched in the three pathways (Extended Data Fig 9a) displayed little overlapping (Fig. 4e). By GSEA, neither T cell set correlated with anergic CD427 or tolerant CD8 T cells28 (Extended Data Fig. 9b).
Functional analysis at the 6-week time point revealed a higher capacity of effector cytokine (TNFα and IFNγ) production (Extended Data Fig. 10a) and cell proliferation (Extended Data Fig. 10b) in 8F10-NOD T cells. Neither T cell set expressed molecules associated with anergy and exhaustion26,27,29 (Extended Data Fig. 10c). These results were consistent in T cells analyzed 9 weeks after BM chimera (Extended Data Fig. 10d–f). Importantly, when the two sets of T cells were transferred into NOD.Rag1−/− recipients, diabetes onset was accelerated by the 8F10-NOD set (Fig. 4f). Therefore, 8F10 T cells acquired an effector-like phenotype during peripheral antigen recognition, supported by transcriptional reprogramming and superior diabetogenicity.
In summary, peptide exocytosis is a natural response of beta-cells and represents a mechanism of communication between the islets, an organ lacking lymphatics, and the lymphoid tissues. It may apply to other endocrine organs that also contain crinophagic granules. The released peptides may permit a more targeted identification of the T cell responses; a repertoire that may be extensive given the different exocytosed moieties. Previous studies have shown that ablation of all LNs eradicated the pathogenic T cell repertoire and abolished diabetes30, emphasizing the importance of the entire lymphatic system in the interactions with T cells. Finally, to note, the biological outcomes depicted here with 8F10 T cells may vary with other insulin-reactive T cells with divergent TCR affinities. Comprehensive understanding requires an analysis of the entire insulin-reactive T cell pool at different stages of the disease.
Methods
Mice
NOD/ShiLtJ (NOD), NOD.129S7(B6)-Rag1tm1Mom/J (NOD.Rag1−/−), NOD.Cg-Tg(Ins2*Y16A)1EllIns1tm1JjaIns2tm1Jja/GseJ (NOD.B16A), NOD.Cg-Tg(TcraTcrbNY8.3)1Pesa/DvsJ (8.3), NOD.129S2(B6)-Ighmtm1Cgn/DoiJ (μMT), NOD.C-(Ptprc-D1Mit262)/WehiJ (NOD.CD45.2), NOD.B10Sn-H2b/J (NOD.H2b) and B6.NOD-(D17Mit21-D17Mit10)/LtJ (B6g7) mice were originally obtained from the Jackson Laboratory. NOD.10E11 TCR transgenic mice (TCRα: TRAV5D-4/TRAJ42; TCRβ: TRBV13-3/TRBD2/TRBJ2-7) were generated using a previous protocol5. NOD.4F7 TCR transgenic mice, NOD.Aire−/−, and NOD.TCRα−/− mice were generated by one of us (M.S.A). The 8F10 or 10E11 mice expressing the CD45.2 allotype were generated by intercrossing the original TCR transgenic line (CD45.1) with the NOD.CD45.2 mice and the CD45.2.NOD.8F10 mice were further crossed with the NOD.TCRα−/− mice for generating the CD45.2 8F10TCRα−/− mice. B6.Rag1−/− mice were used to intercross with B6g7 mice to generate B6g7.Rag1−/− mice. All the mice were bred and maintained under specific pathogen-free conditions in our animal facility. All experiments were approved by the Division of Comparative Medicine of Washington University School of Medicine in St. Louis (Accreditation number A3381-01).
Human pancreatic islets
De-identified human primary islets isolated from deceased donors were obtained from Prodo Laboratories. Experiments were determined to be Not Human Subject Research by Washington University Human Research Protection Office (IRB ID # 201801183; Federalwide Assurance #FWA00002284). In total, islets from three donors were used: Donor 1 (Female, 57 years, BMI 21.35), Donor 2 (Female, 49 years, BMI 33), Donor 3 (Male, 28 years, BMI 34.7). Purity of the islets was between 85~98%. Islets were cultured in CMRL media supplemented with 10% FBS and 50% L-cell conditioned media31 for recovery. The granules were isolated from ~1500 islets after 1–3 days of culture.
Antibodies
The following fluorescently conjugated antibodies were purchased from BioLegend: anti-B220 (RA3-6B2), anti-CD11c (N418), anti-CD4 (RM4-5), anti-CD45 (30-F11), anti-CD45.1 (A20), anti-CD45.2 (104), anti-CD8a (53-6.7), anti-F4/80 (BM8), anti-Vβ8.1/8.2 (KJ16-133.18), anti-CD44 (IM7), anti-CD62L (MEL-14), anti-CD25 (PC61.5) and anti-TNFα (MP6-XT22). Unconjugated or Alexa Fluor 647-labelled Rabbit anti-insulin MoAb (C27C9) was purchased from Cell Signaling Technology. Unconjugated mouse anti-insulin MoAb (E11D7) was purchased from Millipore. Alexa Fluor 594 F(ab)2 donkey anti-mouse IgG and HRP-conjugated goat anti-mouse IgG (Fcγ portion specific) were purchased from Jackson ImmunoResearch.
Flow cytometry and cell sorting
Flow cytometry analysis was done as previously described7. The samples were examined using a FACSCanto II (BD Biosciences) and the data were analyzed using FlowJo software (Tree Star Software). CD4+ T cells from iLNs were enriched by CD4+ T cell isolation kit (Miltenyi Biotech), the 8F10 T cells were sorted as CD45.2+CD45.1−CD4+CD8−B220−CD11c− using FACSAria II (BD Biosciences).
CFSE and CMTMR labelling
For two-photon imaging, naïve CD4 T cells were purified by two rounds of MACS negative selection using the naïve CD4+ T cell isolation kit (Miltenyi Biotech) to remove non-CD4 and CD44+ T cells. The CD25+ cells were further removed from the flow-through portion using the CD25 microbead kit (Miltenyi Biotech). The naive 8.3 or WT CD8 T cells were purified similarly by using the naïve CD8+ T cell isolation kit. Flow Cytometry analysis confirmed that >95% of the cells were CD4+/CD8+CD25−CD62LhiCD44−. CFSE or CMTMR labelling was performed using the Vybrant CFDA SE Cell Tracer Kit and the CellTracker Orange CMTMR Dye (both from ThermoFisher Scientific), respectively. In brief, T cells (107/ml in PBS) were incubated with 10 μM CFSE or 8 μM CMTMR for 25 min at 37°C with a gentle shake after 10 min. Under these conditions, T cells were labelled with satisfactory intensities without significant cell death. Ice-cold PBS was then added to quench the labelling.
Adoptive transfer
CFSE- or CMTMR-labeled T cells were 1:1 mixed and were injected intravenously. For all the two-photon experiments, 2×10⁶ T cells with either label were transferred. Varying T cell numbers in preliminary experiments determined that this amount resulted in a stable 0.5~0.8% reconstitution of the transferred T cells in the endogenous CD4 T cell pool, which was sufficient for two-photon imaging without causing obvious intraclonal competition. All the recipient mice were 3–4-week-old female mice unless otherwise mentioned. For experiments in Fig. 4f, FACS-sorted 8F10 T cells from pooled iLNs of 8–10 NOD or B16A mice were adoptively transferred i.v. into 4–6-week old NOD.Rag1−/− recipients (105 cells per mouse).
Two-photon imaging
LNs were removed, attached to coverslips, placed in CO2-independent media (Gibco) at RT and immediately imaged in a perfusion chamber to simulate blood flow (36.5°C DMEM medium; 95% O2 and 5% CO2). Two-photon microscopy images were collected using a customized Leica SP8 Two-Photon Microscope (Leica Microsystems) equipped with a 25x and 0.95 numerical aperture water-immersion objective and a Mai Tai HP DeepSee Laser (Spectra-Physics) tuned to 840 nm. Fluorescence emission was guided directly to external hybrid photodetectors (Leica/Hammamatsu). For signal separation, we used three separate dichroic beam splitters without bandpass filters (Semrock): 484-nm edge BrightLine (FF484-FDi01), 495-nm edge BrightLine (FF495-Di03), and 560-nm edge BrightLine (FF560-Di01). The mirrors were arranged in dendritic fashion. Stacks were collected with 2.5 microns between images with 25–30 images per stack.
For cell tracking, two or three regions of one LN were randomly selected and cropped. Cells were tracked manually in 3D volume using Imaris 8.41 software (Bitplane). We tracked the first 11 time points from each track (representing 5 min and 10 velocities between the time points). Each dot represents the mean velocity out of the 10 that were tracked. We also calculated the meandering index and the motility coefficient for each track. Note that we chose tracks with the same length since the track length impacts these last two parameters. The meandering index and the motility coefficient data are not shown for space reasons however the results amply confirm the velocity data. The mean track velocities (μm/min) were calculated for individual tracks as previously described11.
Surgical removal of pancreatic lymph nodes
NOD mice (3-week old) were anesthetized with a 4% mixture of Isoflurane in oxygen. The two pLNs were exposed by gently retracting the spleen, pancreas, stomach, and intestines, and were grasped with blunt forceps. Using an ophthalmic cautery on low power, the blood vessels on either side of the pLNs were cauterized and the pLNs were removed. The sham surgery was performed with the same procedures except that the pLNs were exposed without removal.
S961 administration
The S961 peptide (sequence: GSLDESFYDWFERQLGGGSGGSSLEEEWAQIQCEVWGRGCPSY) was synthesized by LifeTein, LLC, with an intrachain disulphide bridge between Cys33 and Cys40 (underlined). S961 (20 nMol/week) or control PBS was filled into the Alzet osmotic pump (2001 model, Durect) and inserted subcutaneously at the back of anaesthetized mice through an incision between scapula. Blood glucose levels were monitored twice a day (Chemstrip 2GP; Roche); the mice with a level above 250 mg/dl for two consecutive measurements were considered diabetic.
Competitive ELISA assay
96-well ELISA plates were coated with human insulin solution (1 μg/well) or peptides B:1-30 or B:9-23 (2 μM), and were blocked with 3% BSA overnight at 4°C. Soluble competitive inhibitors, including different synthetic peptides and biological samples, were pre-incubated with the E11D7 (100 ng/ml), 6F3.B8 (20 ng/ml), or AIP (4 ng/ml) MoAbs for 30 min and the mixture was then added to the plate-bound antigens for 1h at room temperature. In the absence of soluble competitive inhibitors, these concentrations of the MoAbs resulted in about a 50% binding to the plate-bound antigens. HRP-conjugated goat anti-mouse IgG (1:10000) antibody was then added for 1h; the responses were developed using the OptEIA TMB Substrate (BD). The data (O.D at 450 nm) were collected using an iMark Microplate Reader (Bio-Rad Laboratories). For quantitating the biological samples, each experiment was paired with a standard curve in which serially diluted amounts of soluble antigens were used to suppress the binding of their cognate MoAbs to the same antigen in the plate-bound form. The degree of inhibition by the biological samples was calculated relative to the blocking curve used by the specific antigen using an equation generated by linear regression of the standard curve.
Immunofluorescence microscopy
Mouse islets were isolated as previously described7. The islets were blocked with normal goat serum, fixed with 4% methanol-free formaldehyde, permeabilized with 0.2% saponin (Sigma), and stained with the AIP or 6F3.B8 (50 μg/ml) for 45 min on ice. The samples were then stained with Alexa Fluor 594 F(ab)2 donkey anti-mouse IgG (30 μg/ml), Alexa Fluor 647 Rabbit anti-insulin (20 μg/ml), and Alexa Fluor 488 anti-mouse CD11c (40 μg/ml) for 45 min on ice and mounted using the Prolong Diamond mountant (ThermoFisher). The samples were viewed using the Eclipse E800 microscope (Nikon) equipped with the EXi Blue fluorescence camera (Qimaging).
Electron microscopy with Immunogold
Islets were fixed in 4% paraformaldehyde (Polysciences) in 100mM PIPES/0.5mM MgCl2, pH 7.2 for 1h at 4°C. Samples were embedded in 10% gelatin and infiltrated overnight with 2.3M sucrose/20% polyvinyl pyrrolidone in PIPES/MgCl2 at 4°C. Ultrathin sections of 50 nm were incubated with a blocking solution supplemented with 5% FBS and 5% normal goat serum for 30 min and subsequently incubated with rabbit anti-insulin (C27C9) and mouse anti-B-chain (6F3.B8) antibodies for 1h at RT. Sections were subsequently incubated with goat anti-mouse IgG conjugated to 18nm colloidal gold and goat anti-rabbit IgG antibody conjugated to 12 nm colloidal gold for 1h. Sections were stained with uranyl acetate and lead citrate and viewed on a JEOL 1200 EX transmission electron microscope (JEOL USA Inc) equipped with an AMT 8-megapixel digital camera and AMT Image Capture Engine V602 software (Advanced Microscopy Techniques). All labelling experiments were conducted in parallel with controls omitting the primary antibody. These controls were consistently negative.
Insulin secretion assay
Islets were equilibrated in DMEM media supplemented with 10% FBS and 5.5 mM glucose for 24h in 24-well plates. The media were then replaced with 300 μl pre-warmed Krebs-Ringer-HEPES balance solution containing 0.2% BSA with 2.5 mM or 25 mM glucose. After 1h incubation, the culture supernatants were collected for the competitive ELISA assay or mass spectrometry analysis.
Beta-cell granule isolation
Mouse and human islets were dispersed using the non-enzymatic dispersion solution (Sigma). Cells were resuspended in PBS and lysed by passing them through a Cell Homogenizer (Isobiotec). The lysate was centrifuged twice for 10 min at 500 xG, 4°C to pellet cell debris. The supernatant was centrifuged for 10 min at 5000 xG, 4°C. The 5000 xG spin was repeated on the supernatant and the two pellets were combined. This fraction is highly enriched in peptide-containing vesicles compatible with the crinophagic-bodies, and as such have been labelled. This fraction may also contain other organelles except for the insulin-containing ones. The supernatant after the 5000 xG spin was centrifuged for 30 min at 25000 xG, 4°C to pellet secretory granules. This supernatant was discarded, and the 25000 xG pellet was suspended in 100 ul PBS. The micro-centrifuge used for the granule isolation was an Eppendorf 5417R (Eppendorf) utilizing an FA45-24-11 fixed angle rotor. Fractions were frozen at −80°C and thawed at 37°C for five cycles to release the contents of granules. After freeze/thaw, complete protease inhibitor cocktail was added to the sample which then was concentrated by speed-Vac to <100ul. The sample was passed through C18 zip-tips (Pierce) and peptides then were eluted in 0.1% formic acid/95% acetonitrile and then dried with a Speed-Vac.
Sample preparation for mass spectrometry analysis
All the biological samples were treated with 2.5% trifluoroacetic acid (TFA) for a final concentration of 0.36% (v/v), and the peptides were purified using the C18 zip-tips, eluted with 0.1% formic acid in 95% acetonitrile, and lyophilized. For peptide capture, TFA adjusted mouse urine (12 ml) was cleaned up using C18 Sep-Pak cartridges (Waters). The analytes retained by the cartridge sorbent were eluted with methanol, lyophilized, and reconstituted with 2 ml sterile PBS. The material was then incubated with a 1:1 mixture of sepharose pre-conjugated with AIP or 6F3.B8 MoAbs (1 ml slurry total) for 72h at 4 °C with gentle rotation. The urine/sepharose mixture was poured into a Bio-Rad Econo column and after extensive wash, the antibody-bound material was eluted with 10% acetic acid and lyophilized.
Mass Spectrometry
A Dionex UltiMate 1000 system (Thermo Scientific) was coupled to an Orbitrap Fusion Lumos (Thermo Scientific) through an Easy-Spray ion source (Thermo Scientific). Peptide samples were loaded (30 μL/min, 1 min) onto a trap column (100 μm × 2 cm, 5 μm Acclaim PepMap 100 C18, 50 °C), eluted (300 μL/min) onto an Easy-Spray PepMap RSLC C18 column (2 μm, 25cm × 75 μm ID, 50 °C, Thermo Scientific) and separated with the following gradient, all % Buffer B (0.1% formic acid in ACN): 0–40 min, 2%–22%; 40–50 min, 22%–35%; 50–60 min, 35–95%; 60–70 min, isocratic at 95%; 70–71 min, 95%–2%, 71–85 min, isocratic at 2%. Spray voltage was 1900V, ion transfer tube temperature was 275°C, and RF lens was 30%. MS scans were acquired in profile mode and MS/MS scans in centroid mode, for ions with charge states 2–7, with a cycle time of 3 sec. For HCD, MS spectra were recorded from 375–1500 Da at 120K resolution (at m/z 200), and MS/MS was triggered above a threshold of 2.5e4, with quadrupole isolation (1.6 Da) at 30K resolution, and collision energy (CE) of 30%. Dynamic exclusion was used (35 s). For high SA EThcD, MS spectra were acquired from 350–1500 Da at 60K resolution, and MS/MS spectra were triggered for ions above a threshold of 5e4 with quadrupole isolation (0.7 Da) at 15K resolution. Fragmentation employed calibrated charge dependent ETD, with SA (40%) applied in the HCD cell. Dynamic exclusion was used (60 s). For low SA EThcD, MS spectra were recorded from 375–1500 Da at 120K resolution (at m/z 200), and MS/MS spectra were acquired for ions above a minimum intensity threshold of 2.5e4 at 15K resolution. ETD reaction time was fixed at 100 ms, with SA (15%) applied in the HCD collision cell.
MS Data Analysis
Data files were uploaded to PEAKS 8.0 (Bioinformatics Solutions) for processing, de novo sequencing and database searching. Resulting sequences were searched against the UniProt Mouse Proteome database (downloaded 6/8/2017; 25,144 entries) with mass error tolerances of 20 ppm and 0.02 Da for parent and fragment, respectively, no enzyme specificity and no fixed or variable modifications. The Common Repository for Adventitious Proteins database (cRAP, www.thegpm.org/crap/) was used to identify contaminant proteins. FDR estimation was enabled. Peptides were filtered for 10logP ≥ 20, and proteins were filtered for −10logP ≥ 30 and one unique peptide. For all experiments, this gave an FDR of <1% at the peptide-spectrum match level. Peptides matching to insulin-1 and insulin-2 were manually verified by visual inspection. For relative quantification, peak areas for all manually verified peptides were exported from PEAKS, normalized to the total ion current, and log2 transformed.
T cell stimulation and antigen presentation assay
In Extended Data Fig 1i, ConA-stimulated peritoneal macrophages were treated with 0.2 or 1 μM S961 for 1h at 37°C and were then cultured with the IIT-3 T cell hybridoma that recognizes the 13-21 peptide, in the presence of serially diluted insulin (I9278; Sigma). In Extended Data Fig. 2e, C3g7 cells were treated with chloroquine for 2h at 37°C, washed, pulsed with the antigens, and cultured with T cell hybridomas. After incubation for 18h, the culture supernatants were assayed for IL-2 production.
Bone marrow chimera
The female donor 8F10.TCRα−/− (CD45.2) mice were injected i.p with Fluorouracil (200 mg/Kg), and the bone marrow cells were isolated from the femur and tibia on day 5. The cells were adoptively transferred into sublethally irradiated (600 rads) 3-week old female NOD or B16A hosts (104/mouse).
RNAseq analysis
Total RNA was isolated using the Ambion RNAqueous-Micro kit (Thermo Fisher Scientific). RNAseq library preparation and sequencing was performed as previously described32. The differential expression analysis was done with the DESeq2 package (version 1.18.1) The multifactor analysis was used to account for donor effect. Specifically, paired 8F10-NOD and 8F10-B16A samples from one isolation (4 pairs in total) were treated as one donor group. Gene set enrichment pathways analysis was done using the Broad Institute’s GSEA software and MSigDB Hallmark or C7 immunological signatures databases. The latter included datasets: GSE2872624, GSE1000001_1577_200_UP25, GSE965026, and GSE3202528. All heat maps are in log2 scale. The gene expression matrix counts were adjusted for donor effect with Combat (sva package) only for heat maps and clustering.
Statistics
The one-way ANOVA with Sidak’s multiple comparisons test was used to determine significant differences among multiple groups with unpaired biological replicates. The two-tailed unpaired Student’s t-test was used to determine significant differences between two groups with unpaired biological replicates. The two-tailed paired Student’s t-test was used to calculate P values of each paired independent experiments. The log-rank test was used to determine the significant difference of diabetes incidence.
Data availability
The RNAseq data have been deposited in the Gene Expression Omnibus under accession number GSE114824. The mass spectrometry proteomics data have been deposited to the ProteomeXchange Consortium via the PRIDE partner repository with the dataset identifier PXD009919 and 10.6019/PXD009919.
Extended Data
Extended Data Figure 1. Probing peripheral antigen presentation by two-photon imaging.

The Figure contains further information of the motility assay. a, Representative 3D reconstructions of two-photon z-stacks visualizing CFSE-labelled anti-HEL 10E11 TCR transgenic and CMTMR-labelled WT CD4 T cells in an iLN explant on day 3 post transfer. The dashed-line box depicts a region in which individual T cells were tracked. This region is magnified in panels (right) showing the T cell movement over a 7.5-min time interval, and the quantification was performed over a 5-min interval. The cyan and purple tracks denote 10E11 and WT T cells, respectively. Mice were injected with 10 μg HEL. b, NOD mice (CD45.1) were injected i.p with indicated amounts of HEL, and 6h later, naïve CFSE-labelled 10E11 (CD45.2) T cells were transferred. On day 3, CFSE dilution of the transferred T cells (CD45.2+CD45.1−CD4+Vβ8.1/8.2+) in the iLNs was measured by flow cytometry. Data are representative of two independent experiments. c, Mean track velocities (μm/min) of 8F10 and WT CD4 T cells in iLNs from NOD recipients on day 1 or day 5 post transfer. d, CFSE-8F10 plus CMTMR-WT or CMTMR-8F10 plus CFSE-WT T cells were separately transferred into two cohorts of NOD recipients, and their mean track velocities in iLNs on day 3 were compared in paired two-photon imaging analysis. e, Mean track velocities of 8F10 and WT CD4 T cells in NOD.μMT or NOD.Batf3−/− recipients on day 3 post transfer. f, Mean track velocities of 8F10 and 10E11 T cells in NOD.H2b recipients 24 h post transfer. g, h, Mean track velocities of 4F7 and WT CD4 (g) or 8.3 and WT CD8 (h) T cells in NOD recipients on day 3 post transfer. i, Response (mean ± s.e.m) of the B:13-21-specific IIT-3 T cells to ConA-activated peritoneal macrophages treated with or without S961 prior to insulin pulse. j, Blood glucose levels (mean ± s.e.m) of 3-week old NOD mice infused with S961 or PBS via osmotic pumps. k, The scheme of the experiments in Fig. 1h and i. l, Mean track velocities of 8F10 and WT CD4 T cells in iLNs of Aire−/− recipients. Data summarize two (c, d, f, l) or three (e, g, h) independent experiments. Each dot represents individual T cell tracks, and the bar denotes the mean. ns, not significant; ****, P < 0.0001; one-way ANOVA with Sidak’s multiple comparisons test (c, d, g, h) or two-tailed unpaired Student’s t-test (e, f, l).
Extended Data Figure 2. Analysis of insulin peptide-specific monoclonal antibodies and presentation of the intact B-chain.

a–c, Competitive ELISA responses depicting the binding of the anti-insulin MoAb (E11D7) to plate-bound insulin (a), anti-B:9-23 MoAb (AIP) to plate-bound B:9-23 (b), and anti-B:1-30 MoAb (6F3.B8) to plate-bound B:1-30 (c) in the presence of serially-diluted amounts of the indicated soluble antigens as a competitive inhibitor. The inhibition by a specific soluble antigen indicates the specificity of the MoAb to this antigen. d, Competitive ELISA responses depicting the binding of 6F3.B8 to plate-bound B:1-30 in the presence of soluble unmodified B:1-30 or B:1-30 in which the two cysteines were changed into serines (B:1-30 C to S). The results indicate the intrachain between the two cysteines does not influence the specificity of the 6F3.B8 MoAb. Data (mean) are representative of two independent experiments. e, Responses of the B:13-21-specific IIT-3 (left) or the B:12-20-specific 9B9 (right) T cell hybridoma to C3g7 APCs treated with or without 100 μM chloroquine for 2h and pulsed with indicated antigens after extensive wash. The C3g7 cell is a B cell lymphoma line expressing I-Ag7 used as APCs. The results of the effects of chloroquine indicate that reactivity to insulin, but neither to B:9-23 nor B:1-30 require internal processing. Data (mean ± s.e.m) are representative of two independent experiments.
Extended Data Figure 3. nLC-MS/MS analysis of mouse beta-cell granules.

a, MS spectra of mouse insulin-1 B:1-30 with intramolecular disulphide bonds (left) and mouse insulin-2 B:1-30 with oxidized methionine on the 29th position (right). b, MS spectra of mouse insulin B:9-23 (left) and B:11-23 (right) which were exclusively identified in the 5k granules of B6g7, B6 and NOD mice. c, MS spectra of two hybrid peptides identified in the 5k granules. The sequence (EVEDTPVRSGSNPQM, left) represents a C-peptide (underlined)-islet amyloid polypeptide (IAPP) fusion, and the sequence (EVEDPQVAEVARQ, right) represents a fusion of insulin-2 C-peptide N-terminus (underlined) with the C-terminus of insulin-1 C-peptide.
Extended Data Figure 4. nLC-MS/MS analysis of human beta-cell granules.

a, Peptide coverage of insulin B-chain identified in human 25k (red) and 5k (blue) beta-cell granules using nLC-MS/MS analysis. Shown is the alignment o1f individual peptides (each line) with the human insulin B:1-30 segment. Data summarizes results from four independent runs using human islets from three individual donors. b, An MS spectrum showing a sequence representing human insulin B:11-30 identified in the 5k granules. The cysteinylation on the 19th position is noted.
Extended Data Figure 5. Analysis of insulin peptides secreted from islets upon glucose challenge.

a, Insulin secretion assay was performed as described in Fig. 3a–c, except that the Complete Protease Inhibitor cocktail (Sigma) was added during the 25 mM glucose challenge. The supernatants were then collected for the competitive ELISA assay. Data (mean ± s.e.m) are from two independent experiments. b, MS spectra of four secreted peptides that contain the B:12-20 and/or B:13-21 epitope as listed in Fig. 3e. Secreted B:1-30 sequences are identical to those in Extended Data Fig. 3a, and B:9-23 and B:11-23 share identical sequences with those in Extended Data Fig. 3b. c, An MS spectrum of the secreted insulin B:15-23 MHC-I (Kd)-binding peptide. d, An MS spectrum of the secreted insulin A:14-20 MHC-I (Db)-binding peptide. e, An MS spectrum showing a representative B-C spanning peptide (B25-C23).
Extended Data Figure 6. T cell responses to B:9-23-associated peptides.

Responses (mean ± s.e.m) of three insulin-reactive T cell hybridomas to insulin peptides associated with the 9-23 region of the B-chain as identified in Fig. 3e. The C3g7 cells were used as APCs.
Extended Data Figure 7. Characterization of circulating B:9-23 and its localization into lymphoid organs.

a, Unmodified synthetic B:9-23 (3 pmoles) was spiked into 1 ml PBS, purified by C18 tips, lyophilized, and analyzed by nLC-MS/MS. The data show the appearance of unmodified B:9-23 (left) together with oxidation of the cysteine on the 19th position to cysteic acid (right). b,c, Alexa Fluor 488-conjugated B:9-23 peptide (100 μg) was injected intravenously into 4-week old B6, B6g7 and NOD mice. 1h later, the spleens and thymi were harvested, digested by liberase and DNase, and the binding to splenic and thymic APCs was measured by flow cytometry. b, Representative FACS plots showing the binding of B:9-23 to splenic XCR1+ and Sirpα+ DC subsets as well as the B cells (upper). The bar graph summarizes cumulative results from individual mice (each point) pooled from three independent experiments. ns, not significant; **, P < 0.05; ***, P < 0.01; ****, P < 0.005, two-tailed unpaired Student’s t-test. c, Representative FACS plots showing the binding of B:9-23 to thymic XCR1+ and Sirpα+ DC subsets as well as to the CD45− cells expressing MHCII. Data (mean ± S.D) were calculated using five individual mice per strain from two independent experiments.
Extended Data Figure 8. RNAseq analysis of 8F10 T cells developed in NOD or B16A hosts.

a, Representative FACS plots (upper) showing the sorting strategy and the level of recovery of the 8F10 T cells from iLNs of NOD or B16A recipient mice 6 weeks post BM chimera. The scatter plot (lower) shows the percentage of recovered 8F10 T cells among total CD4 T cells from four independent experiments. ns, not significant; two-tailed paired Student’s t-test. b, Biological pathways that are significantly enriched in the 8F10-NOD versus 8F10-B16A samples using GSEA and Hallmark database. c, Heatmaps of all the enriched genes in individual metabolism pathways depicted in Fig. 4c.
Extended Data Figure 9. 8F10 T cells exhibit an effector but not anergy or exhaustion phenotype at the transcription level during peripheral antigen recognition.

a, Heat maps showing all the enriched genes of the three immunological pathways illustrated in Fig. 4d. b, Enrichment plots of GSEA performed on differentially expressed genes in 8F10 T cells from NOD-iLN versus B16A-iLN condition using datasets characterizing CD4 T cell anergy and CD8 T cell tolerance.
Extended Data Figure 10. Functional analysis of 8F10 T cells developed in NOD or B16A hosts.

BM chimera was constructed as in Fig. 4a, and the T cells were examined after 6 (a-c) or 9 (d-f) weeks. (a, b, d, e) Bulk CD4+ T cells were purified from iLNs of individual NOD or B16A mice (3/group) by two rounds of MACS negative selection. For examining cytokine repertoire (a, d), half of the individual T cell samples were combined. The rest were kept as individual samples, labelled with CFSE (1.5 μM), and used for measuring cell proliferation (b, e). In either case, T cells were mixed with NOD.Rag1−/− splenocytes (1:2 ratio) and stimulated with B:9-23 for 16 (a, d) or 72 (b, e) hours. a, Representative FACS plots showing intracellular cytokine staining of the 8F10 T cells from NOD-iLN or B16A-iLN, after stimulation with B:9-23 for 16h (Brefeldin A was added for the last 4h). Production of IL-4, IL-17A, IL-5, and IL-10 was not detected. Data are representative of two independent experiments with 3 mice combined per experiment. b, Representative FACS plots (upper) showing CFSE dilution of the 8F10 T cells stimulated by B:9-23 or the control HEL11-25 peptide for 72h. The results of 6 individual mice from 2 independent experiments were summarized in the Box and whiskers plot (lower). **, P < 0.01, two-tailed unpaired Student’s t-test. c, Representative FACS plots showing ex vivo surface staining of FR4 and CD73 as well as CD39 and TIGIT on endogenous CD4+ or 8F10 T cells in the iLNs of NOD or B16A mice. Data are representative of three individual mice analyzed in two independent experiments. d–f, Experiments were performed in week 9 following the procedures described in a–c. The data (d–f) are from a single experiment.
Supplementary Material
Acknowledgments
We thank Javier Carrero, Andrey Shaw and Fumihiko Urano for critical support and review of the work. We also acknowledge Brian Saunders, Wandy Beatty, Hao Hu and Katherine Fredericks for technical assistance. This work was supported by National Institutes of Health grants DK058177 and AI14551. The laboratory also received generous support from the Kilo Diabetes & Vascular Research Foundation.
Footnotes
Author Contributions X.W. and E.R.U. conceived the project, designed the experiments and analyzed the results. B.H.Z. and X.W. performed two-photon microscopy and analyzed the data. A.N.V. and X.W. prepared samples for mass spectrometry. C.F.L performed the nLC-MS/MS studies and analyzed the data. A.N.V. generated monoclonal antibodies and isolated beta-cell granules. X.W. and A.N.V performed cell biology experiments. P.N.Z. and X.W. analyzed the RNAseq data. M.S.A., R.T. and L.S. provided key reagents and interpreted the results. X.W., C.F.L. and E.R.U. wrote the manuscript.
The authors declare no competing financial interests.
References
- 1.Nakayama M, et al. Prime role for an insulin epitope in the development of type 1 diabetes in NOD mice. Nature. 2005;435:220–223. doi: 10.1038/nature03523. [DOI] [PMC free article] [PubMed] [Google Scholar]
- 2.Unanue ER. Antigen presentation in the autoimmune diabetes of the NOD mouse. Annu Rev Immunol. 2014;32:579–608. doi: 10.1146/annurev-immunol-032712-095941. [DOI] [PubMed] [Google Scholar]
- 3.Mohan JF, et al. Unique autoreactive T cells recognize insulin peptides generated within the islets of Langerhans in autoimmune diabetes. Nat Immunol. 2010;11:350–354. doi: 10.1038/ni.1850. [DOI] [PMC free article] [PubMed] [Google Scholar]
- 4.Mohan JF, Petzold SJ, Unanue ER. Register shifting of an insulin peptide-MHC complex allows diabetogenic T cells to escape thymic deletion. J Exp Med. 2011;208:2375–2383. doi: 10.1084/jem.20111502. [DOI] [PMC free article] [PubMed] [Google Scholar]
- 5.Mohan JF, Calderon B, Anderson MS, Unanue ER. Pathogenic CD4+ T cells recognizing an unstable peptide of insulin are directly recruited into islets bypassing local lymph nodes. J Exp Med. 2013;210:2403–2414. doi: 10.1084/jem.20130582. [DOI] [PMC free article] [PubMed] [Google Scholar]
- 6.Vomund AN, et al. Beta cells transfer vesicles containing insulin to phagocytes for presentation to T cells. Proc Natl Acad Sci USA. 2015;112:E5496–5502. doi: 10.1073/pnas.1515954112. [DOI] [PMC free article] [PubMed] [Google Scholar]
- 7.Wan X, Thomas JW, Unanue ER. Class-switched anti-insulin antibodies originate from unconventional antigen presentation in multiple lymphoid sites. J Exp Med. 2016;213:967–978. doi: 10.1084/jem.20151869. [DOI] [PMC free article] [PubMed] [Google Scholar]
- 8.Wan X, Unanue ER. Unique features in the presentation of insulin epitopes in autoimmune diabetes: an update. Curr Opin Immunol. 2017;46:30–37. doi: 10.1016/j.coi.2017.04.001. [DOI] [PubMed] [Google Scholar]
- 9.Egen JG, et al. Intravital imaging reveals limited antigen presentation and T cell effector function in mycobacterial granulomas. Immunity. 2011;34:807–819. doi: 10.1016/j.immuni.2011.03.022. [DOI] [PMC free article] [PubMed] [Google Scholar]
- 10.Le Borgne M, et al. The impact of negative selection on thymocyte migration in the medulla. Nat Immunol. 2009;10:823–830. doi: 10.1038/ni.1761. [DOI] [PMC free article] [PubMed] [Google Scholar]
- 11.Zinselmeyer BH, et al. In situ characterization of CD4+ T cell behavior in mucosal and systemic lymphoid tissues during the induction of oral priming and tolerance. J Exp Med. 2005;201:1815–1823. doi: 10.1084/jem.20050203. [DOI] [PMC free article] [PubMed] [Google Scholar]
- 12.Eickhoff S, et al. Robust Anti-viral Immunity Requires Multiple Distinct T Cell-Dendritic Cell Interactions. Cell. 2015;162:1322–1337. doi: 10.1016/j.cell.2015.08.004. [DOI] [PMC free article] [PubMed] [Google Scholar]
- 13.Verdaguer J, et al. Spontaneous autoimmune diabetes in monoclonal T cell nonobese diabetic mice. J Exp Med. 1997;186:1663–1676. doi: 10.1084/jem.186.10.1663. [DOI] [PMC free article] [PubMed] [Google Scholar]
- 14.Schäffer L, et al. A novel high-affinity peptide antagonist to the insulin receptor. Biochem Biophys Res Commun. 2008;376:380–383. doi: 10.1016/j.bbrc.2008.08.151. [DOI] [PubMed] [Google Scholar]
- 15.Gardner JM, et al. Deletional tolerance mediated by extrathymic Aire-expressing cells. Science. 2008;321:843–847. doi: 10.1126/science.1159407. [DOI] [PMC free article] [PubMed] [Google Scholar]
- 16.Smith RE, Farquhar MG. Lysosome function in the regulation of the secretory process in cells of the anterior pituitary gland. J Cell Biol. 1966;31:319–347. doi: 10.1083/jcb.31.2.319. [DOI] [PMC free article] [PubMed] [Google Scholar]
- 17.Halban PA, Wollheim CB. Intracellular degradation of insulin stores by rat pancreatic islets in vitro. An alternative pathway for homeostasis of pancreatic insulin content. J Biol Chem. 1980;255:6003–6006. [PubMed] [Google Scholar]
- 18.Weckman A, et al. Autophagy in the endocrine glands. J Mol Endocrinol. 2014;52:R151–163. doi: 10.1530/JME-13-0241. [DOI] [PubMed] [Google Scholar]
- 19.Yang J, et al. Autoreactive T cells specific for insulin B:11-23 recognize a low-affinity peptide register in human subjects with autoimmune diabetes. Proc Natl Acad Sci USA. 2014;111:14840–14845. doi: 10.1073/pnas.1416864111. [DOI] [PMC free article] [PubMed] [Google Scholar]
- 20.Wong FS, et al. Identification of an MHC class I-restricted autoantigen in type 1 diabetes by screening an organ-specific cDNA library. Nat Med. 1999;5:1026–1031. doi: 10.1038/12465. [DOI] [PubMed] [Google Scholar]
- 21.Lamont D, et al. Compensatory mechanisms allow undersized anchor-deficient class I MHC ligands to mediate pathogenic autoreactive T cell responses. J Immunol. 2014;193:2135–2146. doi: 10.4049/jimmunol.1400997. [DOI] [PMC free article] [PubMed] [Google Scholar]
- 22.Chen W, et al. Evidence that a peptide spanning the B-C junction of proinsulin is an early Autoantigen epitope in the pathogenesis of type 1 diabetes. J Immunol. 2001;167:4926–4935. doi: 10.4049/jimmunol.167.9.4926. [DOI] [PubMed] [Google Scholar]
- 23.Buck MD, O’Sullivan D, Pearce EL. T cell metabolism drives immunity. J Exp Med. 2015;212:1345–1360. doi: 10.1084/jem.20151159. [DOI] [PMC free article] [PubMed] [Google Scholar]
- 24.Constantinides MG, Picard D, Savage AK, Bendelac A. A naive-like population of human CD1d-restricted T cells expressing intermediate levels of promyelocytic leukemia zinc finger. J Immunol. 2011;187:309–315. doi: 10.4049/jimmunol.1100761. [DOI] [PMC free article] [PubMed] [Google Scholar]
- 25.Kaech SM, Hemby S, Kersh E, Ahmed R. Molecular and functional profiling of memory CD8 T cell differentiation. Cell. 2002;111:837–851. doi: 10.1016/s0092-8674(02)01139-x. [DOI] [PubMed] [Google Scholar]
- 26.Wherry EJ, et al. Molecular signature of CD8+ T cell exhaustion during chronic viral infection. Immunity. 2007;27:670–684. doi: 10.1016/j.immuni.2007.09.006. [DOI] [PubMed] [Google Scholar]
- 27.Macián F, et al. Transcriptional mechanisms underlying lymphocyte tolerance. Cell. 2002;109:719–731. doi: 10.1016/s0092-8674(02)00767-5. [DOI] [PubMed] [Google Scholar]
- 28.Schietinger A, Delrow JJ, Basom RS, Blattman JN, Greenberg PD. Rescued tolerant CD8 T cells are preprogrammed to reestablish the tolerant state. Science. 2012;335:723–727. doi: 10.1126/science.1214277. [DOI] [PMC free article] [PubMed] [Google Scholar]
- 29.Kalekar LA, et al. CD4(+) T cell anergy prevents autoimmunity and generates regulatory T cell precursors. Nat Immunol. 2016;17:304–314. doi: 10.1038/ni.3331. [DOI] [PMC free article] [PubMed] [Google Scholar]
- 30.Levisetti MG, Suri A, Frederick K, Unanue ER. Absence of lymph nodes in NOD mice treated with lymphotoxin-beta receptor immunoglobulin protects from diabetes. Diabetes. 2004;53:3115–3119. doi: 10.2337/diabetes.53.12.3115. [DOI] [PubMed] [Google Scholar]
- 31.Aly H, et al. A novel strategy to increase the proliferative potential of adult human β-cells while maintaining their differentiated phenotype. PLoS ONE. 2013;8:e66131. doi: 10.1371/journal.pone.0066131. [DOI] [PMC free article] [PubMed] [Google Scholar]
- 32.Ferris ST, et al. The islet-resident macrophage is in an inflammatory state and senses microbial products in blood. J Exp Med. 2017;214:2369–2385. doi: 10.1084/jem.20170074. [DOI] [PMC free article] [PubMed] [Google Scholar]
Associated Data
This section collects any data citations, data availability statements, or supplementary materials included in this article.
Supplementary Materials
Data Availability Statement
The RNAseq data have been deposited in the Gene Expression Omnibus under accession number GSE114824. The mass spectrometry proteomics data have been deposited to the ProteomeXchange Consortium via the PRIDE partner repository with the dataset identifier PXD009919 and 10.6019/PXD009919.