

Abstract
Markers are needed to predict progression of nonalcoholic fatty liver disease (NAFLD). The proton density fat fraction, measured by magnetic resonance imaging (MRI-PDFF), provides an accurate, validated marker of hepatic steatosis. However, it is not clear whether the proton density fat fraction identifies patients at risk for NAFLD progression. We performed a follow-up study of 95 well-characterized patients with biopsy-proven NAFLD and examined the association between liver fat content and fibrosis progression. MRI-PDFF measurements were made at study entry (baseline). Biopsies were collected from patients at baseline and after a mean time period of 1.75 years. Among patients with no fibrosis at baseline, a higher proportion of patients in the higher liver fat group (MRI-PDFF ≥ 15.7%) had fibrosis progression (38.1%) than in the lower liver fat group (11.8%) (P=.067). In multivariable-adjusted logistic regression models (adjusted for age, sex, ethnicity, and body mass index), patients in the higher liver fat group had a significantly higher risk of fibrosis progression (multivariable adjusted odds ratio, 6.7; 95% CI, 1.01–44.1) (P=.049). Our findings associate higher liver fat content, measured by MRI-PDFF, with fibrosis progression.
Keywords: steatosis, risk factor, biomarker, NASH
Nonalcoholic fatty liver disease (NAFLD) is the most common cause of chronic liver disease in the United States. It encompasses a spectrum of histologically distinguishable disease, ranging from nonalcoholic fatty liver (NAFL) to nonalcoholic steatohepatitis (NASH), a progressive form characterized by steatosis and hepatocellular injury with ballooning and lobular inflammation, with or without fibrosis.1 The ability to better predict the risk of disease progression, particularly among patients with early NAFLD, is needed to appropriately focus interventions on the population at higher risk.
MRI-based proton density fat fraction (MRI-PDFF) has emerged as an accurate, reproducible biomarker of hepatic steatosis.2–5 Despite validation of this biomarker for accurate assessment of steatosis in NAFLD, there are no data on whether the amount of hepatic fat measured by MRI-PDFF can be used to identify patients at risk for progressive disease. Since recent genetic studies have shown an association between single nucleotide polymorphisms (SNPs) associated with fat metabolism and fibrosis, it is biologically plausible that hepatic steatosis may have prognostic significance. Thus, we performed a longitudinal study of 95 adult well-characterized NAFLD patients with baseline MRI-PDFF and liver biopsy followed by a second liver biopsy to test the association between higher liver fat (defined as MRI-PDFF ≥15.7%) and progression from no fibrosis (stage 0) on baseline histological assessment to a histological diagnosis of any fibrosis (stage 1–4) (Supplemental Materials and Methods).
Ninety-five patients with NAFLD with paired liver biopsies and baseline MRI were included (Supplemental Figure 1) and were incorporated in the analysis for the primary and secondary outcome based on baseline histology (Supplemental Figure 2). Patients were stratified into two groups by the median MRI-PDFF: Higher liver fat group (N=49) with MRI-PDFF ≥ 15.7% and lower liver fat group with MRI-PDFF < 15.6%. participants had a mean age of 51 years and were predominantly female (61%); 37% Hispanic ethnicity, and the mean BMI was 31.8 kg/m2. At baseline, 40% had no fibrosis, 26% stage 1, 8% stage 2, and 25% stage 3–4 fibrosis (Table 1).
Table 1.
Clinical, demographic, histologic, and imaging characteristics at baseline by dichotomized liver fat content
| Lower - Liver -Fat N=49 | Higher - Liver -Fat N=46 | |
|---|---|---|
| Demographic | ||
| Age in years, mean (SD) | 52 (15) | 50 (11) |
| Male, n (%) | 18 (37%) | 19 (41%) |
| BMI (kg/m2), mean (SD) | 31.8 (4.7) | 31.9 (4.7) |
| Race/Ethnicity, n (%) | ||
| White | 16 (33%) | 21 (46%) |
| African American | 1 (2%) | 0 (0%) |
| Asian | 9 (19%) | 5 (11%) |
| Hispanic | 19 (37%) | 17 (37%) |
| Other | 5 (10%) | 3 (7%) |
| Diabetes, n (%) | 20 (41%) | 13 (28%) |
| Biochemical profile | ||
| AST (U/l), median (IQR) | 40 (33) | 39 (26) |
| ALT (U/l), median (IQR) | 58 (61) | 58 (46) |
| Alkaline Phosphatase (U/l), median (IQR) | 74 (27) | 74 (28) |
| Total bilirubin (mg/dl), median (IQR) | 0.5 (0.3) | 0.4 (0.3) |
| Albumin (g/dl), median (IQR) | 4.5 (0.3) | 4.5 (0.2) |
| HOMA-IR median (IQR) | 6.3 (7.1) | 7.0 (9.8) |
| Triglycerides (mg/dl), median (IQR) | 129 (51) | 167 (59) |
| Total cholesterol (mg/dl), median (IQR) | 189 (53) | 190 (54) |
| HDL (mg/dl), median (IQR) | 46 (20) | 41 (14) |
| LDL (mg/dl), median (IQR) | 109 (42) | 109 (43) |
| Platelet count (109/L), median (IQR) | 234 (79) | 249 (84) |
| Histology | ||
| Time between biopsies in years, mean (SD) | 1.75 (1.4) | 1.74 (1.3) |
| Biopsy length (cm), mean (SD) | 2.2 (1) | 2.1 (0.5) |
| Fibrosis Stage, n (%) | ||
| 0 | 17 (35%) | 21 (46%) |
| 1 | 13 (27%) | 12 (26%) |
| 2 | 3 (6%) | 5 (11%) |
| 3 | 8 (16%) | 8 (17%) |
| 4 | 8 (16%) | 0 (0%) |
| NASH Classification, n (%) | ||
| NAFLD not NASH | 5 (10%) | 5 (11%) |
| Borderline NASH | 2 (4%) | 2 (4%) |
| Definite NASH | 42 (86%) | 39 (85%) |
| Steatosis Grade, n (%) | ||
| 0 | 0 (0%) | 0 (0%) |
| 1 | 29 (59%) | 2 (4%) |
| 2 | 18 (37%) | 17 (37%) |
| 3 | 2 (4%) | 27 (59%) |
| Lobular inflammation Grade, n (%) | ||
| 0 | 0 (0%) | 1 (2%) |
| 1 | 22 (45%) | 16 (35%) |
| 2 | 26 (53%) | 28 (61%) |
| 3 | 1 (2%) | 1 (2%) |
| Ballooning Grade, n (%) | ||
| 0 | 6 (12%) | 7 (15%) |
| 1 | 26 (53%) | 23 (50%) |
| 2 | 17 (35%) | 16 (25%) |
| NAS median (IQR), n (%) | 4 (1) | 5 (1) |
| Imaging | ||
| Baseline MRI-PDFF (%), mean (SD) | 9.4 (3.3) | 22.3 (6.3) |
Abbreviations: ALT, Alanine aminotransferase; AST, Aspartate aminotransferase; BMI, Body mass index; HDL, high-density lipoprotein; HOMA-IR = homeostatic model assessment method for insulin resistance (calculated as (fasting insulin (μU/mL)*fasting glucose (mmol/L))/22.5); IQR, interquartile range; LDL, low-density lipoprotein; MRI-PDFF, MRI-based proton density fat fraction; NAFLD, Nonalcoholic fatty liver disease; NAS, NAFLD activity score; NASH, Nonalcoholic steatohepatitis; SD, Standard deviation
Among the 49 patients with lower liver fat and the 46 patients with higher liver fat, the mean (SD) baseline MRI-PDFF value was 9.4% (± 3.3) and 22.3% (± 6.3) respectively. The two groups were similar with respect to demographic, biochemical and histological features at baseline. There were statistically significant differences in median (IQR) triglycerides between lower (129, IQR 51 mg/dL) and higher liver fat (167, IQR 59 mg/dL) groups (p=0.019), and in steatosis grade (p < 0.001).
Among the 38 patients with no fibrosis at baseline, patients in the higher liver fat group (MRI-PDFF ≥ 15.7%) had higher rate of fibrosis progression than the low-liver-fat group (38.1% vs 11.8%, p=0.067). After multivariable-adjustment for baseline factors, chosen a priori, including age, sex, BMI, and race/ethnicity, the multivariable-adjusted odds of fibrosis progression was both clinically and statistically significantly higher in patients in higher liver fat group than lower liver fat group (Odds ratio, 6.67, (95% CI 1.01 – 44.1, p=0.049) (Figure 1). Sensitivity analyses evaluating the adjusted association between higher liver fat and fibrosis progression of at least one stage on follow-up biopsy for all patients with < stage 2, < stage 3, and < stage 4 fibrosis at baseline revealed adjusted ORs of 2.94 (95% CI 0.79 – 11.0, p=0.11), 2.21 (95% CI 0.68 – 7.25, p=0.19) and 2.58 (95% CI 0.86 – 7.73, p=0.09) respectively.
Figure 1.
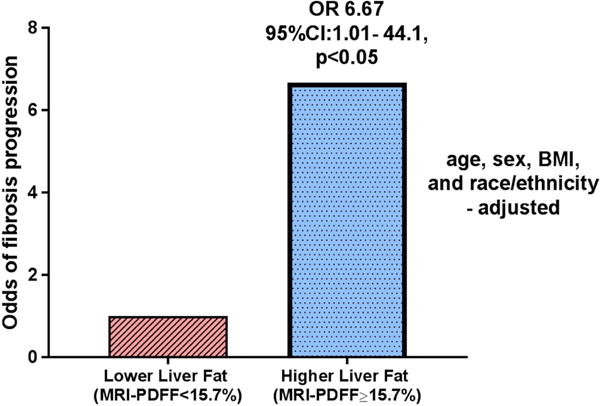
Baseline higher MRI-PDFF predicts fibrosis progression
Among 81 patients with definite NASH histology at baseline, 31% in the higher liver fat group vs 43% in the lower-liver-fat group (p=0.26) had not definite NASH histology at follow up. In additional analysis restricted to patients with definite NASH and no fibrosis at baseline (N=28) patients in the higher liver fat group had significantly less improvement to non-NASH histology (40% vs. 77%, p=0.049) (Supplemental Figure 3).
This proof of concept study provides novel data on potential prognostic significance of liver fat content in fibrosis progression in NAFLD. Here, we demonstrate that higher liver fat measured by MRI-PDFF at baseline was associated with early histologic progression to fibrotic NAFLD and less improvement in definite NASH in patients without fibrosis. The findings remained significant despite multivariable-adjustment for age, sex, BMI and ethnicity. Fibrosis stage has been demonstrated recently to be the strongest predictor of both all-cause and liver-related mortality.6–8 Genetic variants associated with NAFLD prevalence and fibrosis severity, including PNPLA3 and TM6SF2 appear to be mechanistically linked to hepatic lipid accumulation, suggesting a pathophysiologic link between steatosis and fibrosis severity.9–12 Our study of well-characterized NAFLD patients with sequential liver biopsies and MRI-PDFF supports recent epidemiologic studies that have demonstrated a link between baseline severity of steatosis and liver related mortality as well as increased liver stiffness at follow up.13, 14
Although this study provides a rigorous evaluation of the impact of higher liver fat on histologic progression, we acknowledge the following limitations. Fibrosis progression in NAFLD is typically slow with a previous systematic review suggesting an average fibrosis progression rate of 1 stage every 7 years in patients with NASH.15 However, a subset of patients progressed more rapidly, and our study provides new evidence that higher degrees of steatosis may be associated with early fibrotic progression. Only a subset of patients had NAFLD without fibrosis and were included in the primary analysis, but the direction of the association between progressive fibrosis and higher liver fat persisted across all groups of non-cirrhotic NAFLD at baseline, although it was not statistically significant in sensitivity analysis. More specific measures of visceral adiposity and genetic data on PNPLA3 and TM6SF2 and higher liver fat were not available. Further studies will be needed to validate these findings and assess the role of genotype in fibrosis progression in longitudinal studies. While larger, multicenter studies confirming these findings are warranted, these results support the hypothesis that the degree of steatosis has prognostic relevance particularly in early NAFLD and may help identify patients at greater risk for progression to fibrotic NASH.
METHODS
Study Design
This is a longitudinal study derived from a well-characterized prospective cohort of patients with biopsy-proven NAFLD. For this study, participants were included if MRI-PDFF was measured contemporaneously with baseline liver biopsy, and if they had subsequent liver biopsy. Between September 2009 and August 2017, 95 adult patients underwent paired clinical liver biopsies for NAFLD assessment and a baseline research MRI-PDFF exam for hepatic steatosis assessment at the UCSD NAFLD Research Center.7,9,23–25 All patients provided written informed consent prior to enrolling in the study and the study was approved by the UCSD Institutional Review Board.
Inclusion and Exclusion Criteria
Patients ≥18 years of age with biopsy-proven NAFLD and written informed consent were included. Participants meeting any of the following criteria were excluded from the study: significant alcohol consumption (defined as ≥14 drinks/week for men or ≥7 drinks/week for women) within the previous 2 year period; evidence of active substance use; clinical or laboratory evidence of secondary causes or chronic conditions associated with hepatic steatosis including nutritional disorders, HIV infection, and use of steatogenic drugs such as amiodarone, glucocorticoids, methotrexate, l-asparaginase, and valproic acid; underlying liver disease other than NAFLD including viral hepatitis (assessed with serum hepatitis B surface antigen and hepatitis C RNA assays), hemochromatosis, Wilson’s disease, alpha-1 antitrypsin deficiency, glycogen storage disease, autoimmune hepatitis, and cholestatic or vascular liver disease; major systemic illnesses; decompensated liver disease (defined as Child-Pugh score > 7 points); contraindications to MRI including metallic implants, claustrophobia, and body circumference exceeding the imaging chamber capacity; pregnancy or attempting to be pregnant; any other conditions believed by the principal investigator to affect patient’s competence or compliance to complete the study. Patients with paired liver biopsies and MRI within one year of the first liver biopsy and temporally closer to the first liver biopsy than the second were included.
Clinical Research Evaluation
At baseline, all patients underwent a standardized clinical evaluation including detailed history, anthropometric exam, and laboratory testing at the UCSD NAFLD Research Center. A trained clinical investigator documented information including age, sex, height, weight, BMI, and ethnicity, and vital signs. Alcohol intake history was obtained in a clinical setting and verified at the research clinic with the Alcohol Use Disorders Identification Test and the Skinner questionnaire. Other causes of liver disease and hepatic steatosis were ruled out systematically based on history and laboratory tests. Participants were instructed to fast for a minimum of eight hours prior to collection of laboratory tests.
Histologic Evaluation
All patients underwent a baseline liver biopsy, followed by a second liver biopsy for assessment by an experienced liver pathologist blinded to patients’ clinical or imaging data. This study utilized the Nonalcoholic Steatohepatitis Clinical Research Network Histologic Scoring System, in which hepatic fibrosis was scored on a scale from 0 to 4 (0, 1, 2, 3, 4), with stage 4 signifying cirrhosis, hepatic steatosis and lobular inflammation were scored from 0 to 3 (0, 1, 2, 3), and hepatic ballooning was scored from 0 to 2 (0, 1, 2).6 Steatosis, lobular inflammation and hepatocyte ballooning scores were summed to obtain the NAFLD activity score26, which ranged from 0 to 8. Diagnosis of NASH was classified as definite NASH, NAFLD not NASH or “borderline” NASH. These categories were assigned prior to conducting statistical analyses.
Magnetic Resonance Imaging
Abdominal MRI including an MRI-PDFF sequence was obtained on a single 3T MR scanner (GE Signa EXCITE HDxt, GE Healthcare, Waukesha, WI) at the UCSD MR3T Research Laboratory using previously-described methods.10,11,27–29 The mean PDFF across nine regions of interest was evaluated, which has been demonstrated to accurately correlate with both liver histology and magnetic resonance spectroscopy.30–33 The median and IQR time intervals between the baseline liver biopsy and MRI were 35 and 42 days, respectively.
Outcome Measures
The primary outcome was progression from no fibrosis (stage 0) on baseline histological assessment to a histological diagnosis of any fibrosis (stage 1–4) on follow-up assessment. The secondary outcome was improvement from definite NASH to not definite NASH histology (not NASH or borderline NASH) on follow up.
Statistical Analyses
Patients were divided into two groups, 49 patients at or below the median MRI-PDFF and 46 patients above the median MRI-PDFF. We hypothesized that the risk of fibrosis progression in the higher-liver-fat group would be 60% compared to 15% in the lower-liver-fat group, and power analysis showed that a sample size of 35 would provide 80% power with a two-tailed alpha of 0.05. Therefore, we had adequate power to detect the aforementioned difference in fibrosis progression with our N=38 patients without fibrosis at baseline. Descriptive statistics of participant demographic, laboratory, histological, and imaging characteristics at baseline were compared by dichotomized MRI-PDFF-determined liver fat. Univariate and multivariate logistic regression analyses to assess for the association between higher- compared to lower-liver-fat and (1) progression to any fibrosis among patients with no fibrosis at baseline and (2) improvement from definite NASH to not definite NASH among patients with NASH at baseline was performed. Multivariate analysis included baseline demographic and anthropometric characteristics chosen a priori for their known association with NAFLD and included BMI, age, race/ethnicity, and sex. Statistical significance was defined as a two-tailed P-value of ≤ 0.05. All statistical analyses were performed on STATA (StataCorp LP, College Station, Texas).
Supplementary Material
Acknowledgments
Grant support: The study was conducted at the Clinical and Translational Research Institute, University of California at San Diego. RL is supported in part by the American Gastroenterological Association (AGA) Foundation - Sucampo – ASP Designated Research Award in Geriatric Gastroenterology and by a T. Franklin Williams Scholarship Award; Funding provided by: Atlantic Philanthropies, Inc, the John A. Hartford Foundation, OM, the Association of Specialty Professors, and the American Gastroenterological Association and grant K23-DK090303. CS and RL serve as co-PIs on the grant R01-DK106419. CP is supported by NIH TL1 training grant TL1TR00098. Dr. Ajmera is supported by the Alan Hofmann Clinical and Translational Research Award from the AASLD Foundation. The content is solely the responsibility of the authors and does not necessarily represent the official views of the NIH. CC is supported by grants from the Société Francophone du Diabète (SFD), the Philippe Foundation and Monahan Foundation under the Fulbright program
Role of study sponsor: The study sponsor(s) had no role in the study design, collection, analysis, interpretation of the data, and/or drafting of the manuscript.
Abbreviations
- BMI
body mass index
- CI
confidence interval
- MRI
magnetic resonance imaging
- MRI-PDFF
magnetic resonance imaging-proton density fat fraction
- NAFL
nonalcoholic fatty liver
- NAFLD
nonalcoholic fatty liver disease
- NASH
nonalcoholic steatohepatitis
- UCSD
University of California at San Diego
Footnotes
Publisher's Disclaimer: This is a PDF file of an unedited manuscript that has been accepted for publication. As a service to our customers we are providing this early version of the manuscript. The manuscript will undergo copyediting, typesetting, and review of the resulting proof before it is published in its final citable form. Please note that during the production process errors may be discovered which could affect the content, and all legal disclaimers that apply to the journal pertain.
Guarantor(s) of the article: Rohit Loomba
Conflict of interests: Dr. Sirlin consults, advises, and is on the speakers’ bureau for Bayer. He received grants from GE Healthcare. All other authors report no other conflict of interest.
Author contributions:
Veeral Ajmera: study concept and design, analysis and interpretation of data, drafting of the manuscript, critical revision of the manuscript, study supervision, approved final submission
Charlie C. Park: study concept and design, analysis and interpretation of data, critical revision of the manuscript, approved final submission
Cyrielle Caussy: patient visits, data collection, critical revision of the manuscript, approved final submission
Seema Singh: patient visits, data collection, critical revision of the manuscript, approved final submission
Carolyn Hernandez: patient visits, data collection, critical revision of the manuscript, approved final submission
Ricki Bettencourt: statistical analysis, critical revision of the manuscript, approved final submission
Jonathan Hooker: data collection, imaging analysis, critical revision of the manuscript, approved final submission
Ethan Sy: data collection, imaging analysis, critical revision of the manuscript, approved final submission
Cynthia Behling: interpreted biopsies, critical revision of the manuscript, approved final submission
Ronghui Xu: critical revision of the manuscript, approved final submission
Michael Middleton: data collection, imaging analysis, critical revision of the manuscript, approved final submission
Mark A. Valasek: interpreted biopsies, critical revision of the manuscript, approved final submission
Emily Rizo: patient visits, critical revision of the manuscript, approved final submission
Lisa Richards: patient visits, critical revision of the manuscript, approved final submission
Claude B. Sirlin: study concept and design, analysis and interpretation of data, drafting of the manuscript, critical revision of the manuscript, obtained funding, study supervision, approved final submission
Rohit Loomba: study concept and design, analysis and interpretation of data, critical revision of the manuscript, obtained funding, study supervision, approved final submission
All authors approved the final version of this article.
References
- 1.Kleiner DE, et al. Hepatology. 2005;41:1313–21. doi: 10.1002/hep.20701. [DOI] [PubMed] [Google Scholar]
- 2.Le TA, et al. Hepatology. 2012;56:922–32. doi: 10.1002/hep.25731. [DOI] [PMC free article] [PubMed] [Google Scholar]
- 3.Park CC, et al. Gastroenterology. 2017;152:598–607.e2. doi: 10.1053/j.gastro.2016.10.026. [DOI] [PMC free article] [PubMed] [Google Scholar]
- 4.Mashhood A, et al. J Magn Reson Imaging. 2013;37:1359–70. doi: 10.1002/jmri.23928. [DOI] [PubMed] [Google Scholar]
- 5.Loomba R, et al. Hepatology. 2015;61:1239–50. doi: 10.1002/hep.27647. [DOI] [PMC free article] [PubMed] [Google Scholar]
- 6.Ekstedt M, et al. Hepatology. 2015;61:1547–54. doi: 10.1002/hep.27368. [DOI] [PubMed] [Google Scholar]
- 7.Angulo P, et al. Gastroenterology. 2015;149:389–97.e10. doi: 10.1053/j.gastro.2015.04.043. [DOI] [PMC free article] [PubMed] [Google Scholar]
- 8.Dulai PS, et al. Hepatology. 2017;65:1557–1565. doi: 10.1002/hep.29085. [DOI] [PMC free article] [PubMed] [Google Scholar]
- 9.Romeo S, et al. Nat Genet. 2008;40:1461–5. doi: 10.1038/ng.257. [DOI] [PMC free article] [PubMed] [Google Scholar]
- 10.Rotman Y, et al. Hepatology. 2010;52:894–903. doi: 10.1002/hep.23759. [DOI] [PMC free article] [PubMed] [Google Scholar]
- 11.Kozlitina J, et al. Nat Genet. 2014;46:352–6. doi: 10.1038/ng.2901. [DOI] [PMC free article] [PubMed] [Google Scholar]
- 12.Liu YL, et al. Nat Commun. 2014;5:4309. doi: 10.1038/ncomms5309. [DOI] [PMC free article] [PubMed] [Google Scholar]
- 13.Lallukka S, et al. Sci Rep. 2017;7:14561. doi: 10.1038/s41598-017-14706-0. [DOI] [PMC free article] [PubMed] [Google Scholar]
- 14.Unalp-Arida A, et al. Hepatology. 2016;63:1170–83. doi: 10.1002/hep.28390. [DOI] [PMC free article] [PubMed] [Google Scholar]
- 15.Singh S, et al. Clinical Gastroenterology and Hepatology. 2015;13:643. doi: 10.1016/j.cgh.2014.04.014. + [DOI] [PMC free article] [PubMed] [Google Scholar]
Associated Data
This section collects any data citations, data availability statements, or supplementary materials included in this article.