

Abstract
The rapid elimination of dying neurons and non-functional synapses in the brain is carried out by microglia, the resident myeloid cells of the brain. Here we show that microglia clearance activity in the adult brain is regionally regulated and depends on the rate of neuronal attrition. Cerebellar, but not striatal or cortical, microglia exhibited high levels of basal clearance activity, which correlated with an elevated degree of cerebellar neuronal attrition. Exposing forebrain microglia to apoptotic cells activated gene expression programs supporting clearance activity. We provide evidence that the Polycomb repressive complex 2 (PRC2) epigenetically restricts the expression of genes that support clearance activity in striatal and cortical microglia. Loss of PRC2 led to the aberrant activation of a microglia clearance phenotype, which triggers changes in neuronal morphology and behavior. Our data highlight a key role of epigenetic mechanisms in preventing microglia-induced neuronal alterations that are frequently associated with neurodegenerative and psychiatric diseases.
Introduction
Development and ageing of the brain are associated with the attrition and loss of neurons1. Despite the overall low rate of neuronal death during adulthood, functionally distinct brain areas display significant differences in neuronal loss2. One of the brain regions displaying the most pronounced age-dependent neuronal loss is the cerebellum, where neuronal numbers start declining at the end of adolescence3,4. The loss of neurons in the cerebellum contrasts with that of other brain structures, such as the striatum, cortex, and hippocampus, which stably maintain their size and neuronal numbers throughout adulthood3,5.
The clearance of dying cells and debris in the brain is carried out by microglia, the brain-resident macrophages6. Brain region-specific differences in neuronal attrition suggest the possibility that microglia may fine-tune their clearance activity to the load of cell debris. Accordingly, the clearance activity of microglia must be suppressed in areas with low rates of neuronal death in the adult brain. Exacerbated activation of microglia has been shown to promote microglia-mediated neuronal attrition7,8. These findings underscore the essential role of mechanisms that modulate microglia activation in the maintenance of brain integrity.
Here we show regional differences in microglia clearance activity in the adult brain and demonstrate the importance of its tight regulation for normal brain function. We found that cerebellar microglia display a distinct clearance phenotype characterized by the expression of numerous genes supporting the engulfment and catabolism of cells and cellular debris. The cerebellar microglia phenotype is reminiscent of microglia during early brain development9,10 as well as microglia associated with neurodegenerative disease11–13. In contrast, microglia in the striatum, which like the cerebellum, is characterized by a rather homogenous neuron population, display a homeostatic surveillance phenotype14,15. We found that the suppression of clearance activity in striatal microglia has an epigenetic underpinning. The suppression of clearance genes in striatal microglia is governed by Polycomb repressive complex 2 (PRC2), which catalyzes the repressive chromatin modification histone H3 lysine 27 tri-methylation (H3K27me3)16. Accordingly, microglia-specific ablation of PRC2 leads to the aberrant acquisition of a clearance phenotype in striatal and cortical microglia even in the absence of dying neurons. This aberrant clearance activation has a negative impact on neuronal morphology and associated neuron-mediated behaviors, leading to impaired motor responses, to decreased learning and memory, and to the development of anxiety and seizures in mice.
Results
Cerebellar microglia display cellular phenotypes and gene expression patterns associated with cell clearance
We found that cerebellar microglia (cbMg), unlike microglia in the striatum (stMg), display morphological features and gene expression patterns that support clearance function (Fig. 1, Supplementary Fig. 1). cbMg in the adult mouse brain show a primed/phagocytic microglia phenotype11–13 characterized by a less ramified morphology, reduced branching sites (Supplementary Fig. 1a), decreased cell volume (Supplementary Fig. 1b,c), and an increase in CD68+ lysosome content (Fig. 1a, Supplementary Fig. 1b,c). A significant fraction of microglia in the cerebellum contains lysosomes carrying cell nuclei fragments as determined by the presence of DAPI-positive nuclear material (Fig. 1b, Supplementary Fig. 1d), which is indicative of apoptotic cell clearance17. The relatively high CD68+ lysosome content of cbMg is reminiscent of microglia in the dentate gyrus and olfactory bulb (Supplementary Fig. 1b,c), where ongoing neuronal turnover is associated with high rates of cell death in the adult brain18.
Fig. 1. cbMg display a cell clearance phenotype.
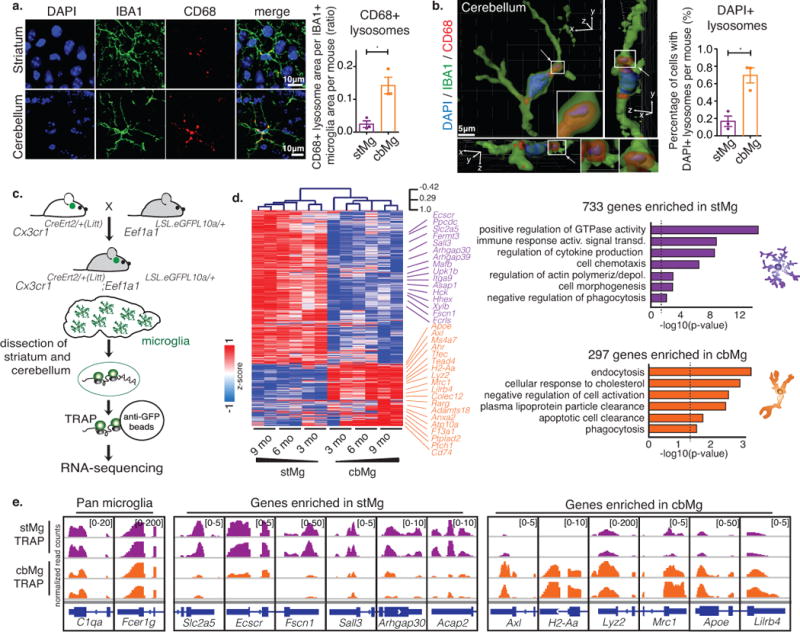
(a) CD68+ lysosome content (red) in IBA1+ microglia (green) in brain sections from 4/6mo wild-type mice (DAPI: blue). Scale: 10 μm. Representative image (left); quantification of lysosomal area/microglia area (right) are shown. stMg: mean=0.02437, SEM=0.01011; cbMg: mean=0.1424, SEM=0.02527; p=0.0166, F=6.245, t2=7.668; >15 images/region from n=3 mice. (b) DAPI content (blue) in CD68+ lysosomes (red) of IBA1+ microglia (green) was determined using 3D reconstruction (Imaris) from 4/6mo wild-type mice. Scale: 5 μm. Representative reconstruction with side scatter views (left); quantification of percentage of microglia with DAPI+ CD68+ lysosomes (right). Arrows indicate DAPI+/CD68+ lysosome, which is shown with a zoomed in view. 3D axes are shown. stMg: mean=0.1675, SEM=0.06029; cbMg: mean=0.6960, SEM=0.0868; p=0.0300, F=2.077, t2=5.639; >200 cells/region from n=3 mice. Bar graphs with individual data points show mean ± SEM, t-tests were two-tailed paired. (c) Schematic showing microglia-specific TRAP-sequencing. (d) Heatmap with hierarchical clustering distances shows the variation in the expression levels (z-scored log2 RPKM [z-score]) of 733 stMg- and 297 cbMg-enriched genes identified by TRAP (DESeq2, n=2/age/region). Selected Gene Ontology (GO) annotations (Enrichr) enriched for stMg-/cbMg-enriched genes are shown. y-axis: -log10 (p-value). Dotted lines: p=0.05. (e) Genome browser views (IGV) of normalized read counts of selected genes in stMg/cbMg by TRAP.
To study gene expression in microglia in a minimally invasive fashion in vivo, we established a microglia-specific Translating Ribosome Affinity Purification19 (TRAP) approach (Fig. 1c). To generate microglia-specific TRAP mice, we bred mice that carry a loxP-flanked STOP cassette (LSL) upstream of the eGFP-L10a coding sequence under the control of ubiquitously expressed eukaryotic translation elongation factor 1 alpha 1, Eef1a1 (Eef1a1LSL.eGFPL10a/+) to mice that express the Cre recombinase under the control of a microglia-specific gene promoter. The Cx3Cr1CreErt2/+ strain was chosen based on the inducibility, selectivity, and highest efficiency of Cre expression in microglia in the adult brain (Supplementary Fig. 2). Importantly, we show that the TRAP approach not only allows for the region-specific analysis of microglia-enriched mRNA expression (Supplementary Fig. 3, Supplementary Table 1) but also precludes nonspecific microglia activation and concurrent up-regulation of immediate early and pro-inflammatory genes that occur during commonly used microglia isolation approaches (Supplementary Fig. 4, Supplementary Table 2).
We found that cbMg display a significant enrichment in mRNAs associated with cell clearance functions (Fig. 1d,e, Supplementary Fig. 5a,b, Supplementary Table 3). In contrast, stMg are enriched in mRNAs encoding mature microglia-specific homeostatic surveillance proteins14,15, including those that mediate G-protein-coupled chemosensing, chemotaxis, GTP signaling, and actin polymerization20 (Fig. 1d,e, Supplementary Fig. 5a,b, Supplementary Table 3). A large fraction of the cbMg-enriched genes, including Apoe, Axl, Colec12, Cd74, Lilrb4, Mrc1, and Ms4a7 (Fig. 1d,e, Supplementary Fig. 5a,b, Supplementary Table 3), encode proteins involved in apoptotic cell detection, engulfment, clearance of cell debris, and lipid/protein catabolism and have been shown to support clearance activity in phagocytic macrophages in peripheral tissues21. Furthermore, cbMg show an increase in the expression of genes characteristic of immature microglia9,10, as well as genes that are expressed in neurodegenerative disease-associated microglia (such as primed microglia, MGnD, and DAMs)11–13 (Supplementary Fig. 5c,d, Supplementary Table 4). Notably, in contrast to neurodegenerative disease-associated microglia, the cbMg are not enriched in the expression of pro-inflammatory genes such as Cxcl10, Il1b, Il6, and Tnf (Supplementary Fig. 5b).
The differential cbMg clearance- versus stMg surveillance-gene expression patterns were confirmed by microglia single-nuclei RNA-sequencing analysis (Fig. 2a,b, Supplementary Fig. 6, Supplementary Tables 5,6) and RNA in situ hybridization (Supplementary Fig. 7a-c). The expression of selected cbMg-enriched genes associated with clearance functions has been further validated at the level of protein expression. Expression of the clearance-associated proteins AXL, ApoE, CD74, MHCII, and MRC1 is significantly higher in cbMg, while actin polymerization-regulating FSCN1 protein expression shows a significant enrichment in stMg (Fig. 2c, Supplementary Fig. 7d). In support of cbMg clearance activity, we also found a significant enrichment in LC3 protein expression in cbMg as compared to stMg (Fig. 2c). In addition to its known role in autophagy22, LC3 has been recently identified as a novel regulator of rapid apoptotic cell clearance in macrophages in a process termed LC3-associated phagocytosis (LAP), which occurs in the absence of immune activation23. Lastly, we found that adult cbMg display a significantly increased efficiency in the engulfment of apoptotic cells as compared to stMg. Co-incubation of acutely isolated cbMg and stMg from 3-4 month-old Cx3cr1GFP/+ mice with apoptotic Jurkat cells (Supplementary Fig 7e) resulted in increased apoptotic cell uptake by cbMg as compared to stMg (Fig. 2d, Supplementary Fig 7f).
Fig. 2. cbMg show cell clearance phenotype at the single cell, protein, and functional level.
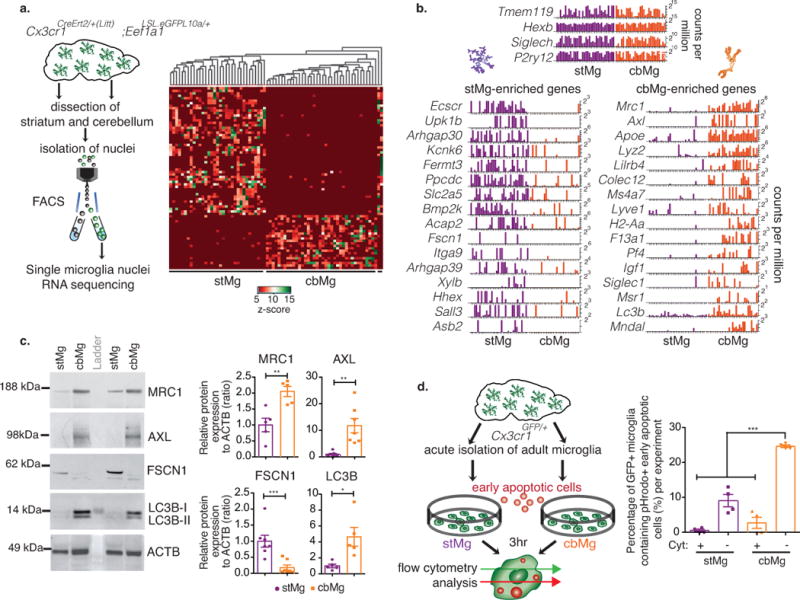
(a) Schematic showing single nuclei RNA-seq (Fluidigm C1). Heatmap with unsupervised clustering displays the variation in the expression levels (z-score) of 75 most differentially expressed genes across all single nuclei. (b) Bar graphs show normalized expression levels (counts per million) of selected genes for single stMg/cbMg nuclei. Experiment was repeated independently 2 times with similar results. (c) Western blot analysis of CD11b-bead-isolated microglia (75,000 cbMg/stMg from one mouse per lane). Representative blots (left, cropped to show the specific band); quantifications (right). ACTB is used as loading control. FSCN1: stMg: mean=1.0, SEM=0.1887; cbMg: mean=0.1792, SEM=0.08138; p=0.0018, F=5.378, t11=3.994. MRC1: stMg: mean=1.0, SEM=0.2132; cbMg: mean=2.051, SEM=0.16; p=0.0043, F=1.776, t8=3.941. AXL: stMg: mean=1.0, SEM=0.3482; cbMg: mean=11.79, SEM=2.691; p=0.0018, F=59.71, t12=3.977. LC3: stMg: mean=1.0, SEM=0.2328; cbMg: mean=4.647, SEM=1.179; p=0.0162, F=25.66, t8=3.034. Two-tailed paired t-test. n=7 animals (4 independent experiments) for FSCN1 and AXL, n=5 animals (2 independent experiments) for MRC1 and LC3. The full-length image of these blots and those of subsequent blots can be found in Supplementary Fig. 15. (d) Schematic showing phagocytosis assay of acutely isolated adult cbMg/stMg exposed to early apoptotic cells in vitro. Quantification of the percentage of GFP+ microglia that engulfed pHrodo+ early apoptotic cells in presence/absence of phagocytosis inhibitor, Cytochalasin D (Cyt) (stMg: mean=9.055, SEM=1.761; stMg+Cyt: mean= 0.5725, SEM=0.3420; cbMg: mean=24.63, SEM=0.3789; cbMg+Cyt: mean=2.720, SEM=1.589; pbrain region<0.0001, Fbrain region=53.36; pCyt<0.0001, FCyt=156.9). Two-way ANOVA (n=4 independent experiments, each using four 3/4mo Cx3cr1GFP/+ mice). Bar graphs with individual data points show mean ± SEM.
Cerebellar microglia are involved in the clearance of dying cells
The cerebellar microglia clearance phenotype, which is stably maintained during adulthood (Fig. 1d), could reflect either an inherent region-specific feature of the cbMg and/or the activation of clearance function by exposure to dying cells. While the age-dependent loss of cerebellar mass and neuronal numbers3,4 implies ongoing cell death, we could not detect dying cells in the cerebellum of adult wild-type mice. We speculated that dying cells in the cerebellum are rapidly removed by microglia. In such a scenario, one would anticipate an increase in the number of apoptotic cells in the absence of microglia. Microglia can be efficiently ablated in mice by chronic treatment with PLX5622 (PLX), a pharmacological inhibitor of the colony stimulating factor 1 receptor, CSF1R, which is required for microglia survival24. The treatment of 2-month-old wild-type mice for >3 weeks with PLX (Supplementary Fig. 8a) results in the near complete ablation of microglia (~99%) in the adult brain, including in the cerebellum and striatum (Supplementary Fig. 8b). The chronic depletion of microglia led to the accumulation of a significant number of apoptotic cells positive for cleaved Caspase 3 (cCASP3) and TUNEL in the cerebellum but not in the striatum (Fig. 3a, Supplementary Fig. 8c-e). Co-labeling with different cell type-specific markers revealed that the majority of the apoptotic cells are of neuronal origin and are distributed within all layers of the cerebellum (Supplementary Fig. 9a,b). The clearance of dying cells by microglia is further supported by a significant accumulation of cCASP3+ cells in the dentate gyrus and the olfactory bulb (Supplementary Fig. 9c,d), two brain regions displaying continuous neuronal turnover in the adult brain. At the same time, the lack of microglia did not lead to the appearance of cCASP3+ cells in the striatum or cortex (Supplementary Fig. 9c,d). In a complementary approach, we addressed the presence of apoptotic cells in the cerebellum of mice that lack TAM receptors (AXL/MERTK), which regulate apoptotic cell detection/clearance by microglia25. We found that AXL/MERTK deficiency results in the accumulation of apoptotic cCASP3+ cells in the cerebellum of adult mice (Fig. 3b), suggesting that the presence of dying cells is not caused by the loss of microglia but reflects the attenuation of microglia clearance function. These data suggest that microglia are responsible for the continuous clearance of dying cells in the cerebellum, and that the presence of dying cells may instruct the activation of cbMg clearance function.
Fig. 3. cbMg clearance phenotype is associated with exposure to dying cells.
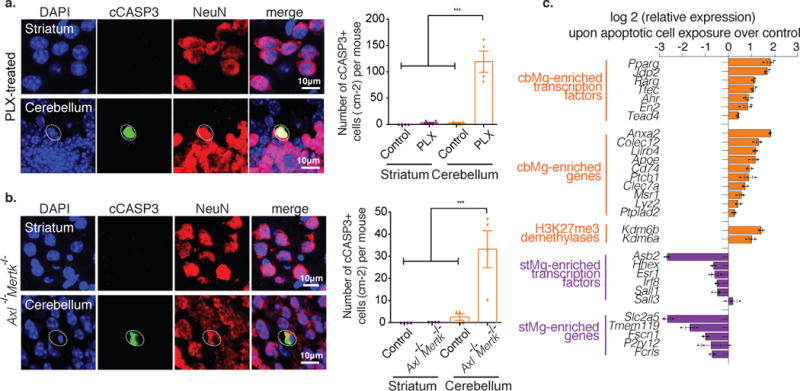
(a,b) Representative immunofluorescence images are shown (NeuN+ neurons: red; cCASP3+: green; DAPI: blue). Dotted circles: cCASP3+/NeuN+ cell. Scale: 10 μm. (a) Quantification of cCASP3+ cells per cm2 from 4mo control (striatum: mean=0, SEM=0; cerebellum: mean=2.500, SEM=1.443) or PLX-treated mice (striatum: mean=2.500, SEM=1.443; cerebellum: mean=119.2, SEM=20.02); p<0.0001, F=67.40; 14 cerebellum/striatum sections from n=4 mice/group.(b) Quantification of cCASP3+ cells per cm2 from 4/5mo control (striatum: mean=0, SEM=0; cerebellum: mean=2.500, SEM=1.443) or Axl−/−Mertk−/− mice (striatum: mean=0, SEM=0; cerebellum: mean=33.17, SEM=8.355); p=0.0003, F=14.62;12 cerebellum/striatum sections from n=4 mice/group. Bar graphs with individual data points show mean ± SEM, one-way ANOVA with Tukey’s Multiple Comparison. (c) Horizontal bar graph shows relative expression (qPCR) of selected cbMg-enriched (orange) and stMg-enriched (purple) genes in microglia after 12 hours of exposure to vehicle or early apoptotic cells. Pparg (p=0.002, t4=7.144), Jdp2 (p<0.0001, t4=15.16), Rarg (p=0.001, t4=10.16), Tfec (p<0.0001, t4=11.47); Ahr (p=0.004, t4=6.033), En2 (p=0.025, t4=3.493), Tead4 (p=0.002, t4=7.013), Anxa2 (p<0.0001, t4=36.96), Colec12 (p=0.002, t4=7.498), Lilrb4 (p<0.0001, t4=14.04), Apoe (p=0.002, t4=6.964), Cd74 (p=0.001, t4=8.070), Ptch1 (p=0.037, t4=3.066), Clec7a (p=0.015, t4=4.064), Msr1 (p=0.011, t4=4.448), Lyz2 (p=0.024, t4=3.529), Ptplad2 (p=0.009, t4=4.809), Kdm6b (p<0.0001, t4=15.33), Kdm6a (p=0.004, t4=5.871), Hhex (p=0.025, t4=3.501), Esr1 (p=0.018, t4=3.885), Irf8 (p=0.001, t4=9.580), Sall1 (p=0.139, t4=1.842), Sall3 (p=0.449, t4=0.8381), Slc2a5 (p<0.0001, t4=15.30), Asb2 (p<0.0001, t4=25.35), Tmem119 (p=0.003, t4=6.721), Fscn1 (p<0.0001, t4=18.93), P2ry12 (p=0.733, t4=0.3659), and Fcrls (p=0.001, t4=10.31). Bar graphs show mean ± SEM, two-tailed unpaired t-test, n=3 wells of primary microglia cultures obtained from four 3mo mice. Experiment was independently reproduced 4 times.
Exposure to dying cells triggers the expression of clearance genes in microglia in vitro
We found that exposure of primary forebrain microglia to apoptotic cells (Supplementary Fig. 10a) leads to the progressive induction of numerous pro-phagocytic genes that are also enriched in cbMg (Fig. 3c, Supplementary Fig. 10b). This exposure to dying cells was associated with the time-dependent induction of cbMg-enriched transcription factors (Fig. 3c, Supplementary Fig. 10c) as well as the down-regulation of stMg enriched homeostatic surveillance genes (Fig. 3c, Supplementary Fig. 10d,e) in the absence of pro-inflammatory gene activation (Supplementary Fig. 10f). Among the genes that become rapidly induced in microglia upon exposure to apoptotic cells were the cbMg-enriched Kdm6a/b, which encode histone demethylases26 (Fig. 3c, Supplementary Fig. 10g). KDM6A/B mediate the removal of the suppressive chromatin modification H3K27me3, which is associated with silenced genes26. The up-regulation of Kdm6a/b and the associated induction of clearance genes in response to apoptotic cells is reminiscent of the Kdm6a/b induction and H3K27me3 demethylation at inflammatory gene loci during macrophage activation27,28. These findings point to a possible role for H3K27me3 in modulating brain region-specific microglia clearance functions in vivo.
PRC2 controls a clearance-related gene expression program in vivo.
H3K27me3 is mediated by PRC2, which has a well-established role in the regulation of cell differentiation during development16. Similar to neurons and other cell types, microglia express all of the core components of PRC2: EZH1, EZH2, EED, and SUZ12 (data not shown). Enrichment of mRNAs encoding the H3K27me3-specific demethylases, KDM6A/B26 in cbMg (Supplementary Fig. 5b, Supplementary Table 3) as well as the up-regulation of Kdm6a/b in microglia upon exposure to dying cells in vitro (Fig. 3c, Supplementary Fig. 10g) point to the possible role of PRC2/H3K27me3 in suppressing clearance-promoting genes in stMg. The genome-wide analysis of H3K27me3 distribution in ex vivo isolated microglial nuclei (Fig. 4a) showed that the majority of transcriptionally suppressed genes in microglia are associated with H3K27me3 (Fig. 4b, Supplementary Fig. 11a). The cbMg and stMg share numerous loci targeted by H3K27me3 (Supplementary Fig. 11b,c, Supplementary Table 7). At the same time, we detected a significant stMg-specific enrichment of H3K27me3 at the transcriptional start sites of cbMg-expressed clearance genes, including Axl, Ms4a7, and Adamts18, as well as on the cbMg-enriched transcription factors, Rarg, Ahr, and Tead4 in stMg (Fig. 4c,d, Supplementary Table 7).
Fig. 4. H3K27me3 is associated with suppressed clearance genes in stMg.
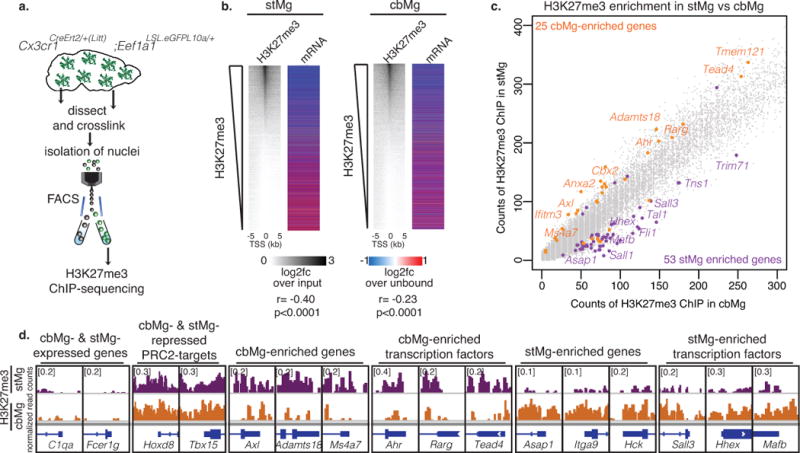
(a) Schematic showing isolation of cross-linked microglial nuclei from striatum/cerebellum for H3K27me3 ChIP-sequencing. (b) H3K27me3 enrichment at the transcriptional start site (TSS) of genes in adult stMg/cbMg is negatively correlated with stMg gene expression. Heatmaps (left) show the abundance of H3K27me3 (MACS, n=1 [25 mice]) ranked by log2 fold change (log2fc) of H3K27me3 ChIP over input in microglia nuclei at the TSS ± 5 kb of individual genes; (right) log2fc (DESeq2, n=2) of mRNAs from microglia-TRAP over their unbound fraction. stMg: p < 2.2e-16, r=-0.4002547; cbMg: p < 2.2e-16, r=-0.2161471; Pearson correlation. (c) H3K27me3 is differentially enriched at the TSS of genes in cbMg vs stMg. Scatter plot shows counts of H3K27me3 spanning the TSS ± 1kb for each gene in cbMg (x-axis) vs stMg (y-axis). cbMg- (orange) and stMg-enriched (purple) genes that are differentially enriched in H3K27me3 (MACS) in stMg and cbMg are depicted. (d) Genome browser views (IGV) of selected genes show normalized counts of H3K27me3+ chromatin at the TSS ± 1kb of the indicated genes in stMg/cbMg.
To address the role of PRC2-mediated H3K27me3 in the suppression of clearance genes, we inactivated PRC2 specifically in microglia. PRC2 inactivation was achieved by the genetic ablation of EED, a core subunit of PRC2, which is essential for complex stability and catalytic activity29. To ablate EED specifically in adult microglia, we generated and bred Eedfl/fl mice that carry a loxP flanked Eed allele (Supplementary Fig. 11d) to Cx3cr1CreErt2/+ mice to generate Cx3cr1CreErt2/+; Eedfl/fl mice (Fig. 5a). Microglia-specific Eed ablation was induced by tamoxifen treatment between 4-6 weeks of age in order to exclude any impact of PRC2 inactivation on microglia development (Fig. 5a).
Fig. 5. Selective effect of Eed inactivation on stMg and cbMg gene expression.

(a) Schematic showing microglia-specific Eed deletion in adult mice. (b) H3K27me3 levels were quantified by Western blot analysis of isolated microglial nuclei (50,000 nuclei from n=3 mice/genotype) relative to total H3 (2 independent experiments). Representative blot (left, cropped to show the specific band); quantification (right). Ratio of intensities (ImageJ) from control, Cx3cr1CreErt2/+; Eef1a1LSL.eGFPL10a/+; Eedfl/+ (mean= 0.9245, SEM=0.04116), and mutant, Cx3cr1CreErt2/+(Litt) ; Eef1a1LSL.eGFPL10a/+; Eedfl/fl mice (mean=0.01006, SEM=0.00556). p < 0.0001, F=54.90, t4=22.02. Two-tailed unpaired t-test. (c) Quantification of the number of H3K27me3+ cells from control (microglia: mean= 96.50; non-microglia: mean=89.70) and mutant mice (microglia: mean=3.500; non-microglia: mean= 90.33). > 50 cells from n=2 mice/genotype. Bar graphs with individual data points show mean ± SEM. (d) H3K27me3 (red) in YFP/GFP+ microglia (green) using immunofluorescence of brain sections (DAPI: blue). Scale: 10 μm. Representative image is shown (2 independent experiments). Dotted circles: microglial nuclei. (e) Bar graph shows number of genes up-/down-regulated in Eed-deficient stMg at 3, 6, and 9 months by TRAP (DESeq2, n=2/region/genotype). Number of H3K27me3+ genes (red) is shown. (f) Principle Component Analysis (PCA) of stMg-/cbMg-TRAP-seq of 3mo/6mo/9mo Cx3cr1CreErt2/+;Eef1a1LSLeGFPL10a/+;Eedfl/fl and control, Cx3cr1CreErt2/+; Eef1a1LSLeGFPL10a/+; Eedfl/+ mice (n=2/genotype/age). (g,h) MA plots show gene expression changes (red: up; blue: down) caused by deletion of Eed in stMg (g) and cbMg (h) of 9mo mice (DESeq2, n=2/genotype). x-axis: log2 (mean expression); y-axis: log2 (fold change). Genes in green are equally expressed. Pie charts show the GO-based categories of up-regulated genes with selected genes named.
Inactivation of Eed results in the complete and selective loss of H3K27me3 in microglia (Fig. 5b-d). We found that deficiency in Eed and the ensuing loss of H3K27me3 had no immediate impact on microglia activation but leads to rather moderate and progressive changes in stMg gene expression between 3-9 months of age (Fig. 5e,f). About 50% of the genes that become progressively up-regulated in Eed-deficient microglia are H3K27me3-positive and hence are direct PRC2 target genes (Fig. 5e, Supplementary Fig. 11e, Supplementary Table 7). The deficiency in Eed and the ensuing loss of H3K27me3 led to the up-regulation of several known PRC2 targets, such as Tbx15 and Hoxd830,31 (Fig. 5g,h, Supplementary Fig. 11f,g, Supplementary Table 8,9), but did not affect the expression of genes that define microglia lineage identity (Supplementary Fig. 11f,g, Supplementary Table 8,9) or genes characteristic of microglia pro-inflammatory activation (Supplementary Fig. 11f,g).
We found that PRC2 deficiency in stMg leads to the up-regulation of genes that support clearance-related functions (Fig. 5g, Supplementary Fig. 11f, Supplementary Table 8), including numerous cbMg-enriched genes (44/215), such as Axl, Cd74, Alox15, and Samd9l, as well as transcription factors, Rarg, Tfec, Ahr and En2 (Fig. 6a,b, Supplementary Fig. 11g, Supplementary Table 8). The loss of H3K27me3 and the up-regulation of cbMg-enriched clearance genes in Eed-deficient stMg is accompanied by a significant down-regulation of a large number of stMg signature genes (313/643) implicated in the regulation of homeostatic surveillance functions14,15 (Fig. 6a,b, Supplementary Fig. 11g, Supplementary Table 8). Most of these down-regulated genes are H3K27me3-negative and are, therefore, not directly controlled by PRC2 in stMg (Fig. 5e). The increase in clearance-associated genes and the reduction in surveillance-related genes in PRC2-deficient stMg are reminiscent of transcriptional changes observed in microglia during neurodegenerative disease11–13 (Supplementary Fig. 11h). The shift of stMg from a surveillance state toward a more clearance-promoting cbMg-like state (Fig. 6a,b), while not affecting overall microglia numbers or morphology (Fig. 6c, Supplementary Fig. 11i), is associated with a significant increase in the stMg lysosomal content (Fig. 6c).
Fig. 6. Eed deficiency in stMg induces cbMg-like clearance phenotype.
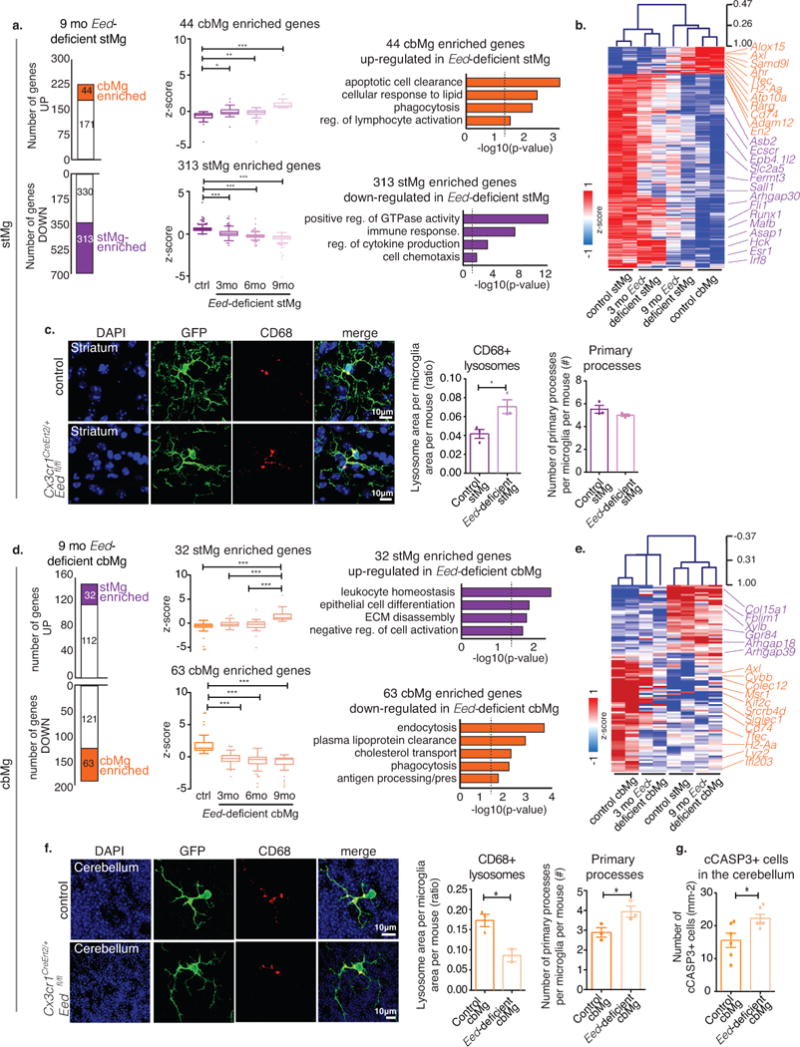
(a,d) Left: Bar graphs show number of genes up-/down-regulated in 9mo Eed-deficient stMg (a) or cbMg (d) by TRAP (DESeq2, n=2/region/genotype/age). The number of dysregulated cbMg/stMg signature genes is indicated. Middle: Box-and-whisker plots show mean relative expression of the indicated dysregulated cbMg/stMg signature genes. One-way ANOVA (Kruskal-Wallis test) with Dunn’s Multiple Comparison. Right: Selected GO annotations (Enrichr) enriched for dysregulated cbMg/stMg signature genes. y-axis: -log10 (p-value). Dotted lines: p-value=0.05. (a) 44 cbMg signature genes that are up- (ctrl: min=-4.20, 25%=-0.88, median=-0.51, 75%=-0.30, max=-0.044; 3mo: min=-2.14, 25%=-0.35, median=-0.15, 75%=0.20, max=1.73; 6mo: min=-4.20, 25%=-0.38, median=-0.11, 75%=0.09, max=0.51; 9mo: min=0.46, 25%=0.59, median=0.77, 75%= 1.15, max= 6.68; p<0.0001, F=40.99, Kruskal-Wallis statistic=106.3) and 313 stMg signature genes that are down-regulated in Eed-deficient stMg (ctrl: min=-0.03, 25%=0.44, median=0.58, 75%=0.73, max=3.77; 3mo: min=-1.37, 25%=-0.15, median=0.056, 75%=0.31, max=2.13; 6mo: min=-1.417, 25%=-0.36, median=-0.22, 75%=-0.105, max=1.84; 9mo: min=-5.639, 25%=-0.58, median=-0.39, 75%=-0.26, max= 0.22;p < 0.0001, F=487.6, KWS=820.2). (d) 32 stMg signature genes up-regulated in 9mo Eed-deficient cbMg (ctrl: min=-5.50, 25%=-0.85, median=-0.52, 75%=-0.21, max=0.60; 3mo: min=-1.36, 25%=-0.57, median=-0.28, 75%=0.16, max=1.72 ; 6mo: min=-5.08, 25%=-0.891, median=-0.24, 75%=0.24, max=2.81; 9mo: min=0.39, 25%=0.84, median=1.137, 75%=1.895, max=5.77;p < 0.0001, F=26.62, KWS=64.91) and of 63 cbMg signature genes down-regulated in 9mo Eed-deficient cbMg (ctrl: min=0.517, 25%=1.03, median=1.35, 75%=2.23, max=6.84; 3mo: min=-3.075, 25%=-0.69, median=-0.24, 75%=0.20, max=1.68; 6mo: min=-4.696, 25%=-1.065, median=-0.40, 75%=-0.07, max=1.33; 9mo: min=-4.70, 25%=-1.17, median=-0.38, 75%=-0.199, max=0.33; p < 0.0001, F=79.43, KWS=135.7). (b,e) Heatmap with hierarchical clustering distances shows the variation in the expression levels (z-score) of cbMg/stMg signature genes that are dysregulated in 3 & 9mo Eed-deficient stMg (b) or cbMg (e) with control stMg and cbMg. (c,f) CD68+ lysosome content (red) in YFP+ microglia (green) from 12-month-old control, Cx3cr1CreErt2/+;Eedfl/+, and mutant, Cx3cr1CreErt2/+;Eedfl/fl, mice (DAPI: blue). Scale: 10 μm. Representative image (left); quantification of the lysosomal area/microglia area and number of primary processes (right). (c) Lysosomal content: Control: mean= 0.04169, SEM=0.004789; mutant: mean= 0.07056, SEM= 0.007284; p=0.0296, F=2.313, t4=3.312; 18 images from n=3/genotype. Number of primary processes (control: mean=5.514, SEM=0.3433; mutant: mean=4.989, SEM=0.1060; p=0.2174, F=10.49, t4=1.462) 20-25 cells from n=3 mice/genotype. (f) Lysosome area: Control: mean=0.1728, SEM=0.01556); mutant: mean=0.08600, SEM=0.01564; p=0.0334, F=1.485, t3=3.739 (16 images from n=3/genotype). Number of primary processes: Control: mean=2.889, SEM=0.2422; mutant: mean=3.940, SEM=0.2845; p=0.0481, F=1.380, t4=2.815. 20-25 cells from n=3 mice/genotype. (g) Quantification of cCASP3+ cells in the cerebellum. Control: mean=15.56, SEM=2.169; mutant: mean=22.25, SEM=1.239; p=0.0316, F=3.064, t7=2.679. 5-8 images from n=6 mice/genotype. Two-tailed unpaired t-test unless otherwise specified. Bar graph with individual data points shows mean ± SEM. *p ≤ 0.05, **p ≤ 0.01, ***p ≤ 0.001.
In contrast to stMg, H3K27me3 is not present at clearance-related gene loci in cbMg (Fig. 4c,d). Instead, H3K27me3 in cbMg is enriched on genes that are transcriptionally active in stMg. Accordingly, loss of PRC2 in cbMg, while following a similar temporal pattern of progressive PRC2 target gene induction (Fig. 5f, Supplementary Fig. 11e), is associated with the up-regulation of selected stMg-enriched genes and the down-regulation of cbMg-enriched genes (Fig. 6d,e). The changes in PRC2-deficient cbMg gene expression patterns are associated with enhanced cbMg-ramification, a reduction in cbMg lysosomal content (Fig. 6f), and an increased number of cCASP3+ cells in the cerebellum (Fig. 6g). Collectively, our data point to a largely selective role of PRC2 in the maintenance of regional microglia specification in the adult brain, where it controls the cell-intrinsic suppression of an aberrant pro-phagocytic/clearance-like phenotype in stMg in vivo.
Aberrant expression of clearance-specific genes in striatal microglia has a negative impact on striatal neuron morphology and function
We found that the switch in PRC2-deficient stMg from the surveillance to a more clearance-promoting phenotype has a profound impact on striatal medium spiny neuron (MSN) morphology and associated behaviors. Quantitative spine analysis of MSNs revealed a significant reduction in spine numbers in mice with Eed-deficient microglia as compared to controls (Fig. 7a). Notably, changes in MSN spine numbers are not caused by the overall negative effect of Eed-deficient microglia on MSN survival. Deficiency in Eed has no effect on the overall size and morphology of the striatum (data not shown), MSN density (Supplementary Fig. 12a), or survival as defined by the presence of cCASP3+ cells (Supplementary Fig. 12b).
Fig. 7. Microglia-specific Eed deficiency alters MSN morphology and MSN-controlled behaviors in mice.
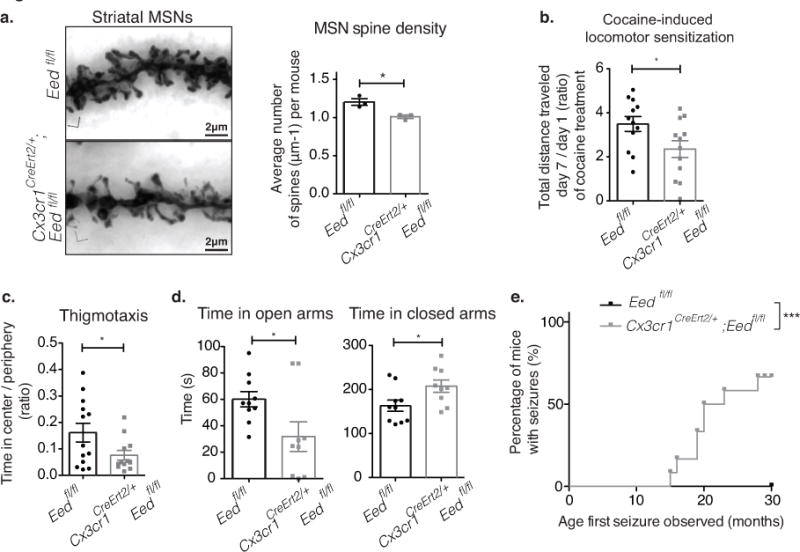
(a) Representative images of Golgi-stained neuronal processes of MSNs from 15-month-old control, Eedfl/fl, and Cx3cr1CreErt2/+;Eedfl/fl mice. Scale: 2 μm. Bar graph with individual data points shows total spine densities of MSNs of control (mean=1.205, SEM=0.04387) and mutant mice (mean= 1.009, SEM= 0.02326). p=0.0171, F=3.556, t4=3.932; 30 dendrites from n=3 mice/genotype. (b) Bar graph with individual data points shows the ratio of total distance traveled on day 7 versus day 1 of daily cocaine administration (control: mean=3.497, SEM=0.3380; mutant: mean= 2.356, SEM= 0.3833) p=0.0361, F=1.286, t22=2.232; n=12/genotype. (c) Open field analysis (thigmotaxis) shows mutant mice spend less time in the center vs periphery (mean=0.2138, SEM=0.03855) than control mice (mean=0.2714, SEM=0.03522) p=0.0459, F=4.110, t23=2.110, n=13/genotype. (d) Elevated plus maze analysis shows that mutant mice spend less time in the open arms (mean=60.09, SEM=5.765) than control mice (mean=31.77, SEM= 11.23) p=0.0279, F=3.415, MWU=18.00, SWp=0.0210; and more time in closed arms (mutant: mean=163.0, SEM=12.75; control: mean=207.5, SEM=14.09) p=0.0314, F=1.100, t17=2.346, n=10/genotype. Grubbs’ Test was used to identify and exclude an outlier. (e) Mutant mice develop seizures with age. Kaplan-Meier curve (n=12 mutant, 14 control mice; p=0.0002; χ2=13.71 log-rank Mantel–Cox test). Bar graphs with individual data points show mean ± SEM. All t-tests were two-tailed unpaired.
The changes in spine density of MSNs are associated with alterations in specific MSN-controlled behaviors. MSNs are involved in the regulation of complex behaviors that include control of motor activity, mood and reward. While Cx3cr1CreErt2/+; Eedfl/fl mice display normal motor activity at baseline (Supplementary Fig. 12c), we found a significant reduction in MSN-mediated locomotor sensitization in response to increased dopamine levels upon chronic cocaine treatment (Fig. 7b, Supplementary Fig. 12d). The induction of behavioral locomotor sensitization in response to cocaine depends on the structural plasticity of MSNs and is associated with lasting changes in MSN spine density32. PRC2 deficiency in cbMg, on the other hand, has no significant impact on cerebellar Purkinje cell spine numbers (Supplementary Fig. 12e) and cerebellum-dependent behaviors (Supplementary Fig. 12f).
Like in the striatum, we found that loss of PRC2 activity in cortical microglia (cxMg) is associated with a similar switch towards a microglia clearance phenotype (Supplementary Fig. 12g), including an increase in cxMg lysosomal content (Supplementary Fig. 12h). The changes in cxMg are associated with a reduction in cortical pyramidal neuronal spine density (Supplementary Fig. 12i) in the absence of changes to neuronal survival (Supplementary Fig. 12j).
Disorders accompanied by alterations in spine numbers, including neurodegenerative and neuropsychiatric disorders, are frequently associated with the development of anxiety and seizures33 and cognitive decline34. Accordingly, we found that loss of PRC2 activity in microglia leads to enhanced anxiety behavior in the open field (Fig. 7c, Supplementary Fig. 13a). Likewise, during an elevated plus maze paradigm, mutant mice spend significantly more time in the closed compartment and significantly less time in the more stressful open compartment as compared to their littermate controls (Fig. 7d, Supplementary Fig. 13b,c). Using both a novel object recognition task as well as a fear conditioning paradigm, mutant mice show a mild impairment in cognition and memory (Supplementary Fig. 13d,e). Furthermore, >50% of the mutant mice develop recurrent seizures with advanced age (Fig. 7e, Supplementary Fig. 13f). While young Cx3cr1CreErt2/+;Eedfl/fl and control mice did not display any notable seizure events prior to 10 months of age, we detected an increased frequency of handling-induced tonic-clonic seizure episodes in aged mutant mice (Fig. 7e, Supplementary Fig. 13f). However, the seizures did not result in premature death in the mutant mice (Supplementary Fig. 13g). Notably, the anxiety and seizure phenotypes are not observed in one-year-old wild-type mice that live in the chronic absence of microglia (continuous PLX treatment starting 1 month of age, Supplementary Fig. 13h-j), which indicates that the behavioral changes are unlikely due to a general loss of microglia function but rather reflect the aberrant microglia clearance activity in the striatum and cortex.
Discussion
The comparative analysis of microglia gene expression patterns in the striatum and cerebellum suggests the existence of two markedly different microglia phenotypes. The analysis of brain region-specific microglia heterogeneity requires a maximal approximation between the gene expression states in vivo and those obtained during various analytical procedures. We generated brain region-specific gene expression signatures of microglia by “extracting” microglial RNAs directly from mouse brain tissue. This approach is based on non-invasive Translating Ribosome-Associated Purification (TRAP) of mRNAs from specific cell types of interest19 and has several major advantages compared to the commonly used ex vivo microglia purification approaches. When comparing these approaches, we found that microglia isolation by FACS leads to the expression of numerous genes that are indicative of cell activation and that are barely detectable when measured by TRAP. In addition to the non-invasive nature of the TRAP approach, we applied a stringent bioinformatics step during data analysis that excludes genes that are not enriched in microglia as compared to the input brain tissue19 (Methods). Notably, this approach, while being well-suited to generate signatures of mRNAs enriched in microglia subpopulations in different brain areas, bears certain shortcomings as it may omit genes that are shared between microglia, neurons, astrocytes, or other cell types in the specific region. These differences should be considered when comparing data generated by TRAP to those generated from purified microglia (Supplementary Fig. 14a).
In our studies, we expanded the depth of the population-based microglia TRAP approach by using single microglia RNA sequencing analysis, which allows for further assessment of inter- and intra-populational microglia diversity. In these studies, we continued to adhere to less invasive approaches and used rapid nuclei purification from specific mouse brain regions followed by FACS-based isolation of the GFP+ microglial nuclei. We found that microglia nuclei isolation, in contrast to whole microglia cell purification, diminishes aberrant microglia activation. The cross-comparison between the microglia region-specific TRAP and single nuclei-based RNA expression patterns confirmed the distinct clearance-supporting phenotype in cbMg. Moreover, single microglia nuclei-based analysis allowed us to exclude perivascular macrophages (Cx3cr1+, Tmem119-, and P2ry12-low)35 as potential factors driving the cbMg clearance-promoting gene expression signature.
In particular, a significant fraction of the cbMg-expressed genes have been implicated in the detection, engulfment, and catabolism of debris both in peripheral macrophages carrying out cell clearance21 as well as in microglia associated with ageing and neurodegeneration11–13. Recent evidence suggests that microglia can sense and clear apoptotic cells at the earliest stages of apoptosis25. This process, often referred to as efferocytosis, is a multi-step process: (i) the recognition of “eat-me” signals presented by apoptotic cells, (ii) engulfment of cells/debris, (iii) degradation of engulfed material, and (iv) excretion of metabolic products21. The expression of numerous efferocytosis/clearance-associated genes in cbMg comprises a set that encodes transcription factors implicated in the regulation of macrophage polarization, clearance, and differentiation, including AHR36, TFEC37, and RARG38. These transcription factors are also induced upon exposure to apoptotic cells as well as in the Eed-deficient stMg, which acquire an aberrant clearance phenotype (Supplementary Fig. 14b).
Our findings suggest that the cerebellum displays relatively higher levels of cell loss as compared to the striatum or cortex. While dying cells in the adult cerebellum cannot be readily detected in the presence of microglia, we found that the ablation of microglia leads to an increase in the numbers of cCASP3+ apoptotic cells in the cerebellum. This scenario is compatible with the rapid microglia-mediated removal of dying neurons in the subventricular zone25 as well as apoptotic thymocytes during T-cell development39. While most of the newly generated neurons/T-cells undergo apoptotic cell death, the dying cells cannot be readily detected due to their rapid removal by resident macrophages/microglia25,39. Consistent with this model, microglia in the cerebellum are likely to contribute to the effective removal of dying cells. Accordingly, we found that both the deletion of microglia as well as the attenuation of their cell clearance capability are associated with the accumulation of dying cells in the cerebellum but not in the striatum or the cortex. The clearance activity of cbMg is further supported by recent live imaging data from adult mice showing significantly decreased parenchymal surveillance activity of cbMg as compared to forebrain microglia in vivo40. In parallel, we and others found that acutely isolated cbMg are significantly more efficient in the uptake of apoptotic cells or other biological materials41. Notably, while these data strongly imply the enhanced clearance activity of cbMg in the healthy brain, a comparative analysis that quantifies the levels of phagocytic activity in individual cbMg versus stMg in vivo is still needed.
We found that the cbMg-specific clearance gene expression pattern significantly overlaps with the signature of microglia associated with neurodegeneration11–13 and early brain development9,10, two stages of life characterized by enhanced neuronal attrition and heightened microglia clearance activity. In addition to the induction of cell clearance genes, the cbMg are further characterized by a significant reduction in homeostatic microglia genes14,15. This is another key characteristic feature of early microglia progenitors9,10 as well as microglia exposed to dying neurons during different diseases11–13. Notably, one of the commonalities between the three previously discussed microglia phenotypes—microglia during early development, disease-associated microglia, and cbMg—is their likely active involvement in the clearance of apoptotic cells and cellular debris. Hence, we speculate that the similarities in their gene expression profiles may be driven by the activation of a microglia clearance function in response to dying cells.
While we consider the differential exposure to dying cells as a major contributor to regional microglia specification, we cannot fully exclude the potential impact of other cues, including region-specific differences in neuronal activity, neurotransmitter release, and other microglia-recognized ligands42. However, in strong support of a causal contribution of ongoing cerebellar cell death to the induction of the cbMg clearance phenotype, we found that the exposure of forebrain microglia to dying cells in vitro leads to a progressive induction of some of the key microglia cbMg-enriched clearance genes, including Colec12, Lilrb4, and Apoe. Our findings are supported by data from Krasemann et al.13 showing an induction of selected cbMg-enriched clearance genes in cortical microglia upon injection of dead cells into the healthy mouse brain in vivo (Supplementary Fig. 14c). Overall, our data support the instructive nature of the cbMg phenotype, where continuous exposure to dying cells leads to the expression of genes that support cell clearance function. Our data also suggest that the exposure to and clearance of dying cells induces a distinct pattern of clearance-associated genes that is not intrinsically linked to the activation of pro-inflammatory genes. The lack of inflammatory gene activation in cbMg suggests that the microglia clearance activity may antagonize/suppress the activation of inflammatory genes in a fashion that has been observed in peripheral macrophages21,23. In such a scenario, active clearance of cell debris in cbMg may lead to tolerance of cbMg against self, and thereby preclude potential damaging effects of an aberrant attack by activated cbMg on healthy cerebellar neurons. Consequently, there could be a mechanistic dissociation between the induction of clearance gene expression and microglia pro-inflammatory activation observed during neurodegenerative diseases11–13, which may be mediated by additional cues from the local environment.
Our data also show that microglia clearance function, while important for the removal of dying cells, must be tightly controlled in other brain regions to avoid microglia-mediated damage of healthy neurons. We found that the transcriptional silencing of some of the clearance-related genes correlates directly with the abundance of the major suppressive histone modification H3K27me3 in stMg. The possible causal role of H3K27me3 in suppressing clearance-promoting genes in microglia is supported at several levels. First, the clearance-specific genes display negligible amounts of H3K27me3 in cbMg as compared to stMg. Moreover, exposure of forebrain microglia to dying cells in vitro increases the expression of the H3K27me3-specific demethylases, Kdm6a/b, and is associated with the progressive activation of cbMg-enriched clearance genes. While a potential demethylase-independent function of KDM6B can not be excluded43, recent studies using a small molecule-based inhibitor specifically targeting KDM6A/B demethylase activity revealed that H3K27 demethylation, and more specifically KDM6A/B catalytic activity, are critical determinants of pro-inflammatory gene activation in human primary macrophages28. Based on these data, it is plausible that clearance gene expression in microglia is controlled in a KDM6A/B/H3K27me3-dependent fashion and that the induction of clearance genes is associated with a targeted reduction in H3K27me3 levels at specific clearance gene loci in vivo.
Our data show that PRC2 plays an important role in the maintenance of region-specific functional specification of microglia. The lack of H3K27me3 leads to slow but progressive transcriptional changes in all Eed-deficient microglia subpopulations analyzed. The delay between the inactivation of PRC2 and PRC2-target gene induction in stMg, cxMg, and cbMg mimics our previous findings in neurons and is likely based on the combination of slow histone H3 protein turnover, as well as the slow catalytic activity of the H3K27me3 demethylases, KDM6A/B31. While following a similar temporal pattern, the nature of PRC2-controlled target genes differs among the microglia subpopulations. In the striatum, deficiency in Eed leads to up-regulation of specific clearance-associated genes and transcription factors. Only a small fraction of PRC2-controlled genes in stMg overlap with genes induced in PRC2-deficient cbMg or cxMg (Supplementary Fig. 14d).
Aberrant intrinsic activation of clearance phenotypes in PRC2-deficient microglia in the striatum and cortex is associated with alterations in neuronal spines. The observed microglia-mediated reduction in spine numbers resembles the patterns of spine alterations caused by pathological microglia activation in mouse models of Alzheimer’s Disease34. While PRC2-deficient stMg and cxMg show no up-regulation of complement or pro-inflammatory genes generally associated with microglia activation during neurodegeneration11–13,34, it is still plausible that their aberrant clearance activity may lead to the enhanced engulfment of C1q/C3-tagged spines, the presence of which increases with age44. Aberrant synaptic pruning might also be mediated in a complement-independent fashion by TAM receptors, which can bind exposed phosphatidylserine on synapses45. At the same time, it is possible that the reduction in spine density reflects the down-regulation of stMg-enriched surveillance genes promoting spine formation and/or maintenance in the adult brain46.
The ability of aberrant intrinsically activated microglia to cause neuronal damage is further supported by recent findings showing that cell-autonomous activation of the RAF–MEK–ERK pathway in microglia leads to the loss of synapses and the development of a severe late-onset neurodegenerative disorder7. Notably, the RAF-MEK-ERK signaling cascade has been intrinsically linked to the regulation of PRC2 activity at several levels. While the loss of PRC2 activity is associated with reduced MEK-ERK activation in ES cells47, the inhibition of MEK-ERK activity leads to attenuated PRC2 chromatin association on PRC2 target genes in these cells47. On the other hand, increased activation of the MEK-ERK pathway has been linked to Ezh2 overexpression48. Increased EZH2 expression/activity is associated with a genome-wide redistribution of H3K27me3 that includes the loss of H3K27me3 and the transcriptional activation of numerous PRC2 suppressed genes in these cells49. Furthermore, aberrantly activated EZH2 was recently found to synergistically cooperate with hyperactive BRAF in the regulation of tumorigenesis49. Therefore, it is possible that neuronal damage caused by the aberrant activation of the RAS-MEK-ERK pathway in microglia may reflect a role of this pathway in PRC2–mediated aberrant microglia clearance activity.
Our studies underscore the causal contribution of aberrant microglia clearance activation to neuronal damage and complex behavioral alterations associated with neurodegenerative and psychiatric disorders. The development of novel approaches to control microglia clearance activity via targeting specific epigenetic or signaling mechanisms may have therapeutic potential for the treatment of neurological diseases. Our studies may also have implications for the understanding of well-described brain region-specific susceptibilities to different neurodegenerative disorders. For example, the cerebellum appears to be particularly resistant to Aβ accumulation and neurodegeneration during Alzheimer’s disease50. It is tempting to speculate that the enhanced cbMg clearance activity may contribute to more efficient clearance of Aβ aggregates and damaged cells in the absence of inflammation.
Online Methods
Animals
Mice were housed at two to five animals per cage with a 12-hour light/dark cycle (lights on from 0700 to 1900 hours) at constant temperature (23°C) with ad libitum access to food and water. All animal protocols were approved by IACUC at Icahn School of Medicine at Mount Sinai and were performed in accordance with NIH guidelines.
Eef1a1LSL.eGFPL10a/+ mice51 were crossed with Cx3cr1CreErt2/+(Litt) 52, Cx3cr1CreErt2/+(Jung) 53, Tg(Prox1-Cre)SJ3954, Tg(Vav1-iCre)55, Tg(Csf1r-iCre)56, or Tg(Csf1r-Cre/Esr1*)57 mice to obtain a microglia-specific TRAP mouse model. Tg(Vav1-iCre), Tg(Csf1r-iCre), and Tg(Csf1r-Cre/Esr1*) lines were excluded due to neuronal targeting, while the Cx3cr1CreErt2/+(Jung) line was excluded due to insufficient targeting of microglia. The Cx3cr1CreErt2/+(Litt)52 line was selected for all subsequent experiments due to its highly efficient (>99% of microglia) and microglia-specific Cre expression pattern throughout the brain. This was visualized by the expression of YFP driven by an internal ribosome entry site (IRES) following the CreErt2 gene. The expression of IRES-YFP did not interfere with microglia TRAP efficiency. The Tg(Prox1-Cre)SJ39 line showed highly efficient (>99% of microglia) and exclusive microglia targeting in a limited number of brain regions, including the striatum and cerebellum. This line was used as an alternative TRAP line to ensure that region-specific gene expression changes are not caused by Cx3cr1 haplo-insufficiency in the Cx3cr1CreErt2/+(Litt) mice. Tg(Aldh1l1-eGFPL10a)58 mice were used for astrocyte TRAP. R26LSL.eYFP 59 reporter mice were used as a reporter of Cre expression. Cx3cr1GFP/+ 60 mice were used for microglia imaging, phagocytosis assay, and GFP-based isolation of microglia. Wild-type mice were used for visualization and CD11b-based isolation of microglia. Cx3cr1CreErt2/+(Jung)53, Tg(Vav1-iCre)55, Tg(Csf1r-iCre)56, Tg(Csf1r-Cre/Esr1*)57, R26LSL.eYFP 59, Cx3cr1GFP/+ 60, and wild-type C57BL/6 mice were purchased from The Jackson Laboratory (stock numbers 020940, 008610, 019098, 021024, 006148, 005582, and 000664, respectively). Eef1a1LSL.eGFPL10a/+51, Cx3cr1CreErt2/+(Litt) 52, Tg(Prox1-Cre)SJ3954, and Tg(Aldh1l1-eGFPL10a)58 mice were generously provided by A. Domingos (Instituto Gulbenkian de Ciência, PT), D. Littman (NYU School of Medicine, NY), and N. Heintz (The Rockefeller University, NY), respectively.
To achieve conditional inactivation of the Eed gene, a floxed Eed allele was generated by gene targeting in embryonic stem cells, as shown in Supplementary Figure 11c and described in detail elsewhere (A. Ebert and M. Busslinger, manuscript in preparation). In brief, exon 6 was chosen for gene deletion as a single base pair mutation in this exon was previously shown to disrupt the interaction of EED with EZH1/2 proteins, thus resulting in an Eed-null phenotype61,62. Exon 6 was extended by insertion of the remaining Eed cDNA sequence (exons 7-10) linked to a transcriptional STOP cassette consisting of six SV40 polyadenylation sites, and this extended exon was flanked by loxP recognition sequences to facilitate Cre-mediated deletion. A Gfp indicator gene linked to the 5′ part of Eed exon 6 was inserted downstream of the floxed Eed sequences in such a manner that Cre-mediated deletion leads to splicing of exon 5 to the exon 6-Gfp exon, thus resulting in the expression of a GFP fusion protein reporting gene deletion. Routine genotyping of Eedfl/fl mice was performed using following primers:
5′-GCGTTGCTTGTTTTAACCC
5′-ACTTCATCTCTGTGCCCTTCC
5′-CCACCTACACATGGGTTCTG
Wild-type band: 840 bp
Floxed band: 500 bp
To achieve microglia-specific Eed-inactivation, microglia-specific Cx3cr1CreErt2/+(Litt) 52 mice were crossed to Eedfl/fl mice to generate Cx3cr1CreErt2/+(Litt) ; Eedfl/fl mice. If not otherwise specified, Cx3cr1CreErt2/+(Litt); Eedfl/+ and Cx3cr1CreErt2/+(Litt); Eed+/+ mice have been used as controls. Cx3cr1CreErt2/+(Litt) ; Eedfl/fl mice were further crossed to Eef1a1LSL.eGFPL10a/+ mice51 to generate Cx3cr1CreErt2/+(Litt) ; Eef1a1LSL.eGFPL10a/+; Eedfl/fl mice. All mice used for experiments were backcrossed to the C57Bl/6 background for ≥ 5 generations.
To activate Tamoxifen-inducible Cre (CreErt2 or Cre/Esr1*), mice were gavaged at 4-6 weeks of age with five doses of 100 mg/kg of Tamoxifen (T5648, Sigma, St. Louis, MO) in corn oil (C8267, Sigma) with a separation of at least 48 hours between doses.
For microglia ablation, 2-month-old wild-type or Cx3cr1GFP/+ mice were treated with CSF1R inhibitor, PLX5622 (1200 mg/kg chow, Plexxikon, Berkeley, CA), or vehicle for a minimum of 60 days.
Acute isolation of microglia by fluorescence-activated cell sorting (FACS)
Isolation of microglia from adult mice was adapted from Cardona et al63. All mice were gavaged at 4-6 weeks of age with five doses of 100 mg/kg of Tamoxifen with a separation of at least 48 hours between doses. Mice were euthanized with CO2 and brain regions from Cx3cr1CreErt2/+(Litt);Eef1a1LSL.eGFPL10a/+ mice were dissected, cut into small pieces and homogenized by manual compression between 2 glass slides in Hank’s balanced salt solution (HBSS) (141175-095, Invitrogen Corporation, Carlsbad, CA) supplemented with 0.05% Collagenase D (1-088-874, Roche, Basel, CH), 25 mU/ml DNase I (Sigma), 0.5% Dispase II (165859, Roche), 10 μl/ml RNasin (N2515, Promega, Madison, WI) and Superasin (AM2694, Applied Biosystems, Waltham, MA). The digestion reaction was incubated at 37°C for 30 minutes with tituration through a 5mL pipette every 10 minutes and was stopped by addition of EDTA to a final concentration of 1mM. The homogenate was centrifuged at 2,000 × g for 7 minutes at 4°C; the pellet was resuspended in HBSS and filtered through a 100 μm mesh filter. The centrifuge step was repeated once more, and the pellet was resuspended in 70% Percoll (17-0891-02, Amersham, Amersham, UK) in phosphate-buffered saline (PBS). A 50mL Falcon tube was layered from bottom to top with the tissue in 70% Percoll, 37% Percoll and PBS in 4:3:1 ratio. The Percoll gradient was centrifuged at 2000 × g for 1 hour at 4°C in HS-4 Swinging Bucket Rotor (Life Technologies) in Sorvall™ RC 6 Plus Centrifuge (Life Technologies). The interphase containing the microglia was collected and resuspended in PBS with 2% normal goat serum supplemented with 10 μl/ml RNasin, 10 μl/ml Superasin and LIVE/DEAD® Fixable Dead Cell Stain (Life Technologies, CA). Microglia were sorted using a BD FACS Aria cell sorter (BD Biosciences, San Jose, CA, USA) by gating for high GFP signal and for low LIVE/DEAD® Fixable Dead Cell Stain. Sorted cells (50,000) were pelleted at 2,000 × g for 15 minutes at 4°C. Genomic DNA was eliminated by RNase-Free DNase Set (Qiagen) following manufacturer’s instructions prior to RNA clean-up.
Acute isolation of adult microglia by CD11b expression
Adult microglia were isolated from 3-4-month-old wild-type (for protein isolation) or Cx3cr1GFP/+ mice (for phagocytosis assay) using a protocol adapted from Bohlen et al.64 Mice were euthanized by CO2 asphyxiation, and brain regions were immediately removed. Tissue was enzymatically and mechanically dissociated using the Miltenyi neural dissociation kit (130-092-628, Miltenyi, Auburn, CA) following manufacturer’s recommendations. Myelin removal was performed using myelin removal beads II (130-096-733, Miltenyi) with LS columns (130-042-401, Miltenyi) following manufacturer’s recommendations. After myelin removal, the microglia were selected by anti-CD11b-coated microbeads (130-093-636, Miltenyi) with the QuadroMACs separator following manufacturer’s recommendations. Cells were manually counted with a hemocytometer using trypan exclusion staining and were either plated at 56,000/cm2 in a 48-well plate with DMEM supplemented with 10% FBS (Sigma F4135) and 1% Penicillin-streptomycin (Gibco 15140) for 5 hours for phagocytosis assay or pelleted and immediately frozen on dry ice for protein isolation.
Primary neonatal microglia culture
Preparation of primary neonatal microglial cultures was adapted from Saura et al65. Microglia were dissociated from mixed glial cultures by mild trypsinization. Briefly, 0.08%Trypsin-0.35mM EDTA (25200-072, Life Technologies, Somerset, NJ) in Dulbecco’s modified Eagle medium (DMEM; 31330-038, Life Technologies) was applied to mixed cultures for 35 minutes to dissociate all cells but microglia. The trypsinization was stopped by diluting the Trypsin with DMEM and immediately removing all medium on the plate. The remaining pure microglial population was incubated with 0.25%Trypsin-1mM EDTA for 10 minutes, dissociated by vigorous pipetting, resuspended in culture media, and plated at 75,000/cm2 for 24 hours in DMEM supplemented with 10% FBS and 1% Penicillin-streptomycin.
Treatment of adult or neonatal microglia cultures with early apoptotic Jurkat cells (EAJ)
The Jurkat human T cell line was obtained from ATCC (TIB-152). Cultures were regularly tested negative for mycoplasma using Lonza kit according to manufacturer’s instructions (MycoAlert LT-07). Jurkat cells were cultured in RPMI medium (Gibco 11875) supplemented with 10% FBS, 10 mM HEPES, and 1% Penicillin-streptomycin. On the day of microglia treatment, Jurkat cells were transferred to fresh growth medium at 1 million/ml and treated with 1 μM Staurosporine for 3 hours. After treatment, cells were collected and washed with 15 ml cold PBS by centrifugation at 400 × g for 10 min. Medium or PBS were discarded using pipettes. Cells were resuspended in PBS at 10 million/ml, and induction of apoptosis was verified using FITC-Annexin V/propidium iodide kit and LSR II flow cytometer (BD Biosciences). Staurosporine-treated Jurkat cells were ~70% positive for phosphatidylserine staining and ~95% negative for propidium iodide staining identifying the major population as early apoptotic (Supplementary Fig. 7e).
For gene expression analysis, EAJ were added on primary neonatal cbMg/stMg cultures (from 3-4-month-old male and female mice) that were trypsinized 24 hours earlier at 1:1 ratio for 4, 12, and 24 hours. For the phagocytosis assay, early apoptotic cells were labeled with 10 μg pHrodo Red succinimidyl ester dye (Thermo Fisher Scientific, P36600) per 106 cells for 1 hour at RT in the dark. The cells were then washed with PBS and resuspended in microglia medium at 10 million/ml. Primary microglia from the cerebellum and striatum of adult mice that were cultured for 5h were given an equal number of pHrodo-labeled EAJ. Cell confluency was determined using IncuCyte Live-Cell Analysis System and Software (Essen BioScience, Ann Arbor, Michigan, USA). Cells pretreated with 2 μM Cytochalasin D (Sigma-Aldrich, C8273) for 30 min before and during the incubation of microglia with pHrodo-EAJ were used as a negative control. After 3 hours, the supernatant was discarded and microglia were trypsinized. Pooled wells were collected in one tube, centrifuged at 400 × g for 5 min, and resuspended in 500 μl 1% BSA in PBS with 1μg/ml DAPI and placed on ice. 10,000-20,000 events were recorded on an LSR II Flow Cytometer (BD Biosciences). To quantify the uptake of pHrodo-labeled EAJ, events were gated on the SSC-A and FSC-A to exclude debris and then on GFP+ microglia to quantify the percent of GFP+/pHrodo+ cells. Data were analyzed; dot plots and histograms were generated using FCS Express 6 (De Novo Software). Per experiment, a minimum of 434 and 453 and maximum of 3672 and 3087 cells (median: 1539 and 1545) were counted from stMg and cbMg, respectively. Histogram plots were smoothed by 30% and normalized to peak value based on the number of gated cells. A two-way ANOVA was used to compare between brain regions and dead cell exposure.
Isolation of microglial nuclei by FACS
Microglial nuclei from different brain regions of 4-/8-month-old Cx3cr1CreErt2/+(Litt);Eef1a1LSL.eGFPL10a/+ (ChIP sequencing, nuclear RNA sequencing, or single nuclei RNA sequencing), 2-/3-month-old Cx3cr1CreErt2/+(Litt) ; Eef1a1LSL.eGFPL10a/+; Eedfl/fl or Cx3cr1CreErt2/+(Litt) ; Eef1a1LSL.eGFPL10a/+; Eedfl/+ (Western blotting) mice were isolated based on the eGFP-L10a fluorescence of newly formed ribosomes in the microglia nucleoli as described in Kriaucionis et al66. All mice were gavaged at 4-6 weeks of age with five doses of 100 mg/kg of Tamoxifen with a separation of at least 48 hours between doses. Briefly, mice were euthanized with CO2, and brain regions were quickly dissected and homogenized in 0.25 M sucrose, 150 mM KCl, 5 mM MgCl2, 20 mM Tricine pH 7.8 with a glass Dounce homogenizer (1984-10002, Kimble Chase, Vineland, NJ). For RNA isolation, the homogenate was unfixed and all buffers were supplemented with 10 μl/ml RNasin (Promega) and Superasin (Applied Biosystems). For chromatin immunoprecipitation, the homogenate was cross-linked with a final concentration of 1% formaldehyde for 8 min at room temperature (RT, 22–26°C) and the reaction was quenched with 0.125 M glycine for 5 min at RT. All buffers were supplemented with 0.15 mM spermine, 0.5 mM spermidine, and EDTA-free protease inhibitor cocktail (11836170001, Roche). For protein and RNA extraction, the homogenate was unfixed. The homogenate was then spun through a 29% iodixanol cushion. The resulting nuclear pellet was resuspended in 0.25 M sucrose, 150 mM KCl, 5 mM MgCl2, 20 mM Tricine pH 7.8, supplemented with 10 μM DyeCycle Ruby (V10304, Invitrogen) and 10% donkey serum (017-000-121, Jackson Immunoresearch, West Grove, PA). Microglial nuclei were sorted in a BD FACS Aria cell sorter by gating for lowest DyeCycle Ruby, which serves as an indicator of nuclei singlets, and high GFP signal. For single nuclei RNA sequencing, isolated nuclei were used immediately. For bulk nuclei sequencing (50,000), protein lysate preparation (50,000), and chromatin immunoprecipitation (500,000), nuclei were pelleted at 2,000 × g for 15 minutes at 4°C. For bulk RNA analysis, genomic DNA was eliminated using RNase-Free DNase Set (Qiagen) following manufacturer’s instructions prior to RNA clean-up.
Translating Ribosome Affinity Purification (TRAP)
This approach relies on the genetic labeling of the ribosomal protein L10a with the enhanced Green Fluorescent Protein (eGFP) in a cell type-specific fashion followed by eGFP-based immunoaffinity purification of the ribosome-associated mRNAs19,58. To generate microglia-specific TRAP mice, mice that carry a loxP-flanked STOP cassette (LSL) upstream of the eGFP-L10a gene under the control of eukaryotic translation elongation factor 1 alpha 1, Eef1a1 (Eef1a1LSL.eGFPL10a)51, were bred to mice that express the Cre recombinase under the control of the microglia-/macrophage-specific gene promoter, Cx3Cr152,53 as well as Tg(Prox1-Cre)SJ39 mice54. Tg(Prox1-Cre)SJ39 mice show microglia-specific Cre-expression in a limited number of brain regions including the striatum and cerebellum. Cx3cr1CreErt2/+(Jung);Eef1a1LSL.eGFPL10a/+, Cx3cr1CreErt2/+(Litt);Eef1a1LSL.eGFPL10a/+, and Tg(Prox1-Cre)SJ39 ; Eef1a1LSL.eGFPL10a/+ mice were used for microglia-specific TRAP, while Tg(Aldh1l1-eGFPL10a) was used for astrocyte-specific TRAP. C57Bl/6J wild-type mice were used to test for nonspecific mRNA enrichment. Cx3cr1CreErt2/+(Litt);Eef1a1LSL.eGFPL10a/+ mice were preferred for all analyses since they resulted in higher enrichment of microglial mRNA in TRAP over unbound fraction than Cx3cr1CreErt2/+(Jung);Eef1a1LSL.eGFPL10a/+ mice. Tg(Prox1-Cre)SJ39 ; Eef1a1LSL.eGFPL10a/+ mice were used to exclude any gene expression changes due to Cx3cr1 haploinsufficiency in Cx3cr1CreErt2/+(Litt);Eef1a1LSL.eGFPL10a/+ mice. For TRAP from Eed-deficient microglia, Cx3cr1CreErt2/+(Litt);Eef1a1LSL.eGFPL10a/+;Eedfl/fl mice were compared to Cx3cr1CreErt2/+(Litt);Eef1a1LSL.eGFPL10a/+;Eedfl/+ sex- and age-matched littermate controls. All mice were gavaged at 4-6 weeks of age with five doses of 100 mg/kg of Tamoxifen with a separation of at least 48 hours between doses.
Ribosome-associated mRNA from microglia or astrocytes was isolated from each region as previously described67. Briefly, mice were euthanized with CO2 at indicated ages, and brain regions of interest were dissected. All TRAP experiments —except those from the cortex— were performed using freshly isolated tissue. Cortices were frozen in liquid nitrogen and cxMg TRAP was performed on frozen tissue. Brain tissue from one mouse was immediately homogenized with a motor-driven Teflon glass homogenizer in ice-cold polysome extraction buffer (10 mM HEPES [pH 7.3], 150 mM KCl, 5 mM MgCl2, 0.5 mM dithiothreitol (Sigma) 100 μg/ml cycloheximide (Sigma), EDTA-free protease inhibitor cocktail (Roche), 10 μl/ml RNasin (Promega) and Superasin (Applied Biosystems). Homogenates were centrifuged for 10 min at 2,000 × g, 4°C, to pellet large cell debris. NP-40 (EMD Biosciences, CA) and 1,2-Diheptanoyl-sn-Glycero-3-Phosphocholine (Avanti Polar Lipids, AL) were added to the supernatant at a final concentration of 1% and 30 mM, respectively. After incubation on ice for 5 min, the lysate was centrifuged for 10 min at 13,000 × g to pellet insoluble material. Goat anti-GFP (19C8 and 19F7, Antibody & Bioresource Core Facility, Memorial Sloan-Kettering, NY)- and biotinylated Protein L (GenScript, Piscataway, NJ)-coated Streptavidin MyOne T1 Dynabeads (Invitrogen) were added to the supernatant, and the mixture was incubated at 4°C with end-over-end rotation overnight. Beads were collected on a magnetic rack and washed four times with high-salt polysome wash buffer (10 mM HEPES [pH 7.3], 350 mM KCl, 5 mM MgCl2, 1% NP-40, 0.5 mM dithiothreitol, and 100 μg/ml cycloheximide). RNA was purified from beads directly using RNeasy Mini Kit (Qiagen) following manufacturer’s instructions.
Quantitative PCR (qPCR)
Primary microglia (270,000) were lysed in Trizol (Life Technologies, CA) for 5 minutes, and phase separation was performed using chloroform. RNA was precipitated in the presence of Isopropanol, Sodium Acetate and Glycoblue (Life Technologies) at -80°C overnight. The pellet was washed with ice cold 75% Ethanol, air-dried, and resuspended in nuclease-free water. 20-30 ng RNA was used to make cDNA with High-Capacity cDNA Reverse Transcription Kit (Life Technologies) following manufacturer’s recommendations. The cDNA was used directly for qPCR with TaqMan™ Gene Expression Master Mix (Life Technologies) following manufacturer’s recommendations. Probes used are Clec7a (Mm01183349_m1), Anxa2 (Mm01150673_m1), Lilrb4 (Mm01614371_m1), Msr1 (Mm00446214_m1), Cd74 (Mm01262765_g1), Apoe (Mm00437573_m1), Ptch1 (Mm00436026_m1), Ptplad2 (Mm01267670_m1), Lyz2 (Mm01612741_m1), Colec12 (Mm01236242_m1), Ahr (Mm00478932_m1), Jdp2 (Mm00473044_m1), Rarg (Mm00441091_m1), Pparg (Mm00440940_m1), Tfec (Mm01161234_m1), Tead4 (Mm01189836_m1), En2 (Mm00438710_m1), Asb2 (Mm01329892_m1), Irf8 (Mm00492567_m1), Hhex (Mm00433954_m1), Esr1 (Mm00433149_m1), Sall1 (Mm00491266_m1), Sall3 (Mm01265835_m1), Slc2a5 (Mm00600311_m1), Fscn1 (Mm00456046_m1), Fcrls (Mm01219431_m1), Tmem119 (Mm00525305_m1), P2ry12 (Mm01950543_s1), Ifnb1 (Mm00439552_s1), Mx1 (Mm00487796_m1), Ccl2 (Mm00441242_m1), Cxcl10 (Mm00445235_m1), Tnf (Mm00443258_m1), Kdm6b (Mm01332680_m1), Kdm6a (Mm00801998_m1), Gapdh (Mm99999915_g1). Cycle counts for mRNA quantification were normalized to Gapdh. Relative expression (ΔCt) and quantification (RQ = 2^−ΔCt) for each gene were calculated. Unpaired two-tailed t-tests were used to compare biological replicates.
Bulk RNA sequencing
RNA clean-up from isolated microglial cells (50,000), TRAP samples and 5% of the unbound fractions from TRAP samples was performed using RNeasy Mini Kit (Qiagen) following manufacturer’s instructions. RNA integrity was assayed using an RNA Pico chip on a Bioanalyzer 2100 (Agilent, Santa Clara, CA), and only samples with RIN>9 were considered for subsequent analysis. Double-stranded cDNA was generated from 1-5 ng of RNA using Nugen Ovation V2 kit (NuGEN, San Carlos, CA) following manufacturer’s instructions. Fragments of 200 bp were obtained by sonicating 500 ng of cDNA per sample using the Covaris-S2 system (Duty cycle: 10%, Intensity: 5.0, Bursts per second: 200, Duration: 120 seconds, Mode: Frequency sweeping, Power: 23W, Temperature: 5.5°C - 6°C, Covaris Inc., Woburn, MA). Subsequently, these fragments were used to produce libraries for sequencing by TruSeq DNA Sample kit (Ilumina, San Diego, CA, USA) following manufacturer’s instructions. The quality of the libraries was assessed by 2200 TapeStation (Agilent). Multiplexed libraries were directly loaded on NextSeq 500 (Ilumina) with High Output single read sequencing for 75 cycles. Raw sequencing data was processed using Illumina bcl2fastq2 Conversion Software v2.17.
Bioinformatic analysis of bulk sequencing
Raw sequencing reads were mapped to the mouse genome (mm9) using the TopHat2 package (v2.1.0)68. Reads were counted using HTSeq-count (v0.6.0)69 against the Ensembl v67 annotation. The read alignment, read counting as well as quality assessment using metrics such as total mapping rate, mitochondrial and ribosomal mapping rates were done in parallel using an in-house workflow pipeline called SPEctRA70. The raw counts were processed through a variance stabilizing transformation (VST) procedure using the DESeq2 package71 to obtain transformed values that are more suitable than the raw read counts for certain data mining tasks. Principal component analysis (PCA) was performed on the top 500 most variable genes across all samples based on the VST data to visually assess if there were any outliers. Additionally, hierarchical clustering was used to assess the outliers once again to protect against false positives/negatives from PCA, and the outliers were further justified by the aforementioned quality control metrics as well as experimental metadata. After outlier removal, all pairwise comparisons were performed on the count data of entire gene transcripts using the DESeq2 package (v1.6.3)71.
For the comparison of microglia- to astrocyte-TRAP, a cutoff of adjusted p-value < 0.05 and fold change > 5, and mean expression > 30 (DESeq2; n=2 per cell type and per region; 3-6-month-old males) was applied. To represent highest expressed cell type-specific genes and a mean expression cutoff > 125 was used. To obtain the top 50 genes for these cell types, a fold change cutoff > 20 was used and top 50 gene by mean expression were shown in bar graphs. For the comparison of microglia-TRAP to isolated microglia, a cutoff of adjusted p-value < 0.05, fold change > 10, and mean expression > 30 was applied (DESeq2; n=2 per method and brain region; 3-6-month-old males). Additionally for the TRAP samples, an enrichment cutoff of p-value < 0.05 and fold change > 2 over their respective unbound fraction was applied. For microglia brain region-specific TRAP comparisons, first an enrichment cutoff of p-value < 0.05 and fold change > 2 for each TRAP group over its respective unbound fraction was applied. Then a cutoff of p-value < 0.05, fold change > 2, and mean expression > 30 between regions was applied (DESeq2; n=2/region/age; 3-month-old males, 6-month-old males, 9-month-old females). The cbMg- and stMg-enriched gene lists were generated from the comparisons of expression at 9 months of age. For analysis of microglia-TRAP from control and Eed-deficient microglia comparisons, a cutoff of p-value < 0.05, fold change > 1.5, and mean expression > 30 between genotypes was applied (DESeq2; n=2 n=2/region/age; 3-month-old males, 6-month-old males, 9-month-old females). Additionally, an enrichment cutoff of p-value < 0.05, and fold change > 2 for each TRAP sample over its unbound fraction was applied. Comparisons for Cx3cr1CreErt2/+(Litt);Eef1a1LSL.eGFPL10a/+;Eedfl/fl mice were carried out with age- and sex-matched control Cx3cr1CreErt2/+(Litt);Eef1a1LSL.eGFPL10a/+;Eedfl/+ mice. 9-month-old control mice were used in heatmaps and box-and-whisker plots. For all comparisons, non-protein-coding genes were excluded.
All of the volcano, MA and scatter plots and histograms for bulk sequencing were made using R (v3.1.1; https://www.R-project.org). For all heatmaps, expression of each gene in log2 reads per kilobase of transcript per million mapped reads, or log2 RPKM was normalized to the mean across all samples (z-scored). Heatmaps with hierarchical clustering were made on Multiple Experiment Viewer 4.8 (v.10.2; http://www.tm4.org) with Pearson Correlation by average link clustering72. Bar graphs representing RPKM of genes and box-and-whisker plots (Tukey) representing z-scored log2 RPKMs were made on GraphPad Prism v5.01 (https://www.graphpad.com). Normal distribution was assessed by the Shapiro-Wilk (SW) normality test. SW p-value was < 0.0001 for all samples. Significance between samples were calculated using Mann-Whitney U test for 2 samples and a Kruskal-Wallis test with Dunn’s multiple column comparison test for > 2 samples. Integrative Genomics Viewer traces were used to illustrate normalized counts from sequencing data. Each value was normalized to the genome average of the dataset. Gene Ontology (GO) term enrichment analysis was performed using Enrichr73,74. Selected and significantly enriched (p-value < 0.05 with BH correction) GO annotations for biological processes and are represented in bar graphs. Pie charts for functional characterization of genes were built manually using The Gene Ontology Annotation database75, Ingenuity Pathway Analysis (Qiagen), and literary search.
Analyses of previously published lists were done either using supplementary materials10,11,13,15,76 or by GEO2R (NCBI)12,41. The p-values and odds ratios of overlaps in Venn diagrams was calculated using the non-parametric χ2 test from a total 22,706 protein-coding genes analyzed in DESeq2.
Single nuclei sequencing
cDNA from single microglial nuclei (from 4-month-old female mice) was prepared using Fluidigm C1 System (Fluidigm San Francisco, CA) following manufacturer’s instructions. Briefly, a C1 Single-Cell Auto Prep IFC for mRNA-seq (5-10 μm) was primed in a Fluidigm C1 using a C1 Single-Cell Auto Prep IFC Kit according to manufacturer’s instructions and loaded with 250,000 nuclei/mL from n=4 Cx3cr1CreErt2/+(Litt);Eef1a1LSL.eGFPL10a/+ mice. The plate was investigated under Polarizing & Bright Field Microscope to record the chambers containing a single eGFP-labeled nucleus. Lysis, reverse transcription and cDNA amplification was performed overnight in Fluidigm C1 using SMARTer® Ultra™ Low RNA Kit for the Fluidigm C1™ System (Clontech, Mountain View, CA) following manufacturer’s instructions. Pools of cDNA from 96 single-nucleus chambers was harvested the following day. cDNA from 24 chambers that contained a GFP-labeled nucleus was then “tagmented”, PCR-amplified with 24 Index Primers and purified using Illumina Nextera XT DNA Sample Preparation Kit (Illumina) following manufacturer’s instructions. The quality of the library pools was assessed by 2200 TapeStation (Agilent). 24-plexed libraries were directly loaded on NextSeq 500 (Ilumina) with High Output single-read sequencing for 75 cycles. Raw sequencing data was processed by using Illumina bcl2fastq2 Conversion Software v2.17.
Bioinformatic analysis of single-nuclei sequencing
Single end cDNA .fastq files were aligned to GRCm38 (mm10) reference genome (UCSC) using STAR (2.4.0a)77. Aligned reads were mapped to mm10 genes using featureCounts from the subread package (1.4.4)78. Cells with fewer than 100,000 mapped reads were removed. We used the negative binomial (NB) model implemented in edgeR (3.10.0)79–83 for our single cell differential expression analysis to explicitly account for the sparse count matrix and the quasi-likelihood framework within edgeR to handle the pronounced variability of the single cell expression states. We kept genes that were expressed in at least one cell with at least 1 count per million (cpm), and used the relative log expression method to calculate normalization factors between samples. All cells were positive for Cx3cr1, Csf1r, Hexb, or Tmem119. Cx3cr1+ perivascular/meningeal macrophages were identified by low Tmem119, low Hexb, and high Mrc1 expression35,84 and excluded from single cell analysis (n=1-5 per plate). We included plates as covariates to account for confounding effect of individuals in the generalized linear model and performed Quasi-likelihood F-tests for hypothesis testing. Genes with FDR < 0.05 were defined as differentially expressed genes (DEG). We used Monocle (1.2.0) toolkit85 to find genes between cell types/states and cluster cell subgroups. We again filtered out genes with low expression (less than 1 read in 1 individual) and converted read counts into the summary statistic RPKM. Independent Component Analysis was carried out for dimension reduction of gene expression. DEG generated using edgeR-QL as described above were fed as guide genes to order the cells. Gene Ontology enrichment was calculated using Fisher’s exact test for DEGs in the striatum and the cerebellum single microglial nuclei. -Log10 (p-values) for each Gene Ontology annotation were plotted.
Correlation analysis between single cell RNA-seq and bulk RNA-seq was carried out as follows: Raw bulk RNA-seq reads were aligned using STAR (2.4.0a) on GRCm38 (mm10) and quantitated on genic features using feature (counts for all TRAP, FACS, nuclear RNA bulk RNA-seq samples). Differential expression analysis was performed using voom/limma86. For all genes that were in common between single cell and bulk and also significantly differentially expressed (FDR < 0.05), the Pearson correlation coefficients for the log-fold changes on the regionality contrast were computed.
Chromatin immunoprecipitation (ChIP)
ChIP was performed as previously published31 using LowCell ChIP kit (kch-maglow-G48, Diagenode, Denville, NJ). For in vivo ChIP, 500,000 fixed nuclei (1% formaldehyde for 8 min at RT and quenched with 0.125 M glycine for 5 min at RT) isolated from the striatum and the cerebellum of 25 Cx3cr1CreErt2/+(Litt);Eef1a1LSL.eGFPL10a/+ mice (6-9-month-old male and female) or 500,000 fixed nuclei isolated from the cortex of 8 Cx3cr1CreErt2/+(Litt);Eef1a1LSL.eGFPL10a/+ mice (6-9-month-old male and female mice) were used. Samples were sonicated for 13 cycles of 30 s on/30 s off at 4°C on high power to achieve fragments of sizes ranging from 200 to 500 bp with a Bioruptor (Diagenode). After removal of an input sample equivalent to 1% of each ChIP reaction, sheared chromatin was incubated with 15 μg antibody against H3K27me3 (07-449, Millipore) in the presence of protease inhibitors (Roche) overnight at 4°C. After incubation, chromatin was immunoprecipitated by 50 μl Protein G magnetic beads (kch-818-220, Diagenode) for 2 h at 4°C and immediately cleaned with the IPure kit (AL-100-0100, Diagenode) according to the manufacturer’s instructions with the addition of Proteinase K treatment (03115828001, Roche) for 1 h at 55°C after the de-crosslinking step. Immunoprecipitated chromatin was further purified with phenol:chloroform:isoamyl alcohol (25:24:1) and concentrated by ethanol precipitation. ChIP-sequencing libraries were prepared using the ChIP-Seq DNA sample preparation kit (IP-102-1001, Illumina) using an adaptor oligo dilution of 1:25 for all samples. Prepared samples were amplified onto flow cells using cBot per manufacturer protocol and sequenced on the HiSeq 2000 platform for 50 cycles. Raw sequencing data was processed by using Illumina bcl2fastq2 Conversion Software v2.17.
Bioinformatic analysis of H3K27me3 ChIP sequencing
The ChIP-seq data was first checked for quality using the various metrics generated by FastQC (v0.11.2; http://www.bioinformatics.babraham.ac.uk/projects/fastqc). Raw sequencing reads were then aligned to the mouse mm9 genome using the default settings of Bowtie (v2.2.0)87. Only uniquely mapped reads were retained, and the alignments were subsequently filtered using the SAMtools package (v0.1.19)88 to remove duplicate reads. Peak-calling was performed using MACS (v2.1.1)89 with default settings. Annotation of called peaks and differential regions to their genomic features (promoters, gene bodies, intergenic, etc) was performed using region-analysis (v0.1.2)90, and read alignment profile plots and heatmaps were generated using ngsplot (v2.47)91 and Multiple Experiment Viewer 4.8.
To select for H3K27me3-positive genes in cbMg, stMg, and cxMg, the log2 (fold change) (log2fc) of ChIP signal over the corresponding input signal was calculated for a region spanning TSS ±1 kb for each gene. A cutoff of log2fc > 0 was used to define H3K27me3-positive genes for stMg, cbMg and cxMg. To compare H3K27me3 targets between cbMg and stMg, a goodness-of-fit G-test was applied to the normalized read counts mapping within TSS ± 1 kb of each gene. A cutoff of p-value<0.05 was used to define genes differentially marked with H3K27me3 in cbMg and stMg. Correlation coefficient between H3K27me3 enrichment and TRAP-seq enrichment was calculated by “Pearson” method using R.
Protein preparation and Western blot analysis
Pellets containing 50,000 microglia nuclei or 75,000 microglia (from a 2-3-month old male or female mouse) were resuspended in 1% SDS (Ambion) supplemented with protease inhibitor (Roche), sonicated in a Bioruptor on high power 30 s on/30 s off cycles for a total of 10 cycles at 4°C and boiled for 10 min in 1× LDS sample buffer (Invitrogen) supplemented with DTT to a final concentration of 200 mM (Sigma). Lysates were separated on 4-12% NuPAGE Bis-Tris or Bolt 4-12% Bis-Tris Plus precast denaturing gels (Invitrogen) and transferred onto PVDF membranes in Mini Gel Tank at 25 V for 2 hrs. Membranes were blocked with 5% milk-TBST for 1 hr at RT. Membranes were then probed with primary antibodies diluted in 5% milk-TBST solution overnight at 4°C. Primary antibodies: AXL (1:500, sc-1097, Santa Cruz, or 1:1000, ab227871, Abcam)25, FSCN1 (1:5000, ab126772, Abcam)92, MRC1 (1:500, AF2535, R&D Systems)93, LC3B (1:1000, 2775, Cell Signaling)94, H3K27me3 (1:1000, 07-449, Millipore)31, ACTB (1:20,000, ab8227, Abcam)31, and Histone H3 (1:2,000, ab1791, Abcam)31. Membranes were then washed and probed with horseradish-peroxidase-conjugated anti- mouse (Life Technologies, 31438, 1:10,000), anti-rabbit IgG secondary antibody (GE, NA934V, 1:10,000), or anti-goat IgG antibody (Life Technologies, PI31400, 1:10,000) for 1 h at RT. Membranes were developed using enhanced chemiluminescence substrate (PerkinElmer, USA, 509049326) and exposed on film or imaged using ChemiDoc™ MP Imaging System and Image Lab software (BioRad). Exposed films were scanned, and protein bands were quantified using ImageJ Software (NIH). H3K27me3 quantities were normalized against total Histone H3 for each lane. AXL, MRC1, LC3B, and FSCN1 levels were normalized to ACTB for each lane. A paired t-test was used to compare protein levels between brain regions of individual mice. An unpaired t-test was used to compare control vs Cx3cr1CreErt2/+; Eedfl/fl mice.
Immunofluorescence
Male and female 4-/6-month-old wild-type; P7 wild-type; 2-month-old Tg(Prox1-Cre)SJ39 ; Eef1a1LSL.eGFPL10a/+, Tg(Csf1r-iCre) ; R26LSL.eYFP, Tg(Vav1-iCre) ; Eef1a1LSL.eGFPL10a/+, Tg(Csf1r-Cre/Esr1*); Eef1a1LSL.eGFPL10a/+, Cx3cr1CreErt2/+(Litt) ; Eef1a1LSL.eGFPL10a/+, Cx3cr1CreErt2/+(Jung) ; Eef1a1LSL.eGFPL10a/+; 4-month-old wild-type mice treated with PLX or control diet for 6-8 weeks; 2-/12-month-old Cx3cr1CreErt2/+; Eef1a1LSL.eGFPL10a/+; Eedfl/fl or control (Cx3cr1CreErt2/+; Eef1a1LSL.eGFPL10a/+; Eedfl/+) mice were anesthetized with ketamine (120 mg/kg) and xylazine (24 mg/kg) and perfused transcardially with 10 ml PBS and 40 ml 4% paraformaldehyde (Electron Microscopy Sciences) as previously described95. Fixed brains were removed and dehydrated in 5%, 15% and 30% sucrose in PBS. Following dehydration, brains were frozen in Neg-50 (Life Technologies) on dry ice and stored at −80°C until further processing. Brains were cut using a cryostat, and 25-μm sections were mounted on Superfrost Plus microscope slides (Fisher Scientific), which were stored at −80°C until staining. Fixed-frozen brain tissue from Axl−/−Mertk−/− mice were generously provided by Dr. G. Lemke.
Slides were washed with PBS, permeabilized with PBS + 0.2% Triton X-100 (PBST) and incubated with Image-iT FX Signal Enhancer (Invitrogen) followed by blocking with 2% normal goat serum in PBST. Slides were incubated with primary antibodies in 2% normal goat serum in PBST overnight at 4°C. Primary antibodies: GFP (1:2000, ab6556 and 1:500 ab13970 Abcam, Cambridge, MA)95,96, IBA1 (1:500, 019-19741, Wako Chemicals, Richmond, VA)97, P2RY12 (1:5000, kind gift from O. Butovsky)13, CD68 (1:250, MCA1957, Biorad, Hercules, CA)98, NeuN (1:500, MAB377, EMD Millipore, Billerica, MA)99, GFAP (1:500, G3893, Sigma)100, OLIG2 (1:250, MABN50, EMD Millipore)101, CD11b (1:1000, MCA711GT, Biorad, Hercules, CA)102, H3K27me3 (1:500, C36B11, Cell Signaling)31, CD74 (1:50, sc-5438, Santa Cruz)103, MHCII (1:200, ab23990, Abcam)104, ApoE (1:100, AB947, Millipore)13, AXL (1:100, AF854, R&D Systems)25, cCASP3 (1:400, #9661, Cell Signaling)25 and Ki67 (1:200, ab16667, Abcam)100. Slides were then washed and incubated with Alexa Fluor-conjugated secondary antibodies 1:500 in 2% normal goat serum in PBST for 1 h at RT. Secondary antibodies are Alexa Fluor 488-labeled goat anti-mouse IgGs (A32723), Alexa Fluor 488-goat anti-rat IgGs (A-11006), Alexa Fluor 488-goat anti-chicken IgYs (A-11039), Alexa Fluor 488-goat anti-rabbit IgGs (A-11008), Alexa Fluor 568-labeled goat anti-mouse IgGs (A-11004), Alexa Fluor 568-goat anti-rat IgGs (A-11077), Alexa Fluor 568-goat anti-rabbit IgGs (A-11011), Alexa Fluor 568- donkey anti-goat IgGs (A-11057), and Alexa Fluor 647-goat anti-rat IgGs (A-21247) from Life Technologies. Slides were washed and cover-slipped using Prolong Gold anti-fade with DAPI (Invitrogen) and dried overnight. For antibody staining controls, primary antibody incubation was omitted, and instead slides were incubated with Alexa Fluor-conjugated secondary antibodies (Alexa Fluor 488- and 568-labeled goat anti-mouse and goat anti-rabbit IgGs (H+L) following blocking with 2% normal goat serum in PBST.
Nissl staining was performed using NeuroTrace 500/525 Green Fluorescent Nissl Stain (Life Technologies) following manufacturer’s recommendations. Briefly, after slides were blocked, they were incubated in Nissl stain (1:200 in PBS) for 20 minutes, washed extensively, and incubated with primary antibodies. The immunofluorescence protocol was followed from then on as described above.
Imaging was performed using a Zeiss LSM 780 Confocal Microscope (Zeiss, Oberkochen, DE). 20-μm z-stack confocal images were acquired at 2-μm intervals, with 40×/1.3 oil objective at 0.6 or 1× zoom; or at 1-μm intervals, with 40×/1.3 oil objective at ~ 4× zoom. Image processing was performed using Zen 2011 software (Zeiss). Compressed z-stacked immunofluorescence images are used as representative images unless otherwise specified.
Terminal deoxynucleotidyl transferase dUTP Nick-End Labeling (TUNEL) assay with immunofluorescence
TUNEL assay with immunofluorescence was done using In Situ Cell Death Detection Kit, Fluorescein (11684795910, Sigma). Briefly, slides (prepared for immunofluorescence) from 4-month-old wild-type mice treated with PLX or control diet were washed with PBS, permeabilized with permeabilization solution: 0.1% Triton X-100 and 0.1% sodium citrate for 10 min at room temperature. Labeling was performed at 37°C for one hour. After labeling, immunofluorescence protocol was followed with anti-NeuN antibody to visualize neuronal nuclei. Single-plane images were taken under LSM780 Confocal Microscope (Zeiss) with 10× objective at 1× zoom and analyzed using Zen 2011 software.
Single molecule RNA in situ hybridization with immunofluorescence
At 6-week of age Cx3cr1GFP/+ mice were anesthetized with ketamine (120 mg/kg) and xylazine (24 mg/kg) and perfused transcardially with 10 ml PBS followed by 40mL 10% formalin in PBS. The brains were then removed and fixed in 10% neutral-buffered formalin for another 48 hours. Fixed brains were embedded in paraffin, sectioned at 5 μm, mounted on Superfrost® Plus slides (Fisher Scientific, Hampton, NH), baked in a dry oven for 1 hour at 60°C and stored at room temperature until further processing. in situ hybridization was carried out using RNAScope custom-designed probes for Mrc1, Apoe, Axl, Tfec, Ecscr, and Gpr56 in combination with the RNAScope 2.0 Red kit following the manufacturer’s recommendation (Advanced Cell Diagnostics, Newark, CA). After completing in situ hybridization before colorimetric reaction, sections were rinsed with ddH2O and a gradient concentration of PBS [0.1X-1X], blocked in 2% normal goat serum in PBS for 1 hour at room temperature and incubated with GFP antibody (1:500, ab6556, Abcam) in 2% normal goat serum in PBS overnight at 4°C. GFP signal was amplified with anti-rabbit horseradish-peroxidase-conjugated secondary antibody and Alexa Fluor® 488 tyramide from Tyramide Signal Amplification Kit (Life Technologies) following manufacturer’s instructions, and nuclei were stained with DAPI (0.2 mg/ml). Sections were then rinsed a gradient concentration of PBS [1X-0.1X], and ddH2O; subjected to colorimetric reaction; dried 15 min at 60°C, mounted using EcoMount (EM897L, Biocare Medical, Concord, CA) and dried overnight. Single-plane images were taken under LSM780 Confocal Microscope (Zeiss) with 40×/1.3 oil objective at 0.6× zoom for quantification and > 4× for visualization and analyzed using Zen 2011 software. Single plane images were also used as representative images.
Imaging quantification
The percent area of CD68 (lysosomes), CD74, MHCII, ApoE, AXL, IBA1, P2RY12, or GFP/YFP in brain sections from 4-/6-month-old wild-type and Cx3cr1GFP/+ or 12-month-old Cx3cr1CreErt2/+; Eedfl/+ and Cx3cr1CreErt2/+; Eedfl/fl mice was determined with ImageJ (National Institutes of Health) using the following image processing steps: (i) A binary image was created from the raw single-channel images; and (ii) ‘Measure’ function was used to determine the percentage area coverage of CD68, ApoE, AXL, CD74, MHCII, GFP/YFP, IBA1, CD11b, or P2RY12 (5-11 images from n=2-3 mice). Percent area covered by a single microglia was calculated by dividing the percent area covered by microglia in an image by the total number of microglia in the same image. 20-μm z-stacked confocal images taken with with 40×/1.3 oil objective at 1× zoom were analyzed.
DAPI+ lysosomes in microglia from 4-/6-month-old wild-type mice were measured from 20-μm z-stacked confocal images taken with with 40×/1.3 oil objective at 1× zoom with Imaris (Bitplane, UK) using the following image processing steps: (i) microglia and lysosomes were reconstructed in 3D; (ii) DAPI signal outside the microglia surface was excluded; (iii) masked DAPI channel was reconstructed in 3D; and (iv) microglia with overlapping lysosome and DAPI surface were manually counted to exclude microglial nuclei (>200 cells per region from n=3 mice).
Microglia cell bodies from wild-type, Cx3cr1CreErt2/+; Eedfl/fl and control mice were counted manually from 3-6 20-μm z-stacked confocal images taken with 40×/1.3 oil objective at 0.6× zoom from n=3 mice per condition. cCASP3+, TUNEL+, and Ki67+ cells were counted manually from olfactory bulb, striatum, somatosensory cortex, dentate gyrus, and cerebellum of 3-5 brain sections of n=3-4 control, PLX-treated, and/or Axl−/−Mertk−/− mice. Cells that have cell somas filled cCASP3 and have pyknotic nuclei were counted as cCASP3-positive. Cells that have cell nuclei filled with Ki67 were counted as Ki67-positive. H3K27me3+ cells were counted from 197-284 GFP- and 50-55 GFP+ cells from n=2 mice per genotype. Counting for RNA in situ hybridization was done manually (50-73 cells from n=2 mice).
20-μm z-stacked confocal images taken with with 40×/1.3 oil objective at 1× zoom from n=3-6 mice per condition were reconstructed using Imaris software and DAPI+, CD68+, and 200 IBA1+ microglia counted manually from n=3 wild type mice.
Percentage of NeuN+ cells was determined with ImageJ (National Institutes of Health) using the following image processing steps: (i) DAPI stained nuclei were segmented by automated thresholding and particle analysis; (ii) each nucleus was then selected using the magic wand and transferred onto the NeuN-stained image by restore selection; (iii) fluorescence intensity for each cell was measured and tabulated, and percentage of NeuN+ cells was calculated using a mean intensity threshold > 15 (5-6 images from n=2-3 mice).
Morphological analysis of microglia
20 μm z-stack images were obtained from 4-/6-month-old wild-type mice or 12-month-old Cx3cr1CreErt2/+; Eedfl/+ and Cx3cr1CreErt2/+; Eedfl/fl mice on a Zeiss LSM780 Confocal Microscope with 40×/1.3 oil objective at 1× zoom at 2um intervals and collapsed into 2D images. Neurolucida Explorer (MBF Bioscience, Williston, VT USA) was used to manually trace and generate analyses of microglia from the striatum and cerebellum. One microglial cell was selected per 0.045 um2 image. The cell body and soma were traced, and the thickness of each process was adjusted along its length. The number of primary processes and number of branch tips were measured. To account for a cell’s complexity, Sholl analyses were performed for each cell. Concentric circles were spaced 10 micrometers apart originating from the soma, and intersections of each cell with concentric circles were measured. n=5 control animals were used for brain region comparisons; n=3 mice/genotype were used to compare 15-month-old control and Cx3cr1CreErt2/+; Eedfl/fl mice.
Golgi analysis
Coronal brain sections of 15-month-old male Cx3cr1CreErt2/+; Eedfl/fl mice and their respective littermate controls were stained using the FD Rapid GolgiStain™ Kit (FD NeuroTechnologies, Inc., Ellicott City, MD) following manufacturer’s recommendations. 200 μm sections were cut in 70% EtOH on a vibratome (Leica). All sections were visualized on a Zeiss Apotome 2 Microscope (Carl Zeiss, Thornwood, NY) and 30 dendrites from n=3 mice for each genotype were analyzed using Neurolucida360 (MBF Bioscience).
Statistical analysis of imaging data
Gender ratios and ages were matched within control and treatment groups. For the comparisons of brain regions, a paired t-test was performed to compare two groups and a one-way ANOVA was used for comparisons with more than two groups. For control vs Cx3cr1CreErt2/+; Eedfl/fl mice comparisons, an unpaired t-test was performed.
Behavioral analyses
All behavioral analyses were performed during the 0700–1900 light cycle as previously described31,105,106. All subjects correspond to data points within two standard deviations from the sample mean, and no subjects were excluded from the behavioral analyses. For all behavioral experiments, a mixed population of males and females with sex- and age-matched corresponding littermate control animals were used. All mice were gavaged at 4-6 weeks of age with five doses of 100 mg/kg of Tamoxifen with a separation of at least 48 hours between doses. A cohort of Cx3cr1CreErt2/+ and their respective Cx3cr1+/+ wild-type littermate controls were tested on selected behavior paradigms to exclude potential behavioral alterations due to Cx3cr1 haploinsufficiency in Cx3cr1CreErt2/+; Eedfl/fl mice. No randomization protocol was used. Animals were allocated to treatment groups to ensure uniform distribution of ages and sexes in each group. All procedures were conducted in strict accordance with the National Institutes of Health Guide for the Care and Use of Laboratory Animals and were approved by the IACUC at Icahn School of Medicine at Mount Sinai.
Open field analysis
Locomotion and exploratory behavior for 3-month-old (n=5/genotype) and 15-month-old (n=12/genotype) Cx3cr1CreErt2/+; Eedfl/fl mice and their Cx3cr1+/+; Eedfl/fl littermate controls; 12-month-old PLX-treated or control mice (n=8 & 13, respectively) was analyzed by open field analysis as previously described95. For thigmotaxis, a 2×2 section in an 8×8 grid was designated as “center” and the rest “periphery”. The ratio of time spent in center versus periphery in the first 10 minutes was analyzed.
Rotarod analysis
Balance and motor function of 3-month-old Cx3cr1CreErt2/+; Eedfl/fl mice and their respective littermate controls (n=5/genotype), and 15-month-old Cx3cr1CreErt2/+; Eedfl/fl mice and their respective littermate controls (n=11 control and 7 mutant mice) were measured using the standard accelerated rotarod test (Med Associates, St. Albans, VT) with a rotation speed of 4 - 40 rpm within 5 min. Scoring using Rota-Rod Software and analysis was carried out as in Schaefer et al.95.
Cocaine induced locomotor sensitization
1.5 year-old Cx3cr1CreErt2/+; Eedfl/fl, and their respective littermate controls (n=12/genotype) were habituated in the locomotor activity apparatus (clear plexiglas 40 × 40 × 30 cm open-field arena) for 30 min then injected intraperitoneally with 10 mg/kg cocaine (Sigma, dissolved in 0.9% saline) and were placed back into the apparatus for 60 min after injections. Activity in the open-field was quantified by a computer-operated Photobeam activity system (AccuScan Instruments, Columbus, OH). Mice were recorded for the total distance moved (cm), number of vertical episodes (rearing), and distance moved in the center of the arena (cm). Data were collected at 5-10-min intervals over 90 min test sessions. Protocol was repeated with 48 hour intervals. The ratio of total distance traveled on day 7 of cocaine treatment over total distance on day 1 is used for representation.
Elevated Plus Maze
The elevated plus maze test was used to determine the unconditioned response to a potentially dangerous environment. Anxiety-related behavior was measured by the degree to which the rodent avoided the open arms of the maze. 3-month-old Cx3cr1CreErt2/+; Eedfl/fl and their respective littermate controls (n=4 control, 5 mutant mice); 15-month-old Cx3cr1CreErt2/+; Eedfl/fl and their respective littermate controls (n=10/genotype); 15-month-old Cx3cr1CreErt2/+ and their respective littermate controls (n = 8 control, 9 mutant mice); or 12-month-old chronic PLX-treated or control mice (n=10 per group) were placed at the junction of the elevated 4-arm maze in which 2 arms are open and 2 are enclosed. The number of times the animal entered each of the arms and the time spent in each arm was recorded for 5 min by the EthoVision video-tracking system (Noldus Information Technology Inc., Leesburg, VA). Total arm entries, percentage of open arm entries, and percentage of time spent in the open arms were calculated.
Novel object recognition
15-month-old Cx3cr1CreErt2/+; Eedfl/fl and their respective littermate controls (n=10/genotype); or 15-month-old Cx3cr1CreErt2/+ and their respective littermate controls (n=9/genotype) were given two habituation sessions in which they were allowed to explore the apparatus (without objects) for 10 min. On the object trial, the mouse was placed into the box with two identical objects and allowed to explore for 10 min (training). The time spent by the animal exploring each object and also the time spent by the animal exploring both objects and the box were measured by the EthoVision video-tracking system (Noldus Information Technology Inc., Leesburg, VA). The mouse was then removed to its home cage and 1 h after the training it was placed in the box for the retention test and allowed to explore the objects for 10 min with one of the objects the same as used for training and a novel object.
Fear Conditioning
In a standard fear conditioning paradigm (Med Associates), the test chamber (neutral context) was made of clear Plexiglas. The bottom of the test chamber was a grid floor used to deliver a mild electric foot shock. The test chamber was placed inside a sound-attenuated chamber. One mouse was placed in the test chamber (house lights on) and allowed to explore freely for 200 sec. A white noise (80 dB), which served as the conditioned stimulus, was then presented for 18 sec, followed by a mild (2 sec, 0.5 mA) foot shock, which served as the unconditioned stimulus. The same sequence of auditory cue-shock pairing was repeated two more times with 2-minute intervals. The mouse was removed from the chamber 30 sec later and returned to its home cage. Freezing behavior was recorded every 10 sec during the time spent in the test chamber. Chambers were cleaned with ethanol between experiments. 24 hours later, the mouse was placed back into the test chamber for 3 min, and the presence of freezing behavior was recorded (context test). Two hours later, the mouse was tested for its freezing response to the auditory cue. Environmental and contextual cues were changed for the auditory cue test: a white Plexiglas circular insert was placed in the chamber to alter its shape, spatial cues and color; the wire grid floor was covered with white Plexiglas; and the chamber was wiped with isopropanol to alter the smell. The auditory cue test was divided into two phases. During the first phase, freezing behavior was recorded for 99 sec in the absence of the auditory cue. In the second phase, the auditory cue was turned on, and freezing was recorded for another 60 sec. The number of freezing intervals for each test was measured by Video Freeze Software (Med Associates) and converted to a percentage of freezing value per component time. 15-month-old Cx3cr1CreErt2/+; Eedfl/fl and their respective littermate controls (n=11 control and 10 mutant) were tested.
Seizure and survival curves
Frequency of seizure episodes were counted at magnitudes of stage 4-5 of the modified Racine’s seizure scoring system107 in aged Cx3cr1CreErt2/+; Eedfl/fl mice, in Cx3cr1CreErt2/+ mice, and in PLX-treated mice in response to handling or exposure to novel environments. Dates of first observed seizure in the home cage for each individual Cx3cr1CreErt2/+; Eedfl/fl mice and their respective littermate controls (n=12 mutants and n=14 controls), Cx3cr1CreErt2/+ mice and their respective littermate controls (n=9/genotype), or PLX- and control diet-treated mice (n=15 per group) were recorded and plotted as Kaplan-Meier curves. Dates of death in the home cage for Cx3cr1CreErt2/+; Eedfl/fl and their respective littermate controls (n=28/genotype) were recorded and plotted as Kaplan-Meier survival curves.
Statistical analysis of behavior data
For two-group comparisons with equal variance as determined by the F-test, an unpaired Student’s t test was used. For the analysis of novel object recognition paradigm, a two-tailed paired t-test was used. For the analysis of accelerated rotarod analysis and locomotor sensitization, a two-way ANOVA with repeated measures was used. For seizure and survival curves, a log-rank Mantel–Cox test was used. All behavior data except rotarod, locomotor sensitization, and seizure/survival curves were represented as bar graphs with individual data points with mean ± standard error of mean (SEM). Rotarod and locomotor sensitization data were represented with mean ± SEM. Seizure and survival data were represented as Kaplan-Meier curve.
Statistical analysis
No statistical methods were used to pre-determine sample sizes but our sample sizes are similar to those reported in previous publications19,31,95,99,108. The data collection was randomized for all experiments. Experimenters were blinded during imaging and behavioral experiments. Gene expression and protein analyses were not performed blind to the conditions of the experiments. Statistics were analyzed using GraphPad Prism v5.01, and significance was determined at p-value < 0.05. Normal distribution was assessed by the Shapiro-Wilk (SW) normality test. Grubbs’ test was used to identify outliers. Variance was determined by the F-test. All statistical analyses were two-tailed. Normally distributed data with unequal variance was analyzed with Welch’s correction. Not normally distributed data was analyzed by Mann-Whitney U test. For two-group comparisons with equal variance a paired or unpaired Student’s t test was used and clearly indicated in Methods and Figure Legends.
Reporting Summary
Further information on experimental design is available in the Life Sciences Reporting Summary linked to this article.
Code availability
All code used in this manuscript has been previously published, is described in the Methods section, and is also available from the corresponding author upon reasonable request.
Data availability
The data that support the findings of this study are available from the corresponding author upon reasonable request.
Accession Codes
Sequence data can be downloaded from the National Center for Biotechnology Information Gene Expression Omnibus Accession #GSE108356.
Supplementary Material
Acknowledgments
We would like to thank D. Littman (NYU School of Medicine, NY) for Cx3cr1CreErt2/+(Litt) mice; N. Heintz (Rockefeller University, NY) for Tg(Prox1-Cre)SJ39 and Tg(Aldh1l1-eGFPL10a) mice; A. Domingos (Instituto Gulbenkian de Ciência, PT) and J. Friedman (Rockefeller University, NY) for Eef1a1LSL.eGFPL10a/+ mice; G. Lemke (Salk Institute, CA) for brain tissue from Axl−/−Mertk−/− mice; the Flow Cytometry CoRE at Icahn School of Medicine for cytometry assistance; I. Lemischka (Icahn School of Medicine, NY) for Fluidigm C1 use; O. Butovsky (Harvard Medical School, MA) for P2RY12 antibody; and JW. Murray for ImageJ automation. We are very grateful to D. Schafer, E. Marcora, A. Tarakhovsky, JW. Murray and all Schaefer lab and Ronald M. Loeb Center members for helpful discussions and comments on the manuscript. We apologize to authors whose works we could not cite due to space limitations.
This work was supported by the National Institutes of Health (NIH) Director New Innovator Award DP2 MH100012-01 (A.S.), R01NS091574 (A.S.), R21 MH115353 (A.S.), 1 RF1 AG054011-01 (A.M.G. and A.S.), JPB Foundation (A.M.G.), NARSAD Young Investigator Award #25065 (P.A.), Boehringer Ingelheim and the Austrian Industrial Research Promotion Agency FFG-852936 (M.B.), T32AG049688 (A.B.), F30MH106293 (J.R.S), Ruth L. Kirschstein NRSA fellowship F31MH111147 (J.M.S).
Footnotes
Author Contributions:
P.A. and A.S. designed the study. P.A. did in vivo molecular & imaging experiments. A.B. and P.A ran behavioral experiments. A.A.P., P.A., A.S., and A.M.G. designed and H.J.S., M.K.D., A.A.P., A.B., and P.A. performed the in vitro experiments. S.E.M. and A.B. did morphological analyses. H.J.S., M.K.D., B.R.R., S.E.M., J.M.S., and A.C. performed immunoblotting. Y.-H.E.L., I.P., and L.S. performed bioinformatics for bulk RNA and ChIP sequencing. J.R.R. and B.L. analyzed single nuclei sequencing data. A.E. and M.B. generated the Eedfl/fl mouse. A.S. and P.A. wrote the manuscript. All authors discussed results and provided input on the manuscript.
Competing Interests:
A.M.G. receives financial compensation as an advisory board member for Denali Therapeutics (a biotechnology company focused on the discovery and development of therapies for patients with neurodegenerative diseases.
References
- 1.Dickstein DL, Weaver CM, Luebke JI, Hof PR. Dendritic spine changes associated with normal aging. Neuroscience. 2013;251:21–32. doi: 10.1016/j.neuroscience.2012.09.077. [DOI] [PMC free article] [PubMed] [Google Scholar]
- 2.O’Banion MK, Coleman PD, Callahan LM. Regional neuronal loss in aging and Alzheimer’s disease: a brief review. Seminars in Neuroscience. 1994;6:307–314. doi: 10.1006/smns.1994.1039. [DOI] [Google Scholar]
- 3.Woodruff-Pak DS, et al. Differential effects and rates of normal aging in cerebellum and hippocampus. Proceedings of the National Academy of Sciences. 2010;107:1624–1629. doi: 10.1073/pnas.0914207107. [DOI] [PMC free article] [PubMed] [Google Scholar]
- 4.Morterá P, Herculano-Houzel S. Age-related neuronal loss in the rat brain starts at the end of adolescence. Frontiers in Neuroanatomy. 2012;6:45. doi: 10.3389/fnana.2012.00045. [DOI] [PMC free article] [PubMed] [Google Scholar]
- 5.Mensah PL. Stability of large cell-medium cell clusters in the mature neostriatum. Experimental Brain Research. 1982;47:57–60. doi: 10.1007/BF00235886. [DOI] [PubMed] [Google Scholar]
- 6.Neumann H, Kotter MR, Franklin RJM. Debris clearance by microglia: an essential link between degeneration and regeneration. Brain. 2009;132:288–295. doi: 10.1093/brain/awn109. [DOI] [PMC free article] [PubMed] [Google Scholar]
- 7.Mass E, et al. A somatic mutation in erythro-myeloid progenitors causes neurodegenerative disease. Nature. 2017;549:389. doi: 10.1038/nature23672. https://www.nature.com/articles/nature23672#supplementary-information. [DOI] [PMC free article] [PubMed] [Google Scholar]
- 8.Zhao X, et al. Noninflammatory Changes of Microglia Are Sufficient to Cause Epilepsy. Cell Reports. 2018;22:2080–2093. doi: 10.1016/j.celrep.2018.02.004. [DOI] [PMC free article] [PubMed] [Google Scholar]
- 9.Mass E, et al. Specification of tissue-resident macrophages during organogenesis. Science. 2016 doi: 10.1126/science.aaf4238. [DOI] [PMC free article] [PubMed] [Google Scholar]
- 10.Matcovitch-Natan O, et al. Microglia development follows a stepwise program to regulate brain homeostasis. Science. 2016 doi: 10.1126/science.aad8670. [DOI] [PubMed] [Google Scholar]
- 11.Mathys H, et al. Temporal Tracking of Microglia Activation in Neurodegeneration at Single-Cell Resolution. Cell Reports. 21:366–380. doi: 10.1016/j.celrep.2017.09.039. [DOI] [PMC free article] [PubMed] [Google Scholar]
- 12.Wang Y, et al. TREM2 Lipid Sensing Sustains the Microglial Response in an Alzheimer’s Disease Model. Cell. 2015;160:1061–1071. doi: 10.1016/j.cell.2015.01.049. [DOI] [PMC free article] [PubMed] [Google Scholar]
- 13.Krasemann S, et al. The TREM2-APOE Pathway Drives the Transcriptional Phenotype of Dysfunctional Microglia in Neurodegenerative Diseases. Immunity. 2017;47:566–5813.e569. doi: 10.1016/j.immuni.2017.08.008. [DOI] [PMC free article] [PubMed] [Google Scholar]
- 14.Butovsky O, et al. Identification of a unique TGF-β-dependent molecular and functional signature in microglia. Nat Neurosci. 2014;17 doi: 10.1038/nn.3599. [DOI] [PMC free article] [PubMed] [Google Scholar]
- 15.Buttgereit A, et al. Sall1 is a transcriptional regulator defining microglia identity and function. Nat Immunol. 2016;17:1397–1406. doi: 10.1038/ni.3585. http://www.nature.com/ni/journal/v17/n12/abs/ni.3585.html#supplementary-information. [DOI] [PubMed] [Google Scholar]
- 16.Margueron R, Reinberg D. The Polycomb complex PRC2 and its mark in life. Nature. 2011;469:343–349. doi: 10.1038/nature09784. [DOI] [PMC free article] [PubMed] [Google Scholar]
- 17.Cunningham CL, Martínez-Cerdeño V, Noctor SC. Microglia regulate the number of neural precursor cells in the developing cerebral cortex. The Journal of neuroscience : the official journal of the Society for Neuroscience. 2013;33:4216–4233. doi: 10.1523/JNEUROSCI.3441-12.2013. [DOI] [PMC free article] [PubMed] [Google Scholar]
- 18.Song J, Olsen RHJ, Sun J, Ming G-L, Song H. Neuronal Circuitry Mechanisms Regulating Adult Mammalian Neurogenesis. Cold Spring Harbor perspectives in biology. 2016;8:a018937. doi: 10.1101/cshperspect.a018937. [DOI] [PMC free article] [PubMed] [Google Scholar]
- 19.Heiman M, et al. A Translational Profiling Approach for the Molecular Characterization of CNS Cell Types. Cell. 2008;135:738–748. doi: 10.1016/j.cell.2008.10.028. [DOI] [PMC free article] [PubMed] [Google Scholar]
- 20.Madry C, Attwell D. Receptors, Ion Channels, and Signaling Mechanisms Underlying Microglial Dynamics. The Journal of Biological Chemistry. 2015;290:12443–12450. doi: 10.1074/jbc.R115.637157. [DOI] [PMC free article] [PubMed] [Google Scholar]
- 21.Blander JM. The many ways tissue phagocytes respond to dying cells. Immunological Reviews. 2017;277:158–173. doi: 10.1111/imr.12537. [DOI] [PMC free article] [PubMed] [Google Scholar]
- 22.Galluzzi L, et al. Molecular definitions of autophagy and related processes. The EMBO Journal. 2017;36:1811–1836. doi: 10.15252/embj.201796697. [DOI] [PMC free article] [PubMed] [Google Scholar]
- 23.Heckmann BL, Boada-Romero E, Cunha LD, Magne J, Green DR. LC3-Associated Phagocytosis Inflammation. Journal of Molecular Biology. 2017;429:3561–3576. doi: 10.1016/j.jmb.2017.08.012. [DOI] [PMC free article] [PubMed] [Google Scholar]
- 24.Elmore MRP, et al. Colony-stimulating factor 1 receptor signaling is necessary for microglia viability, unmasking a microglia progenitor cell in the adult brain. Neuron. 2014;82 doi: 10.1016/j.neuron.2014.02.040. [DOI] [PMC free article] [PubMed] [Google Scholar]
- 25.Fourgeaud L, et al. TAM receptors regulate multiple features of microglial physiology. Nature. 2016;532:240–244. doi: 10.1038/nature17630. [DOI] [PMC free article] [PubMed] [Google Scholar]
- 26.Swigut T, Wysocka J. H3K27 Demethylases, at Long Last. Cell. 131:29–32. doi: 10.1016/j.cell.2007.09.026. [DOI] [PubMed] [Google Scholar]
- 27.De Santa F, et al. The Histone H3 Lysine-27 Demethylase Jmjd3 Links Inflammation to Inhibition of Polycomb-Mediated Gene Silencing. Cell. 2007;130:1083–1094. doi: 10.1016/j.cell.2007.08.019. [DOI] [PubMed] [Google Scholar]
- 28.Kruidenier L, et al. A selective jumonji H3K27 demethylase inhibitor modulates the proinflammatory macrophage response. Nature. 2012;488:404. doi: 10.1038/nature11262. https://www.nature.com/articles/nature11262#supplementary-information. [DOI] [PMC free article] [PubMed] [Google Scholar]
- 29.Montgomery ND, et al. The Murine Polycomb Group Protein Eed Is Required for Global Histone H3 Lysine-27 Methylation. Current Biology. 2005;15:942–947. doi: 10.1016/j.cub.2005.04.051. [DOI] [PubMed] [Google Scholar]
- 30.Jadhav U, et al. Acquired Tissue-Specific Promoter Bivalency Is a Basis for PRC2 Necessity in Adult Cells. Cell. 165:1389–1400. doi: 10.1016/j.cell.2016.04.031. [DOI] [PMC free article] [PubMed] [Google Scholar]
- 31.von Schimmelmann M, et al. Polycomb repressive complex 2 (PRC2) silences genes responsible for neurodegeneration. Nat Neurosci. 2016;19:1321–1330. doi: 10.1038/nn.4360. http://www.nature.com/neuro/journal/v19/n10/abs/nn.4360.html#supplementary-information. [DOI] [PMC free article] [PubMed] [Google Scholar]
- 32.Nestler EJ. The Neurobiology of Cocaine Addiction. Science & Practice Perspectives. 2005;3:4–10. doi: 10.1151/spp05314. [DOI] [PMC free article] [PubMed] [Google Scholar]
- 33.Friedman D, Honig LS, Scarmeas N. Seizures and Epilepsy in Alzheimer’s Disease. CNS Neuroscience & Therapeutics. 2012;18:285–294. doi: 10.1111/j.1755-5949.2011.00251.x. [DOI] [PMC free article] [PubMed] [Google Scholar]
- 34.Hong S, et al. Complement and microglia mediate early synapse loss in Alzheimer mouse models. Science. 2016 doi: 10.1126/science.aad8373. [DOI] [PMC free article] [PubMed] [Google Scholar]
- 35.Goldmann T, et al. Origin, fate and dynamics of macrophages at central nervous system interfaces. Nat Immunol. 2016;17:797–805. doi: 10.1038/ni.3423. http://www.nature.com/ni/journal/v17/n7/abs/ni.3423.html#supplementary-information. [DOI] [PMC free article] [PubMed] [Google Scholar]
- 36.Rothhammer V, et al. Microglial control of astrocytes in response to microbial metabolites. Nature. 2018;557:724–728. doi: 10.1038/s41586-018-0119-x. [DOI] [PMC free article] [PubMed] [Google Scholar]
- 37.Rehli M, et al. Transcription Factor Tfec Contributes to the IL-4-Inducible Expression of a Small Group of Genes in Mouse Macrophages Including the Granulocyte Colony-Stimulating Factor Receptor. The Journal of Immunology. 2005;174:7111–7122. doi: 10.4049/jimmunol.174.11.7111. [DOI] [PubMed] [Google Scholar]
- 38.Rőszer T, Menéndez-Gutiérrez MP, Cedenilla M, Ricote M. Retinoid X receptors in macrophage biology. Trends in Endocrinology & Metabolism. 24:460–468. doi: 10.1016/j.tem.2013.04.004. [DOI] [PubMed] [Google Scholar]
- 39.Dzhagalov IL, Chen KG, Herzmark P, Robey EA. Elimination of Self-Reactive T Cells in the Thymus: A Timeline for Negative Selection. PLoS Biology. 2013;11:e1001566. doi: 10.1371/journal.pbio.1001566. [DOI] [PMC free article] [PubMed] [Google Scholar]
- 40.Stowell RD, et al. Cerebellar microglia are dynamically unique and survey Purkinje neurons in vivo. Developmental Neurobiology. :n/a–n/a. doi: 10.1002/dneu.22572. [DOI] [PMC free article] [PubMed] [Google Scholar]
- 41.Grabert K, et al. Microglial brain region-dependent diversity and selective regional sensitivities to aging. Nat Neurosci. 2016;19:504–516. doi: 10.1038/nn.4222. http://www.nature.com/neuro/journal/v19/n3/abs/nn.4222.html#supplementary-information. [DOI] [PMC free article] [PubMed] [Google Scholar]
- 42.Wei S, et al. Functional overlap but differential expression of CSF-1 and IL-34 in their CSF-1 receptor-mediated regulation of myeloid cells. Journal of Leukocyte Biology. 2010;88:495–505. doi: 10.1189/jlb.1209822. [DOI] [PMC free article] [PubMed] [Google Scholar]
- 43.Przanowski P, et al. The signal transducers Stat1 and Stat3 and their novel target Jmjd3 drive the expression of inflammatory genes in microglia. Journal of Molecular Medicine (Berlin, Germany) 2014;92:239–254. doi: 10.1007/s00109-013-1090-5. [DOI] [PMC free article] [PubMed] [Google Scholar]
- 44.Stephan AH, et al. A Dramatic Increase of C1q Protein in the CNS during Normal Aging. The Journal of Neuroscience. 2013;33:13460–13474. doi: 10.1523/JNEUROSCI.1333-13.2013. [DOI] [PMC free article] [PubMed] [Google Scholar]
- 45.Györffy BA, et al. Local apoptotic-like mechanisms underlie complement-mediated synaptic pruning. Proceedings of the National Academy of Sciences. 2018 doi: 10.1073/pnas.1722613115. [DOI] [PMC free article] [PubMed] [Google Scholar]
- 46.Paolicelli RC, Ferretti MT. Function and Dysfunction of Microglia during Brain Development: Consequences for Synapses and Neural Circuits. Frontiers in Synaptic Neuroscience. 2017;9 doi: 10.3389/fnsyn.2017.00009. [DOI] [PMC free article] [PubMed] [Google Scholar]
- 47.Tee WW, Shen Steven S, Oksuz O, Narendra V, Reinberg D. Erk1/2 Activity Promotes Chromatin Features and RNAPII Phosphorylation at Developmental Promoters in Mouse ESCs. Cell. 2014;156:678–690. doi: 10.1016/j.cell.2014.01.009. [DOI] [PMC free article] [PubMed] [Google Scholar]
- 48.Fujii S, et al. RAS oncogenic signal upregulates EZH2 in pancreatic cancer. Biochemical and Biophysical Research Communications. 2012;417:1074–1079. doi: 10.1016/j.bbrc.2011.12.099. [DOI] [PubMed] [Google Scholar]
- 49.Souroullas GP, et al. An oncogenic Ezh2 mutation induces tumors through global redistribution of histone 3 lysine 27 trimethylation. Nature Medicine. 2016;22:632. doi: 10.1038/nm.4092. https://www.nature.com/articles/nm.4092#supplementary-information. [DOI] [PMC free article] [PubMed] [Google Scholar]
- 50.DR T, U R, M O, H B. Phases of A beta-deposition in the human brain and its relevance for the development of AD. Neurology. 2002;58 doi: 10.1212/wnl.58.12.1791. [DOI] [PubMed] [Google Scholar]
- 51.Stanley S, et al. Profiling of Glucose-Sensing Neurons Reveals that GHRH Neurons Are Activated by Hypoglycemia. Cell Metabolism. 2013;18:596–607. doi: 10.1016/j.cmet.2013.09.002. [DOI] [PubMed] [Google Scholar]
- 52.Parkhurst Christopher N, et al. Microglia Promote Learning-Dependent Synapse Formation through Brain-Derived Neurotrophic Factor. Cell. 2013;155:1596–1609. doi: 10.1016/j.cell.2013.11.030. [DOI] [PMC free article] [PubMed] [Google Scholar]
- 53.Yona S, et al. Fate Mapping Reveals Origins and Dynamics of Monocytes and Tissue Macrophages under Homeostasis. Immunity. 2013;38:79–91. doi: 10.1016/j.immuni.2012.12.001. [DOI] [PMC free article] [PubMed] [Google Scholar]
- 54.The Gene GENSAT, Nervous Expression. System Atlas (GENSAT) Project, NINDS Contracts N01NS02331 & HHSN271200723701C to. The Rockefeller University; New York, NY: 2003. [Google Scholar]
- 55.de Boer J, et al. Transgenic mice with hematopoietic and lymphoid specific expression of Cre. European Journal of Immunology. 2003;33:314–325. doi: 10.1002/immu.200310005. [DOI] [PubMed] [Google Scholar]
- 56.Deng L, et al. A Novel Mouse Model of Inflammatory Bowel Disease Links Mammalian Target of Rapamycin-Dependent Hyperproliferation of Colonic Epithelium to Inflammation-Associated Tumorigenesis. The American Journal of Pathology. 2010;176:952–967. doi: 10.2353/ajpath.2010.090622. [DOI] [PMC free article] [PubMed] [Google Scholar]
- 57.Qian BZ, et al. CCL2 recruits inflammatory monocytes to facilitate breast-tumour metastasis. Nature. 2011;475:222–225. doi: 10.1038/nature10138. doi: http://www.nature.com/nature/journal/v475/n7355/abs/nature10138-f1.2.html#supplementary-information. [DOI] [PMC free article] [PubMed] [Google Scholar]
- 58.Doyle JP, et al. Application of a Translational Profiling Approach for the Comparative Analysis of CNS Cell Types. Cell. 2008;135:749–762. doi: 10.1016/j.cell.2008.10.029. [DOI] [PMC free article] [PubMed] [Google Scholar]
- 59.Srinivas S, et al. Cre reporter strains produced by targeted insertion of EYFP and ECFP into the ROSA26 locus. BMC Developmental Biology. 2001;1:4–4. doi: 10.1186/1471-213X-1-4. [DOI] [PMC free article] [PubMed] [Google Scholar]
- 60.Jung S, et al. Analysis of Fractalkine Receptor CX3CR1 Function by Targeted Deletion and Green Fluorescent Protein Reporter Gene Insertion. Molecular and Cellular Biology. 2000;20:4106–4114. doi: 10.1128/mcb.20.11.4106-4114.2000. [DOI] [PMC free article] [PubMed] [Google Scholar]
- 61.Schumacher AFC, Magnuson T. Positional cloning of a global regulator of anterior-posterior patterning in mice. Nature. 1996;384:648. doi: 10.1038/384648a0. [DOI] [PubMed] [Google Scholar]
- 62.Denisenko O, Shnyreva M, Suzuki H, Bomsztyk K. Point Mutations in the WD40 Domain of Eed Block Its Interaction with Ezh2. Molecular and Cellular Biology. 1998;18:5634–5642. doi: 10.1128/mcb.18.10.5634. [DOI] [PMC free article] [PubMed] [Google Scholar]
- 63.Cardona AE, et al. Control of microglial neurotoxicity by the fractalkine receptor. Nat Neurosci. 2006;9:917–924. doi: 10.1038/nn1715. doi: http://www.nature.com/neuro/journal/v9/n7/suppinfo/nn1715_S1.html. [DOI] [PubMed] [Google Scholar]
- 64.Bohlen CJ, et al. Diverse Requirements for Microglial Survival, Specification, and Function Revealed by Defined-Medium Cultures. Neuron. 2017;94:759–773.e758. doi: 10.1016/j.neuron.2017.04.043. [DOI] [PMC free article] [PubMed] [Google Scholar]
- 65.Saura J, Tusell JM, Serratosa J. High-yield isolation of murine microglia by mild trypsinization. Glia. 2003;44:183–189. doi: 10.1002/glia.10274. [DOI] [PubMed] [Google Scholar]
- 66.Kriaucionis S, Heintz N. The Nuclear DNA Base 5-Hydroxymethylcytosine Is Present in Purkinje Neurons and the Brain. Science. 2009;324:929–930. doi: 10.1126/science.1169786. [DOI] [PMC free article] [PubMed] [Google Scholar]
- 67.Heiman M, Kulicke R, Fenster RJ, Greengard P, Heintz N. Cell type–specific mRNA purification by translating ribosome affinity purification (TRAP) Nat Protocols. 2014;9:1282–1291. doi: 10.1038/nprot.2014.085. [DOI] [PMC free article] [PubMed] [Google Scholar]
- 68.Kim D, Salzberg SL. TopHat-Fusion: an algorithm for discovery of novel fusion transcripts. Genome Biol. 2011;12 doi: 10.1186/gb-2011-12-8-r72. [DOI] [PMC free article] [PubMed] [Google Scholar]
- 69.Anders S, Pyl PT, Huber W. HTSeq—a Python framework to work with high-throughput sequencing data. Bioinformatics. 2014;31:166–169. doi: 10.1093/bioinformatics/btu638. [DOI] [PMC free article] [PubMed] [Google Scholar]
- 70.Purushothaman I, Shen L. SPEctRA: First stable release. Zenodo. 2016 [Google Scholar]
- 71.Love MI, Huber W, Anders S. Moderated estimation of fold change and dispersion for RNA-seq data with DESeq2. Genome Biology. 2014;15:550. doi: 10.1186/s13059-014-0550-8. [DOI] [PMC free article] [PubMed] [Google Scholar]
- 72.Howe EA, Sinha R, Schlauch D, Quackenbush J. RNA-Seq analysis in MeV. Bioinformatics. 2011;27:3209–3210. doi: 10.1093/bioinformatics/btr490. [DOI] [PMC free article] [PubMed] [Google Scholar]
- 73.Chen EY, et al. Enrichr: interactive and collaborative HTML5 gene list enrichment analysis tool. BMC Bioinformatics. 2013;14:128. doi: 10.1186/1471-2105-14-128. [DOI] [PMC free article] [PubMed] [Google Scholar]
- 74.Kuleshov MV, et al. Enrichr: a comprehensive gene set enrichment analysis web server 2016 update. Nucleic Acids Research. 2016;44:W90–W97. doi: 10.1093/nar/gkw377. [DOI] [PMC free article] [PubMed] [Google Scholar]
- 75.Huntley RP, et al. The GOA database: Gene Ontology annotation updates for 2015. Nucleic Acids Research. 2015;43:D1057–D1063. doi: 10.1093/nar/gku1113. [DOI] [PMC free article] [PubMed] [Google Scholar]
- 76.Holtman IR, et al. Induction of a common microglia gene expression signature by aging and neurodegenerative conditions: a co-expression meta-analysis. Acta Neuropathologica Communications. 2015;3:31. doi: 10.1186/s40478-015-0203-5. [DOI] [PMC free article] [PubMed] [Google Scholar]
- 77.Dobin A, et al. STAR: ultrafast universal RNA-seq aligner. Bioinformatics. 2013;29:15–21. doi: 10.1093/bioinformatics/bts635. [DOI] [PMC free article] [PubMed] [Google Scholar]
- 78.Liao Y, Smyth GK, Shi W. FeatureCounts: an efficient general purpose program for assigning sequence reads to genomic features. Bioinformatics. 2014;30 doi: 10.1093/bioinformatics/btt656. [DOI] [PubMed] [Google Scholar]
- 79.Robinson MD, Smyth GK. Small-sample estimation of negative binomial dispersion, with applications to SAGE data. Biostatistics. 2007;9 doi: 10.1093/biostatistics/kxm030. [DOI] [PubMed] [Google Scholar]
- 80.Robinson MD, Smyth GK. Moderated statistical tests for assessing differences in tag abundance. Bioinformatics. 2007;23:2881–2887. doi: 10.1093/bioinformatics/btm453. [DOI] [PubMed] [Google Scholar]
- 81.Robinson MD, McCarthy DJ, Smyth GL. EdgeR: a Bioconductor package for differential expression analysis of digital gene expression data. Bioinformatics. 2010;26:139–140. doi: 10.1093/bioinformatics/btp616. [DOI] [PMC free article] [PubMed] [Google Scholar]
- 82.McCarthy DJ, Chen Y, Smyth GK. Differential expression analysis of multifactor RNA-Seq experiments with respect to biological variation. Nucleic Acids Research. 2012;40:4288–4297. doi: 10.1093/nar/gks042. [DOI] [PMC free article] [PubMed] [Google Scholar]
- 83.Zhou X, Lindsay H, Robinson MD. Robustly detecting differential expression in RNA sequencing data using observation weights. Nucleic Acids Research. 2014;42:e91–e91. doi: 10.1093/nar/gku310. [DOI] [PMC free article] [PubMed] [Google Scholar]
- 84.Bennett ML, et al. New tools for studying microglia in the mouse and human CNS. Proceedings of the National Academy of Sciences. 2016 doi: 10.1073/pnas.1525528113. [DOI] [PMC free article] [PubMed] [Google Scholar]
- 85.Trapnell C, et al. The dynamics and regulators of cell fate decisions are revealed by pseudotemporal ordering of single cells. Nat Biotech. 2014;32:381–386. doi: 10.1038/nbt.2859. http://www.nature.com/nbt/journal/v32/n4/abs/nbt.2859.html#supplementary-information. [DOI] [PMC free article] [PubMed] [Google Scholar]
- 86.Ritchie ME, et al. Limma powers differential expression analyses for RNA-sequencing and microarray studies. Nucleic Acids Research. 2015;43:e47–e47. doi: 10.1093/nar/gkv007. [DOI] [PMC free article] [PubMed] [Google Scholar]
- 87.Langmead B, Trapnell C, Pop M, Salzberg SL. Ultrafast and memory-efficient alignment of short DNA sequences to the human genome. Genome Biol. 2009;10 doi: 10.1186/gb-2009-10-3-r25. [DOI] [PMC free article] [PubMed] [Google Scholar]
- 88.Li H, et al. The Sequence Alignment/Map format and SAMtools. Bioinformatics. 2009;25:2078–2079. doi: 10.1093/bioinformatics/btp352. [DOI] [PMC free article] [PubMed] [Google Scholar]
- 89.Zhang Y, et al. Model-based Analysis of ChIP-Seq (MACS) Genome Biology. 2008;9:R137. doi: 10.1186/gb-2008-9-9-r137. [DOI] [PMC free article] [PubMed] [Google Scholar]
- 90.Shao NY, Loh YHE, Shen L. Region-analysis: A Python program for genomic interval annotations. Github repository Zenodo. 2016 [Google Scholar]
- 91.Shen L, Shao N, Liu X, Nestler E. Ngs.plot: Quick mining and visualization of next-generation sequencing data by integrating genomic databases. BMC Genomics. 2014;15:284. doi: 10.1186/1471-2164-15-284. [DOI] [PMC free article] [PubMed] [Google Scholar]
- 92.Liu Z, et al. Fscn1 is required for the trafficking of TGF-β family type I receptors during endoderm formation. Nature Communications. 2016;7:12603. doi: 10.1038/ncomms12603. [DOI] [PMC free article] [PubMed] [Google Scholar]
- 93.Liu X, et al. Salidroside provides neuroprotection by modulating microglial polarization after cerebral ischemia. Journal of Neuroinflammation. 2018;15:39. doi: 10.1186/s12974-018-1081-0. [DOI] [PMC free article] [PubMed] [Google Scholar]
- 94.Willén K, et al. Aβ accumulation causes MVB enlargement and is modelled by dominant negative VPS4A. Molecular Neurodegeneration. 2017;12:61. doi: 10.1186/s13024-017-0203-y. [DOI] [PMC free article] [PubMed] [Google Scholar]
- 95.Schaefer A, et al. Control of Cognition and Adaptive Behavior by the GLP/G9a Epigenetic Suppressor Complex. Neuron. 2009;64:678–691. doi: 10.1016/j.neuron.2009.11.019. [DOI] [PMC free article] [PubMed] [Google Scholar]
- 96.Paolino A, Fenlon LR, Kozulin P, Richards LJ, Suárez R. Multiple events of gene manipulation via in pouch electroporation in a marsupial model of mammalian forebrain development. Journal of Neuroscience Methods. 2018;293:45–52. doi: 10.1016/j.jneumeth.2017.09.004. [DOI] [PubMed] [Google Scholar]
- 97.Miyamoto A, et al. Microglia contact induces synapse formation in developing somatosensory cortex. Nature Communications. 2016;7:12540. doi: 10.1038/ncomms12540. [DOI] [PMC free article] [PubMed] [Google Scholar]
- 98.Tufail Y, et al. Phosphatidylserine Exposure Controls Viral Innate Immune Responses by Microglia. Neuron. 2017;93:574–586.e578. doi: 10.1016/j.neuron.2016.12.021. [DOI] [PMC free article] [PubMed] [Google Scholar]
- 99.Schaefer A, et al. Cerebellar neurodegeneration in the absence of microRNAs. The Journal of Experimental Medicine. 2007;204:1553–1558. doi: 10.1084/jem.20070823. [DOI] [PMC free article] [PubMed] [Google Scholar]
- 100.LeComte MD, Shimada IS, Sherwin C, Spees JL. Notch1-STAT3–ETBR signaling axis controls reactive astrocyte proliferation after brain injury. Proceedings of the National Academy of Sciences. 2015;112:8726–8731. doi: 10.1073/pnas.1501029112. [DOI] [PMC free article] [PubMed] [Google Scholar]
- 101.Moyon S, et al. Functional characterization of DNA methylation in the oligodendrocyte lineage. Cell reports. 2016;15:748–760. doi: 10.1016/j.celrep.2016.03.060. [DOI] [PMC free article] [PubMed] [Google Scholar]
- 102.Bisht K, et al. Dark microglia: A new phenotype predominantly associated with pathological states. Glia. 2016;64:826–839. doi: 10.1002/glia.22966. [DOI] [PMC free article] [PubMed] [Google Scholar]
- 103.Hui S, et al. Attenuation of atherosclerotic lesions in diabetic apolipoprotein E-deficient mice using gene silencing of macrophage migration inhibitory factor. Journal of Cellular and Molecular Medicine. 2015;19:836–849. doi: 10.1111/jcmm.12521. [DOI] [PMC free article] [PubMed] [Google Scholar]
- 104.Kohno H, et al. Photoreceptor Proteins Initiate Microglial Activation via Toll-like Receptor 4 in Retinal Degeneration Mediated by All-trans-retinal. The Journal of Biological Chemistry. 2013;288:15326–15341. doi: 10.1074/jbc.M112.448712. [DOI] [PMC free article] [PubMed] [Google Scholar]
- 105.Tan CL, et al. MicroRNA-128 Governs Neuronal Excitability and Motor Behavior in Mice. Science. 2013;342:1254–1258. doi: 10.1126/science.1244193. [DOI] [PMC free article] [PubMed] [Google Scholar]
- 106.Sullivan JM, et al. Autism-like syndrome is induced by pharmacological suppression of BET proteins in young mice. The Journal of Experimental Medicine. 2015;212:1771–1781. doi: 10.1084/jem.20151271. [DOI] [PMC free article] [PubMed] [Google Scholar]
- 107.Racine RJ. Modification of seizure activity by electrical stimulation: II. Motor seizure. Electroencephalography and Clinical Neurophysiology. 1972;32:281–294. doi: 10.1016/0013-4694(72)90177-0. [DOI] [PubMed] [Google Scholar]
- 108.Maze I, et al. Essential Role of the Histone Methyltransferase G9a in Cocaine-Induced Plasticity. Science. 2010;327 doi: 10.1126/science.1179438. [DOI] [PMC free article] [PubMed] [Google Scholar]
Associated Data
This section collects any data citations, data availability statements, or supplementary materials included in this article.
Supplementary Materials
Data Availability Statement
The data that support the findings of this study are available from the corresponding author upon reasonable request.