

Abstract
Background:
Accurate survival stratification in early-stage non–small cell lung cancer (NSCLC) could inform the use of adjuvant therapy. We developed a clinically implementable mortality risk score incorporating distinct tumor microenvironmental gene expression signatures and clinical variables.
Methods:
Gene expression profiles from 1106 nonsquamous NSCLCs were used for generation and internal validation of a nine-gene molecular prognostic index (MPI). A quantitative polymerase chain reaction (qPCR) assay was developed and validated on an independent cohort of formalin-fixed paraffin-embedded (FFPE) tissues (n = 98). A prognostic score using clinical variables was generated using Surveillance, Epidemiology, and End Results data and combined with the MPI. All statistical tests for survival were two-sided.
Results:
The MPI stratified stage I patients into prognostic categories in three microarray and one FFPE qPCR validation cohorts (HR = 2.99, 95% CI = 1.55 to 5.76, P < .001 in stage IA patients of the largest microarray validation cohort; HR = 3.95, 95% CI = 1.24 to 12.64, P = .01 in stage IA of the qPCR cohort). Prognostic genes were expressed in distinct tumor cell subpopulations, and genes implicated in proliferation and stem cells portended poor outcomes, while genes involved in normal lung differentiation and immune infiltration were associated with superior survival. Integrating the MPI with clinical variables conferred greatest prognostic power (HR = 3.43, 95% CI = 2.18 to 5.39, P < .001 in stage I patients of the largest microarray cohort; HR = 3.99, 95% CI = 1.67 to 9.56, P < .001 in stage I patients of the qPCR cohort). Finally, the MPI was prognostic irrespective of somatic alterations in EGFR, KRAS, TP53, and ALK.
Conclusion:
The MPI incorporates genes expressed in the tumor and its microenvironment and can be implemented clinically using qPCR assays on FFPE tissues. A composite model integrating the MPI with clinical variables provides the most accurate risk stratification.
Lung cancer is the leading global cause of cancer death, and non–small cell lung cancer (NSCLC) accounts for approximately 85% of all lung cancers (1). Even when diagnosed in early stages, surgical resection cures only approximately 60% of patients, with the predominant mode of failure being distant recurrence (2,3). Currently, most patients with stage I NSCLC do not receive adjuvant systemic treatment after local therapy because several randomized studies have failed to show a benefit in unselected patients (4–6). Adjuvant treatment would ideally be administered to groups at highest risk of disease recurrence and death (5). While a variety of clinical (7–9), pathological (10–13), and molecular/biological (14–19) features have been proposed for risk stratification, no method has been incorporated into routine clinical practice.
Gene expression profiles have been shown to provide prognostic information in a variety of cancers (20–22). Successful applications of expression profiling have yielded clinical tools with potential value for oncologists, for example for breast cancer (23,24), colon cancer (25,26), prostate cancer (27), and non-Hodgkin’s lymphoma (21,28). Various studies have proposed tools for prognostication in early-stage NSCLC (16–18). However, efforts to translate gene expression–based methods into clinical use have met a number of pitfalls, including overfitting, lack of sufficient validation, interpatient histological heterogeneity, intratumoral heterogeneity, and lack of accounting for existing clinical variables (17,18). The use of expression profiles to identify high-risk groups has proven especially challenging within stage I NSCLC (17).
An influx of publicly available expression profiles of lung cancer tissues has accelerated biomarker identification and validation (17,29,30). Integration across studies can identify robust pan-cancer and cancer-specific prognostic expression markers and identify cell subsets influencing outcomes (31). Here, we pooled multiple datasets to derive a molecular prognostic index (MPI) for stage I nonsquamous NSCLC that reflects multiple distinct aspects of tumor heterogeneity, including the tumor microenvironment. To facilitate clinical implementation, we developed and validated a quantitative real-time polymerase chain reaction (qPCR) assay readily applicable to routinely obtained formalin-fixed, paraffin-embedded (FFPE) tumor specimens. We integrated the MPI with clinical and pathological variables to determine a composite risk model (CRM), enabling individualized risk prediction that leverages both molecular and clinical characteristics.
Methods
Patients
Four cohorts of nonsquamous NSCLC patients were included: a cohort of merged, publicly available tumor gene expression profiles; a cohort of archived FFPE tumor specimens; a cohort with fresh tumor samples for cell sorting and whole transcriptome sequencing; and a Surveillance, Epidemiology, and End Results (SEER) database cohort. All aspects of this study were institutional review board approved prior to its initiation in accordance with the Declaration of Helsinki guidelines for the ethical conduct of research. All patients gave written, informed consent. Our study followed the Institute of Medicine report on translational omics and the Reporting Recommendations for Tumour Marker Prognostic Studies (REMARK) checklist (Supplementary Table 1, available online) (32,33).
Lung Cancer Gene Expression Datasets
We identified seven datasets (Supplementary Table 2, available online) comprising gene expression profiles of NSCLC patients for which survival data were annotated, from the Prediction of Clinical Outcomes from Genomics (PRECOG) database (31). Measurements from different platforms were combined into one meta-cohort (n = 1106) for analysis using the correlation structure of the underlying microarray data for normalization and standardization (Supplementary Methods, available online; deposited in Gene Expression Omnibus under accession GSE67639 with clinical annotations) and split into training/validation sets balanced for size and risk profiles (Table 1). Data were obtained from two additional external microarray cohorts not included in the meta-cohort (GSE30219, GSE50081) (Table 1) (34,35). Mutational statuses of ALK, KRAS, EGFR, and TP53 were obtained from the original studies where available.
Table 1.
Clinical features of the cohorts of NSCLC patients included for training, testing, and validation of the molecular prognostic index
| Variable | Meta-cohort microarray training set No. (%) |
Meta-cohort microarray validation set No. (%) |
GSE50081 microarray validation set No. (%) |
GSE30219 microarray validation set No. (%) |
qPCR validation set No. (%) |
|---|---|---|---|---|---|
| Tissue type | Fresh/frozen | Fresh/frozen | Fresh/frozen | Fresh/frozen | FFPE |
| Platform | Microarrays | Microarrays | Microarrays | Microarrays | qPCR |
| No. of samples | 563 | 543 | 138 | 216 | 98 |
| Median age, y (range) | 63 (22–87) | 62 (34–88) | 70 (40–86) | 61 (15–84) | 71 (44–87) |
| Male | 261 (49.4) | 259 (51.5) | 73 (52.9) | 181 (83.8) | 34 (34.7) |
| Female | 267 (50.6) | 244 (49.5) | 65 (47.1) | 35 (16.2) | 64 (65.3) |
| Stage IA | 169 (34.7) | 175 (37.1) | 40 (28.9) | 106 (49.8) | 63 (64.3) |
| Stage IB | 188 (38.7) | 166 (35.2) | 60 (43.5) | 34 (16.0) | 23 (23.5) |
| Stage IIA | 21 (4.3) | 15 (3.2) | 7 (5.1) | 9 (4.2) | 7 (7.1) |
| Stage IIB | 51 (10.5) | 61 (12.9) | 31 (22.5) | 19 (8.9) | 5 (5.1) |
| Stage IIIA | 43 (8.8) | 40 (8.5) | 0 | 27 (12.7) | 0 |
| Stage IIIB | 9 (1.9) | 10 (2.1) | 0 | 12 (5.6) | 0 |
| Stage IV | 5 (1.0) | 5 (1.1) | 0 | 6 (2.8) | 0 |
| Current smoker | 35 (11.5) | 33 (10.4) | 42 (33.6) | 134 (46.7) | - |
| Ever smoker* | 52 (17.1) | 59 (18.7) | - | - | - |
| Former smoker | 135 (44.4) | 141 (44.6) | 60 (48.0) | 128 (44.6) | - |
| Never smoker | 82 (27.0) | 83 (26.3) | 23 (18.4) | 25 (8.7) | - |
| Median follow-up, mo (range) | 49 (1.5–169) | 51 (1.3–204) | 52 (1–131) | 43 (0.2–112) | 44 (0.1–176) |
| No. of deaths | 191 | 182 | 58 | 138 | 33 |
* Patients who have smoked in the past, but whose current smoking status is unknown. FFPE = formalin-fixed, paraffin-embedded; NSCLC = non–small cell lung cancer; qPCR = quantitative polymerase chain reaction.
Statistical Analysis
All statistical tests performed were two-sided, except for hypergeometric tests (one-sided), with P values under .05 as the threshold for significance, unless otherwise stated. Statistical significance of correlations was assessed by Pearson test. Detailed data preprocessing steps are described in the Supplementary Methods (available online). Prognostic genes were identified using Cox proportional hazards regression, and those with P values under .01 (likelihood ratio test) were assessed for robustness by resampling the data 1000 times. Deviations from the proportional hazards assumption were examined using the cox.zph function in R. Gene expression data for prognostic genes in the training set were clustered using AutoSOME (36). Cluster memberships were assessed for enrichment of gene sets by hypergeometric test with an empirical false discovery rate correction for multiple hypothesis testing. The top five prognostic genes from each of four large clusters were integrated into a molecular prognostic index (MPI). A prognostic model based on age, sex, and stage was fit to SEER data (Supplementary Methods, available online). A composite risk model (CRM) score was defined as the combination of these indicators weighted by their coefficient in the multivariable Cox model. The relative prognostic value of models was compared using Net Reclassification Improvement (NRI) and Integrated Discrimination Improvement (IDI) (37,38). Receiver operating characteristic curves were produced using the survivalROC package (39).
Cell Sorting, Whole Transcriptome Sequencing, and PCR
Fresh human lung tumor samples (n = 4) were dissociated into single-cell suspensions for flow cytometry analysis and cell sorting. Total RNA extracted from sorted cell populations was reverse transcribed, amplified, and used to construct DNA libraries for sequencing. Additional details are provided in the Supplementary Methods (available online). RNA was purified from lung tumor tissue obtained from FFPE blocks (n = 98). Synthesis of cDNA was performed from 1 µg of total RNA using the High Capacity cDNA Reverse Transcription Kit (Applied Biosystems, Foster City, CA), and qPCR was performed using TaqMan Gene Expression Assays (Applied Biosystems) (Supplementary Table 3, available online). Relative gene expression was determined by the ∆∆Ct method (40).
Results
We assembled a compendium of nonsquamous lung NSCLC datasets from the literature, combining them into a meta-cohort containing 1106 patients (Figure 1A). We investigated the impact of training set size on prognostic power for two genes, SLC2A1 and LAMC2, which have been identified as prognostic in lung cancer previously (41,42). Three hundred fifty to 400 patients were required for reliable assessment of prognostic power (Supplementary Figure 1, available online). Accordingly, we split the meta-cohort into training (n = 563) and validation (n = 543) sets balanced for clinical risk (Table 1). We then identified 1012 genes whose expression was associated (P < .01) with survival in the training set. We included all stages of NSCLC because molecular determinants of outcome are likely shared across stages.
Figure 1.
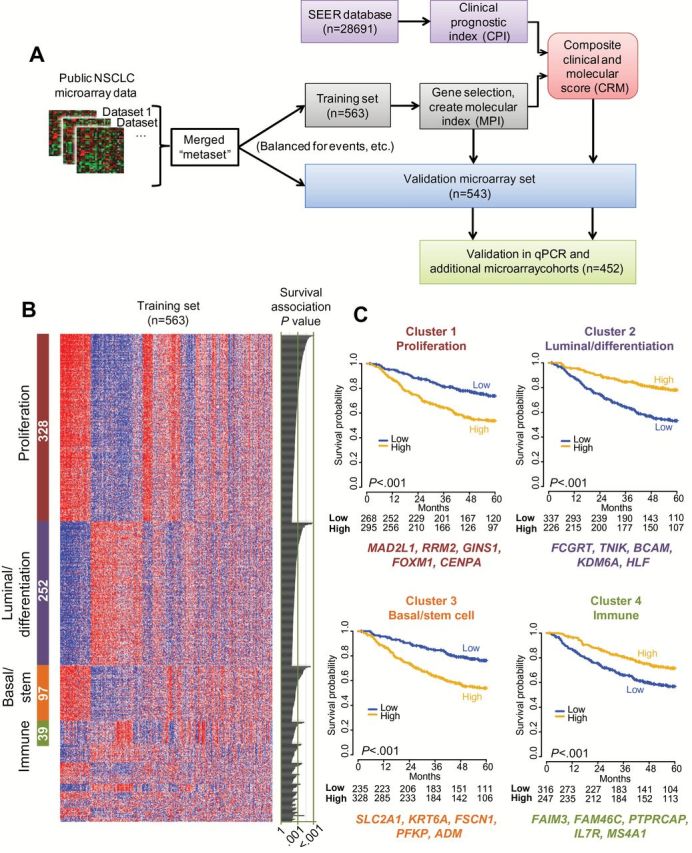
Identification and selection of prognostic genes from nonsquamous non–small cell lung cancer (NSCLC) gene expression datasets. A) Schematic representation of the study design for prognostic gene discovery and validation. B) Clustering of the top 1012 prognostic genes (rows) in the training set of 563 patients (columns) by AutoSOME (36) revealed four dominant clusters comprising 71% (n = 716) of the genes; statistically significant cluster annotations are indicated in Supplementary Table 4 (available online). The heatmap reflects relative mRNA expression levels. The number of genes in each cluster is indicated (white text within colored bars to left), with univariate estimates of prognostic value for each gene depicted as likelihood ratio P values from Cox regression in the training set on the right of the panel. C) Kaplan-Meier survival analysis in the microarray training set; cases were split into “high” and “low” sets according the median of the integrated expression of the genes in each of the four largest clusters from (B). The top five most robustly prognostic genes are indicated below each cluster. P values in KM plots are from log-rank test (two-sided). NSCLC = non–small cell lung cancer; qPCR = quantitative polymerase chain reaction; SEER = Surveillance, Epidemiology, and End Results.
Identification and Functional Annotation of Prognostic Genes
NSCLC tumor specimens contain multiple cell types including malignant epithelial cells, stromal mesenchymal, endothelial, and infiltrating leukocytes (Supplementary Figure 2, available online). Because individual prognostic genes might reflect distinct processes related to this complex tumor microenvironment, we clustered the gene expression profiles of the 1012 prognostic genes within the training cohort (Figure 1B). The four largest clusters were enriched for genes reflecting: 1) proliferation, 2) normal lung epithelial differentiation and luminal cell fate, 3) basal epithelial and stem cell fate, and 4) immune-related functions. Kaplan-Meier analysis based on the average expression levels of genes in these clusters revealed statistically significant patterns of favorable (Clusters 2 and 4) and adverse (Clusters 1 and 3) association (Figure 1C).
We compared the four clusters to gene sets to assess enrichment of biological processes and pathways (Supplementary Table 4, available online). Cluster 1 contained proliferation/cell cycle–related genes and was enriched for genes expressed in embryonic stem cells relative to differentiated cell types (43) and genes highly expressed in poorly differentiated cancer histologies (44). Conversely, Cluster 2 shared genes expressed highly in differentiated cancer subtypes and in tracheal luminal cells (45). Its expression was inversely associated with smoking history (P < .001, Fisher’s exact test; data not shown). Cluster 3 contained genes highly expressed in airway basal stem cells and genes previously found to distinguish basal-like from luminal-like breast tumors (46). Cluster 4 strongly overlapped with signature genes of immune effector cells and genes expressed in lymph nodes.
A Nine-Gene Molecular Prognostic Index for Nonsquamous NSCLC
Traditional feature selection of prognostic genes may result in a model based on a single aspect of tumor biology (eg, proliferation) that does not reflect other important tumor features that impact survival. To combat this, we built a molecular prognostic index that incorporates distinct biological themes. We selected the most statistically significant prognostic genes from the four biologically defined clusters above using a penalized regression approach to assess prognostic value and robustness (47). The resulting model (Figure 2A) comprised nine genes, including four whose expression was associated with adverse risk—MAD2L1 (mitotic arrest deficient 2–like 1), GINS1 (GINS complex subunit 1), SLC2A1 (solute carrier family 2 facilitated glucose transporter, member 1 [GLUT-1]), KRT6A (keratin 6A)—and five genes associated with favorable outcomes—TNIK (TRAF2 and NCK interacting kinase), BCAM (basal cell adhesion molecule), KDM6A (lysine-specific demethylase 6A), FCGRT (Fc fragment of IgG receptor, alpha), FAIM3 (Fas apoptotic inhibitory molecule 3). The MPI was defined in terms of the expression levels of these nine genes as MPI = 5*SLC2A1 + 4*(MAD2L1 + GINS1 + KRT6A) - 5*(FCGRT + TNIK+BCAM + KDM6A) - 6*FAIM3 (Figure 2A).
Figure 2.

Construction of a molecular prognostic index (MPI) based on nine genes expressed in distinct non–small cell lung cancer (NSCLC) tumor subpopulations allows survival stratification independently of clinical risk factors. A) Univariate prognostic value for each of the nine most statistically significantly prognostic genes in the microarray training set, and corresponding weightings in a linear model used to calculate the MPI risk score. Color codes reflect cluster membership as designated in Figure 1. B-D) Whole transcriptome sequencing (RNA-Seq) of sorted lung adenocarcinoma cell populations representing epithelial cells (EpCAM+CD45-CD31-), immune cells (CD45+), endothelial cells (CD31+CD45-), and stromal cells (CD10+CD45-CD31-EpCAM-). Expression levels (fragments per kilobase of exon per million fragments mapped [FPKM]) are shown for the distinct cell populations. B) Average FPKM of the nine genes comprising the MPI (n = 4 tumors; error bars = standard deviation). C) Average FPKM of genes in each cluster. D) Tumor epithelial cells and infiltrating immune cells account for most of the total expression for the MPI genes. The average fraction of the total gene expression within NSCLC tumors (n = 4) that is contributed by each of the sorted cell types is shown. E) Univariate prognostic value of the MPI is depicted as the hazard ratio (HR ± 95% confidence interval) for death in the meta-cohort microarray validation set within each of the indicated categories of age, sex, stage, differentiation (grade), and smoking status. The MPI was dichotomized relative to its median value in the training set to define ‘high’ vs ‘low’ risk and applied to the meta-cohort microarray validation set for the forest plot (two-sided log-rank test). FFKM = fragments per kilobase of exon per million fragments mapped; MPI = molecular prognostic index.
To characterize expression of these genes in tumor subpopulations, we performed RNA-seq on freshly sorted tumor cell subsets from stage I adenocarcinomas (n = 4) (Figure 2, B-D). The nine MPI genes demonstrated cell type–specific expression profiles (Figure 2B) consistent with the average profiles of the clusters from which they derived (Figure 2C). The majority of transcripts for the MPI genes derived from epithelial or immune cells (Figure 2D). Adversely prognostic genes from Clusters 1 (GINS1 and MAD2L1) and 3 (SLC2A1 and KRT6A) displayed highest expression within EpCAM+ malignant epithelial cells. In contrast, FAIM3 (Cluster 4) was expressed predominantly in tumor-infiltrating leukocytes. The four genes from Cluster 2 were variably expressed within tumor subpopulations, consistent with existing knowledge regarding their expression patterns (eg, BCAM expression in epithelial and endothelial cells [48]). Thus, expression of the genes comprising the MPI integrates processes involving both tumor and stromal cells.
Internal Validation and Independent Prognostic Value of the MPI
The MPI was strongly associated with overall survival as a continuous score in the meta-cohort microarray validation set (Table 2 and Figure 3A). When patients were stratified into high vs low risk groups (relative to the training-cohort median), the MPI was statistically significantly associated with survival in the meta-cohort microarray validation set (HR = 2.42, 95% CI = 1.78 to 3.29, P ≤ .001, log-rank test) sets. It remained prognostically significant when considering only stage I nonsquamous NSCLC (HR = 2.28, 95% CI = 1.48 to 3.53, P < .001, log-rank test) (Figure 3B) of the validation set, and even within stage IA (HR = 2.99, 95% CI = 1.55t o 5.76, P < .001, log-rank test) (Figure 3C). The MPI was prognostic in the validation set within age, sex, stage, and grade subgroups (Figure 2E) and remained statistically significant in multivariate analyses (Supplementary Table 5, available online). Furthermore, where sufficient data were available for assessment, it was prognostic within subsets of patients harboring both wild-type or mutant versions of KRAS, EGFR, ALK, or TP53, in both the microarray training and validation sets (Table 3). Importantly, the MPI was also prognostically significant in multivariate analysis with the proliferation marker MKI67 (P < .001 for the MPI, and P = 0.23 for MKI67; data not shown), supporting that it captures proliferation as well as other aspects of tumor biology impacting survival. Finally, it was prognostic in two additional external cohorts published after its derivation (P = .003 in stage I patients of Rousseaux et al. [35], and P = .034 in Der et al. [34]) (Supplementary Figure 3, available online).
Table 2.
Univariate and multivariable analysis of molecular, clinical, and composite scores in validation cohorts
| Variable | Meta-cohort microarray validation set |
qPCR validation set | ||
|---|---|---|---|---|
| HR (95% CI) | P* | HR (95% CI) | P* | |
| Univariate | ||||
| MPI (stage I only) | 1.02 (1.01 to 1.03) | <.001 | 1.02 (1.00 to 1.03) | .03 |
| CPI (age, stage, sex) | 3.04 (2.32 to 3.97) | <.001 | 4.24 (2.15 to 8.36) | <.001 |
| Multivariate (all stages) | ||||
| MPI | 1.02 (1.01 to 1.03) | <.001 | 1.02 (1.00 to 1.03) | .009 |
| CPI (age, stage, sex) | 2.72 (2.07 to 3.57) | <.001 | 4.12 (2.12 to 8.00) | <.001 |
| CRM (all stages) | 2.43 (2.05 to 2.88) | <.001 | 2.93 (1.84 to 4.66) | <.001 |
| CRM (high vs low, all stages) | 3.49 (2.50 to 4.88) | <.001 | 4.16 (1.86 to 9.27) | <.001 |
| CRM (stage I) | 2.40 (1.79 to 3.22) | <.001 | 3.15 (1.72 to 5.77) | <.001 |
| CRM (high vs low, stage I) | 3.43 (2.18 to 5.39) | <.001 | 3.99 (1.67 to 9.56) | <.001 |
| CRM (stage IA) | 2.86 (1.69 to 4.82) | <.001 | 4.76 (1.89 to 12.01) | <.001 |
| CRM (high vs low, stage IA) | 3.16 (1.54 to 6.49) | <.001 | 3.84 (1.28 to 11.47) | .009 |
* Two-sided likelihood-ratio test. CI = confidence interval; CPI = clinical prognostic index; CRM = composite risk model; HR = hazard ratio; MPI = molecular prognostic index; qPCR = quantitative polymerase chain reaction.
Figure 3.
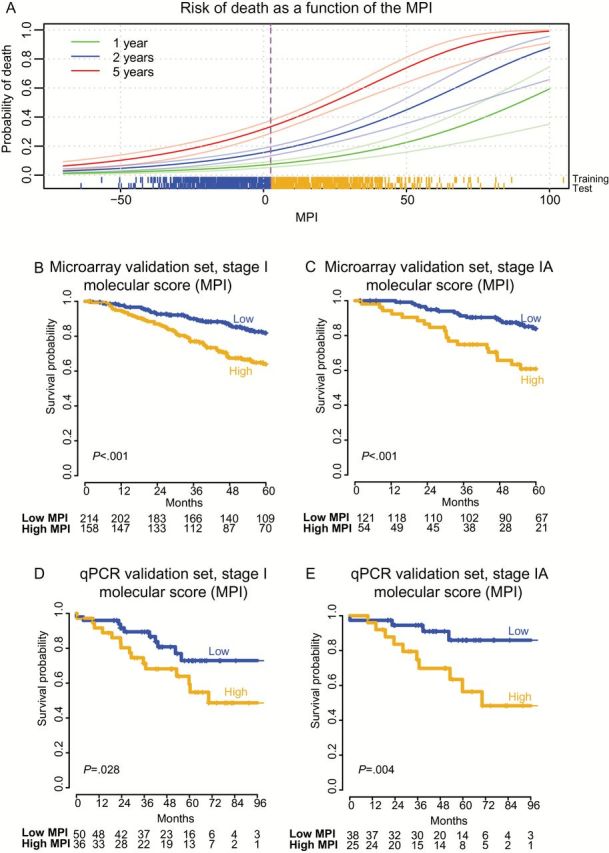
A nine-gene expression-based molecular prognostic index (MPI) predicts risk of death in stage I nonsquamous non–small cell lung cancer (NSCLC). A) Distribution of the MPI and its relationship to survival in the training set, with survival modeled as a continuous function of the score. Scores for individual patients are depicted as a “rung” above the x-axis for the meta-cohort microarray training and test sets. Sigmoidal lines depict mean mortality rates (darker green, blue, and red lines) and corresponding 95% confidence interval (lighter colored lines), based on Kaplan-Meier estimates of one, two, and five years, respectively. Dichotomous patient stratification of the MPI relative to the training set (median MPI = 2.96, vertical dotted line) define two mortality risk strata as depicted in panels (B-E). B and C) Kaplan-Meier analysis of overall survival in the meta-cohort microarray validation set with stratification of risk groups based on the median value of the MPI from the training set. D and E) Kaplan-Meier survival analysis of the quantitative polymerase chain reaction validation set with risk groups defined by the median MPI value in the training set. P values for the MPI are calculated by log-rank test (two-sided). Numbers at risk are indicated below axes, and tick marks on curves indicate censoring. MPI = molecular prognostic index.
Table 3.
Prognostic utility of the MPI within mutational subgroups of NSCLC in the microarray training and validation meta-cohorts
| Gene | Status | Meta-cohort microarray training set | Meta-cohort microarray validation set | ||||
|---|---|---|---|---|---|---|---|
| n | HR (95% CI) | P* | n | HR | P* | ||
| KRAS | wt | 187 | 1.02 (1.01 to 1.04) | <.001 | 167 | 1.03 (1.02 to 1.05) | <.001 |
| mut | 33 | 1.04 (1.01 to 1.08) | .019 | 41 | 1.01 (0.99 to 1.04) | .26 | |
| EGFR | wt | 90 | 1.02 (1.01 to 1.04) | .014 | 81 | 1.03 (1.01 to 1.04) | <.001 |
| mut | 85 | 1.02 (1.00 to 1.04) | .023 | 87 | 1.02 (1.00 to 1.05) | .041 | |
| TP53 | wt | 43 | 1.04 (1.01 to 1.06) | .002 | 35 | 1.04 (1.01 to 1.07) | .004 |
| mut | 21 | 1.02 (0.99 to 1.05) | .120 | 17 | 1.03 (1.00 to 1.06) | .033 | |
| ALK fusion | yes† | 9 | - | - | 2 | - | - |
| no | 101 | 1.02 (1.00 to 1.04) | .031 | 114 | 1.03 (1.01 to 1.04) | .001 | |
* Two-sided likelihood ratio test. CI = confidence interval; HR = hazard ratio; MPI = molecular prognostic index; mut = mutant; NSCLC = non–small cell lung cancer; wt = wild-type.
† Too few samples for assessment.
External qPCR Validation of the MPI
We sought to implement the MPI as a qPCR assay that could be readily performed in clinical laboratories on FFPE specimens. We selected TaqMan real-time reverse transcription qPCR assays for the nine MPI genes, and for two control housekeeping genes (AGPAT1 and PRPF40A) that lacked prognostic association, and displayed stable expression relative to transcriptome-wide normalization measures (49). We validated the qPCR-based MPI in an independent cohort of 98 patients treated at Stanford Cancer Institute (Table 1). All specimens were obtained by surgical resection and contained 50% or more tumor cells. RNA was successfully purified from FFPE specimens up to 14 years old (median = 6 years). The MPI was prognostic within stage I and stage IA patients in the qPCR validation set (Table 2). Using cutoff values for high and low risk defined in the microarray training set, it stratified patients across stage I (Figure 3D) and within stage IA (HR = 3.95, 95% CI = 1.24 to 12.64, P = .01, log-rank test) (Figure 3E). The MPI remained statistically significant in multivariate analysis with key clinical and pathological variables (age, sex, stage, and grade) (Supplementary Table 5, available online). To further evaluate the performance in qPCR data, we randomly selected 86 samples from the stage I patients of the microarray validation meta-cohort (equal to the number of stage I patients in the qPCR cohort) and tested the prognostic association of the MPI as a high vs low dichotomous variable. In 10 000 such simulations, the mean z-score for association of the MPI with survival was 2.2 (corresponding to P = .045) (Supplementary Figure 4, available online), while in the qPCR cohort the actual z-score was 2.1 (P = .03). Hence, the statistical significance of the MPI was consistent with what would be expected in a cohort of this size given its effect size. These results confirm the performance of the nine-gene MPI as a prognostic tool in early-stage nonsquamous NSCLC and its applicability to FFPE samples.
One of the most adversely prognostic genes in the MPI, SLC2A1, encodes a major glucose transporter (GLUT-1) whose protein expression has previously been shown to correlate with uptake of fluorodeoxyglucose (FDG) by NSCLCs on positron emission tomography (PET) scans (50, 51). We therefore compared how measurement of SLC2A1 mRNA using our method compared with measurement of GLUT-1 protein by immunohistochemistry (IHC) and FDG uptake on pretreatment PET imaging (Supplementary Figure 5, available online). Expression of SLC2A1 from qPCR correlated with both GLUT-1 protein levels (P < .001) and with maximal tumor standardized uptake value (SUVmax; P < .01). Thus, SLC2A1 transcript levels are correlated with expression and function of its protein, two tumor characteristics previously shown to predict outcome (52–54).
Comparison With Other NSCLC Gene Expression Signatures
We compared the performance of the MPI with three other published signatures developed as potentially clinically applicable qPCR assays (16,55,56) by applying them to our training and testing meta-cohorts. All three were statistically significantly prognostic (all P < .001 in test cohort; data not shown). The MPI contained no genes in common with the other prognostic signatures. Because P values cannot be used to compare models, we computed net reclassification index (NRI) and integrated discrimination improvement (IDI) statistics for the MPI vs each of the three alternative prognostic signatures. The MPI outperformed all other signatures according to both NRI and IDI (P < .001 in each case) (Supplementary Table 6, available online).
A Composite Molecular/Clinical Model for Predicting Survival in NSCLC
The MPI provided independent prognostic information when compared with standard clinical and pathologic covariates (Figure 2E; Supplementary Table 5, available online), suggesting that combining them could create an even more robust risk index (17,18). For lung adenocarcinoma, previously proposed prognostic factors include age, sex, and stage (7,9,57–60). We utilized the SEER database to determine hazard ratios for death for these variables across a large, diverse population of over 28 000 patients (61). As expected, advanced age, male sex, and higher stage at diagnosis were associated with worse outcomes. These factors were combined into a clinical prognostic index (CPI), defined as 0.024*Age(years) – 0.34 (if sex female) + stage, where the value for stage is 0.43 (stage IB), 0.81 (IIA), 1.10 (IIB), 1.20 (IIIA), or 1.20 (IIIB) (Methods). The CPI was statistically significant in univariate analyses of all validation sets as well as in multivariable analysis incorporating the MPI (Table 2). We therefore combined the CPI and MPI to form a composite risk model (CRM), defined in the training set as (1.1*CPI+0.022*MPI), which stratified patients by risk of death in all microarray validation sets as well as the qPCR validation set (Figure 4, Tables 2 and 3).
Figure 4.
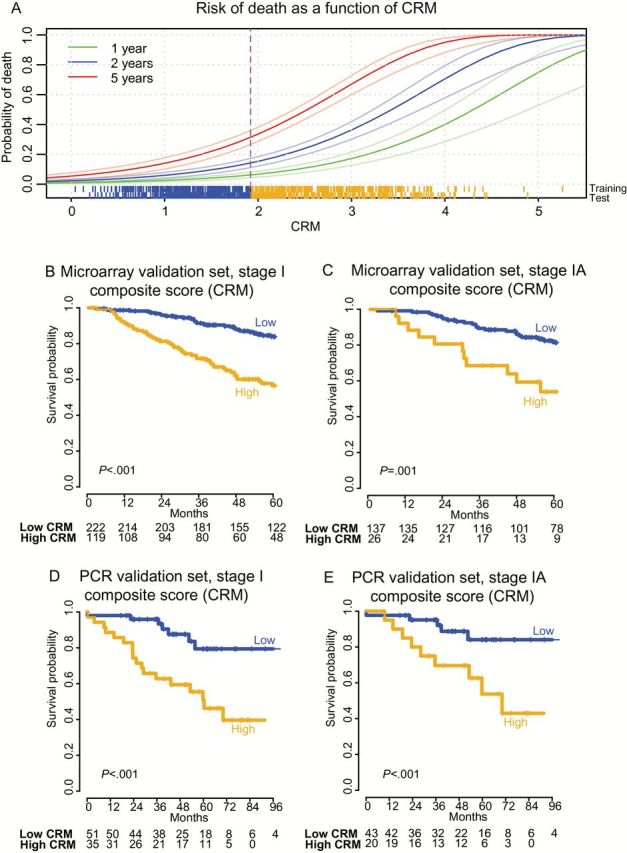
A composite risk model (CRM) incorporating molecular and clinical risk factors predicts risk of death from stage I nonsquamous non–small cell lung cancer (NSCLC). A) Distribution of the CRM and its relationship to survival in the training set, with survival modeled as a continuous function of the score. Data for CRM are presented as described for MPI in Figure 3, using the corresponding CRM threshold in the microarray training set (median CRM = 1.92). The scale of the CRM was adjusted to range from 0 to 5 to simplify interpretation in the clinical setting. B and C) Kaplan-Meier analysis of overall survival in the meta-cohort microarray validation set with stratification of risk groups based on the median value of the CRM defined in the training set. D and E) Kaplan-Meier survival analysis of the quantitative polymerase chain reaction validation set with risk groups defined by the median CRM value in the training set. P values for the CRM were calculated by log-rank test (two-sided). Numbers at risk are indicated below axes, and tick marks on curves indicate censoring. CRM = composite risk model; PCR = polymerase chain reaction.
The CRM identified patients at higher risk of death across all stages (Figure 4A), when restricted to stage I patients (HR = 3.43, 95% CI = 2.18 to 5.39, P < .001 by log-rank test in stage I patients of the largest microarray cohort HR; HR = 3.99, 95% CI = 1.67 to 9.56, P < .001 by log-rank test in stage I of the qPCR cohort) (Figure 4, B and D, and Table 2; Supplementary Figure 7, C and D) and even stage IA (Figure 4, C and E). The CRM outperformed the MPI as assessed by NRI and IDI for assignment of risk of death by five years (Supplementary Table 7, available online), as well as by survival ROC curves (Supplementary Figure 6, available online) (38). These data indicate that integration of molecular and clinical risk-associated variables using the CRM provides more robust assessment of prognosis than either index alone.
Discussion
Despite over a decade of effort, few prognostic gene expression signatures have made it to the clinic (62). We developed a nine-gene qPCR-based expression predictor for survival outcome in early-stage nonsquamous NSCLC, validated it on FFPE tissues, and developed a composite risk index (CRM) that integrates it with other clinical variables. Both the MPI and CRM identify early-stage NSCLC patients at high risk for death, with patients in the high-risk group having an approximately 50% chance of death by five years.
We took deliberate steps to ensure robustness of the MPI. First, we utilized gene expression data from multiple technological platforms in the model training process, which encouraged selection of genes whose measurement is consistent and reproducibly associated with survival. Second, we performed internal and cross-platform external validation of the MPI. Third, we included genes from distinct clusters of survival-associated genes representing biological features of both tumor and stroma. We believe the latter to be a novel approach to prognostic model building with wide applicability. Finally, although applied to stage I NSCLC, we included all stages of tumors in the model training procedure to take advantage of prognostic information encoded in the gene expression profiles of higher stages that may have subtle but important effects within stage I disease.
Prior studies have proposed gene expression prognostic signatures for NSCLC (16,17,55,63–84) but have been limited by various shortcomings precluding independent validation (18). Our approach aimed to overcome these hurdles, and we found that the MPI outperforms other signatures that satisfy key characteristics of clinical applicability (ie, qPCR assays validated on FFPE tissues), as assessed by NRI and IDI (16,38,55,56). As far as we are aware, our study is the first to provide a composite model that incorporates both gene expression and clinical data from a large, population-based database to leverage the independent prognostic content of these two types of data. The CRM provides greater predictive power than the MPI alone, underscoring the utility of this approach. Patients are increasingly being managed on the basis of targetable driver mutations, and it is therefore noteworthy that the MPI is prognostic within subsets of patients harboring either mutated or wild-type forms of EGFR, KRAS, TP53, and ALK.
Limitations of our study are similar to other gene expression–based prognostic models. NSCLC is known to harbor tumor heterogeneity, and samples from spatially distinct areas of a tumor can have inconsistent gene signatures (85). While we validated the MPI and CRM in four independent validation sets, they were all retrospective in nature. In the future, it would be valuable to develop a signature that can also be applied to squamous cell carcinoma (SCC). However, similar to previous reports, we found that prognostic signatures for SCC are not robust; possibly because of the smaller sample sizes available for model building or because of intrinsic biological differences between SCC and non-SCC NSCLC (18,59,69).
In conclusion, we envision that the MPI and CRM will be useful for assessing recurrence risk for patients with nonsquamous NSCLC. For clinical implementation, these results must be validated on additional cohorts using a Clinical Laboratory Improvement Amendments-certified assay and it would be interesting to compare alternative methods for RNA quantification to qPCR. Ultimately, prospective clinical trials will be required to determine whether the use of the MPI and CRM could guide decisions regarding adjuvant treatment and improve outcomes for high-risk patients.
Funding
This work was supported by PHS Grant Number CA09302, the US National Institutes of Health R01CA188298 (MD/AAA), and U01CA194389 (AAA), Director’s New Innovator Award Program (MD; 1-DP2- CA186569), the Ludwig Institute for Cancer Research (MD, AAA), and the CRK Faculty Scholar Fund (MD). AJG, RVN, WF, SKP, CD, and MD are supported by National Institutes of Health U01-CA154969; AJG, RVN, and SKP are supported by U54-CA149145. Damon Runyon Cancer Research Foundation (AAA) and V-Foundation (AAA); AAA and MD are supported by Doris Duke Clinical Scientist Development Awards.
Supplementary Material
AJG, SVB, AAA, and MD conceived and designed this study. VSN and RBW constructed the lung cancer tissue microarray and curated clinical data. AJG, AAA, SVB, MD, LJL, JPH, WF, CDH, DS, and VSN collected and assembled data for analysis. AJG, SVB, JPH, RVN, SKP, AAA, and MD performed analysis and interpretation. AJG, SVB, AAA, SKP, and MD wrote the manuscript, and all authors provided final approval.
The study funders had no role in the design of the study; the collection, analysis, or interpretation of the data; the writing of the manuscript; nor the decision to submit the manuscript for publication.
References
- 1. Siegel R, Naishadham D, Jemal A. Cancer statistics, 2013. CA Cancer J Clin. 2013;63(1):11–30. [DOI] [PubMed] [Google Scholar]
- 2. Reed MF, Molloy M, Dalton EL, et al. Survival after resection for lung cancer is the outcome that matters. Am J Surg. 2004;188(5):598–602. [DOI] [PubMed] [Google Scholar]
- 3. Goldstraw P, Crowley J, Chansky K, et al. The IASLC Lung Cancer Staging Project: proposals for the revision of the TNM stage groupings in the forthcoming (seventh) edition of the TNM Classification of malignant tumours. J Thorac Oncol. 2007;2(8):706–714. [DOI] [PubMed] [Google Scholar]
- 4. Greene FL. AJCC cancer staging manual: Springer Science & Business Media; 2002.
- 5. Pignon JP, Tribodet H, Scagliotti GV, et al. Lung adjuvant cisplatin evaluation: a pooled analysis by the LACE Collaborative Group. J Clin Oncol. 2008;26(21):3552–3559. [DOI] [PubMed] [Google Scholar]
- 6. Sangha R, Price J, Butts CA. Adjuvant therapy in non-small cell lung cancer: current and future directions. Oncologist. 2010;15(8):862–872. [DOI] [PMC free article] [PubMed] [Google Scholar]
- 7. Harpole DH, Jr, Herndon JE, 2nd, Young WG, Jr, et al. Stage I nonsmall cell lung cancer. A multivariate analysis of treatment methods and patterns of recurrence. Cancer. 1995;76(5):787–796. [DOI] [PubMed] [Google Scholar]
- 8. Yovino S, Kwok Y, Krasna M, et al. An association between preoperative anemia and decreased survival in early-stage non-small-cell lung cancer patients treated with surgery alone. Int J Radiat Oncol Biol Phys. 2005;62(5):1438–1443. [DOI] [PubMed] [Google Scholar]
- 9. Chang MY, Mentzer SJ, Colson YL, et al. Factors predicting poor survival after resection of stage IA non-small cell lung cancer. J Thorac Cardiovasc Surg. 2007;134(4):850–856. [DOI] [PubMed] [Google Scholar]
- 10. Horne ZD, Jack R, Gray ZT, et al. Increased levels of tumor-infiltrating lymphocytes are associated with improved recurrence-free survival in stage 1A non-small-cell lung cancer. J Surg Res. 2011;171(1):1–5. [DOI] [PubMed] [Google Scholar]
- 11. Carr SR, Schuchert MJ, Pennathur A, et al. Impact of tumor size on outcomes after anatomic lung resection for stage 1A non-small cell lung cancer based on the current staging system. J Thorac Cardiovasc Surg. 2012;143(2):390–397. [DOI] [PubMed] [Google Scholar]
- 12. Kato T, Ishikawa K, Aragaki M, et al. Angiolymphatic invasion exerts a strong impact on surgical outcomes for stage I lung adenocarcinoma, but not non-adenocarcinoma. Lung Cancer. 2012;77(2):394–400. [DOI] [PubMed] [Google Scholar]
- 13. Petersen RP, Campa MJ, Sperlazza J, et al. Tumor infiltrating Foxp3+ regulatory T-cells are associated with recurrence in pathologic stage I NSCLC patients. Cancer. 2006;107(12):2866–2872. [DOI] [PubMed] [Google Scholar]
- 14. Sandoval J, Mendez-Gonzalez J, Nadal E, et al. A prognostic DNA methylation signature for stage I non-small-cell lung cancer. J Clin Oncol. 2013;31(32):4140–4147. [DOI] [PubMed] [Google Scholar]
- 15. Alix-Panabieres C, Schwarzenbach H, Pantel K. Circulating tumor cells and circulating tumor DNA. Annu Rev Med. 2012;63:199–215. [DOI] [PubMed] [Google Scholar]
- 16. Kratz JR, He J, Van Den Eeden SK, et al. A practical molecular assay to predict survival in resected non-squamous, non-small-cell lung cancer: development and international validation studies. Lancet. 2012;379(9818):823–832. [DOI] [PMC free article] [PubMed] [Google Scholar]
- 17. Shedden K, Taylor JM, Enkemann SA, et al. Gene expression-based survival prediction in lung adenocarcinoma: a multi-site, blinded validation study. Nat Med. 2008;14(8):822–827. [DOI] [PMC free article] [PubMed] [Google Scholar]
- 18. Subramanian J, Simon R. Gene expression-based prognostic signatures in lung cancer: ready for clinical use? J Natl Cancer Inst. 2010;102(7):464–474. [DOI] [PMC free article] [PubMed] [Google Scholar]
- 19. Xie Y, Minna JD. A lung cancer molecular prognostic test ready for prime time. Lancet. 2012;379(9818):785–787. [DOI] [PMC free article] [PubMed] [Google Scholar]
- 20. Bild AH, Yao G, Chang JT, et al. Oncogenic pathway signatures in human cancers as a guide to targeted therapies. Nature. 2006;439(7074):353–357. [DOI] [PubMed] [Google Scholar]
- 21. Lossos IS, Czerwinski DK, Alizadeh AA, et al. Prediction of survival in diffuse large-B-cell lymphoma based on the expression of six genes. N Engl J Med. 2004;350(18):1828–1837. [DOI] [PubMed] [Google Scholar]
- 22. Arpino G, Generali D, Sapino A, et al. Gene expression profiling in breast cancer: a clinical perspective. Breast. 2013;22(2):109–120. [DOI] [PubMed] [Google Scholar]
- 23. Paik S, Shak S, Tang G, et al. A multigene assay to predict recurrence of tamoxifen-treated, node-negative breast cancer. N Engl J Med. 2004;351(27):2817–2826. [DOI] [PubMed] [Google Scholar]
- 24. Azim HA, Jr, Michiels S, Zagouri F, et al. Utility of prognostic genomic tests in breast cancer practice: The IMPAKT 2012 Working Group Consensus Statement. Ann Oncol. 2013;24(3):647–654. [DOI] [PMC free article] [PubMed] [Google Scholar]
- 25. Kennedy RD, Bylesjo M, Kerr P, et al. Development and independent validation of a prognostic assay for stage II colon cancer using formalin-fixed paraffin-embedded tissue. J Clin Oncol. 2011;29(35):4620–4626. [DOI] [PubMed] [Google Scholar]
- 26. Gray RG, Quirke P, Handley K, et al. Validation study of a quantitative multigene reverse transcriptase-polymerase chain reaction assay for assessment of recurrence risk in patients with stage II colon cancer. J Clin Oncol. 2011;29(35):4611–4619. [DOI] [PubMed] [Google Scholar]
- 27. Choudhury AD, Eeles R, Freedland SJ, et al. The role of genetic markers in the management of prostate cancer. Eur Urol. 2012;62(4):577–587. [DOI] [PubMed] [Google Scholar]
- 28. Alizadeh AA, Gentles AJ, Alencar AJ, et al. Prediction of survival in diffuse large B-cell lymphoma based on the expression of 2 genes reflecting tumor and microenvironment. Blood. 2011;118(5):1350–1358. [DOI] [PMC free article] [PubMed] [Google Scholar]
- 29. Gevaert O, Xu J, Hoang CD, et al. Non-small cell lung cancer: identifying prognostic imaging biomarkers by leveraging public gene expression microarray data--methods and preliminary results. Radiology. 2012;264(2):387–396. [DOI] [PMC free article] [PubMed] [Google Scholar]
- 30. Guo NL, Wan YW, Tosun K, et al. Confirmation of gene expression-based prediction of survival in non-small cell lung cancer. Clin Cancer Res. 2008;14(24):8213–8220. [DOI] [PMC free article] [PubMed] [Google Scholar]
- 31. Gentles AJ, Newman AM, Long C-L, et al. The prognostic landscape of genes and infiltrating immune cells across human cancers [published online ahead of print July 20, 2015]. Nat Med. 2015. doi:10.1038/nm.3909. [DOI] [PMC free article] [PubMed] [Google Scholar]
- 32. McShane LM, Altman DG, Sauerbrei W, et al. REporting recommendations for tumour MARKer prognostic studies (REMARK). Br J Cancer. 2005;93(4):387–391. [DOI] [PMC free article] [PubMed] [Google Scholar]
- 33. McShane LM, Cavenagh MM, Lively TG, et al. Criteria for the use of omics-based predictors in clinical trials. Nature. 2013;502(7471):317–320. [DOI] [PMC free article] [PubMed] [Google Scholar]
- 34. Der SD, Sykes J, Pintilie M, et al. Validation of a histology-independent prognostic gene signature for early-stage, non-small-cell lung cancer including stage IA patients. J Thorac Oncol. 2014;9(1):59–64. [DOI] [PubMed] [Google Scholar]
- 35. Rousseaux S, Debernardi A, Jacquiau B, et al. Ectopic activation of germline and placental genes identifies aggressive metastasis-prone lung cancers. Sci Transl Med. 2013;5(186):186ra66. [DOI] [PMC free article] [PubMed] [Google Scholar]
- 36. Newman AM, Cooper JB. AutoSOME: a clustering method for identifying gene expression modules without prior knowledge of cluster number. BMC Bioinformatics. 2010;11:117. [DOI] [PMC free article] [PubMed] [Google Scholar]
- 37. Heagerty PJ, Lumley T, Pepe MS. Time-dependent ROC curves for censored survival data and a diagnostic marker. Biometrics. 2000;56(2):337–344. [DOI] [PubMed] [Google Scholar]
- 38. Pencina MJ, D’Agostino RB, Steyerberg EW. Extensions of net reclassification improvement calculations to measure usefulness of new biomarkers. Stat Med. 2011;30(1):11–21. [DOI] [PMC free article] [PubMed] [Google Scholar]
- 39. Heagerty PJ, Zheng Y. Survival model predictive accuracy and ROC curves. Biometrics. 2005;61(1):92–105. [DOI] [PubMed] [Google Scholar]
- 40. Livak KJ, Schmittgen TD. Analysis of relative gene expression data using real-time quantitative PCR and the 2(-Delta Delta C(T)) Method. Methods. 2001;25(4):402–408. [DOI] [PubMed] [Google Scholar]
- 41. Moriya Y, Niki T, Yamada T, et al. Increased expression of laminin-5 and its prognostic significance in lung adenocarcinomas of small size. An immunohistochemical analysis of 102 cases. Cancer. 2001;91(6):1129–1141. [DOI] [PubMed] [Google Scholar]
- 42. Younes M, Brown RW, Stephenson M, et al. Overexpression of Glut1 and Glut3 in stage I nonsmall cell lung carcinoma is associated with poor survival. Cancer. 1997;80(6):1046–1051. [DOI] [PubMed] [Google Scholar]
- 43. Wong DJ, Liu H, Ridky TW, et al. Module map of stem cell genes guides creation of epithelial cancer stem cells. Cell Stem Cell. 2008;2(4):333–344. [DOI] [PMC free article] [PubMed] [Google Scholar]
- 44. Rodrigues RF, Roque L, Krug T, et al. Poorly differentiated and anaplastic thyroid carcinomas: chromosomal and oligo-array profile of five new cell lines. Br J Cancer. 2007;96(8):1237–1245. [DOI] [PMC free article] [PubMed] [Google Scholar]
- 45. Rock JR, Onaitis MW, Rawlins EL, et al. Basal cells as stem cells of the mouse trachea and human airway epithelium. Proc Natl Acad Sci U S A. 2009;106(31):12771–12775. [DOI] [PMC free article] [PubMed] [Google Scholar]
- 46. Charafe-Jauffret E, Ginestier C, Monville F, et al. Gene expression profiling of breast cell lines identifies potential new basal markers. Oncogene. 2006;25(15):2273–2284. [DOI] [PubMed] [Google Scholar]
- 47. Simon N, Friedman J, Hastie T, et al. Regularization paths for Cox’s proportional hazards model via coordinate descent. J Stat Software. 2011;39(5):1–13. [DOI] [PMC free article] [PubMed] [Google Scholar]
- 48. Parsons SF, Mallinson G, Holmes CH, et al. The Lutheran blood group glycoprotein, another member of the immunoglobulin superfamily, is widely expressed in human tissues and is developmentally regulated in human liver. Proc Natl Acad Sci U S A. 1995;92(12):5496–5500. [DOI] [PMC free article] [PubMed] [Google Scholar]
- 49. Eisenberg E, Levanon EY. Human housekeeping genes, revisited. Trends Genet. 2013;29(10):569–574. [DOI] [PubMed] [Google Scholar]
- 50. Brown RS, Leung JY, Kison PV, et al. Glucose transporters and FDG uptake in untreated primary human non-small cell lung cancer. J Nucl Med. 1999;40(4):556–565. [PubMed] [Google Scholar]
- 51. Marom EM, Aloia TA, Moore MB, et al. Correlation of FDG-PET imaging with Glut-1 and Glut-3 expression in early-stage non-small cell lung cancer. Lung Cancer. 2001;33(2–3):99–107. [DOI] [PubMed] [Google Scholar]
- 52. Minami K, Saito Y, Imamura H, et al. Prognostic significance of p53, Ki-67, VEGF and Glut-1 in resected stage I adenocarcinoma of the lung. Lung Cancer. 2002;38(1):51–57. [DOI] [PubMed] [Google Scholar]
- 53. Nguyen XC, Lee WW, Chung JH, et al. FDG uptake, glucose transporter type 1, and Ki-67 expressions in non-small-cell lung cancer: correlations and prognostic values. Eur J Radiol. 2007;62(2):214–219. [DOI] [PubMed] [Google Scholar]
- 54. Paesmans M, Berghmans T, Dusart M, et al. Primary tumor standardized uptake value measured on fluorodeoxyglucose positron emission tomography is of prognostic value for survival in non-small cell lung cancer: update of a systematic review and meta-analysis by the European Lung Cancer Working Party for the International Association for the Study of Lung Cancer Staging Project. J Thorac Oncol. 2010;5(5):612–619. [DOI] [PubMed] [Google Scholar]
- 55. Wistuba II, Behrens C, Lombardi F, et al. Validation of a proliferation-based expression signature as prognostic marker in early stage lung adenocarcinoma. Clin Cancer Res. 2013;19(22):6261–6271. [DOI] [PMC free article] [PubMed] [Google Scholar]
- 56. Zhu CQ, Ding K, Strumpf D, et al. Prognostic and predictive gene signature for adjuvant chemotherapy in resected non-small-cell lung cancer. J Clin Oncol. 2010;28(29):4417–4424. [DOI] [PMC free article] [PubMed] [Google Scholar]
- 57. Wang BY, Huang JY, Cheng CY, et al. Lung cancer and prognosis in taiwan: a population-based cancer registry. J Thorac Oncol. 2013;8(9):1128–1135. [DOI] [PubMed] [Google Scholar]
- 58. Goodgame B, Viswanathan A, Miller CR, et al. A clinical model to estimate recurrence risk in resected stage I non-small cell lung cancer. Am J Clin Oncol. 2008;31(1):22–28. [DOI] [PubMed] [Google Scholar]
- 59. Sun Z, Aubry MC, Deschamps C, et al. Histologic grade is an independent prognostic factor for survival in non-small cell lung cancer: an analysis of 5018 hospital- and 712 population-based cases. J Thorac Cardiovasc Surg. 2006;131(5):1014–1020. [DOI] [PubMed] [Google Scholar]
- 60. Ferketich AK, Niland JC, Mamet R, et al. Smoking status and survival in the national comprehensive cancer network non-small cell lung cancer cohort. Cancer. 2013;119(4):847–853. [DOI] [PubMed] [Google Scholar]
- 61. Surveillance, Epidemiology, and End Results (SEER) Program (www.seer.cancer.gov) SEER*Stat. Database: Incidence - SEER 18 Regs Research Data + Hurricane Katrina Impacted Louisiana Cases, Nov 2012 Sub (1973–2010 varying) - Linked To County Attributes - Total U.S., 1969–2011 Counties, National Cancer Institute, DCCPS, Surveillance Research Program, Surveillance Systems Branch, released April 2013, based on the November 2012 submission.
- 62. Subramanian J, Simon R. What should physicians look for in evaluating prognostic gene-expression signatures? Nat Rev Clin Oncol. 2010;7(6):327–334. [DOI] [PubMed] [Google Scholar]
- 63. Beer DG, Kardia SL, Huang CC, et al. Gene-expression profiles predict survival of patients with lung adenocarcinoma. Nat Med. 2002;8(8):816–824. [DOI] [PubMed] [Google Scholar]
- 64. Bhattacharjee A, Richards WG, Staunton J, et al. Classification of human lung carcinomas by mRNA expression profiling reveals distinct adenocarcinoma subclasses. Proc Natl Acad Sci U S A. 2001;98(24):13790–13795. [DOI] [PMC free article] [PubMed] [Google Scholar]
- 65. Larsen JE, Pavey SJ, Passmore LH, et al. Gene expression signature predicts recurrence in lung adenocarcinoma. Clin Cancer Res. 2007;13(10):2946–2954. [DOI] [PubMed] [Google Scholar]
- 66. Roepman P, Jassem J, Smit EF, et al. An immune response enriched 72-gene prognostic profile for early-stage non-small-cell lung cancer. Clin Cancer Res. 2009;15(1):284–290. [DOI] [PubMed] [Google Scholar]
- 67. Tang H, Xiao G, Behrens C, et al. A 12-gene set predicts survival benefits from adjuvant chemotherapy in non-small cell lung cancer patients. Clin Cancer Res. 2013;19(6):1577–1586. [DOI] [PMC free article] [PubMed] [Google Scholar]
- 68. Tomida S, Takeuchi T, Shimada Y, et al. Relapse-related molecular signature in lung adenocarcinomas identifies patients with dismal prognosis. J Clin Oncol. 2009;27(17):2793–2799. [DOI] [PubMed] [Google Scholar]
- 69. Raponi M, Zhang Y, Yu J, et al. Gene expression signatures for predicting prognosis of squamous cell and adenocarcinomas of the lung. Cancer Res. 2006;66(15):7466–7472. [DOI] [PubMed] [Google Scholar]
- 70. Seike M, Yanaihara N, Bowman ED, et al. Use of a cytokine gene expression signature in lung adenocarcinoma and the surrounding tissue as a prognostic classifier. J Natl Cancer Inst. 2007;99(16):1257–1269. [DOI] [PubMed] [Google Scholar]
- 71. Gordon GJ, Richards WG, Sugarbaker DJ, et al. A prognostic test for adenocarcinoma of the lung from gene expression profiling data. Cancer Epidemiol Biomarkers Prev. 2003;12(9):905–910. [PubMed] [Google Scholar]
- 72. Raz DJ, Ray MR, Kim JY, et al. A multigene assay is prognostic of survival in patients with early-stage lung adenocarcinoma. Clin Cancer Res. 2008;14(17):5565–5570. [DOI] [PubMed] [Google Scholar]
- 73. Moriya Y, Iyoda A, Kasai Y, et al. Prediction of lymph node metastasis by gene expression profiling in patients with primary resected lung cancer. Lung Cancer. 2009;64(1):86–91. [DOI] [PubMed] [Google Scholar]
- 74. Endoh H, Tomida S, Yatabe Y, et al. Prognostic model of pulmonary adenocarcinoma by expression profiling of eight genes as determined by quantitative real-time reverse transcriptase polymerase chain reaction. J Clin Oncol. 2004;22(5):811–819. [DOI] [PubMed] [Google Scholar]
- 75. Chen G, Kim S, Taylor JM, et al. Development and validation of a quantitative real-time polymerase chain reaction classifier for lung cancer prognosis. J Thorac Oncol. 2011;6(9):1481–1487. [DOI] [PMC free article] [PubMed] [Google Scholar]
- 76. Lee E-S, Son D-S, Kim S-H, et al. Prediction of recurrence-free survival in postoperative non–small cell lung cancer patients by using an integrated model of clinical information and gene expression. Clin Cancer Res. 2008;14(22):7397–7404. [DOI] [PubMed] [Google Scholar]
- 77. Xi L, Lyons-Weiler J, Coello MC, et al. Prediction of lymph node metastasis by analysis of gene expression profiles in primary lung adenocarcinomas. Clin Cancer Res. 2005;11(11):4128–4135. [DOI] [PMC free article] [PubMed] [Google Scholar]
- 78. Guo NL, Wan YW. Pathway-based identification of a smoking associated 6-gene signature predictive of lung cancer risk and survival. Artif Intell Med. 2012;55(2):97–105. [DOI] [PMC free article] [PubMed] [Google Scholar]
- 79. Kadara H, Behrens C, Yuan P, et al. A five-gene and corresponding protein signature for stage-I lung adenocarcinoma prognosis. Clin Cancer Res. 2011;17(6):1490–1501. [DOI] [PMC free article] [PubMed] [Google Scholar]
- 80. Bianchi F, Nuciforo P, Vecchi M, et al. Survival prediction of stage I lung adenocarcinomas by expression of 10 genes. J Clin Invest. 2007;117(11):3436–3444. [DOI] [PMC free article] [PubMed] [Google Scholar]
- 81. Neumann J, Feuerhake F, Kayser G, et al. Gene expression profiles of lung adenocarcinoma linked to histopathological grading and survival but not to EGF-R status: a microarray study. BMC Cancer. 2010;10:77. [DOI] [PMC free article] [PubMed] [Google Scholar]
- 82. Park YY, Park ES, Kim SB, et al. Development and validation of a prognostic gene-expression signature for lung adenocarcinoma. PLoS One. 2012;7(9):e44225. [DOI] [PMC free article] [PubMed] [Google Scholar]
- 83. Onaitis M, D’Amico TA, Clark CP, et al. A 10-gene progenitor cell signature predicts poor prognosis in lung adenocarcinoma. Ann Thorac Surg. 2011;91(4):1046–1050; discussion 1050. [DOI] [PMC free article] [PubMed] [Google Scholar]
- 84. Saji H, Tsuboi M, Shimada Y, et al. Gene expression profiling and molecular pathway analysis for the identification of early-stage lung adenocarcinoma patients at risk for early recurrence. Oncol Rep. 2013;29(5):1902–1906. [DOI] [PubMed] [Google Scholar]
- 85. Gerlinger M, Rowan AJ, Horswell S, et al. Intratumor heterogeneity and branched evolution revealed by multiregion sequencing. N Engl J Med. 2012;366(10):883–892. [DOI] [PMC free article] [PubMed] [Google Scholar]
Associated Data
This section collects any data citations, data availability statements, or supplementary materials included in this article.