Abstract
Background:
Diagnosing of obstructive sleep apnea (OSA) is an important subject in medicine. This study aimed to compare the performance of two data mining techniques, support vector machine (SVM), and logistic regression (LR), in diagnosing OSA. The best-fit model was used as a substitute for polysomnography (PSG), which is the gold standard for diagnosing this disease.
Materials and Methods:
A total of 250 patients with sleep problems complaints and whose disease had been diagnosed by PSG and referred to the Sleep Disorders Research Center of Farabi Hospital, Kermanshah, between 2012 and 2015 were recruited in this study. To fit the best LR model, a model was first fitted with all variables and then compared with a model made from the significant variables using Akaike's information criterion (AIC). The SVM model and radial basis function (RBF) kernel, whose parameters had been optimized by genetic algorithm, were used to diagnose OSA.
Results:
Based on AIC, the best LR model obtained from this study was a model fitted with all variables. The performance of final LR model was compared with SVM model, revealing the accuracy 0.797 versus 0.729, sensitivity 0.714 versus 0.777, and specificity 0.847 vs. 0.702, respectively.
Conclusion:
Both models were found to have an appropriate performance. However, considering accuracy as an important criterion for comparing the performance of models in this domain, it can be argued that SVM could have a better efficiency than LR in diagnosing OSA in patients.
Keywords: Genetic algorithms, logistic regression, obstructive sleep apnea, polysomnography, support vector machine
INTRODUCTION
Sleep is a fundamental behavior of all animal species and accounts for almost one-third of the human life. There are many kinds of sleep disorders one of which is sleep disorder breathing (SDB).[1] One of the most common sleep disorders is obstructive sleep apnea (OSA). It affects different aspects of human life including health and life quality.[2] OSA is characterized by repetitive collapse of the upper airway partially or completely during sleep.[1]
OSA is associated with the incidence of various diseases.[3,4,5] Due to the fact that it induces sleep and fatigue during the day, this syndrome increases the risk of car accidents 2–7 times.[6] OSA is a common disease that affects 2% of women and 4% of men in Western society.[7] The incidence of OSA differs in various regions of Iran (Isfahan province [5%][8] and Kermanshah province [27.3%][2]).
Risk factors of sleep apnea including high body mass index (BMI), old age, male gender, abdominal obesity, larger neck circumference, diabetes, cardiovascular diseases, hypertension, epilepsy, cigarette smoking, underactive thyroid, and acromegaly.[9,10,11]
Polysomnography (PSG) is used as the gold standard for the diagnosis of OSA. Although PSG is an accurate diagnostic tool in the domain of sleep disorder, it is not appropriate for screening purposes because it is expensive and time-consuming, it is not available to all patients, and patients have to wait for a long time to use it.[12] Thus, various studies have targeted new approaches to substitute PSG. Several studies have used parameters and signals obtained from electrocardiogram (ECG) or overnight oximetry and other signals.[13,14] Other studies have applied tools such as Berlin Questionnaire and Epworth sleepiness scale (ESS) as screening tools to diagnose OSA syndrome and (SDB).[12,15]
The diagnosis of OSA can be considered a binary classification subject, i.e. an attempt to find an optimal classifier to differentiate patients with or without OSA. The realm of data mining and machine learning have various classification methods such as artificial neural networks, decision trees, k-nearest neighbor, random forests, and support vector machine (SVM). Of these methods, SVM has attracted more attention owing to its better ability and higher performance in diagnosis of different diseases in recent years.[16]
Almazaydeh et al. performed a study on OSA diagnosis. ECG characteristics such as RR distance, which are more effective for diagnosis of sleep apnea, were calculated and applied to SVM. The findings showed that SVM could diagnose sleep disorder periods and patients with and without OSA with a high accuracy of approximately 96.5%.[13]
A study conducted by Hang used overnight oximetry to diagnose moderate and severe OSA in patient. The SVM model was designed according to oxyhemoglobin desaturation index. The SVM model designed according to radial basis function (RBF) kernel had the highest accuracy. The accuracy rate obtained for the diagnosis of patients with severe OSA (90.42%–90.55%) was higher than that of the patients with moderate-to-severe OSA (87.33%–87.77%).[14] However, no study has ever used clinical characteristics to diagnose OSA as SVM input and compare its accuracy with logistic regression (LR). Hence, this study was an attempt to develop the mentioned classification models to differentiate patients with and without OSA using clinical characteristics. In this respect, the best LR model was compared with SVM model, whose parameters had been optimized by genetic algorithm (GA).
MATERIALS AND METHODS
Study design and participants
A total of 250 patients with sleep problem complaints that had been diagnosed by PSG and were referred to the Sleep Disorders Research Center at Farabi hospital, Kermanshah from 2012 to 2015 were recruited in this study. All patients underwent one night of PSG (Somnoscreen plus, Somnomedics, Germany). The study data were collected from the patients’ files included variables such as age (year), gender (male/female), BMI (kg/m2), neck circumference (cm), waist circumference (cm), tea consumption (Number of tea cups per day), cigarette smoking (Number of cigarettes per day), and underlying diseases such as hypertension that measurement with mercury barometric measurements (blood pressure >140 by 80), chronic headache (any headache that occurs 15 days a month or more and lasts for at least 3 months), heart disease (any disease that occurs in the heart and the veins according to a cardiologist), respiratory disease (a disease that affects the respiratory system and it can disrupt the function of the lungs according to a specialist physician), neurological disease, and diabetes (fasting blood glucose more than 127 mg/dl). All units of this variables mention in Tables 1 and 2. Data were also obtained from the Berlin questionnaire (low risk and high risk), ESS, Global sleep assessment questionnaire (GSAQ) (snoring, break of breathing in sleep, sadness or anxiety), and from PSG, which determines the OSA status.
Table 1.
Comparison (mean±standard deviation) quantitative variables between two groups (with and without obstructive sleep apnea)
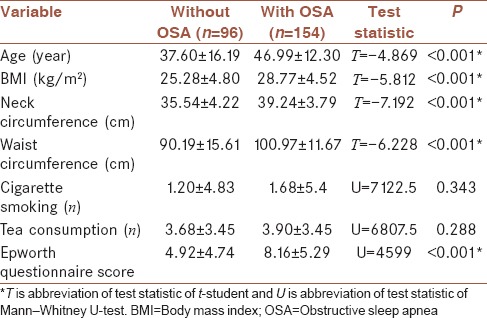
Table 2.
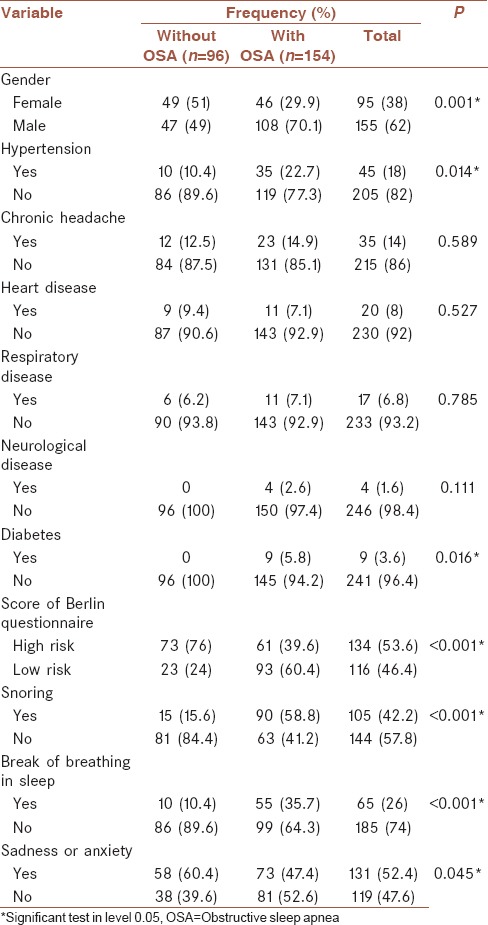
Association between qualitative variables and obstructive sleep apnea using Chi-square test
Study instruments
Berlin questionnaire is composed of 10 items in three sections (snoring where participants are asked to score their snoring; analyses excessive fatigue and sleepiness during the day, and hypertension). If the patient's score is positive in at least two sections, the patient is considered “high risk.”[17] In the study that conducted by Amra et al., Cronbach's Alpha for this questionnaire in the general population of Iran for group one was obtained 0.70 and for group two was 0.50. We used the same version in this study.[8,18]
ESS consists of eight items that aim to determine daily sleepiness among adults. ESS is obtained from the total score of the eight items, ranging from 0 to 24. A higher score indicates a higher level of sleepiness during the day.[15,19] Mean rho of ESS item scores was obtained 0.56.[19]
GSAQ is used as a familiar screening tool in primary care clinics and sleep centers. The Pearson correlation coefficients[20] showed that GSAQ differentiated between different diagnoses and could be helpful in diagnosing various sleep disorders including OSA. Reliability of this questionnaire was reported from 0.51 to 0.92.[20]
Statistical analysis
LR model, an important approach in the domain of classification, expresses the possible incidence of one of two classes of a binary criterion.
If the estimated probability is larger than 0.5 (or any other default), that member is classified into the class of patients with OSA.[21]
SVM is a supervised learning method in machine learning class, according to the statistical learning theory proposed by Vapnik in 1979 to perform classification and regression analysis.[22] The main purpose of SVM is finding the best hyperplane among possible differentiating hyperplanes. This optimal differentiation hyperplane can classify the input data points so that the distance between two classes (margin) is maximized.[23]
Kernel function includes inner nonlinear function. In a situation where the input data set can be differentiated nonlinearly, the data set by kernel function transferred to a high-dimensional feature space to be differentiated linearly.[24,25] The most common kernel functions used in SVM include:−
 : Linear (1)
 : Polynomial, and (2)
 : RBF kernel function (3)
Among the kernel functions presented, RBF kernel can be an interesting suggestion because it is more generalizable and less complex than polynomial kernel function. When the polynomial degree is increased in polynomial kernel function, many problems occur.[26] When each of these kernel functions in SVM model is used, it is necessary to set their parameters correctly to increase performance in data classification. Numerous optimization algorithms have been suggested in this regard, including grid search method,[27] particle optimization algorithm, and GA. In the present study, we used GA as an optimization method.
GA introduced by Holland (1975). GA is a random search method in artificial intelligence and is based on the theory of evolution by natural selection. This method has been inspired by biological processes of heredity such as mutation, natural selection, and genetic crossover.[28] GA uses a number of possible solutions, called population, simultaneously to solve a problem. Each member of this population is displayed by coded strings called chromosomes. Three important concepts in GA include initial population, fitness function, and operators. In GA, first, several possible solutions, encoded as chromosomes, are randomly chosen from among the initial population and are evaluated by fitness function. Next, these chromosomes are used to produce the next generation by selection, mutation, and crossover operators. This trend is continued from one generation to the other until the algorithm is stopped.[29]
Achievement of proposed models
First, in univariate analysis, the relationship between each independent variable and dependent variable was analyzed separately by appropriate parametric (t-student test for quantitative variable) and nonparametric (Mann–Whitney U-test for quantitative variables and Chi-square test for qualitative variables) tests. Since the number of positive cases for diabetes and neurological diseases was very few in the data set of this study, which increased the estimation of standard deviation of regression coefficient and an unexpected rise in the estimated values of odds ratio, these variables were excluded from the dataset.
To fit the SVM model, all variables were normalized and then the given model was fitted. With this conversion, data were transferred with [0, 1] interval.
The samples were divided into two groups: training data (176 patients, 70%) and testing (74 patients, 30%) by producing random numbers from Bernoulli distribution with success probability of around 70%. LR and SVM models were fitted to the training set and examined on the testing set.
For fitting the best LR model, a model with all variables was first fitted by backward elimination and stepwise regression method. Then, the variables with significant correlation with the response variable in univariate analysis were used to make another LR model. These models were compared using the Akaike's information criterion (AIC).
AIC = 2 P–2 Ln (L), P number of parameters, L maximum likelihood. A model with smaller AIC was selected as the better model.[30]
Having built the best LR model, the parameters of SVM model with RBF kernel were optimized by GA. Then, the groupings obtained from them were compared with actual data to find out whether there was a difference between the fitted groups and real groups. To this end, McNamara test was run. Then, the performance of the regression model selected from among the two proposed regressions was compared with that of SVM-based hybrid model, according to the evaluation criteria of classification models.
Data analysis was performed using R3.2.2 software and installing e1071 package to use SVM model and ga package to use GA. In addition, caret package in this software was run to obtain the evaluation criteria of the model.
From among the kernel functions presented, RBF kernel was used in SVM model.[31] For calculation of indices, four numbers in each method were determined. True positive (TP), true negative (TN), false positive (FP), and false negative (FN) calculated by classifier.[32]
 (4)
(4)
Sensitivity=Truepositiverate(TPR)= (5)
(5)
Specificity=TrueNegativerate(TNR)= (6)
(6)
RESULTS
From 250 participants, 154 had OSA and 96 did not. The mean age of the patients with OSA (46.99 ± 12.3) was higher than that of the patients without OSA (37.6 ± 16.19) (P < 0.001). In addition, the waist circumference and neck circumference in the patients with OSA were higher than those of the patients without OSA. The patients with OSA had a larger BMI, indicating a significant difference between groups (P < 0.001). Of the patients with OSA, 70.1% were male. Further, 49% did not have OSA [Tables 1 and 2].
Logistic regression model
To fit the best LR model, all predictor variables were first fed into the model and a set of five variables was selected by stepwise selection backward elimination, for inclusion in the model. The regression model 1 was fitted to the training data set using these variables [Table 3]. The final form of the fitted model is presented in equation 7.
Table 3.
Regression coefficients and their details in the model with all factors
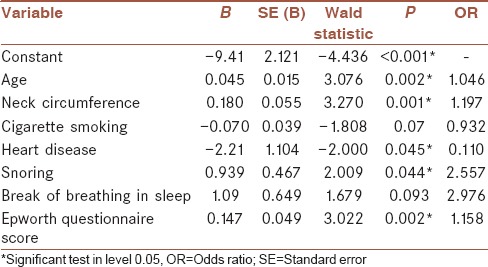
Log (P/[1 – P]) = –9.41 + 0.045 × (age) + 0.180 × (neck circumference) –2.21 × (heart disease) + 0.939 × (snoring) + 0.147 × (Epworth questionnaire Score). (7)
where AIC = 172.33.
To fitness of LR model with significant factors, the variables that were significant in univariate analysis were included in the model by stepwise selection backward elimination. These variables included age, BMI, neck circumference, waist circumference, Epworth scale score, gender, hypertension, Berlin questionnaire score, snoring, break of breathing in sleep, and feeling anxiety or sadness. Finally, four variables remained in LR model. It is noteworthy that in this model the training data set was used for fitting. The final form of the LR model with significant factors is presented in equation 8 [Table 4].
Table 4.
Regression coefficients and their details in the model with significant factors
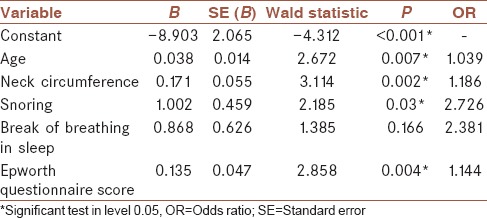
Log (P/[1 – P]) = –8.903 + 0.038 × (age) + 0.171 × (neck circumference) + 1.002 × (snoring) + 0.135 × (Epworth questionnaire score). (8)
For this model AIC = 175.97.
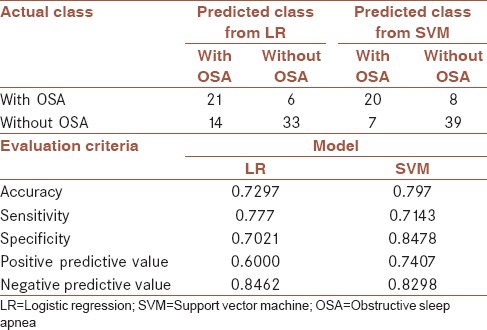
A model with smaller AIC, i.e., model 7, which had been fitted with all factors, with AIC = 172.33, was selected as the final LR model to be compared with SVM method. The results of McNamara test showed no significant difference between the groups fitted with this model and real groups (P = 0.117). Then, the performance of this model was analyzed by the testing data [Table 5]. Based on the results of this table: accuracy = 0.7297, sensitivity = 0.777, and specificity = 0.7021 was achieved.
Table 5.
Evaluation criteria for logistic regression model with all factors and support vector machine for test data (n=74)
Support vector machine model
According to the range considered for parameters; 0.01≤C≤35000 (a penalty parameter that applies a compromise between training error and generalization) and 0.0001≤γ≤10 ; and searches to find the best parameter in this range[27] by GA, and after establishing the stopping condition for GA, the obtained parameters including C = 17034.19 and γ = 0.3049167, were applied as SVM input. The SVM model was trained using the raining data and evaluation criteria of this model were obtained from the testing data [Table 5]. Based on the results: accuracy = 0.797, sensitivity = 0.7143, and specificity = 0.8478 was achieved. Further, McNamara test was run to test the presence of significance difference between the predicted groups by this method and real groups, which yielded no statistically significant difference (P = 1.0).
Comparison
The assessment criteria for both models [Table 5] are shown that all these criteria except sensitivity are better for diagnosis of OSA in SVM model than LR model. However, McNamara test revealed no significant difference between the performance of both models (P = 0.07).
DISCUSSION
Classification models based on artificial intelligence have dramatically affected the decision-making process in different sciences including medical sciences. One of the most popular models in this field is SVM. The main advantage of SVM as a data mining method is that this method overcomes the high dimensionality problem, which occurs when the number of input variables is larger than the number of observations.[33] Unlike, the parametric statistical methods such as linear and nonlinear regression models, cluster analysis, discriminant analysis, and time series analyzes that used for prediction, machine learning methods have no initial assumptions about the statistical distributions of inputs.[34,35] Many of these methods work like a black box that is inappropriate for clinical interpretation,[34] while in statistical methods, such as LR, coefficients can be interpreted.
Despite countless studies carried out on building these models, studies are constantly trying to achieve models with easier function and better performance. The main objective of the present study was introducing a basic artificial intelligence classification model to differentiate the patients with or without OSA. Compared with former models, the proposed classification model had this advantage that despite the use of clinical features in the clinical files of patients as input features (predictor variables), it had a good accuracy unlike the former models presented in this domain that used the features obtained from PSG findings, which were very costly and time-consuming, as input features of classification model.
The proposed hybrid classification model in this study was derived from a combination of two artificial intelligence approaches, SVM and GA. The performance of this model was compared with the best LR model in this study, i.e., the fitted model with all predictor variables.
Since the LR model obtained from all studied features had a lower AIC than the LR model fitted only with significant factors obtained from univariate analysis (AIC = 172.3 vs. AIC = 176), it was chosen as a better model for comparison with SVM base model.
Although McNamara test showed no significant difference between the performance of both models (P = 0.07) and both models had a good performance, the results of this study indicated that the proposed SVM base model had a better and more hopeful performance than LR model in terms of accuracy (0.797 vs. 0.729), which is an important criterion to compare the performance of models, and specificity (0.847 vs. 0.777) in classification of patients with OSA.
The superiority of the SVM model has been proven in various studies, such as in the study that was done to predict diabetes, SVM had the best performance compared with 6 data mining methods including the LR model.[36] Although in most studies, including the present study, the SVM model has more diagnostic power than the LR model, but in the study that performed by Verplanck et al., there was no significant difference between multiple LRs and SVM for mortality prediction.[21]
It should be noted that one of the limitations of this study was the low sample size (250) compared with the studies in this field. Whereas many data mining methods, including the SVM method, on a high-volume dataset, due to the increase in the number of educational data will have a better performance, so that these methods can be applied to a larger data set to increase performance.
CONCLUSION
Although the results of McNamara test showed no significant difference between the performance of the two models (P = 0.07), both models were found to have an appropriate performance. However, considering accuracy as an important criterion for comparing the performance of models in this domain, it can be argued that SVM can have a better efficiency than LR in diagnosis of OSA in patients. Therefore, the physicians are recommended to use this model as an auxiliary screening tool for the diagnosis of patients with OSA.
Financial support and sponsorship
This study was financially supported by Kermanshah University of Medical Sciences.
Conflicts of interest
There are no conflicts of interest.
Acknowledgments
The authors gratefully acknowledge the Research Council of Kermanshah University of Medical Sciences Grant Number: 94507 for the financial support. This work was performed in partial fulfillment of the requirements for postgraduate of Zohreh Manoochehri, in the Department of Biostatistics and Epidemiology, Faculty of Public Health, Kermanshah University of Medical Sciences, Kermanshah, Iran.
REFERENCES
- 1.Sadock B, Sadock V, Ruiz P. Comprehensive Text Book of Psychiatry. 9th ed. New York: Lippincott Williams & Wilkins; 2009. [Google Scholar]
- 2.Khazaie H, Najafi F, Rezaie L, Tahmasian M, Sepehry AA, Herth FJ, et al. Prevalence of symptoms and risk of obstructive sleep apnea syndrome in the general population. Arch Iran Med. 2011;14:335–8. [PubMed] [Google Scholar]
- 3.Bentivoglio M, Bergamini E, Fabbri M, Andreoli C, Bartolini C, Cosmi D, et al. Obstructive sleep apnea syndrome and cardiovascular diseases. G Ital Cardiol (Rome) 2008;9:472–81. [PubMed] [Google Scholar]
- 4.Shaw JE, Punjabi NM, Wilding JP, Alberti KG, Zimmet PZ International Diabetes Federation Taskforce on Epidemiology and Prevention. Sleep-disordered breathing and type 2 diabetes: A report from the international diabetes federation taskforce on epidemiology and prevention. Diabetes Res Clin Pract. 2008;81:2–12. doi: 10.1016/j.diabres.2008.04.025. [DOI] [PubMed] [Google Scholar]
- 5.Ghiasi F, Ahmadpoor A, Amra B. Relationship between obstructive sleep apnea and 30-day mortality among patients with pulmonary embolism. J Res Med Sci. 2015;20:662–7. doi: 10.4103/1735-1995.166212. [DOI] [PMC free article] [PubMed] [Google Scholar]
- 6.Hartenbaum N, Collop N, Rosen IM, Phillips B, George CF, Rowley JA, et al. Sleep apnea and commercial motor vehicle operators: Statement from the joint task force of the American College of Chest Physicians, the American College of Occupational and Environmental Medicine, and the National Sleep Foundation. Chest. 2006;130:902–5. doi: 10.1378/chest.130.3.902. [DOI] [PubMed] [Google Scholar]
- 7.Young T, Palta M, Dempsey J, Skatrud J, Weber S, Badr S, et al. The occurrence of sleep-disordered breathing among middle-aged adults. N Engl J Med. 1993;328:1230–5. doi: 10.1056/NEJM199304293281704. [DOI] [PubMed] [Google Scholar]
- 8.Amra B, Farajzadegan Z, Golshan M, Fietze I, Penzel T. Prevalence of sleep apnea-related symptoms in a Persian population. Sleep Breath. 2011;15:425–9. doi: 10.1007/s11325-010-0353-4. [DOI] [PubMed] [Google Scholar]
- 9.Koyama RG, Esteves AM, Oliveira e Silva L, Lira FS, Bittencourt LR, Tufik S, et al. Prevalence of and risk factors for obstructive sleep apnea syndrome in Brazilian railroad workers. Sleep Med. 2012;13:1028–32. doi: 10.1016/j.sleep.2012.06.017. [DOI] [PubMed] [Google Scholar]
- 10.Kramer MF, de la Chaux R, Fintelmann R, Rasp G. NARES: A risk factor for obstructive sleep apnea? Am J Otolaryngol. 2004;25:173–7. doi: 10.1016/j.amjoto.2003.12.004. [DOI] [PubMed] [Google Scholar]
- 11.Reddy EV, Kadhiravan T, Mishra HK, Sreenivas V, Handa KK, Sinha S, et al. Prevalence and risk factors of obstructive sleep apnea among middle-aged urban Indians: A community-based study. Sleep Med. 2009;10:913–8. doi: 10.1016/j.sleep.2008.08.011. [DOI] [PubMed] [Google Scholar]
- 12.Chung F, Ward B, Ho J, Yuan H, Kayumov L, Shapiro C, et al. Preoperative identification of sleep apnea risk in elective surgical patients, using the Berlin questionnaire. J Clin Anesth. 2007;19:130–4. doi: 10.1016/j.jclinane.2006.08.006. [DOI] [PubMed] [Google Scholar]
- 13.Almazaydeh L, Elleithy K, Faezipour M. Obstructive sleep apnea detection using SVM-based classification of ECG signal features. Conf Proc IEEE Eng Med Biol Soc. 2012;2012:4938–41. doi: 10.1109/EMBC.2012.6347100. [DOI] [PubMed] [Google Scholar]
- 14.Hang LW, Wang HL, Chen JH, Hsu JC, Lin HH, Chung WS, et al. Validation of overnight oximetry to diagnose patients with moderate to severe obstructive sleep apnea. BMC Pulm Med. 2015;15:24. doi: 10.1186/s12890-015-0017-z. [DOI] [PMC free article] [PubMed] [Google Scholar]
- 15.Johns MW. A new method for measuring daytime sleepiness: The epworth sleepiness scale. Sleep. 1991;14:540–5. doi: 10.1093/sleep/14.6.540. [DOI] [PubMed] [Google Scholar]
- 16.Tomar D, Agarwal S. A survey on Data Mining approaches for healthcare. Int J Biosci Biotechnol. 2013;5:241–66. [Google Scholar]
- 17.Netzer NC, Stoohs RA, Netzer CM, Clark K, Strohl KP. Using the berlin questionnaire to identify patients at risk for the sleep apnea syndrome. Ann Intern Med. 1999;131:485–91. doi: 10.7326/0003-4819-131-7-199910050-00002. [DOI] [PubMed] [Google Scholar]
- 18.Amra B, Nouranian E, Golshan M, Fietze I, Penzel T. Validation of the Persian version of berlin sleep questionnaire for diagnosing obstructive sleep apnea. Int J Prev Med. 2013;4:334–9. [PMC free article] [PubMed] [Google Scholar]
- 19.Johns MW. Sleepiness in different situations measured by the epworth sleepiness scale. Sleep. 1994;17:703–10. doi: 10.1093/sleep/17.8.703. [DOI] [PubMed] [Google Scholar]
- 20.Roth T, Zammit G, Kushida C, Doghramji K, Mathias SD, Wong JM, et al. A new questionnaire to detect sleep disorders. Sleep Med. 2002;3:99–108. doi: 10.1016/s1389-9457(01)00131-9. [DOI] [PubMed] [Google Scholar]
- 21.Verplancke T, Van Looy S, Benoit D, Vansteelandt S, Depuydt P, De Turck F, et al. Support vector machine versus logistic regression modeling for prediction of hospital mortality in critically ill patients with haematological malignancies. BMC Med Inform Decis Mak. 2008;8:56. doi: 10.1186/1472-6947-8-56. [DOI] [PMC free article] [PubMed] [Google Scholar]
- 22.Grimaldi M, Cunningham P, Kokaram A. An Evaluation of Alternative Feature Selection Strategies and Ensemble Techniques for Classifying Music, 2003. Citeseer. 2003 [Google Scholar]
- 23.Tamura H, Tanno K. Midpoint validation method for support vector machines with margin adjustment technique. Int J Innov Comput Inf Control. 2009;5:4025–32. [Google Scholar]
- 24.Lin CF, Wang SD. Fuzzy support vector machines. IEEE Trans Neural Netw. 2002;13:464–71. doi: 10.1109/72.991432. [DOI] [PubMed] [Google Scholar]
- 25.Javed I, Ayyaz M, Mehmood W. Efficient Training Data Reduction for SVM Based Handwritten Digits Recognition, 2007. IEEE. 2007 [Google Scholar]
- 26.Kapp MN, Sabourin R, Maupin P. A dynamic model selection strategy for support vector machine classifiers. Appl Soft Comput. 2012;12:2550–65. [Google Scholar]
- 27.Hsu CW, Chang CC, Lin CJ. Practical Guide to Support Vector Classification. 2003 researchgate.net. [Google Scholar]
- 28.Michalewicz Z. USA: Springer; 1994. GAs: What are they Genetic Algorithms + Data Structures=Evolution Programs; pp. 13–30. [Google Scholar]
- 29.Huang J, Hu X, Yang F. Support vector machine with genetic algorithm for machinery fault diagnosis of high voltage circuit breaker. Measurement. 2011;44:1018–27. [Google Scholar]
- 30.Anderson DR. New York, USA: Springer; 2002. Model Selection and Multi-Model Inference: A Practical Information-Theoretic Approach. [Google Scholar]
- 31.Gong L, Li Z, Zhang Z. Diagnosis model of pipeline cracks according to metal magnetic memory signals based on adaptive genetic algorithm and support vector machine. Open Mech Eng J. 2015;9:1076–80. [Google Scholar]
- 32.Salari N, Shohaimi S, Najafi F, Nallappan M, Karishnarajah I. A novel hybrid classification model of genetic algorithms, modified k-nearest neighbor and developed backpropagation neural network. PLoS One. 2014;9:e112987. doi: 10.1371/journal.pone.0112987. [DOI] [PMC free article] [PubMed] [Google Scholar]
- 33.Chu A, Ahn H, Halwan B, Kalmin B, Artifon EL, Barkun A, et al. A decision support system to facilitate management of patients with acute gastrointestinal bleeding. Artif Intell Med. 2008;42:247–59. doi: 10.1016/j.artmed.2007.10.003. [DOI] [PubMed] [Google Scholar]
- 34.Stylianou N, Akbarov A, Kontopantelis E, Buchan I, Dunn KW. Mortality risk prediction in burn injury: Comparison of logistic regression with machine learning approaches. Burns. 2015;41:925–34. doi: 10.1016/j.burns.2015.03.016. [DOI] [PubMed] [Google Scholar]
- 35.Biglarian A, Bakhshi E, Rahgozar M, Karimloo M. Comparison of artificial neural network and logistic regression in predicting of binary response for medical data The stage of disease in gastric cancer. J North Khorasan Univ Med Sci. 2012;3:15–21. [Google Scholar]
- 36.Tapak L, Mahjub H, Hamidi O, Poorolajal J. Real-data comparison of data mining methods in prediction of diabetes in Iran. Healthc Inform Res. 2013;19:177–85. doi: 10.4258/hir.2013.19.3.177. [DOI] [PMC free article] [PubMed] [Google Scholar]


