Abstract
Background:
Few studies have estimated effects of maternal PM2.5 exposure on birth outcomes in China due to the lack of historical air pollution data.
Objectives:
We estimated the associations between maternal PM2.5 exposure and birth outcomes using gap-filled satellite estimates in Shanghai, China.
Methods:
We obtained birth registration records of 132 783 singleton live births during 2011–2014 in Shanghai. PM2.5 exposures were assessed from satellite-derived estimates or central-site measurements. Linear and logistic regressions were used to estimate associations with term birth weight and term low birth weight (LBW), respectively. Logistic and discrete-time survival models were used to estimate associations with preterm birth. Effect modification by maternal age and parental education levels was investigated.
Results:
A 10 μg/m3 increase in gap-filled satellite-based whole-pregnancy PM2.5 exposure was associated with a −12.85 g (95% CI: −18.44, −7.27) change in term birth weight, increased risk of preterm birth (OR 1.27, 95% CI: 1.20, 1.36), and increased risk of term LBW (OR 1.22, 95% CI: 1.06, 1.41). Sensitivity analyses during 2013–2014, when ground PM2.5 measurements were available, showed that the health associationsusing gap-filled satellite PM2.5 concentrations were higher than those obtained using satellite PM2.5 concentrations without accounting for missingness. The health associations using gap-filled satellite PM2.5 had similar magnitudes to those using central-site measurements, but with narrower confidence intervals.
Conclusions:
The magnitude of associations between maternal PM2.5 exposure and adverse birth outcomes in Shanghai was higher than previous findings. One reason could be reduced exposure error of the gap-filled high-resolution satellite PM2.5 estimates.
Keywords: PM2.5, preterm birth, low birth weight, satellite-based PM2.5 predictions, multiple imputation
1. Introduction
Preterm birth and low birth weight have been widely documented as significant predictors of infant mortality and have negative long-term effects in adulthood (CDC 2002; Rogers and Velten 2011; Swamy 2011). Liu et al. (2015) estimated that in 2013, preterm birth ranked as the leading cause of death before age 5 and was responsible for 15.4% (0.965 million) of deaths before age 5 globally. Adverse birth outcomes in association with maternal exposure to PM2.5 (fine particulate matter with an aerodynamic diameter of 2.5 μm or less) have been studied in various populations (Li et al. 2017; Polichetti et al. 2013). While results from recent meta-analyses support the link between maternal PM2.5 exposure and adverse birth outcomes, substantial heterogeneity in health effect estimates exists among different studies (Sun et al. 2015; Sun et al. 2016). This heterogeneity is partly due to differences in exposure assessment methods, and the authors reported that studies assessing individual-level exposures tended to report stronger associations relative to studies assessing regional-level exposures. In addition, similar to many other health endpoints reported in the literature, the overwhelming majority of the included studies in these meta-analyses were conducted in the U.S. where PM2.5 levels are relatively low. Studies in highly polluted regions such as China can further elucidate the magnitude of PM2.5-associated health effects at high exposure levels. However, ground measurements of PM2.5 concentrations are often very sparse or nonexistent in most part of the developing world. For countries where the air quality monitoring network was established recently, lack of long-term measurements remains an obstacle to studying the association between adverse birth outcomes and exposure to PM2.5. Additionally, measurements from ground central monitors have limited spatial representativeness. Previous studies used specific buffers, ranging from 6.4 km to 50 km in radius, around monitoring stations to select study populations and assign exposure, with the intent of reducing exposure error (Chang et al. 2011; Darrow et al. 2011; Hyder et al. 2014). However, this method reduces sample size, and an optimal cutoff distance is difficult to determine.
To assess historical air pollution levels and characterize local-scale variability in air pollution, satellite-retrieved aerosol optical depth (AOD) has been used to predict ground PM2.5 concentrations during the past decade (Seltenrich 2014). Polar-orbiting satellites have global coverage, long data records, and high spatiotemporal resolution, but missingness in satellite data has raised concerns regarding its use in epidemiological studies. Annually, 30 to 70% satellite retrievals can be missing due to cloud cover and high surface reflectance in East Asia (Xiao et al. 2016). Unfortunately, situations that lead to failed satellite retrievals often influence the production and deposition of PM2.5, e.g. cloud cover leads to reduced photochemical reactions. Thus, using satellite predictions without accounting for the nonrandom missingness may result in exposure misclassification. Strickland et al. (2016) evaluated the influence of missing satellite-derived PM2.5 predictions on the association between short-term PM2.5 exposure and pediatric emergency department visits in Georgia, US. They reported that, in general, a large proportion of missing satellite predictions tended to overestimate regional average PM2.5 exposure compared with ground measurements and led to lower health association estimates. To date, studies on the influence of missing satellite data on PM2.5 longer-term exposure assessment are very limited.
We developed a gap-filling method that provided full-coverage daily PM2.5 predictions at 1-km resolution using the Multi-Angle Implementation of Atmospheric Correction (MAIAC) aerosol product (Xiao et al. 2017). In this study, we analyzed the associations between birth outcomes (birth weight and preterm birth) and maternal PM2.5 exposure in Shanghai, China, during 2011–2014, and compared the estimated health effects using three exposure metrics: satellite predictions with missingness, gap-filled satellite predictions with complete coverage, and measurements from ground central monitors.
2. Methods
2.1. Data and Outcome Assessments
Shanghai is located on the east coast of China (Figure A.1) and is one of the largest cities in the world with more than 24 million residents. Benefiting from the establishment of a special economic zone in 1993, Pudong New Area as well as Shanghai has become one the most economically developed regions in China as well as in East Asia. Birth registration data for live births between January 1st, 2011 and December 31st, 2014 were obtained from Pudong New Area Centers for Disease Control and Prevention (CDC) (n=173 403). Data for all births in Pudong New Area were collected by health facilities and reported to the Pudong New Area CDC. Although all children were born in Pudong New Area, some of these births had maternal residential address in other districts of Shanghai (Figure A.1).
Gestational age was calculated from the last menstrual period and the birth weight was measured at the time of birth using standard digital scales. The maternal residential address was geo-coded for exposure assignment. Maternal residential addresses outside Shanghai or those with failed geo-coding, mainly due to incomplete address, were excluded (13%). Singleton births without congenital anomalies (96%) and with clinically estimated gestational age between 27 and 42 weeks were selected to ensure that we followed the complete first and second trimester of all births. We further excluded births with maternal age younger than 15 years or older than 44 years (0.04%). In birth cohort studies where cohort membership is defined based on birth dates, the study population tends to include longer gestations at the start of the study period and shorter gestations at the end of the study period (Strand et al. 2011). To avoid this issue, we restricted to births with an estimated conception date after June 26,2010 (27 weeks before January 1st, 2011) and before March 12,2014 (42 weeks before December 31st, 2014) (n=133 120). Births with missing variables were excluded (0.2%). Thus, 132 783 births were analyzed in this study. Preterm birth was defined as a birth with less than 37 weeks but at least 27 weeks of gestation. Term low birth weight (LBW) was defined as a full term birth (≥ 37 weeks of gestation) with a birth weight less than 2500 g.
2.2. Exposure Assessment
To analyze the influence of different exposure assessment approaches on estimated health effects, we considered three exposure metrics from satellite data and ground measurements: 1) daily PM2.5 predictions from MAIAC AOD without accounting for missing ness, 2) daily PM2.5 predictions from gapfilled MAIAC AOD with complete coverage, and 3) daily average PM2.5 measurements from ten monitoring stations. The satellite derived PM2.5 predictions were estimated during 2010–2014. PM2.5 measurements from central station were only available since 2013.
Details of the multiple imputation gap-filling method and the two-stage PM2.5 concentration prediction model can be found elsewhere (Xiao et al. 2017) and a brief description is provided here. First, we brought together the emerging MAIAC satellite aerosol optical depth (AOD) retrieval, the Moderate Resolution Imaging Spectroradiometer (MODIS) cloud fraction (Platnick et al. 2003), the Community Multi-scale Air Quality (CMAQ) AOD simulations (Appel et al. 2012) and elevation data by multiple imputation to fill missing satellite AOD. After gap-filling, the coverage of satellite retrieval increased from below 40% to 100%. Then, for daily average PM2.5 concentration prediction, we fitted a first stage linear mixed effects model driven by gap-filled AOD and meteorology variables, and a second stage generalized additive model (GAM) driven by land use information. This method provided PM2.5 predictions at 1 km resolution with complete coverage in space and time. In Shanghai, the model cross validation R2 (root mean square error) between daily model predictions and ground measurements was 0.74 (22 μg/m3) (Xiao et al. 2017). When aggregating during a certain exposure window, the gap-filled predictions had smaller bias compared to ground measurements. For example, the gap-filled satellite predictions better estimated monthly average PM2.5 concentrations (10-fold cross-validation R2=0.92 and relative prediction error=9%) than satellite predictions without accounting for missing data (R2=0.84 and relative prediction error=14%) in 2014. Trimester-specific and whole-pregnancy PM2.5 exposures were assigned by maternal residential address of each birth record and averaged from daily satellite derived PM2.5 predictions, with and without gap-filling, across each exposure window based on the estimated gestation date.
Hourly PM2.5 measurements from 10 air quality monitoring stations in Shanghai were published by the China National Environmental Monitoring Center (CNEMC, http://www.cnemc.cn/), and were downloaded from PM25.in (http://pm25.in/), a direct mirror of data from CNEMC. We removed repeated identical measurements for at least three continuous hours, assuming that such repetition was due to instrument malfunction (Rohde and Muller 2015). Daily average concentrations, calculated from hourly concentrations during 0:00–23:59 local time with at least 18 hourly measurements, were included for exposure assessment. Since more than 95% of the study population reside within 25 km of at least one monitoring station (Figure 1) and these stations were clustered with high temporal correlations ranging between 0.88 and 0.99 (Figure A.2), we used the daily regional average concentrations to assess exposure across each exposure window.
Figure 1.
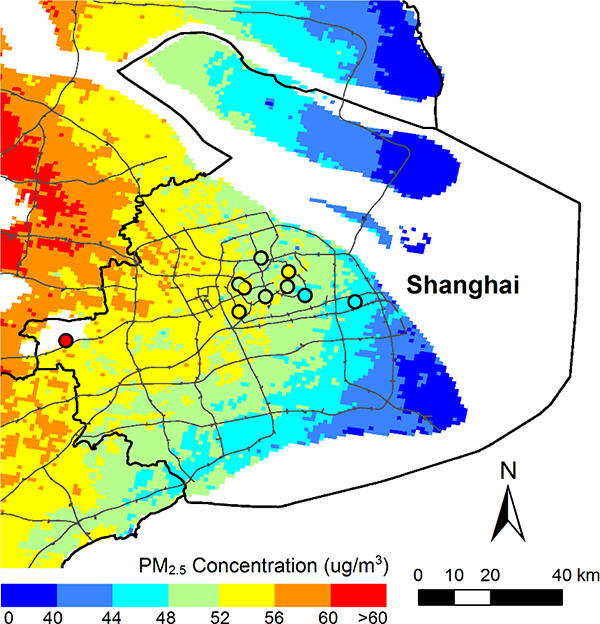
Annual average PM2.5 concentrations from gap-filled satellite predictions and central-site measurements (shown as colors in the circle) in 2014. The boundary of Shanghai (black line) and the main roads (thin grey lines) are overlaid on the map.
Meteorological variables (temperature, humidity, surface pressure) were obtained from the Goddard Earth Observing System Data Assimilation System GEOS-5 Forward Processing (GEOS 5-FP) (Lucchesi 2013).
2.3. Statistical Models
Associations of birth weight and term LBW with maternal PM2.5 exposure were estimated by linear regression and logistic regression among full term births, respectively. Logistic regression models were fitted to estimate associations between preterm birth and maternal PM2.5 exposure during the first (from conception date through gestational week 13) and second (gestational week 14–26) trimester. Discretetime survival models (Chang et al. 2011; 2013) were fitted to estimate associations during the third trimester (gestational week 27-date of birth) and the entire pregnancy, because the duration of exposures differed between preterm births and full term births. To accommodate this time-varying exposure, a discrete-time survival model was used to only consider gestational weeks when pregnancies were at risk of being preterm (i.e. 27–37th gestational week). Specifically, this model assumes each birth is no longer at-risk (censored) of being preterm at week 37. The discrete-time survival model can be expressed as Equation 1(Hao et al. 2016; Johnson et al. 2016; Pereira et al. 2016).
| 1 |
where Yit indicates for pregnancy i, whether a birth occurred during gestational week t; Eit indicates the average pollution level for pregnancy i from gestational week 27 to gestational week t for associations with the third trimester exposure or from gestational week 1 to gestational week t for associations with the entire pregnancy exposure, respectively; Xi indicates covariates that were controlled in this study and GestWeekt indicates the gestational week.
We controlled the following covariates in all models: parental education levels (high school or lower, college, graduate school), maternal age (continuous), parity (1,2, >2), birth location (hospital, maternal health service center, others), infant sex, average temperature and average surface pressure during the corresponding exposure period (continuous), season for conception (a categorical variable with four levels), and long-term temporal trend (a cubic spline with one knot per year) (Hao et al. 2016; Woodruff et al. 2009). Paternal age and average relative humidity were included in the initial regression, but they resulted in no meaningful changes in the effect estimates and were excluded from the final model. Analyses were performed separately using each of the three exposure metrics described above. We used 10 μg/m3 as the exposure increment to enable the comparison of health association estimates across exposure metrics. Since PM2.5 measurements are only available since 2013, we only included births with an estimated gestation date after January 1st 2013 when comparing across exposure metrics. We also reported health association estimates per interquartile range (IQR) change in PM2.5 exposure to facilitate the comparison across exposure windows. IQRs were calculated from each trimester-specific/pregnancy exposures of all births.
To investigate the potential effect modification of maternal age, we stratified the study population by mothers older than 35 years vs. 35 years or younger (Ferré 2016). We also investigated the potential effect modification of parental social economic status by stratifying the study population by maternal and paternal education levels (college and higher or not), separately. To investigate the potential confounding due to unobserved spatial trends, we conducted a sensitivity analysis using generalized additive models with the spatial trends being controlled by a thin-plate spline of longitude and latitude of the centroid of each grid cell. The satellite-based PM2.5 prediction and exposure assessment were conducted using R 3.4.1 and the epidemiological analyses were conducted in SAS 9.4.
3. Results
The annual average PM2.5 concentrations from satellite predictions and central-site measurements in 2014 are shown in Figure 1. PM2.5 concentrations decreased from west to east. Characteristics of the study population are shown in Table 1. The mean birth weight among term births was 3389 g, with a standard deviation of 403 g. The preterm birth rate in Shanghai during 2011–2014 was 4.41% and the term LBW rate was 0.95%. Previous studies reported higher preterm birth rate in China (4.8%) during 2004–2008 (Fleischer et al. 2014) and in one hospital in Shanghai (6.8%) during 2010–2012 (Xue et al. 2016). However, Xue et al. (2016) included multiple pregnancies (17.7%) and births with fetal anomalies (0.8%) in their study. Multiple pregnancies have a significantly higher preterm birth rate than singletons (Kurdi et al. 2004). Another study reported the preterm birth rate being 7.4% and term LBW rate being 2.06% during 2012–2014 (Tang et al. 2017) in China, included multiple pregnancies (3.3%) with a higher risk of term LBW than singletons (OR = 21.9, 95% CI: 20.9, 22.9). The LBW rate in developed regions of China, e.g. Shanghai, has been reported to be lower than the national average (Chen et al. 2013). Additionally, our data included births from hospitals as well as births from maternal health service centers and other places. Consistent with previous findings, we noticed that births in hospital (preterm birth rate=4.81% and term LBW rate 1.09%) had a higher rate of adverse birth outcomes than births in other places (preterm birth rate=3.64%and term LBW rate 0.70%) (Tang et al. 2017). When including multiple pregnancies and excluding births outside hospital, the rate of preterm birth and term low birth weight were 6.1% and 1.3%, respectively, consistent with previous findings. The male/female ratio was 1.13 and 96.8% of mothers are ethnic Han. Shanghai is one of the most developed regions in China and more than half of parents have a Bachelor’s degree or higher. The births with failed geocoding of maternal address had similar preterm birth rate (4.6%), term LBW rate (0.95%), and birth weight distribution among term births (mean 3399, standard deviation 414). However, fewer mothers with failed geocoding had a Bachelor’s degree or higher (42.2%) relative to mothers with successful geocoding (52.5%).
Table 1.
Descriptive statistics of the birth cohort in Shanghai during 2011–2014 (n=132 783).
| Variable | Level | |
|---|---|---|
| Birth weight among term births (g) | Mean (std) | 3352 (447) |
| Preterm birth (%) | 4.41 | |
| Term low birth weight (%) | 0.95 | |
| Gender (%) | Female | 47.0 |
| Parity (%) | 1 | 69.9 |
| 2 | 27.5 | |
| >2 | 2.6 | |
| Birth location (%) | Hospital | 65.0 |
| Maternal health service center | 35.0 | |
| Others | 0.02 | |
| Mother’s age (year) | Mean (std) | 28(5) |
| Mother’s ethnic origin (%) | Han | 96.8 |
| Father’seducation level (%) | Graduate | 9.4 |
| College | 43.6 | |
| High school or lower | 47.0 | |
| Mother’s education level (%) | Graduate | 7.1 |
| College | 45.4 | |
| High school or lower | 47.5 |
Table 2 shows the characteristics of the three PM2.5 exposure metrics. The PM2.5 exposure derived from satellite data with missingness had higher average values (e.g., 72μg/m3 during the entire pregnancy) than exposure from gap-filled satellite predictions (60 μg/m3) and central-site measurements (58 μg/m3). One explanation of the lower average PM2.5 predictions after gap-filling is that cloud cover leads to reduced photochemical reaction and precipitation removes PM2.5 from the atmosphere, leading to decreased PM2.5 dry mass concentration (Yu et al. 2015). The PM2.5 exposure assessed from gap-filled satellite predictions and from central-site measurements were highly correlated, with the Pearson’s correlation coefficients of exposures during the first, second, third trimester and whole pregnancy being 0.96, 0.97, 0.97, and 0.83, respectively. The relatively low correlation coefficients of exposures during pregnancy is because when averaging during a longertime (pregnancy), the spatial variations became more important and the 1-km satellite predictions had larger footprints than point measurements from ground monitors. The correlation between exposure estimated from satellite data without accounting for missing ness and from ground measurements was weaker(Table A.1).
Table 2.
Descriptive statistics of the three PM2.5 exposure metrics.
| Pregnancy | 1st trimester | 2nd trimester | 3rd trimester | |||||
|---|---|---|---|---|---|---|---|---|
| Mean (std) | IQR | Mean (std) | IQR | Mean (std) | IQR | Mean (std) | IQR | |
| Gap-filled PM2.5 prediction | 60 (9) | 11 | 63 (17) | 24 | 61 (16) | 23 | 57 (16) | 25 |
| PM2.5 prediction with missingness | 72 (10) | 13 | 71 (19) | 29 | 69 (18) | 26 | 65 (19) | 19 |
| PM2.5 measurements from stations | 58(7) | 14 | 59 (18) | 18 | 58 (17) | 16 | 55 (18) | 19 |
Figure 2 presents the adjusted health association estimates for term birth weight, preterm birth, and term LBW in relation to trimester-specific and pregnancy maternal PM2.5 exposures for births during 2011–2014, using gap-filled satellite predictions. PM2.5 exposures during all time windows were associated with decreased birth weight in term births. The associations per 10 μg/m3 increase in PM2.5 exposure during entire pregnancy were a −12.85 g (95% CI: −18.44, −7.27) change in birth weight and increased risk of term LBW (OR = 1.22, 95% CI: 1.06, 1.41). Magnitudes of associations with term birth weight were higher for exposures during the first (−4.66 g, 95% CI: −8.15, −1.16 per 10 μg/m3 increase in PM2.5 exposure) and the third trimester (−4.47 g, 95% CI: −8.01, −0.93) compared with exposures during the second trimester (−2.55g, 95% CI: −5.99, 0.89). Regarding preterm birth, exposures during the first trimester were observed with a higher risk (OR= 1.15, 95% CI: 1.10, 1.20 per 10 μg/m3 increase in PM2.5 exposure) than exposures during the second (OR= 1.08, 95% CI: 1.03, 1.12) and the third trimester (OR=1.06, 95% CI: 1.03, 1.08). Results using exposure window-specific IQRs as the exposure increment are shown in Figure B.1. Associations of exposure during the whole pregnancy had larger magnitudes with term birth weight (−13.60 g, 95% CI: −19.50, −7.69 per IQR increase in PM2.5 exposure) and preterm birth (OR=1.40, 95% CI: 1.28, 1.52) relative to effects of trimester-specific exposures. The third trimester exposure showed the highest risk of term LBW (OR= 1.30, 95% CI: 1.03, 1.63 per IQR) relative to exposures during other time windows.
Figure 2.
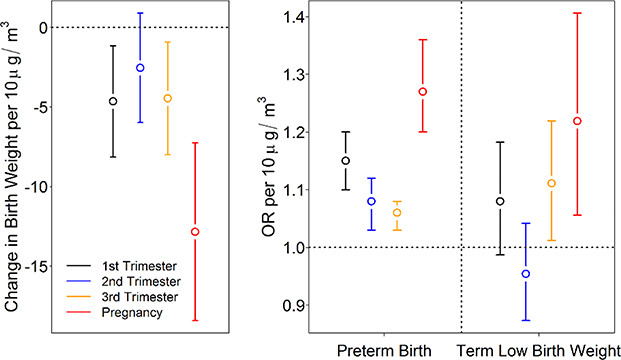
Adjusted health association estimates per 10 ug/m3 increase in PM2.5 exposure during each trimester and entire pregnancy for births between 2011 and 2014, using exposure assessed from gapfilled satellite predictions. Left: adjusted birth weight change among term births and 95% confidence interval (CI). Right: adjusted odds ratio (OR) and 95% CI for preterm birth and term low birth weight.
The comparison results across three exposure metrics for births with estimated conception date in 20132014 are shown in Figure 3. Non-random missingness in satellite predictions decreased the accuracy of exposure assessment. For both birth weight and preterm birth, estimated effects using exposure from satellite data without accounting for missingness were weaker than estimated effects using exposure from gap-filled satellite data and ground measurements. Estimated effects using ground-based exposure had similar magnitude, but wider confidence intervals, sometimes including the null, than those using gap-filled satellite-based exposure. For example, the estimated ORs of preterm birth in association with the second trimester exposures assessed with central-site measurements and gap-filled satellite predictions were 1.06 (95% CI 0.96, 1.18) and 1.10 (95% CI: 1.03, 1.18), respectively.
Figure 3.
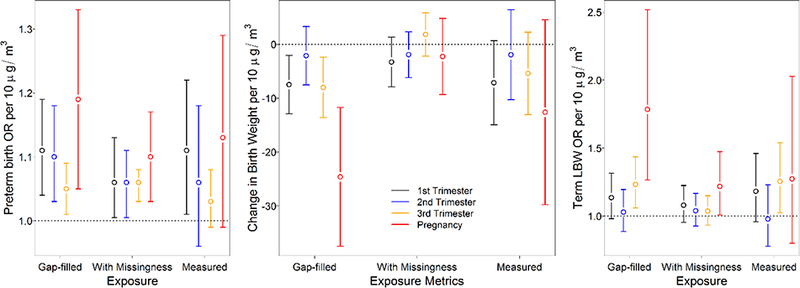
Adjusted OR for preterm birth (left), adjusted birth weight change in term births (middle) and adjusted OR for term LBW (right) per 10 μg/m3 increase in PM2.5 exposure during each trimester and entire pregnancy for births between 2013 and 2014. Exposures were based on gap-filled satellite predictions, satellite predictions without accounting for missingness, and ground measurements.
Figure 4 shows adjusted health effect estimates stratified by maternal age and maternal education level, using exposures based on gap-filled satellite predictions. In pregnant women older than 35 years, we observed stronger associations between PM2.5 exposure and adverse health outcomes. Due to the small proportion of births with mothers older than 35 years, this group had a much wider 95% CI than the less than or equal to 35 year-old group. Among women with college or higher education, the estimated risk of preterm birth (OR=1.19, 95% CI: 1.08, 1.32 per 10 μg/m3 increase in entire pregnancy PM2.5 exposure) was lower; however, the estimated effect of PM2.5 exposure on birth weight (−45.57 g, 95% CI: −54.31, − 36.83) was higher. For mothers without college education, the estimated OR for preterm birth was 1.32 (95% CI: 1.22, 1.43) and the estimated decrease in birth weight was −26.01 g (95% CI: − 34.44, 17.59). We also stratified the population by paternal education level and had parallel findings (Figure B.2).
Figure 4.
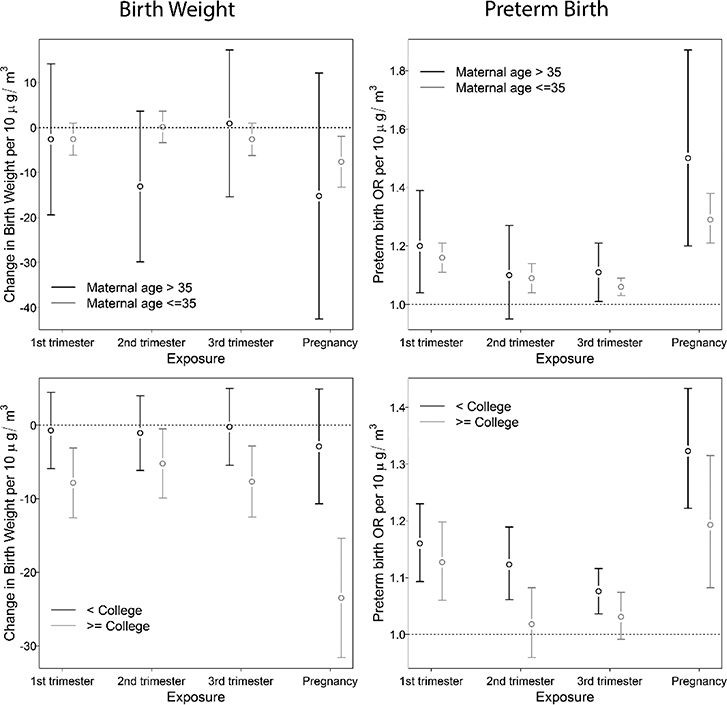
Adjusted health effect estimates per 10 μg/m3 increase in trimester-specific and entire pregnancy PM2.5 exposures, stratified by maternal age and maternal education level for term births during 2011–2014. Exposures were based on gap-filled satellite predictions.
When controlling for spatial trends, the estimated associations with adverse birth outcomes became weaker and the estimated confidence intervals expanded (Table 3), probably because the spatial variations in PM2.5 were removed by the flexible spatial spline smoother. As seen in Figure B.3, the GAMestimated thin-plate spline that related preterm births and PM2.5 exposure showed a similar pattern to the spatial distribution of PM2.5 concentrations in Shanghai, with higher values in the northwest..
Table 3.
Health effect estimates per 10 pg/m3 increase in gap-filled satellite based PM2.5 exposure for births during 2011–2014, controlling for spatial and temporal trends by generalized additive model.
| Change in birth weight | OR for preterm birth | |
|---|---|---|
| First trimester | 1.08 (−2.81, 4.96) | 1.06 (1.01, 1.11) |
| Second trimester | 0.66 (−3.61, 4.93) | 0.96 (0.91, 1.01) |
| Third trimester | −1.40 (−5.78, 2.97) | 1.00 (0.97, 1.03) |
| Whole pregnancy | −15.32 (−25.76, −4.88) | 1.06 (0.95, 1.17) |
4. Discussion
In this study, we observed associations between maternal PM2.5 exposure during all exposure windows and adverse birth outcomes, including decreased birth weight, increased risk of term LBW, and increased risk of preterm birth in a highly polluted region. Exposure assessment approaches affected the estimated health effects, and satellite based exposures that did not account for missing data led to lower magnitude health effect estimates. Maternal age and parental education levels appeared to modify the associations between maternal PM2.5 exposure and birth outcomes.
Consistent with previous studies, we observed increased risk of adverse birth outcomes in association with maternal PM2.5 exposure; however, the biological mechanisms of these associations are not clear. Findings from previous studies indicated that inflammation and DNA methylation may be involved in the mechanism of the adverse birth outcomes in association with PM2.5 exposure. Nachman et al. (2016) reported that maternal PM2.5 exposure was associated with increased intrauterine inflammation (IUI) that has been identified as a risk factor of adverse birth outcomes. They also noticed that exposure during the first trimester (OR=1.93, 95% CI: 1.55, 2.40, comparing the highest versus the lowest quartile of exposure levels) showed the strongest associations. Janssen et al. (2013) reported that PM2.5 exposure was associated with decreased placental DNA methylation and when including exposures during each of the three trimesters in one model, only PM2.5 exposure during the first trimester showed significant effects. In our study, we also observed larger health effects in association with exposure during the first trimester.
The exposure levels in Shanghai are much higher than other areas that have been studied previously. Research in the U.S. reported mean PM2.5 exposure during the entire pregnancy ranging between 9.9 μg/m3 in Florida and 18.7 μg/m3 in California (Sun et al. 2016). In our study, the mean PM2.5 exposure during the whole pregnancy was 60 μg/m3, estimated from gap-filled satellite predictions. We reported associations of higher magnitude between PM2.5 exposure and birth outcomes than previous studies. Previous meta-analyses reported combined estimates of OR for preterm birth per 10 μg/m3 increase in PM2.5 exposure during the whole pregnancy being 1.13 (95% CI: 1.03, 1.24) (Sun et al. 2015) and 1.02 (95% CI: 0.93, 1.12) (Li et al. 2017). Dadvand et al. (2013) collected data from 14 centers (nine countries) and reported the combined OR for term LBW being 1.10 (95% CI: 1.03, 1.18) per 10 μg/m3 increase in PM2.5 exposure during entire pregnancy. We reported the OR for preterm birth and term LBW being 1.27 (95% CI: 1.20, 1.36) and 1.22 (95% CI: 1.06, 1.41) in association with 10 μg/m3 increase in PM2.5 exposure during entire pregnancy. This difference could be partly due to different exposure assessment methods, i.e., most previous studies used central-site measurements for exposure assessment while we used highresolution satellite predictions in this study. Since most monitoring sites are located in urban centers, their measurements may overestimate individual exposure and attenuate health effect estimates. We found two studies that estimated health effects of PM2.5 exposure on birth outcomes in China. Qian et al. (2016) reported the OR of preterm birth was 1.03 (95% CI: 1.02, 1.05) per 5 μg/m3 increase in PM2.5 exposure during the entire pregnancy in Wuhan, China. Fleischer et al. (2014) analyzed data of the World Health Organization Global Survey (WHOGS) and reported that the OR of preterm birth and LBW were 1.11 (95% CI: 1.04, 1.17) and 1.07 (95% CI: 1.01, 1.14) per 10 μg/m3 increase in PM2.5 exposure during the entire pregnancy in China, separately. These two studies assessed exposure from two ground monitoring stations (Qian et al. 2016) or from seasonal adjusted long-term (2001–2006) average PM2.5 predictions from satellite (Fleischer et al. 2014). By employing high-resolution satellite predictions for exposure assessment, we reduced potential exposure misclassification in this study.
We observed that satellite-based PM2.5 predictions without accounting for non-random missingness overestimated gestational PM2.5 exposure compared to ground measurements (Xiao et al. 2017), thus leading to an apparent attenuation in health effect estimates. This finding is consistent with previous studies (Jerrett et al. 2017; Strickland et al. 2016). As discussed in previous research, in studies using daily exposures, the missing daily air pollution estimates result to a smaller study population, and gapfilling intends to increase the precision of estimated effects. In studies using long-term average exposures, such as this study, the missing daily air pollution estimates did not decrease the population size, rather increases the exposure error since the observed daily pollution levels are systematically different from the missing daily pollution levels. Thus, gap-filling is needed to increase the accuracy of exposure assessments. In our study, health associations estimated using satellite-based exposures had similar magnitudes but tighter confidence intervals compared to health associations estimated using ground-based exposures. Although central-site measurements have high accuracy, they only measure PM2.5 concentrations at specific locations and thus failing to reveal the local-scale spatial variations in PM2.5 exposure, leading to more Berkson error and wider confidence intervals. Employing high-resolution complete-coverage satellite data may improve the accuracy of exposure assessments and decrease measurement bias in the health associations.
In this study, we examined potential effect modification and found higher estimated risk of PM2.5 exposure on adverse birth outcomes among pregnant women older than 35 years. We also found that pregnant women with higher education level had a lower estimated risk of preterm birth, but a larger decrease in birth weight in association with PM2.5 exposure. These differences in estimated health effects were not statistically significant, except that the estimated decrease in birth weight in association with entire pregnancy exposure for women with college or higher education level was significantly larger than that for women with lower education level. Pregnant women with higher education level may be more vulnerable to air pollution-associated decrease in birth weight due to less exposure to competing risks, e.g. lack for health care; however, findings from previous studies on the effect modification of maternal education level are not consistent (Genereux et al. 2008; Hao et al. 2016; Laurent et al. 2014; Pedersen et al. 2013; Vinikoor-Imler et al. 2014).
In Shanghai, we found high correlation coefficients between daily regional average PM2.5 and other air pollutants: CO (correlation coefficient r=0.87), NO2 (r=0.75), and SO2 (r=0.76). Thus, a multipollutant model could result in unstable estimates due to the high collinearity and we did not fit such a model. In our study, the estimated PM2.5 associations may be representing associations for a broader mix of air pollutants.
There were 13% of births with failed geocoding mainly due to incomplete address, which were removed from the study population. However, these excluded births due to failed geocoding did not have a higher risk of adverse birth outcomes than those with successful geocoding. Another limitation of this study is the potential for spatial confounding. There is a benefit of allowing both spatial and temporal contrast in this study; however, spatial confounding, especially by socioeconomic status, may bias the health association estimates. To account for potential confounding due to social economic factors, we controlled parental education levels in statistical models. We also conducted sensitivity analyses by adding a spatial spline smoother to control potential spatial confounding. When controlling for spatial trends, almost all the health association estimates decreased. Presumably this was partly due to the control of spatial variation in PM2.5 exposure, although it might also reflect the lessening or elimination of a confounding bias. The ability of flexible spatial smoothers to attenuate effects of spatial covariates due to collinearity has been well documented by previous studies (Hodges and Reich 2010; Paciorek 2010).
Another limitation of this study is the lack of behavioral information and categorized parental occupations. Indoor smoking and alcohol consumption were treated as potential confounders in some previous studies on birth outcomes (Hao et al. 2016; Woodruff et al. 2009) and a previous study reported that employed women had lower risk of preterm delivery compared with unemployed women (Casas et al. 2015), but this information is not recorded in the birth registration dataset. A previous study reported that among 2,345 pregnant women in five provinces of China, 4% smoked and 40% had a husband who smoked (Xu et al. 2016). This study also reported that pregnant women with a higher education level were associated with higher risk of smoking (OR 4.98, 95% CI: 1.94, 12.80). This study also reported that pregnant women with a higher education level were associated with a higher risk of smoking (OR 4.98, 95% CI: 1.94, 12.80). Thus, we controlled parental education levels as proxy indicators of smoking. Some previous studies also reported that personal behavior variables did not confound the associations between maternal PM2.5 exposure and birth outcomes, because smoking and alcohol consumption were not associated with PM2.5 exposure levels. For example, Ritz et al. (2007) reported that adjusting for personal behavioral variables, including active and passive smoking, marital status, and alcohol consumption, did not change the health effect estimates of preterm birth in association with air pollution. Darrow et al. (2006) also reported that though maternal smoking was a strong predictor of infant respiratory mortality, it did not confound the associations between ambient air pollution and mortality.
Residential mobility may be an additional limitation, leading to exposure misclassification when assigning maternal exposure with PM2.5 concentrations at the residence of birth. Pennington et al. (2016) estimated that not accounting for residential mobility led to −2% to −10% bias towards the null in cohort that 18.6% of children were born to mothers who changed residence during pregnancy. Pereira et al. (2016) reported that accounting for residential mobility did not change the health association estimates of PM10. A previous study reported that 8.4% of pregnant women changed residence in Wuhan, China (Qian et al. 2016). Unfortunately, there is no study on residential mobility in Shanghai, but we expect residential mobility to be nondifferential with respect to exposure and birth outcomes, thus the potential bias would be toward to null.
5. Conclusions
We reported decreased birth weight as well as increased risk of preterm birth and term LBW in association with maternal PM2.5 exposure in Shanghai, China, from 2011–2014. The magnitude of associations between maternal PM2.5 exposure and birth outcomes was slightly higher than previously reported findings. Health association estimates were influenced by exposure assessment approaches, and when using satellite predictions for exposure assessment, researchers should account for missing data. We observed associations of higher magnitudes for first and third trimester exposure and birth weight, as well as between first trimester exposure and preterm birth. Mothers older than 35 years and without college education tended to have higher risk ratio for the PM2.5 exposure associated preterm birth.
We assessed PM2.5 exposure, accounting for missing data, at 1-km resolution
Maternal PM2.5 exposure was associated with decreased birth weight
Maternal PM2.5 exposure was associated with increased risk of preterm birth
The magnitude of the estimated associations are higher than precious findings
Satellite based exposure assessment without accounting for missing data led to bias
Acknowledgments:
This work was supported by the National Institutes of Health [grant number R01ES027892]; the Public Welfare Research Program of National Health and Family Planning Commission of China [grant number 201502003]; and the General Program of Health Bureau of Shanghai Pudong New Area [grant number PW2016A-6].
Appendix A
Figure A.1.
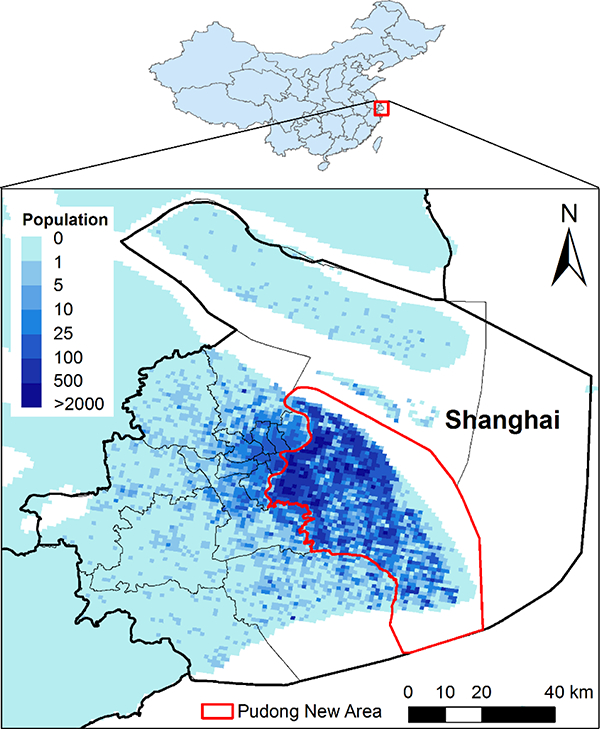
Study population distribution in Shanghai, China, during 2011–2014.
Figure A.2.
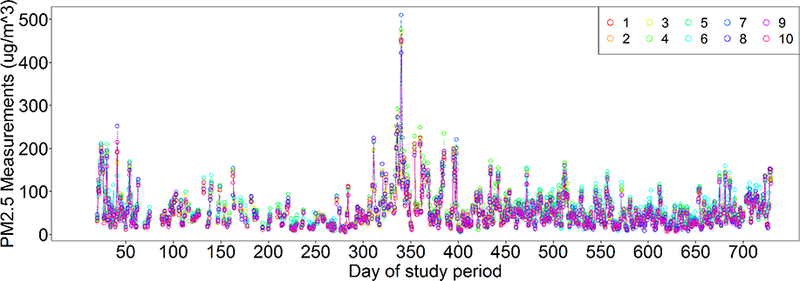
Temporal trends of PM2.5 concentrations measured at ten monitoring stations (1–10) in Shanghai during 2013–2014.
Table A.1.
Correlation coefficients between the three PM2.5 exposure metrics
| Gap-filled predictions vs. Measurements |
With-missing predictions vs. Measurements |
Gap-filled predictions vs. with-missing predictions |
|
|---|---|---|---|
| 1st trimester | 0.96 | 0.88 | 0.93 |
| 2nd trimester | 0.97 | 0.87 | 0.91 |
| 3rd trimester | 0.97 | 0.89 | 0.92 |
| Pregnancy | 0.83 | 0.80 | 0.96 |
Appendix B
Figure B.1.
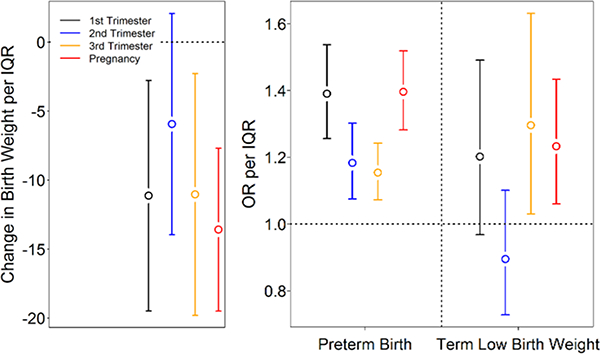
Adjusted health effect estimates per IQR increase in PM2.5 exposures during each trimester and entire pregnancy for births between 2011 and 2014, using exposure assessed from gap-filled satellite predictions. Left: adjusted birth weight change among term births and 95% confidence intervals. Right: adjusted odds ratio (OR) and 95% confidence intervals for preterm birth and term low birth weight.
Figure B.2.
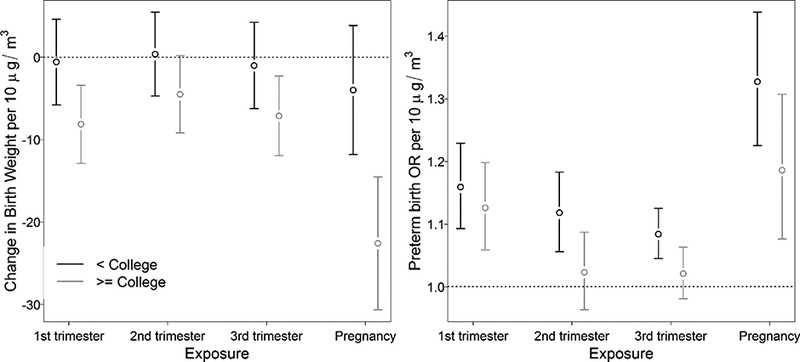
Adjusted health effect estimates per 10 μg/m3 increase in trimester-specific and entire pregnancy PM2.5 exposure, stratified by paternal education level for term births during 2011–2014. Exposures were based on gap-filled satellite predictions
Figure B.3.
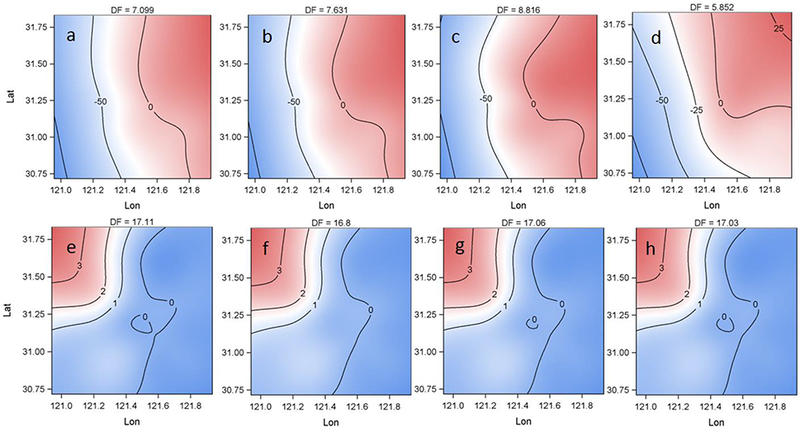
The fitted spatial patterns from GAM in the sensitivity analysis. a-d: spatial patterns in models relating term birth weight to exposure during the first (a), second (b), third (c) trimester and entire pregnancy (d). e-f: spatial patterns in models relating preterm birth to exposure during the first (e), second (f), third (g) trimester and entire pregnancy (h).
Footnotes
The authors have no conflict of interest to declare.
Publisher's Disclaimer: This is a PDF file of an unedited manuscript that has been accepted for publication. As a service to our customers we are providing this early version of the manuscript. The manuscript will undergo copyediting, typesetting, and review of the resulting proof before it is published in its final citable form. Please note that during the production process errors may be discovered which could affect the content, and all legal disclaimers that apply to the journal pertain.
References:
- Appel KW; Chemel C; Roselle SJ; Francis XV; Hu R-M;Sokhi RS; Rao S; Galmarini S Examination of the Community Multiscale Air Quality (CMAQ) model performance over the North American and European domains. Atmospheric environment 2012;53:142–155 [Google Scholar]
- Casas M; Cordier S; Martinez D; Barros H; Bonde JP; Burdorf A;Costet N; Dos Santos AC; Danilevičiūtė A; Eggesbø M Maternal occupation during pregnancy, birth weight, and length of gestation: combined analysis of 13 European birth cohorts. Scandinavian journal of work, environment& health 2015:384–396 [DOI] [PubMed] [Google Scholar]
- CDC. Infant mortality and low birth weight among black and white infants--United States, 1980–2000. MMWR Morbidity and mortality weekly report 2002;51:589. [PubMed] [Google Scholar]
- Chang HH; Reich BJ; Miranda ML Time-to-event analysis of fine particle air pollution and preterm birth: results from North Carolina, 2001–2005. Am J Epidemiol 2011;175:91–98 [DOI] [PubMed] [Google Scholar]
- Chang HH; Reich BJ; Miranda ML A spatial time-to-event approach for estimating associations between air pollution and preterm birth. Journal of the Royal Statistical Society: Series C (Applied Statistics) 2013;62:167–179 [DOI] [PMC free article] [PubMed] [Google Scholar]
- Chen Y; Li G; Ruan Y; Zou L; Wang X; Zhang W An epidemiological survey on low birth weight infants in China and analysis of outcomes of full-term low birth weight infants. BMC pregnancy and childbirth 2013;13:242. [DOI] [PMC free article] [PubMed] [Google Scholar]
- Dadvand P; Parker J; Bell ML; Bonzini M; Brauer M; Darrow LA; Gehring U; Glinianaia SV; Gouveia N; Ha E.-h. Maternal exposure to particulate air pollution and term birth weight: a multi-country evaluation of effect and heterogeneity. Environ Health Perspect 2013;121:267. [DOI] [PMC free article] [PubMed] [Google Scholar]
- Darrow LA; Woodruff TJ; Parker JD Maternal smoking as a confounder in studies of air pollution and infant mortality. Epidemiology 2006;17:592–593 [DOI] [PubMed] [Google Scholar]
- Ferré C Effects of maternal age and age-specific preterm birth rates on overall preterm birth rates— United States, 2007 and 2014. MMWR Morb Mortal Wkly Rep 2016;65. [DOI] [PubMed] [Google Scholar]
- Fleischer NL; Merialdi M; van Donkelaar A; Vadillo-Ortega F; Martin RV; Betran AP; Souza JP Outdoor air pollution, preterm birth, and low birth weight: analysis of the world health organization global survey on maternal and perinatal health. Environ Health Perspect 2014; 122:425. [DOI] [PMC free article] [PubMed] [Google Scholar]
- Genereux M; Auger N;Goneau M; Daniel M Neighbourhood socioeconomic status, maternal education and adverse birth outcomes among mothers living near highways. J Epidemiol Community Health 2008;62:695–700 [DOI] [PubMed] [Google Scholar]
- Hao H; Chang ΗH; Holmes ΗA; Mulholland JA; Klein M; Darrow LA; Strickland MJ Air pollution and preterm birth in the US State of Georgia (2002–2006): associations with concentrations of 11 ambient air pollutants estimated by combining Community Multiscale Air Quality Model (CMAQ) simulations with stationary monitor measurements. Environ Health Perspect 2016;124:875. [DOI] [PMC free article] [PubMed] [Google Scholar]
- Hodges JS; Reich BJ Adding spatially-correlated errors can mess up the fixed effect you love. The American Statistician 2010;64:325–334 [Google Scholar]
- Janssen BG;Godderis L; Pieters N; Poels K; Kiciński M;Cuypers A; Fierens F; Penders J; Plusquin M; Gyselaers W Placental DNA hypomethylation in association with particulate air pollution in early life. Particle and fibre toxicology 2013;10:22. [DOI] [PMC free article] [PubMed] [Google Scholar]
- Jerrett M; Turner MC; Beckerman BS; Pope III CA; van Donkelaar A; Martin RV; Serre M; Crouse D; Gapstur SM; Krewski D Comparing the health effects of ambient particulate matter estimated using ground-based versus remote sensing exposure estimates. Environ Health Perspect 2017;125:552. [DOI] [PMC free article] [PubMed] [Google Scholar]
- Johnson S; Bobb JF; Ito K; Savitz DA; Elston B; Shmool JL; Dominici F; Ross Z; Clougherty JE; Matte T Ambient fine particulate matter, nitrogen dioxide, and preterm birth in New York City. Environmental health perspectives 2016;124:1283. [DOI] [PMC free article] [PubMed] [Google Scholar]
- Kurdi AM; Mesleh RA; Al-Hakeem MM; Khashoggi TY; Khalifa HM Multiple pregnancy and preterm labor. Saudi medical journal 2004;25:632–637 [PubMed] [Google Scholar]
- Laurent O; Hu J; Li L; Cockburn M; Escobedo L; Kleeman MJ;Wu J Sources and contents of air pollution affecting term low birth weight in Los Angeles County, California, 2001–2008. Environ Res 2014;134:488–495 [DOI] [PubMed] [Google Scholar]
- Li X; Huang S; Jiao A; Yang X; Yun J; Wang Y; Xue X; Chu Y; Liu F; Liu Y Association between ambientfine particulate matter and preterm birth or term low birth weight: An updated systematic review and meta-analysis. Environ Pollut 2017; [DOI] [PubMed] [Google Scholar]
- Liu L; Oza S; Hogan D; Perin J; Rudan I; Lawn JE; Couse ns S; Mathers C; Black RE Global, regional, and national causes of chi Id mortality in 2000–13, with projections to inform post-2015 priorities: an updated systematic analysis. The Lancet 2015;385:430–440 [DOI] [PubMed] [Google Scholar]
- Lucchesi R File Specification for GEOS-5FP (Forward Processing). GMAO Office Note No 4(Version 11) 2013; [Google Scholar]
- Nachman RM; Mao G; Zhang X; Hong X; Chen Z; Soria CS; He H; Wang G; Caruso D; Pearson C Intrauterine inflammation and maternal exposure to ambient PM2.5 during preconception and specific periods of pregnancy: the Boston birth cohort. Environmental health perspectives 2016; 124:1608. [DOI] [PMC free article] [PubMed] [Google Scholar]
- Paciorek CJ The importance of scale for spatial-confounding bias and precision of spatial regression estimators. Stat Sci 2010;25:107. [DOI] [PMC free article] [PubMed] [Google Scholar]
- Pedersen M; Giorgis-Allemand L; Bernard C; Aguilera I; Andersen A-MN; Ballester F; Beelen RM; Chatzi L; Cirach M; Danileviciute A Ambient air pollution and low birthweight: a European cohort study (ESCAPE). Lancet Respir Med 2013;1:695–704 [DOI] [PubMed] [Google Scholar]
- Pennington AF; Strickland MJ; Klein M; Zhai X; Russell AG; Hansen C; Darrow LA Measurement error in mobile source air pollution exposure estimates due to residential mobility during pregnancy. J of Expo Sci Environ Epidemiol 2016; [DOI] [PMC free article] [PubMed] [Google Scholar]
- Pereira G; Bracken MB; Bell ML Particulate air pollution, fetal growth and gestational length: the influence of residential mobility in pregnancy. Environmental research 2016;147:269–274 [DOI] [PMC free article] [PubMed] [Google Scholar]
- Platnick S; King MD; Ackerman SA; Menzel WP; Baum BA; Riedi JC; Frey RA The MODIS cloud products: Algorithms and examples from Terra. IEEE Transactions on Geoscience and Remote Sensing 2003;41:459–473 [Google Scholar]
- Polichetti G; Capone D; Grigoropoulos K; Tarantino G; Nunziata A; Gentile A Effects of ambient air pollution on birth outcomes: an overview. Crit Rev Environ Sci Technol 2013;43:1223–1245 [Google Scholar]
- Qian Z; Liang S; Yang S; Trevathan E; Huang Z; Yang R; Wang J; Hu K; Zhang Y; Vaughn M Ambient air pollution and preterm birth: a prospective birth cohort study in Wuhan, China. Int J Hyg Environ health 2016;219:195–203 [DOI] [PubMed] [Google Scholar]
- Ritz B; Wilhelm M; Hoggatt KJ; Ghosh JKC Ambient air pollution and preterm birth in the environment and pregnancy outcomes study at the University of California, Los Angeles. Am J Epidemiol 2007;166:1045–1052 [DOI] [PubMed] [Google Scholar]
- Rogers LK; Velten M Maternal inflammation, growth retardation, and preterm birth: insights into adult cardiovascular disease. Life sciences 2011;89:417–421 [DOI] [PubMed] [Google Scholar]
- Seltenrich N Remote-sensing applications for environmental health research. Environ Health Perspect 2014;122:A268. [DOI] [PMC free article] [PubMed] [Google Scholar]
- Strand LB; Barnett AG; Tong S Methodological challenges when estimating the effects of season and seasonal exposures on birth outcomes. BMC Med Res Methodol 2011;11:49. [DOI] [PMC free article] [PubMed] [Google Scholar]
- Strickland MJ; Hao H; Hu X; Chang HH; Darrow LA; Liu Y Pediatric emergency visits and shortterm changes in PM2. 5 concentrations in the US State of Georgia. Environ Health Perspect 2016;124:690. [DOI] [PMC free article] [PubMed] [Google Scholar]
- Sun X; Luo X; Zhao C; Ng RWC; Lim CED; Zhang B; Liu T The association between fine particulate matter exposure during pregnancy and preterm birth: a meta-analysis. BMC Pregnancy Childbirth 2015;15:300. [DOI] [PMC free article] [PubMed] [Google Scholar]
- Sun X; Luo X; Zhao C; Zhang B; Tao J; Yang Z; Ma W; Liu T The associations between birth weight and exposure to fine particulate matter (PM 2.5) and its chemical constituents during pregnancy: A meta-analysis. Environ Pollut 2016;211:38–47 [DOI] [PubMed] [Google Scholar]
- Swamy GK Preterm birth, a known risk factor for infant and childhood death, is an independent risk factor for mortality in early childhood and young adulthood. BMJ evidence-based medicine 2011:ebmed-2011–100361 [DOI] [PubMed] [Google Scholar]
- Tang W; Mu Y; Li X; Wang Y; Liu Z; Li Q; Li M; Scherpbier R; Guo S; Huang X Low birthweight in China: evidence from 441 health facilities between 2012 and 2014. The Journal of Maternal-Fetal & Neonatal Medicine 2017;30:1997–2002 [DOI] [PubMed] [Google Scholar]
- Vinikoor-Imler LC; Davis JA; Meyer RE; Messer LC; Luben TJ Associations between prenatal exposure to air pollution, small for gestational age, and term low birthweight in a state-wide birth cohort. Environ Res 2014;132:132–139 [DOI] [PubMed] [Google Scholar]
- Woodruff TJ; Parker JD; Darrow LA; Slama R; Bell ML; Choi H; Glinianaia S; Hoggatt KJ; Karr CJ; Lobdell DT Methodological issues in studies of air pollution and reproductive health. Environ Res 2009;109:311–320 [DOI] [PMC free article] [PubMed] [Google Scholar]
- Xiao Q; Wang Y; Chang HH; Meng X; Geng G; Lyapustin A; Liu Y Full-coverage high-resolution daily PM 2.5 estimation using MAIAC AOD in the Yangtze River Delta of China. Remote Sens Environ 2017;199:437–446 [Google Scholar]
- Xiao Q; Zhang H; Choi M; Li S; Kondragunta S; Kim J; Holben B; Levy R; Liu Y Evaluation of VIIRS, GOCI, and MODIS Collection 6 AOD retrievals against ground sunphotometer observations over East Asia. Atmos Chem Phys 2016;16:1255–1269 [Google Scholar]
- Xu X; Rao Y; Deng S; Liu S; Guo JJ; Sharma M; Zhao Y Current smoking in pregnant women in five geographical areas of China: a cross-sectional survey. The Lancet 2016;388:S97 [Google Scholar]
- Xue Q; Shen F; Gao Y; Tong M; Zhao M; Chen Q An analysis of the medical indications for preterm birth in an obstetrics and gynaecology teaching hospital in Shanghai, China. Midwifery 2016;35:17–21 [DOI] [PubMed] [Google Scholar]
- Yu C; Di Girolamo L; Chen L; Zhang X; Liu Y Statistical evaluation of the feasibility of satellite-retrieved cloud parameters as indicators of PM2. 5 levels. Journal of Exposure Science and Environmental Epidemiology 2015;25:457–466 [DOI] [PubMed] [Google Scholar]


