Abstract
Genetically engineered mouse models are used extensively as models of human development and developmental diseases. Conventional histological approaches are static and two-dimensional, and do not provide a full understanding of the dynamic, spatiotemporal changes in developing mouse embryos. Magnetic resonance imaging (MRI) offers a noninvasive and longitudinal approach for three-dimensional in utero imaging of normal and mutant mouse embryos. In this chapter, we describe MRI approaches that have been developed for imaging the living embryonic mouse brain and vasculature. Details are provided on the animal preparation and setup, MRI equipment, acquisition and reconstruction methods that have been found to be most useful for in utero MRI, including examples of applications to fetal mouse neuroimaging.
Keywords: Diffusion MRI, Diffusion weighted gradient and spin echo (DW-GRASE), Field of excitation (FOE), Fractional anisotropy (FA), High-field MRI, Mn-enhanced MRI (MEMRI), Phased array coil, Three-dimensional (3D)
1. Introduction
As a model for mammalian embryogenesis and human developmental diseases, the mouse has provided a wealth of resources and research opportunities through the use of increasingly sophisticated genetic engineering technologies over more than two decades [1]. Despite these advances, the mouse embryo remains a difficult model organism, compared to lower species such as drosophila, c. elegans, and zebrafish. Specifically, embryogenesis involves complex spatiotemporal changes in the brain, heart, vasculature, and other organs that are difficult to observe directly in mouse embryos, which are encased deep within the maternal uterus [2]. High frequency ultrasound imaging has provided a noninvasive in utero imaging approach that enables relatively high-throughput, longitudinal three-dimensional (3D) analysis of dynamic anatomical changes in mouse embryos [3,4], but provides limited ability to manipulate image contrast to better assess changes at the organ/tissue level. While magnetic resonance imaging (MRI) has been used extensively for high-resolution (20–50 μm) ex vivo imaging of fixed mouse embryos (reviewed in [2,4]), in vivo MRI of mouse embryonic development in the normal maternal uterus has been less common. In this chapter we focus exclusively on new advances in MRI as an (in vivo) in utero imaging method that offers more control over image contrast than ultrasound.
To illustrate the potential of 3D in utero MRI for studies of developing mouse embryos, we show examples of applications in cardiovascular and brain imaging. Although these organ systems have seen the most applications to date, there is no doubt that in utero MRI can be developed and applied in future to multiple organ systems. In the brain, we have developed both in utero Manganese (Mn)-enhanced MRI (MEMRI) [5] and diffusion MRI [6] approaches that provide alternate contrast for quantitative analyses of many important tissue structures at the mesoscopic scale (~100 μm). These initial studies have demonstrated the feasibility of MEMRI and diffusion MRI to examine axonal microstructures and neuronal differentiation in the normal and mutant embryonic mouse brain, providing techniques for quantitative and longitudinal analysis of living mouse embryos, in utero.
2. Materials
2.1. High-Field MRI Systems
Small animal MRI system: a high-field (preferably 7 Telsa or higher) MRI system is required to perform in utero MRI of mouse embryos. The in utero MRI experiments described in this chapter were performed on horizontal 7 Tesla (T) and 11.7 T MRI systems (Bruker Biospin, Billerica, MA, USA), each with an integrated shim and actively shielded three-axis gradient (B-GA9S, Bruker Biospin, Billerica, MA, USA, inner diameter = 90 mm, maximum gradient strength = 740 mT/m). The 11.7 T scanner has a motor driven automatic positioning system (Autopac, Bruker Biospin) for animal positioning.
RF coils·. MRI experiments (7 and 11.7 T) have been performed using a 72 mm (inner diameter) quadrature volume coil for transmit (Bruker Biospin) in combination with a receive-only planar surface coil, using a pin-diode to decouple the transmit and receive coils and a low-noise preamplifier on the receive coil. At 11.7 T, a whole-body 8-channel receive- only phased array coil was also used (Bruker Biospin, Part No. T20035 V3) in combination with the transmit volume coil.
Mouse Holders·. We use either custom-made holders or the Autopac compatible animal holders provided by the manufacturer of the MRI system (Bruker Biospin).
Small animal monitoring and gating system: We used a system manufactured by the Small Animal Instruments, Inc. (SAII, Stony Brook, NY, USA) to monitor the physiology of the pregnant mice. The respiratory motion and body temperature was monitored via a pressure sensor and a rectal temperature probe and displayed on a computer next to the scanner console. Respiratory motion can also be monitored via a self-gated (MRI) motion signal [8]. In either case, trigger signals can be generated and sent to the MRI system to synchronize MRI acquisitions with respiratory motion. In addition, an animal warm air heating system provided by the manufacturer of the MRI system was used to maintain physiological body temperature.
Gas anesthesia machine: A veterinary isoflurane vaporizer (VMS Matrix Medical, Orchard Park, NY) was used to anesthetize pregnant mice during MRI.
2.2. Supplies
Isoflurane: (Aerane, Baxter, Deerfield IL).
MnCl2 solution: An 30 mM solution of manganese chloride tetrahydrate (e.g., Sigma 221279) in isotonic saline should be prepared ahead of time.
3. Methods
3.1. MnCl2-Contrast Agent
For MEMRI, MnCl2 solution is administered as a maternal intraper- itoneal injection 4–24 h before MRI, at a dose of 40–80 mg MnCl2 / kg body weight [5]. For all other MRI protocols described in this chapter, no exogenous contrast agents are required (see Note 1).
3.2. Animal Setup
Anesthesia is induced in pregnant mice using 3–5% isoflurane mixed with air (via the vaporizer), or with a 3:1 air:oxygen mixture (see Note 2). During MRI, the amount of isoflurane should be reduced to 1–1.5% and adjusted regularly to maintain the respiratory rate at 30–60 breaths per minute. A pregnant mouse may have up to 12 embryos, each residing in their own amniotic sacs and distributed along the two uterine horns (Fig. 1a). In order to achieve uniform excitation while maintaining high sensitivity, it is ideal to use a large whole body volume coil as the transmission coil (Tx) in combination with a receive-only surface coil or a receive- only phased array body coil (Fig. 1b). The phased array coil provides more abdominal coverage than the surface coil but the surface coil can be positioned as close to the target embryo as possible and provide higher sensitivity (see Note 3).
Fig. 1.
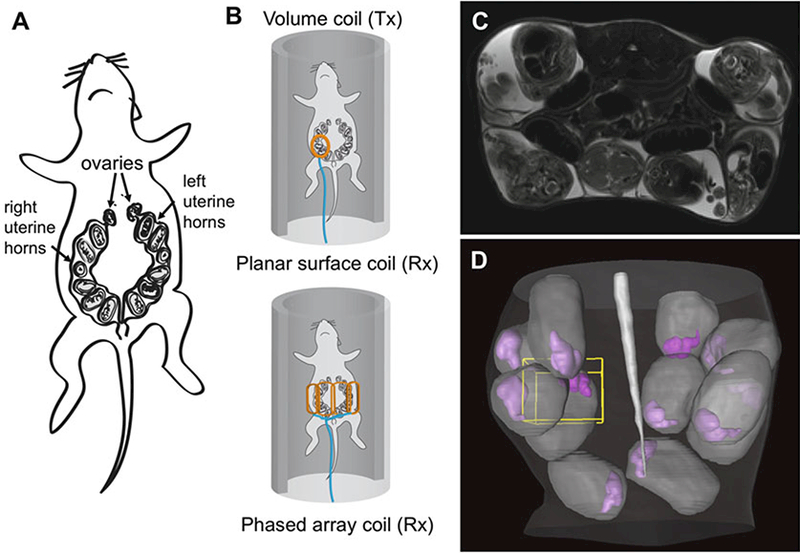
Animal setup and the initial 2D multi-slice T2-weighted images. (a) The anatomy of a pregnant mouse showing 12 embryos in the two uterine horns: (b) Placement of a pregnant mouse with a receive-only planar surface coil (top) and a receive-only phased array coil (bottom). (c) axial T2-weighted images of mouse embryos at embryonic day 17 (E17) in a pregnant mouse. The embryos are surrounded by the amniotic fluid, which has strong T2 signals. With high in-plane resolution, large internal organs, e.g., the brain, liver, and spinal cord, can be identified. (d) Three-dimensional rendering of amniotic sacs (gray) and embryonic mouse brains (purple) in the abdomen based on the axial T2-weighted images
3.3. Three-Dimensional (3D) T1- or T2*-Weighted MRI of Mouse Embryos
We have successfully used 3D gradient echo sequences to generate Tl-weighted images (echo / repetition times, TE/TR = 5/40 ms; Flip angle = 35°) for MEMRI [5], and T2*-weighted images (TE/TR = 20/50 ms; Flip angle = 20°) for in utero cardiovascular imaging [7–9]. With a close-fitting surface coil, in utero (T1- weighted) MEMRI with respiratory gating was used to acquire 100 μm isotropic resolution images of the mouse embryonic brain between E12.5–17.5 (Fig. 2a) (see Note 4) including volumetric analysis of forebrain defects in Nkx2,1−/−mutant embryos [5]. Using self-gated acquisition of 3D T2*-weighted images combined with image co-registration [8], we showed that motion artifacts can be significantly suppressed enabling acquisition of high quality vascular images from early stage (E10.5–14.5) mouse embryos [9] (Fig. 2b). Similar approaches have enabled acquisition and analyses of cardiovascular images in later stage (E17.5) embryos, including the detection of novel vascular phenotypes in Gli2−/− mutant embryos [7].
Fig. 2.
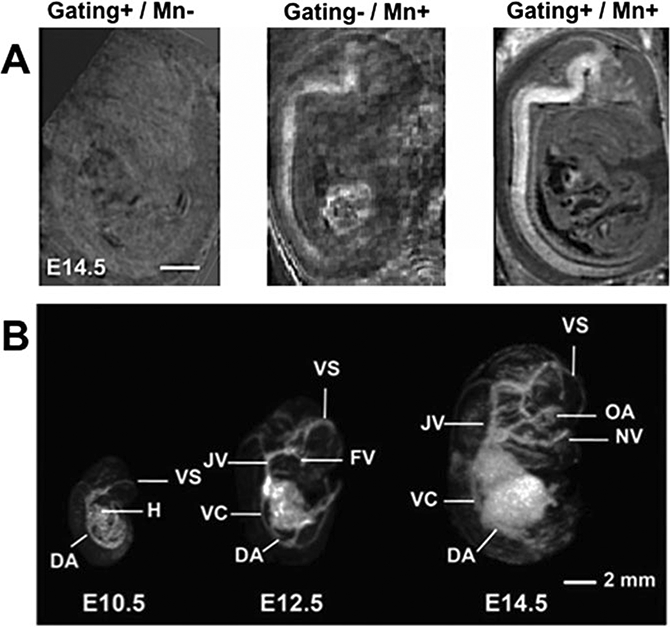
In utero Tr-weighted MEMRI and T2*-weighted vascular MRI. (a) Mn-enhancement and respiratory gating work in combination to improve in utero MRI. Images at E14.5 with gating and without Mn (Left panel, Gating+/Mn-), with Mn and without gating (Middle panel, Gating-/Mn+) and with gating and Mn (Right panel, Gating+/Mn+). Scale bar is 1 mm. The images are modified with permission from [5]. (b) 3D maximum intensity projections (MIPs) show the developing vasculature from E10.5 to E14.5. Labels: DA dorsal aorta, FV facial vein, H heart, JV jugular vein, NV nasal vein, OA optic artery, VC vena cava, VS venous sinus. The images are modified with permission from [9]
In the following sections, a systematic approach is described for identifying individual embryos and acquiring high-resolution T2- weighted and diffusion MRI images of the embryonic mouse brain [6].
3.4. Two-Dimensional (2D) Multi-Slice T2-Weighted MRI of Pregnant Mice
A fast survey of the complex anatomy can be obtained using 2D multi-slice T2-weighted MRI, which can provide satisfactory contrasts to distinguish individual embryos in a relatively short time (~5 min) (Fig. 1c). Because of the low through-plane resolution of 2D MRI, both axial and sagittal images of the mouse abdomen need to be acquired to visualize the locations and orientations of mouse embryos and guide subsequent imaging.
Axial and sagittal T2-weighted images can be acquired using the Rapid Acquisition with Relaxation Enhancement (RARE) sequence provided by the manufacturer of the MRI system with the following parameters: echo time (TE) = 50 ms, repetition time (TR) = 3000 ms, 2 signal averages, a RARE factor of 8, in-plane resolution = 0.16 mm × 0.16 mm, approximately 50 slices with a thickness of 1 mm covering the mid to lower abdomen. To remove artifacts due to respiratory motion, respiratory triggering should be enabled. Fig. 1d shows the distribution of embryos within the amniotic sacs (gray) and embryonic mouse brains (purple) in the uterus based on the 2D multi-slice T2-weighted MRI results.
3.5. Generation of Tailored Radio-Frequency (RF) Pulses for Localized Imaging of Mouse Embryos
The next step is to select an embryo for localized imaging based on the 2D multi-slice T2-weighted images (see Subsection 3.4). For localized imaging, it is necessary to define a so-called field of excitation (FOE) that encloses the selected embryo or embryonic brain. To facilitate the process, we have designed a software tool to display the T2-weighted images and define the FOE (Fig. 3). The software is based on Matlab (Mathworks, mathworks.com) and can run on the scanner console. Once the size and location of an FOE are defined, the software generates a tailored 90° selective excitation RF pulse based on a linear class of large tip-angle (LCLTA) pulses [10] with spiral k-space trajectories that start and end at the origin. Under the “incoherently refocused” condition, a 2D selective 90° RF pulse can be derived by inverse Fourier transform of the desired excitation profile [10]. The pulse is designed to excite a rectangular FOE in the x-y plane that covers the target region, with a duration of 3 ms, an amplitude of 9–10 μT and a 12-turn spiral-in excitation k-space (maximum gradient strength = 148 mT/m). Details on the performance of the designed RF pulses can be found in [11].
Fig. 3.
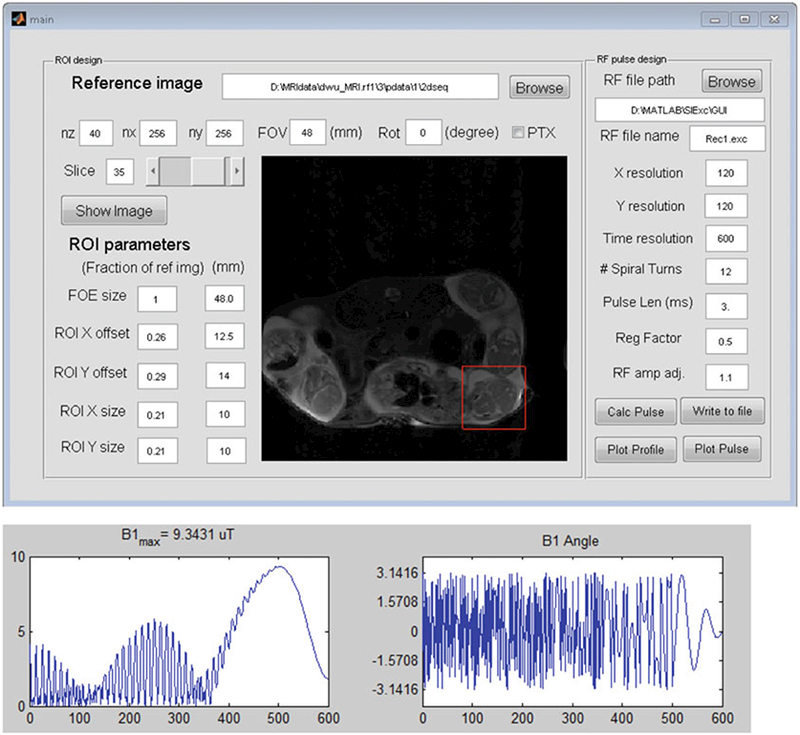
Definition of the field of excitation (FOE, represented by the red box) based on the 2D multi-slice T2-weighted images using a software tool. Using the software, users can display the T2-weighted images, define the size and spatial offsets of an FOE, and calculate the selective excitation RF pulse to excite the FOE with the desired parameters. The lower panel displays the amplitude and phase profiles of the generated RF pulse
3.6. 3D T2-Weighted and Diffusion MRI of the Embryonic Mouse Brain
To acquire high-resolution images of the embryonic mouse brain, we use a 3D diffusion-weighted gradient and spin echo (DW-GRASE) sequence [12, 13] with an echo train length of 20 for fast imaging and two navigator echoes appended after the imaging echoes to correct phase errors due to motion and instrument instability. Once the selective excitation RF pulse is generated for a particular FOE, it can be inserted in the sequence with a slab- selective refocusing RF pulse [14] to restrict the imaging slab in the third direction. Figure 4 shows a diagram of the sequence. In our previous experiments [6], 3D Diffusion MRI data were acquired using the DW-GRASE sequence with the following parameters: TE/TR =21/500 ms; two signal averages; spectral width = 120 kHz; four b0 images and 30 diffusion directions [15]; b-value = 1000 s/mm2; FOV = 12.8 mm × 12.8 mm × 8 mm; and spatial resolution = 0.2 mm × 0.2 mm × 0.2 mm in 72 min (2 min per diffusion-weighted image) or 0.16 mm × 0.16 mm × 0.16 mm in 113 min. High-resolution 3D T2-weighted images were acquired using the same setup but without diffusion weighting: TE/TR = 24/1000 ms and resolution = 0.13 × 0.13 × 0.13 mm in 10 min (see Note 5).
Fig. 4.
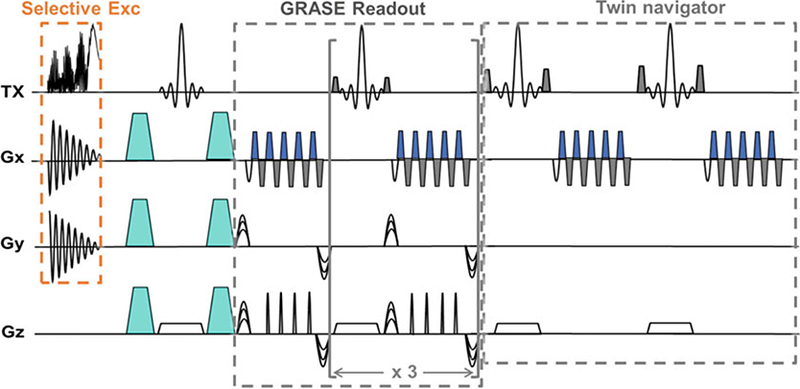
A diagram of the 3D DW-GRASE sequence with a spatially selective excitation pulse. The diagram shows the timing of the 2D selective excitation pulse together with the spiral gradient in the x-y plane, the diffusion encoding gradients (represented by turquoise trapezoids), the GRASE readout module, and the twin- navigator echoes. Each GRASE readout module acquires four gradient echoes and one spin echo, and the readout is repeated four times to achieve an acceleration factor of 20 compared to the conventional spin echo sequence. The images are modified with permission from [6]
3.7. Image Reconstruction
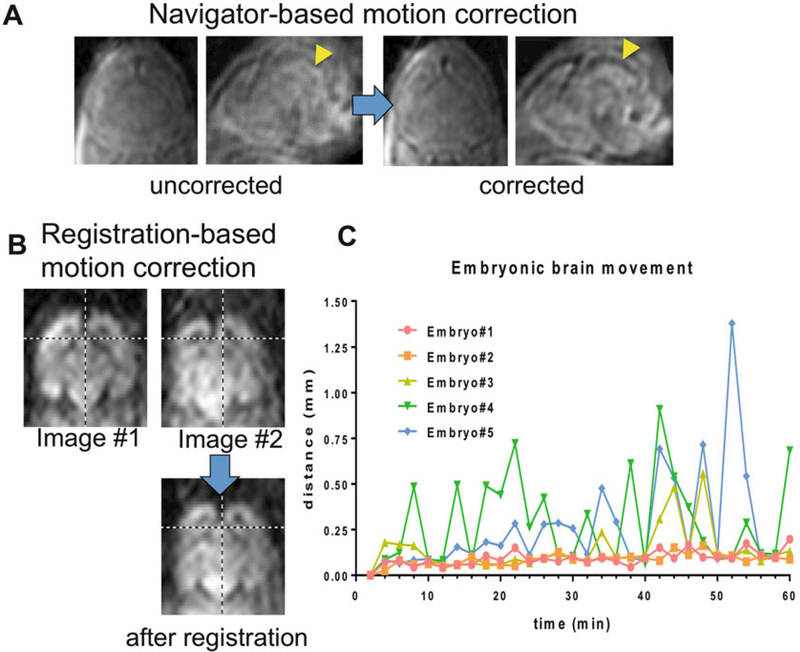
The 3D k-space data are first apodized with a tapered cosine win- dow, zero-padded to twice the original size, and reconstructed in Matlab. The twin-navigator echoes are Fourier transformed along the readout direction, which are then used to correct the phases of odd- and even-numbered echoes from each repetition and phase errors caused by intra-scan motion [12]. The 30 direction diffusion-weighted images (DWIs) are aligned to the mean DWI using 3D rigid transformation to correct any inter-scan motion. The effects ofboth navigator echoes and rigid transformation based motion corrections are shown in Fig. 5. The amount of translational motion in each diffusion direction can be estimated based on the image registration results. Images with motion above 0.6 mm (3 voxels) may be excluded from the following analysis (see Note 6).
Fig. 5.
Methods for motion correction employed in in utero imaging of the embryonic mouse brain. (a) Due to intra-scan motion, the boundary of the fourth ventricle in the embryonic mouse brain (indicated by the yellow arrow) is not clear. Real-time navigator echoes can be used to correct intra-scan motion, and the boundary of the 4th ventricle becomes clear. (b) Motions between scans cause images acquired sequentially to be mis-adlinged, as indicated by the cross-hair in the images. This mis-alignment can be corrected using linear rigid image registration. (c) The inter-scan motion can be estimated using the linear rigid image registration. The plot shows he amount of overall brain displacement of 5 E17.5 mouse brains during 60-min scans. The images are modified with permission from [6]
Diffusion tensor fitting can be performed in DtiStudio (www.mristudio.org). Using the log-linear fitting method implemented in DTIStudio (http://www.mristudio.org), the diffusion tensor was calculated at each pixel, along with the apparent diffusion coefficient (ADC), fractional anisotropy (FA), and primary eigenvector [16]. Figure 6a shows the reconstructed T2-weighted, FA, and directionally encoded colormap images of an E17.5 mouse brain. White tracts can be reconstructed using the same software with a fractional anisotropy (FA) threshold of 0.15 and maximum angle of 60° (Fig. 6c).
Fig. 6.
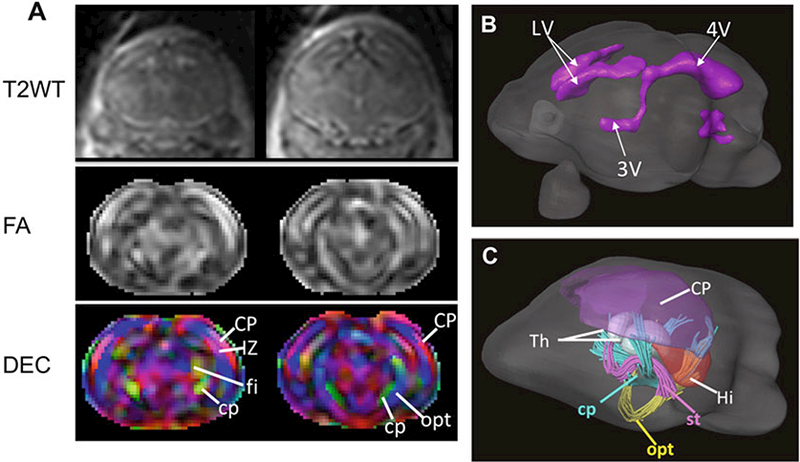
In utero MRI of the embryonic mouse brain. (a) Coronal T2-weighted, FA, and directionally encoded colormap (DEC) images of an E17.5 mouse brain. (b) Surface rendering of the ventricules in the E17.5 mouse brain based on the T2-weighted images. (c) rendering of the gray matter structures and early white matter tracts in the E17.5 mouse brain based on the diffusion MRI data. Abbreviations: CP cortical plate, cp cerebral peduncle, IZ intermediate zone, fi fimbria, Hi hippocampus, LV lateral ventricle, opt optical tract, st stria terminalis, Th thalamus, 3Vand 4Vthe third and forth ventricles
4. Notes
For in utero MRI, we have found that MnCl2 can cause embryonic toxicity and death, especially for embryos staged earlier than embryonic day (E)13.5 [5]. For embryos staged E13.5 or older, we recommend an intraperitoneal dose of 40 mg MnCl2/kg (maternal) body weight, injected 24 h before MRI to achieve adequate MEMRI contrast while avoiding acute Mn-toxicity to the embryos.
All animals used in the experiments described in this chapter were maintained under protocols approved by the Institutional Animal Care and Use Committees at New York University School of Medicine and Johns Hopkins University School of Medicine.
The phased array coil used in our study (Part No. T20035V3) was designed for imaging a rat body, which is significantly larger than the pregnant mouse. For optimal image quality, it will be critical to design a series of phased array coils that accommodate pregnant mice at different stages of pregnancy and increase sensitivity. These technical improvements are ongoing, but a description of the design, fabrication, and testing of MRI coils is beyond the scope of this chapter.
By convention, mouse embryos are staged by embryonic day (E), where E0.5 is defined to be noon of the day that a vaginal plug is detected after overnight mating.
The DW-GRASE sequence with selective excitation can be easily modified to image the entire mouse embryo. Because it requires a relatively long echo time to accommodate the GRASE readout model, the sequence cannot be used for T1-weighted MRI, which requires a short echo time. However, the selective excitation pulse can be used in standard gradient echo and spin echo sequences to achieve localized T1-weighted MRI required for MEMRI.
The twin-navigator echo approach can only be used to correct intra-scan motions along the readout direction. For imaging the mouse embryos, maternal respiratory motion is the main concern, and the readout direction should be defined along the direction of maternal respiratory motion to fully utilize the navigator-based motion correction scheme. In addition, the motion correction scheme introduced in [8] (see Subheading 3.3) can also be easily incorporated into the DW-GRASE sequence to further reduce the effects of subject motion.
Acknowledgements
We thank all the people, current and past, in the Zhang, Wu and Turnbull labs who have contributed to developing the protocols described in this chapter. This research was supported, in part, by grants from the National Institutes of Health: R01NS038461 and R01HL078665 (DHT); R01NS070909 and R01HD974593 (JZ); R21NS098018 (DW).
References
- 1.International Mouse Knockout Consortium, Collins FS, Rossant J, Wurst W (2007) A mouse for all reasons. Cell 128(1):9–13. 10.1016/j.cell.2006.12.018 [DOI] [PubMed] [Google Scholar]
- 2.Nieman BJ, Wong MD, Henkelman RM (2011) Genes into geometry: imaging for mouse development in 3D. Curr Opin Genet Dev 21(5):638–646. 10.1016/j.gde.2011.08.009 [DOI] [PubMed] [Google Scholar]
- 3.Aristizabal O, Mamou J, Ketterling JA, Turnbull DH (2013) High-throughput, high-frequency 3-D ultrasound for in utero analysis of embryonic mouse brain development. Ultra-sound Med Biol 39(12):2321–2332. 10.1016/j.ultrasmedbio.2013.06.015 [DOI] [PMC free article] [PubMed] [Google Scholar]
- 4.Nieman BJ, Turnbull DH (2010) Ultrasound and magnetic resonance microimaging of mouse development. Methods Enzymol 476:379–400. 10.1016/S0076-6879(10)76021-3 [DOI] [PMC free article] [PubMed] [Google Scholar]
- 5.Deans AE, Wadghiri YZ, Berrios-Otero CA, Turnbull DH (2008) Mn enhancement and respiratory gating for in utero MRI of the embryonic mouse central nervous system. Magn Reson Med 59(6):1320–1328. 10.1002/mrm.21609 [DOI] [PMC free article] [PubMed] [Google Scholar]
- 6.Wu D, Lei J, Rosenzweig JM, Burd I, Zhang J (2014) In utero localized diffusion MRI of the embryonic mouse brain microstructure and injury. J Magn Reson Imaging 42:717 10.1002/jmri.24828 [DOI] [PMC free article] [PubMed] [Google Scholar]
- 7.Berrios-Otero CA, Nieman BJ, Parasoglou P, Turnbull DH (2012) In utero phenotyping of mouse embryonic vasculature with MRI. Magn Reson Med 67(1):251–257. 10.1002/mrm.22991 [DOI] [PMC free article] [PubMed] [Google Scholar]
- 8.Nieman BJ, Szulc KU, Turnbull DH (2009) Three-dimensional, in vivo MRI with self-gating and image coregistration in the mouse. Magn Reson Med 61(5):1148–1157. 10.1002/mrm.21945 [DOI] [PMC free article] [PubMed] [Google Scholar]
- 9.Parasoglou P, Berrios-Otero CA, Nieman BJ, Turnbull DH (2013) High-resolution MRI of early-stage mouse embryos. NMR Biomed 26 (2):224–231. 10.1002/nbm.2843 [DOI] [PMC free article] [PubMed] [Google Scholar]
- 10.Pauly J, Nishimura D, Macovski A (1989) A linear class of large-tip-angle selective excitation pulses. J Magn Reson 82(3):571–587. https://doi.org/10.1016/0022-2364(89) 90219-9 [Google Scholar]
- 11.Wu D, Reisinger D, Xu J, Fatemi SA, van Zijl PC, Mori S, Zhang J (2014) Localized diffusion magnetic resonance micro-imaging of the live mouse brain. NeuroImage 91:12–20. 10.1016/j.neuroimage.2014.01.014 [DOI] [PMC free article] [PubMed] [Google Scholar]
- 12.Aggarwal M, Mori S, Shimogori T, Blackshaw S, Zhang J (2010) Three-dimensional diffusion tensor microimaging for anatomical characterization of the mouse brain. Magn Reson Med 64(1):249–261. 10.1002/mrm.22426 [DOI] [PMC free article] [PubMed] [Google Scholar]
- 13.Wu D, Xu J, McMahon MT, van Zijl PC, Mori S, Northington FJ, Zhang J (2013) In vivo high-resolution diffusion tensor imaging of the mouse brain. NeuroImage 83:18–26.https://doi.Org/10.1016/j.neuroimage.2013.06.012 [DOI] [PMC free article] [PubMed] [Google Scholar]
- 14.Mao J, Mareci TH, Andrew ER (1988) Experimental-study of optimal selective 180-degrees radiofrequency pulses. J Magn Reson 79(1):1–10. 10.1016/0022-2364(88)90317-4 [DOI] [Google Scholar]
- 15.Jones DK, Leemans A (2011) Diffusion tensor imaging. Methods Mol Biol 711:127–144. 10.1007/978-1-61737-992-5_6 [DOI] [PubMed] [Google Scholar]
- 16.Jiang H, van Zijl PC, Kim J, Pearlson GD, Mori S (2006) DtiStudio: resource program for diffusion tensor computation and fiber bundle tracking. Comput Methods Prog Biomed 81(2):106–116. 10.1016/j.cmpb.2005.08.004 [DOI] [PubMed] [Google Scholar]


