

SUMMARY
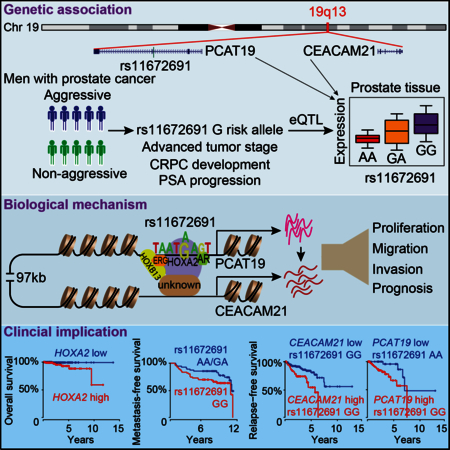
GWASs have identified rs11672691 at 19q13 associated with aggressive prostate cancer (PCa). Here, we independently confirmed the finding in a cohort of 2738 PCa patients, and discovered the biological mechanism underlying this association. We found an association of the aggressive PCa-associated allele G of rs11672691 with elevated mRNA levels of two biologically plausible candidate genes PCAT19 and CEACAM21, implicating in PCa cell growth and tumor progression. Mechanistically, rs11672691 resides in an enhancer element and alters the binding site of HOXA2, a novel oncogenic transcription factor with prognostic potential in PCa. Remarkably, CRISPR/Cas9-mediated single nucleotide editing showed direct effect of rs11672691 on PCAT19 and CEACAM21 expression, and PCa cellular aggressive phenotype. Clinical data demonstrated synergistic effects of rs11672691 genotype and PCAT19/CEACAM21 gene expression on PCa prognosis. These results provide a plausible mechanism for rs11672691 associated with aggressive PCa, and hence lay the ground work for translating this finding to the clinic.
In brief
A non-coding risk allele associated with aggressive prostate cancer creates a transcription factor binding site which in turn promotes oncogenesis by impacting expression of nearby genes
INTRODUCTION
Prostate cancer (PCa) affects millions of men worldwide, and is the second most common cancer in men and the fifth leading cause of cancer-related death, with more than 1.1 million new cases diagnosed and 300,000 deaths annually worldwide (Ferlay et al., 2015). While several risk factors have been implicated in PCa etiology and development, the genetic heritability of PCa has been estimated at 57% (Mucci et al., 2016). Our understanding of genetic predisposition to PCa has been transformed by recent genome-wide association studies (GWAS), which have thus far discovered over one hundred independent single nucleotide polymorphisms (SNPs) associated with PCa risk (Al Olama et al., 2014; Whitington et al., 2016). However, the vast majority of GWAS SNPs reside within non-coding genomic regions often far from the nearest genes (MacArthur et al., 2017; Whitington et al., 2016), thus, the molecular mechanisms underlying the causal actions and biological effects of these SNPs remain poorly understood. To date, few if any causative SNPs can be used for predicting PCa outcome.
While indolent PCa patients may be easily treated, the patients with aggressive PCa often have worse prognosis and thus need intensive treatment. Recent GWASs have identified several aggressive PCa susceptibility loci including rs11672691 at 19q13 (Amin Al Olama et al., 2013), rs35148638 at 5q14.3 and rs78943174 at 3q26.31 (Berndt et al., 2015) with potential in management for the aggressive form of the disease, though the molecular mechanisms and biological effects underlying these associations need to be investigated. A recent meta-analysis of GWAS (Amin Al Olama et al., 2013) reported that rs11672691 within intron 2 of long non-coding RNA (IncRNA) PCAT19 (prostate cancer associated transcript 19) was not only associated with PCa predisposition but also with PCa aggressiveness. Intriguingly, the association of rs11672691 with aggressive PCa was also observed in another large cohort study (Shui et al., 2014), demonstrating that rs11672691 was associated with increased risk of PCa-specific mortality through a median follow-up of 8.3 years of 10,487 men with PCa.
In the current study, we also observed a robust association of rs11672691 with clinical features indicative of aggressive disease including high tumor stage, PSA progression and the development of castration resistant prostate cancer (CRPC) in a cohort of 2738 men with PCa, and sought to define the underlying mechanisms by which the SNP rs11672691 at 19q13 impacts PCa severity. We reported a novel association of rs11672691 genotype and the expression of two previously unknown PCa genes, PCAT19 and CEACAM21. We also demonstrated the mechanisms by which the aggressive PCa risk-associated allele G of rs11672691 influenced the transcription of PCAT19 and CEACAM21 via enhancing chromatin binding affinity of HOXA2, a novel oncogenic transcriptional regulator with prognosis potential in PCa. Moreover, we provided direct evidence showing that rs11672691 was involved in the regulation of PCAT19 and CEACAM21 expression and impacted PCa tumor cellular property. Finally, we observed synergistic effects among rs11672691 genotype, PCAT19 and CEACAM21 expression on the prediction of PCa relapse and survival, highlighting clinical potential of this SNP as a risk stratification marker for the management of PCa patients.
RESULTS
Association of rs11672691 with clinical features of aggressive PCa
SNP rs11672691 resides in the intergenic region at 19q13 between the genes ATP5SL and CEACAM21 and within PCAT19, an IncRNA gene (Amin Al Olama et al., 2013). To further strengthen the finding of rs11672691 in association with aggressive PCa susceptibility, we conducted an analysis of 2738 Finnish PCa cases (Table S1). This analysis revealed that the rs11672691 GG genotype was associated with an increased risk of developing advanced T stage (OR, 1.23, 95% CI, 1.02-1.48, p=0.03), the measure of local extent of a prostate tumor, and therefore a poorer prognosis (Table 1). This association predicts whether the PCa has higher chance to grow outside the prostate (T3a), to grow into the seminal vesicles (T3b) or into tissues next to prostate, such as urethral sphincter, rectum, bladder, and/or the wall of the pelvis (T4). Noteworthy, only a few prior genetic studies were able to assess association of germline genetic variants with tumor stage (Henriquez-Hernandez et al., 2014). We therefore identified, for the first time, rs11672691 as marker for PCa tumor stage progression.
Table 1.
Association of rs11672691 variant with aggressive PCa compared to nonaggressive PCa as defined by selected clinical variables, See also Table S1
| Core clinical variables of aggressive PCa | rs11672691 genotypea |
OR (95% CI) | P |
|---|---|---|---|
| PSAb > 100 | GG | 1.32 (0.92-1.88) | 0.13 |
| GG+GA | 1.86 (0.81-4.27) | 0.15 | |
| Gleason score ≥ 8 | GG | 1.08 (0.86-1.34) | 0.51 |
| GG+GA | 1.35 (0.86-2.11) | 0.19 | |
| Tumor stage T3/T4 | GG | 1.23 (1.02-1.48) | 0.03 |
| GG+GA | 1.22 (0.85-1.76) | 0.28 | |
| Lymph node, yes | GG | 0.72 (0.25-2.09) | 0.55 |
| GG+GA | 1.17 (0.15-8.97) | 0.88 | |
| Metastasis, yes | GG | 1.14 (0.65-1.99) | 0.66 |
| GG+GA | 1.08 (0.81-1.46) | 0.60 | |
| Fatal PCa, yesc | GG | 1.26 (0.99-1.60) | 0.065 |
| GG+GA | 1.39 (0.85-2.29) | 0.193 | |
| Additional clinical features of aggressive PCa | |||
| PSA progression, yes | GG | 1.31 (1.11-1.54) | 0.001 |
| GG+GA | 1.62 (1.13-2.32) | 0.008 | |
| CRPCd, yes | GG | 1.22 (0.95-1.56) | 0.120 |
| GG+GA | 1.75 (1.00- 3.05) | 0.048 | |
, AA genotype represented the reference group in the analyses
, Diagnostic PSA level, ng/mL
, Prostate cancer specific mortality (PCSM)
, CRPC, Castration Resistant Prostate Cancer
P<0.05 considered to be significant, bold
We next investigated the association of rs11672691 variant with additional clinical features of PCa prognosis, namely PSA progression and the development of CRPC. We observed the association of both GG genotype (OR 1.31, 95% CI, 1.11-1.54, p=0.001) and the G carriers (OR 1.62, 95% CI, 1.13-2.32, p=0.008) of rs11672691 with PSA progression during the course of the disease, predicting worse prognosis (Table 1). This is in line with the observation that carriers of rs11672691 allele G have 1.75-fold odds of CRPC (95% CI, 1.00-3.05, p=0.048), progression of PCa to an incurable stage after androgen depletion therapy. Collectively, data from Finnish cohort provide further evidence that the allele G of rs11672691 is associated with several clinical features indicative of aggressive PCa risk.
Association of rs11672691 allele G with elevated expression of two plausible PCa genes PCAT19 and CEACAM21
We next sought to find whether rs11672691 was associated with the expression of nearby genes, and thus performed an expression quantitative trait locus (eQTL) analysis using data from three independent cohorts (Swedish, TCGA and Wisconsin cohort) with nearly 1,000 prostate tissue samples. This analysis revealed a strong association of the aggressive PCa risk allele G at rs11672691 with higher mRNA levels of CEACAM21 (Figures 1A-C). Interestingly, our analysis revealed an additional eQTL gene PCAT19 for rs11672691 (Figure 1D). Consistent with this, gene level allele-specific expression (ASE) analysis in 471 benign primary prostate tissue samples (Larson et al., 2015) revealed a significant association of rs11672691 allele G with PCAT19 upregulation (p=8.61 × 10⁻¹⁵).
Figure 1. Candidate gene identification by eQTL analysis at the 19q13 aggressive PCa risk locus.

(A-D) The aggressive PCa risk allele G at rs11672691 associates with increased expression of CEACAM21 (A-C) and PCAT19 (D) in prostate tissues. Linear model P values assessed by Matrix eQTL. (E-F) PCAT19 or CEACAM21 promotes PCa cell proliferation measured by XTT colorimetric assays (mean ± SD of triplicate experiments), and aggressiveness by migration and invasion assays (mean ± SEM of triplicate experiments) in 22Rv1 cells infected with control or gene-specific shRNAs. (G) Ectopic CEACAM21 expression promotes 22Rv1 cell proliferation (mean ± SD of triplicate experiments). (H) CEACAM21 overexpression enhances RWPE1 cell migration and invasion (mean ± SEM of triplicate experiments). In E-H, *P < 0.05, **P < 0.01, ***P < 0.001, Student’s t test. (I) GSEA plot testing the enrichment of differentially expressed genes between CEACAM21 overexpressing versus control RWPE1 cells. (J) PCAT19 or (K,L) CEACAM21 transcript levels upregulated in human primary or metastasis PCa. P values by Mann-Whitney U-tests. (M) Higher levels of CEACAM21 correlate with increased risk of biochemical recurrence in a cohort of PCa patients. P value assessed by a log-rank test. See also Figures S1-S3 and Table S2.
PCAT19 codes an IncRNA and harbors rs11672691 in its second intron. Given that many IncRNAs play an important role in cancer initiation and progression (Gao and Wei, 2017; Kopp and Mendell, 2018), we hypothesized that PCAT19 and CEACAM21 may possess unknown function in PCa. To test this, we performed knockdown assays using lentivirus-mediated short hairpin (shRNA) against CEACAM21 or PCAT19 in multiple PCa cell models. The results showed that knockdown of PCAT19 or CEACAM21 markedly attenuated cell proliferation, migration and invasion in PCa cell lines 22Rv1, Du145 and LNCaP (Figures 1E,F and S1). Given the consistent observations of rs11672691 G risk allele associated with elevated CEACAM21 expression (Figures 1A-C), we further pursued cellular approaches to demonstrate the effects of CEACAM21 upregulation. Accordingly, plasmid- or lentivirus vector-based ectopic expression of CEACAM21 increased cellular proliferation (Figures 1G and S2A-D). Consistent with this, CEACAM21 overexpression significantly stimulated the growth of immortalized prostatic epithelial RWPE1 cells in 3D cultures (Figure S2E). We further observed higher migration and invasion capacity in the tested CEACAM21-overexpressing prostate cell lines (Figures 1H and S2F-H). To explore the mechanistic role of CEACAM21 in PCa, we performed RNA-seq analysis of CEACAM21-overexpressing RWPE1 cells (Figure S3A). We observed high correlation between three biological replicates and found that 924 genes were upregulated, while 915 genes were downregulated by ectopic CEACAM21 expression (DESeq2, FDR<0.01; Figures S3B,C). Gene set enrichment analysis on 50 “hallmark” gene sets (Subramanian et al., 2005) revealed the strongest enrichment of genes upregulated in CEACAM21 overexpression for MYC target profiles and mTORC1 signaling pathway (Figures 1I and S3D; Table S2). Given previous studies of MYC or mTORC1 signaling involvement in cancer (Dang, 2012; Saxton and Sabatini, 2017), our observations may implicate the role of CEACAM21 in MYC and mTORC1 activation, thereby promoting cell growth, invasion and metastasis in PCa.
We next explored whether higher RNA levels of PCAT19 or CEACAM21 correlated with human PCa progression in the clinical setting, and thus analyzed five independent PCa expression profile data sets (Arredouani et al., 2009; Cerami et al., 2012 Chandran et al., 2007; Ren et al., 2012; Tomlins et al., 2007). The results indicated that PCAT19 and CEACAM21 were highly expressed in prostate tumor tissues compared to normal prostate gland (Figures 1J,K and S3E). We observed that the mRNA levels of CEACAM21 were significantly increased in metastatic PCa samples (Figures 1L and S3F), suggesting a potential role of CEACAM21 in advanced prostate tumors. Thus, we investigated the association of CEACAM21 expression with postoperative PSA recurrence by using a Kaplan-Meier analysis. The patient group with higher expression levels of CEACAM21 had an increased risk of biochemical relapse (Figure 1M). Collectively, these data illustrate a significant association of the risk allele G at rs11672691 with higher expression levels of two previously unknown PCa genes PCAT19 and CEACAM21, and their upregulation correlates with the development of PCa, suggesting that PCAT19 and CEACAM21 are plausible causative genes mediating the effect of rs11672691 on PCa severity.
rs11672691 resides in the binding site of a transcriptional complex including HOXA2
We next asked how the rs11672691 G risk allele involves in regulating the expression of PCAT19 and CEACAM21. To thoroughly understand the regulatory mechanisms underlying rs11672691, we first performed genome-wide analysis of epigenome and transcription factor ChIP-seq data derived from PCa cells or tumor tissues (Kron et al., 2017; Mei et al., 2017; Whitington et al., 2016). We observed an enrichment of epigenetic marks (H3K4me1/2 and H3K27ac) for active enhancer and multiple transcription factors including AR, HOXB13 and ERG at rs11672691 region based on ChIP-seq profiles (Figure 2A), suggesting that this is an enhancer element. In contrast, we found no enrichment of silent epigenetic mark H3K27me3 and inactive chromatin regulator EZH2 (Figure 2A). We proved this result by performing enhancer reporter assays (Figure 2B) and the modified STARR-seq method (Liu et al., 2017) (Figure S4A). We next conducted imputation for SNPs in a tight linkage disequilibrium (r2 >0.8) with lead SNP rs11672691 from the 1000 Genome Project to determine if there exists additional regulatory variants in this haplotype (Ward et al., 2012). We thus found that only rs887391 (r2 = 0.87 with rs11672691; 36bp downstream of rs11672691) located at active gene regulatory element, the same enhancer region with rs11672691 (Table S3). Notably, rs887391 was previously reported to be associated with PCa risk but not at the level of GWAS significance (Hsu et al., 2009). In addition, no association was found for rs887391 with aggressiveness and other clinical characteristics of PCa. Together, these analyses suggest that rs11672691 is a likely causal regulatory SNP at this aggressive PCa susceptibility locus.
Figure 2. The risk allele G of rs11672691 enhances HOXA2 chromatin binding.

(A) ChIP-seq tracks showing the enrichment of active enhancer marks, silent epigenetic signature, and transcription factors at the rs11672691 region. (B) Reporter assays showing enhancer activity of the pGL3 promoter vector inserted with the rs11672691-containing or control DNA fragments. (C) rs11672691 and rs887391 reside within HOXA2 DNA-binding motifs. (D) Binding affinity of HOX A family members, HOXB13, AR, FOXA1, and ERG to the rs11672691 surrounding sequence competed with the counterparts harboring G or A allele. (E) ChIP-qPCR confirmation of transcription factor binding at rs11672691 region. (F) ChIP-qPCR results showing HOXA2 binding at rs11672691 in LNCaP cells. (G) ChIP-AS-qPCR indicating allele-specific binding of HOXA2 at rs11672691 in 22Rv1 cells. (H) HOXA2 prefers the binding to G allele than A allele at rs1672691 confirmed by ChIP Sanger sequencing. (I) Western blot result of V5 tagged HOXA2 expression in 22Rv1. (J) ChIP-AS-qPCR for HOXA2 enrichment at the rs11672691 region in HOXA2 overexpressing and control cells. Error bars, SD (B, D-G, J), n = 3 technical replicates. *P < 0.05, **P < 0.01, ***P < 0.001, Student’s t tests. See also Figure S4, Tables S3-S6
Given that regulatory SNPs with causal roles in disease susceptibility are often leading to transcription factor DNA binding variation (Deplancke et al., 2016), we next examined whether rs11672691 directly alters the DNA-binding motif of any transcription factor. We thus performed computational analysis using the Enhancer Element Locator (EEL) algorithm (Hallikas et al., 2006) and the DNA-binding position weight matrix data of human transcription factors (Jolma et al., 2013). This analysis revealed that rs11672691 maps within the binding motifs of homeodomain transcription factors including NKX3.1 and HOXA2 with the strongest match for the rs11672691-centered 13-bp genomic sequence (Figure 2C and Table S4). Interestingly, rs887391 also maps within HOXA2 DNA-binding motif (Figure 2C). Remarkably, the EEL prediction showed obviously increased DNA-binding affinity for aggressive PCa susceptibility G allele compared to the reference A allele at rs11672691 (Figures 2C and S4B). In contrast, rs887391 shows no obvious difference in its DNA binding affinity to HOXA2 (Figures 2C and S4C). We therefore focused the HOXA2-DNA binding variation altered by rs11672691. To assess whether the ChIP-seq-defined transcription factors at rs11672691 (Figure 2A) and other HOXA family members, can bind to this area, we performed microwell-based transcription factor-DNA binding assay in vitro and ChIP followed by qPCR (ChIP-qPCR) in vivo (Huang et al., 2014). The microwell-based analysis showed that HOXA2 indicated the strongest binding to the DNA sequence harboring rs11672691 compare to other tested transcription factors (Figure 2D). Moreover, HOXA2 showed the binding preference to allele G over allele A of rs11672691 (Figures S4D,E). The ChIP-qPCR results also showed the enrichment of HOXA2, ERG, HOXB13, AR, and HOXA10 at the rs11672691-containing region in multiple PCa cell lines including LNCaP, 22Rv1 and VCaP (Figures 2E-G and S4F-H), though some transcription factors such as HOXA10, ERG, and AR indicated no binding activity to the rs11672691-containing sequence in vitro (Figure 2D). We also performed ChIP-qPCR assays with available antibodies for HOXA9 and HOXA13, as well as HOXA10 in VCaP cells and found no enrichment (Figures S4I,J). Taking these studies together, we observed the strongest in vitro binding of HOXA2 at the sequence harboring rs11672691 (Figure 2D), and reproducible chromatin occupancy of HOXA2 at rs11672691 enhancer in all the tested PCa cell models (Figures 2E-G). These results suggested that HOXA2 is likely to be a driver transcription factor transforming the biological effects of rs11672691 on aggressive behavior of PCa.
To evaluate the binding preference of HOXA2 to rs11672691 in vivo, we performed ChIP followed by allele-specific qPCR (AS-qPCR) analysis or Sanger sequencing in the PCa cells 22Rv1 that is heterozygous for this SNP (Huang et al., 2014). These analyses showed that HOXA2 was preferentially recruited to the risk G allele at rs11672691 (Figures 2G,H), consistent with our bioinformatics results (Figures 2C) and the observation of a stronger binding affinity for HOXA2 at G allele than A allele of rs11672691 in vitro (Figures S4B,D,E). To verify this finding independently, we performed ectopic expression of V5 tagged HOXA2 in 22Rv1 cells followed by ChIP-qPCR using anti-V5 tag antibody (Figure 2I). Consistently, the results showed a strong occupancy of HOXA2 at the DNA fragment harboring rs11672691 and binding preference to the G allele (Figures 2J and S4K). Together, these data indicate that HOXA2 directly binds at the rs11672691 enhancer with preference to the aggressive PCa risk-associated G allele at rs11672691.
HOXA2 as an oncogene with prognostic potential in PCa
The established roles and the interactions among ERG, HOXB13 and AR in PCa have been previously reported (Kron et al., 2017; Pomerantz et al., 2015; Wei et al., 2010), yet the function of HOXA2 in PCa is completely uncharacterized. We first found that HOXA2 was an androgen-responsive gene (Figure S5A). To examine whether HOXA2 implicates PCa, we performed short hairpin RNA (shRNA)-mediated knockdown of HOXA2 in the 22Rv1 cells. Cells with shRNA against HOXA2 showed greatly reduced cell growth compared to cells transduced with control shRNA in a proliferation assay (Figure 3A). This is in line with the data of genome-wide CRISPR/Cas9-based loss-of-function screen in the PCa cell line LNCaP for the identification of genes that are essential for cell viability (Aguirre et al., 2016), where HOXA2 showed importance for the survival of LNCaP (Figure 3B). Next, we performed cell migration and invasion assays using the Boyden chamber with or without Matrigel. 22Rv1 cells with knockdown of HOXA2 showed decreased cell migration and invasion (Figures 3C and S5B-D). To investigate the biological roles of HOXA2 in PCa progression, we performed clinical correlation and prognosis analyses. The results showed that the mRNA levels of HOXA2 were greatly upregulated in primary and metastatic PCa tumors compared to normal prostate gland (Grasso et al., 2012; Liu et al., 2006) (Figures 3D,E). In addition, the patient group with higher mRNA levels of HOXA2 has increased risk for postoperative biochemical recurrence and shorter time for overall survival (Cancer Genome Atlas Research Network, 2015; Cerami et al., 2012) (Figures 3F,G and S5E). We next examined whether HOXA2 levels possess predictive values for low- and high-risk PCa, and hence subdivided a large PCa cohort by Gleason score and compared the frequency of biochemical relapse. This analysis revealed a clear predictive value of HOXA2 mRNA levels for biochemical relapse in the patients with a Gleason score of 7 (intermediate risk; Figures 3H and S5F), but not for the patient groups with Gleason <6 (low risk; Figure S5G) or Gleason score >8 disease (high risk; Figure S5H). The results indicate that HOXA2 is a potential prognosis marker to distinguish PCa patients that may recur in the group with intermediate risk PCa. These observations, together with tumor cell biology experiments, illustrate that HOXA2 is a newly-identified PCa relevant gene with potential prognosis values in PCa risk prediction, further supporting HOXA2 as an effective transcription factor transforming the regulatory effects of rs11672691 for aggressive PCa susceptibility.
Figure 3. Effect of HOXA2 on PCa cell growth, metastasis and patient prognosis.

(A) Depletion of HOXA2 reduces PCa cell proliferation, mean ± SD of triplicate experiments. (B) Genome-wide loss-of-function screening of the essential genes for cell survival. Lower ATARiS scores demonstrate elevated dependency of cell viability on given genes. AR, HOXB13, MYC and BRD4 are known to be important for PCa cell growth and survival, and TP53 vice versa. (C) The number of 22Rv1 cells infected with control or HOXA2 shRNAs in invasion assay. Mean ± SEM of triplicate experiments. In A and C, *P < 0.05, **P < 0.01, ***P < 0.001, Student’s t test. (D and E) Elevation of HOXA2 mRNA levels in human primary or metastasis PCa. P values examined by Mann-Whitney U-tests. (F and G) Higher levels of HOXA2 correlate with increased risk of biochemical recurrence (F) and reduced time for overall survival (G) in PCa patient cohorts. (H) Higher levels of HOXA2 shows predictive values for biochemical recurrence in patient group with Gleason Score 7 (intermediate risk). P values determined by a log-rank test (F-H), and Cox regression analysis (F and H). See also Figure S5.
HOXA2 as regulator of rs11672691 eQTL genes
Our established ChIP-qPCR results demonstrated the enrichment of HOXA2, ERG, HOXB13 and HOXA10 at the rs11672691 enhancer region (Figures 2E-J and S4F-H). Thus, we sought to investigate whether HOXA2, ERG, HOXB13 or HOXA10 affect the expression levels of rs11672691-associated genes PCAT19 and CEACAM21 via RNA interference-mediated knockdown assays in PCa cells. The results showed that the transcript levels of PCAT19 or CEACAM21 were significantly downregulated upon knockdown of HOXA2, ERG or HOXB13, respectively (Figures 4A and S6A,B), suggesting that PCAT19 or CEACAM21 expression are regulated by HOXA2. In contrast, knockdown of HOXA10 showed no effect on PCAT19 or CEACAM21 expression (Figure S6C). Similar to HOXA2 (Figure S5A), we observed that androgen treatment induced the expression of PCAT19 and CEACAM21 in VCaP cells (Figures S6D,E). Interestingly, we found a positive correlation between the expression of CEACAM21 or PCAT19 and HOXA2 in two large cohorts of clinical prostate tissue samples (Taylor et al., 2010) (Figures 4B,C), suggesting that HOXA2 may also regulate the expression of PCAT19 or CEACAM21 in the clinical setting. These findings together with ChIP-seq and microwell-based binding results indicate that PCAT19 and CEACAM21 are the direct targets of HOXA2, and the variation at rs11672691 may contribute to this regulatory process.
Figure 4. Direct effect of rs11672691 on PCAT19 and CEACAM21 expression.

(A) Depletion of HOXA2 diminishes the mRNA levels of PCAT19 and CEACAM21. (B and C) Scatter plots showing an expression correlation between HOXA2 and CEACAM21 or PCAT19 in prostate tissues. (D) PCAT19 knockdown results in decreased expression of CEACAM21. (E) Scatter plot displaying a correlation between PCAT19 and CEACAM21 expression in human prostate. (F) Reporter assay showing contribution of the G compared with the A allele at rs11672691 to an increased enhancer (E) activity for CEACAM21 promoter (P). Error bars, SD from five technical replicates. (G) 3C analysis of chromatin interactions between CEACAM21 and rs11672691 locus within nearly 100 kb region (chr19:41982282–42079092). (H) Sanger sequencing of CRISPR/Cas9-modified and parental 22Rv1 cells. (I) Analysis of PCAT19 and CEACAM21 expression in mutated and parental 22Rv1 cells. (J) Chromatin enrichment of HOXA2 at the rs11672691 site measured by ChIP-qPCR. (K) 3C measurement of chromatin interactions between CEACAM21 promoter and rs11672691 locus in the CRISPR/Cas9 modified and parental 22Rv1 cells. NS, non-significant. In A,D,G,I,J, and K, data shown are mean ± SD of triplicate experiments, **P < 0.01, ***P < 0.001, ****P < 0.0001, Student’s t test. See also Figure S6 and Table S7.
Given that rs11672691 resides within intronic region of PCAT19, we may expect that the alteration of HOXA2 binding thus affect PCAT19 expression. However, CEACAM21 is over 100kb away from rs11672691. The regulatory mechanism of the gene is unclear. Several IncRNAs have been reported to possess enhancer-like function in regulating the expression of their neighboring protein-coding genes in human cells (Orom et al., 2010). We therefore assessed whether the transcripts from PCAT19 contribute to the regulation of CEACAM21 expression using siRNA and shRNA assays. We found that PCAT19 knockdown led to reduced mRNA levels of CEACAM21 (Figures 4D and S6F). Interestingly, we also observed that the expression of PCAT19 and CEACAM21 are positively correlated in a cohort of 462 benign prostate tissues samples (Figure 4E), indicating co-expression of PCAT19 and CEACAM21 in association with PCa and a likely regulatory mechanism in the clinical setting.
Having demonstrated that rs11672691 resides within an enhancer region of PCAT19 intron 2, and PCAT19 possesses an enhancer-like function to regulate CEACAM21 expression, we proceeded to test whether the variation at rs11672691 could directly alter CEACAM21 promoter activity. We thus inserted the rs11672691-containing region into the upstream of CEACAM21 promoter in an enhancer report assay. The results showed that the rs11672691-containing region with G allele has a higher enhancer activity than that with A allele to the CEACAM21 promoter (Figure 4F). To examine whether there was direct chromatin interaction between rs11672691 enhancer and CEACAM21 promoter region, we first performed quantitative chromosome conformation capture assays (3C-qPCR) (Hagege et al., 2007) with the restriction enzyme EcoR I. We used CEACAM21 promoter region as constant fragment, and assessed its interaction with EcoR I digested chromatin fragments in this 100kb region covering rs11672691 locus in PCa cells VCaP and 22Rv1, and the breast cancer cell line MCF7. The results showed that the SNP rs11672691-containing enhancer has higher crosslinking frequencies in VCaP and 22Rv1 cells compared with MCF7 (Figure 4G), suggesting a PCa cell-type-specific long-range chromatin interaction between PCAT19 and CEACAM21. Moreover, androgen stimulation had clear impact on the observed interaction between rs11672691 enhancer and CEACAM21 (Figure 4G). Consistent with our 3C analysis, rs11672691 enhancer was found to form a strong chromatin interaction with CEACAM21 in rs11672691-centered 1Mb window in LNCaP Hi-C data (Wang et al., 2017) (Figure S6G). Given that PCAT19 knockdown led to decreased expression of CEACAM21, we assessed the role of PCAT19 transcript in this chromatin interaction, and performed 3C assays in PCAT19 knockdown 22Rv1 cells. We observed no apparent changes in locus-wide crosslinking frequencies (Figure S6H), suggesting that PCAT19 transcript may play only a subtle or no role in this loop formation. Collectively, these results suggest that the G allele at rs11672691 within PCAT19 transcriptionally regulates the expression of CEACAM21, and rs11672691 may directly contribute to HOXA2-mediated regulation of PCAT19 and CEACAM21 expression.
Direct effect of rs11672691 on its eQTL gene expression and PCa cell proliferation
To further investigate whether rs11672691 directly involves in the regulation of PCAT19 and CEACAM21 expression, we applied CRISPR/Cas9-mediated genome editing approach (Ran et al., 2013), and successfully converted the genotype of rs11672691 from G/A to G/G or A/A in PCa cell line 22Rv1 (Figure 4H). The mutated cells with rs11672691 G/G had higher transcriptional levels of PCAT19 and CEACAM21 than the parental cells, while their expression levels were markedly lower in 22Rv1 cells with rs11672691 AA genotype than that in parental cells (Figure 4I). This effect of rs11672691 enhancer on PCAT19 was also validated in an independent study using CRISPR interference and CRISPR activation assays (Hua et al., 2018). Consistently, we observed higher levels of HOXA2 chromatin occupancy at rs11672691 region in the 22Rv1 cells with rs11672691 G/G genotype than that in parental cells, and the cells with AA genotype showed the lowest enrichment of HOXA2 at rs11672691 region (Figure 4J). We next performed 3C experiments in the three types of cells, and found that the G/G genotype 22Rv1 cells had higher crosslinking frequencies between rs11672691 enhancer and CEACAM21 than parental and A/A cells (Figure 4K).
In addition to the described molecular changes, we also observed the phenotypic difference between rs11672691 G/G, parental G/A and AA 22Rv1 cell lines under microscope. The G/G and parental 22Rv1 cells had the similar morphology, whereas A/A cells were quite different (Figure 5A), and the cell-cell contacts were very tight, indicating typical untransformed epithelial cell phenotype (Figure 5A). To determine whether there was any functional differences between the 22Rv1 cells with different genotypes for rs11672691, we analyzed their cellular proliferation and migration property. The results showed that homozygous G/G and parental G/A cells had higher proliferation rate compared to A/A clones (Fig 5B). Despite no difference observed between G/G and parental cells in the proliferation assays, we found an obvious promotion of wound closure in G/G and parental cells compared to the AA cells by performing wound-healing assays (Figures 5C,D). Collectively, these analyses provide direct lines of evidence that the risk G allele of rs11672691 contributes to enhanced expression of PCAT19 and CEACAM21, and PCa cell proliferation and severity.
Figure 5. Effect of rs11672691 genotype on PCa cell growth, aggressive behavior and patient prognosis.

(A) The phenotype of each 22Rv1 cell lines analyzed by microscopy under culture for two days. (B) Cell proliferation analysis of CRISPR/Cas9-modified and parental 22Rv1 cells, mean ± SD of triplicate experiments. (C) Representative images showing wound healing assay for migration ability of 22Rv1 cells with different genotypes of rs11672691. (D) Quantification of percentage fraction of original wound closure in triplicate plates. Migration was assessed every 10 h. Error bars, SD from three biological replicates. In B, D, *P < 0.05, **P < 0.01, ***P < 0.001, Student’s t test. (E and F) Association analyses show that the patient group with rs11672691 GG genotype correlates with increased risk for biochemical recurrence in two independent cohorts of PCa patients. (G and H) Survival analyses show that the patients carrying rs11672691 GG genotype are more likely to get metastasis disease earlier. In E-H, P values examined by a log-rank test.
Synergistic prognostic effects of rs11672691 eQTLs on PCa severity
Given that the risk allele at rs11672691 was associated with higher expression of CEACAM21 and PCAT19 and that their upregulation correlated with PCa progression, we explored whether rs11672691 genotype directly correlated with PSA recurrence and survival status of individuals with PCa. We found that the PCa patients carrying homozygous risk genotype GG at rs11672691 correlated with increased frequency of biochemical relapse in the analysis of a large PCa cohort (Figure 5E). We observed the correlation in a similar direction with PSA recurrence and metastasis-free survival in an independent collection of Finnish PCa patients (Figures 5F-H). These results are well consistent with previous large cohort studies (Amin Al Olama et al., 2013; Shui et al., 2014), showing that the variant G at rs11672691 confers increased risk for aggressive PCa susceptibility.
We next performed Kaplan-Meier analysis and examined the association of CEACAM21 and PCAT19 expression with clinical variables indicating tumor aggressiveness in PCa patients with different rs11672691 genotype. We found that higher mRNA levels of CEACAM21 were strongly correlated with increased risk of biochemical relapse in the patients carrying rs11672691 GG genotype (Figures 6A and S7A). In contrast, no similar association was found in the patients with rs11672691 GA or AA genotype (Figure 6B). Though PCAT19 expression data alone showed no association with biochemical relapse of PCa patients (Figure 6C), the patient group with GG genotype and higher expression levels of PCAT19 was strongly correlated with increased risk for PSA recurrence (Figures 6D and S7B). Together, these integrated analyses showed that the GG genotype at rs11672691 is associated with poor prognosis of PCa patients, and indicates synergistic effects with the expression data of CEACAM21 or PCAT19 to predict PCa clinical outcomes.
Figure 6. Synergistic effect of rs11672691 genotype and CEACAM21 or PCAT19 expression on PCa patient prognosis.

(A and B) CEACAM21 indicates strong predictive value in the patient group with rs11672691 GG genotype (A), but not in the group with rs11672691 AA or GA genotype (B). (C and D) PCAT19 shows no prognostic value in a cohort of PCa patients (C), but the PCa patient group carrying rs11672691 GG genotype with higher PCAT19 expression tumors indicates a significant association with increased risk of biochemical relapse (D). The P values were assessed by a log-rank test (A-D) and Cox regression analysis (A and D). See also Figure S7.
DISCUSSION
We present an integrated study of the mechanisms and the clinical implications underlying the 19q13 aggressive PCa risk locus. We identify an oncogenic regulatory circuit among several novel genes including HOXA2, CEACAM21 and PCAT19 underlying the association of rs11672691 with aggressive PCa and potentially driving disease progression to advanced stage.
Patients with aggressive PCa are typically treated by androgen deprivation therapy (Bishr and Saad, 2013). Although the ADT treatment is initially effective and can prolong the survival time of PCa patients, a high rate of patients will eventually relapse and begin to show signs of CRPC with high mortality rate (Bishr and Saad, 2013; Mills, 2014). Rs11672691 at 19q13 is associated with fatal PCa. Thus, characterizing the regulatory mechanisms of this association may provide more clues to aggressive PCa diagnosis and treatment. We reveal that rs11672691 is an enhancer variant and synergizes with HOXA2 to drive the expression of its eQTL genes PCAT19 and CEACAM21. The biological function of CEACAM21 in cancer is totally unknown. CEACAM21 is a transmembrane protein-coding gene and belongs to the carcinoembryonic antigen gene family with several members playing roles in cell adhesion, invasion and metastasis (Amin Al Olama et al., 2013; Blumenthal et al., 2007), which may give some clues on how CEACAM21 confers susceptibility to aggressive PCa. Interestingly, CEACAM21 has been found to be a novel schizophrenia susceptibility gene (Alkelai et al., 2012), emphasizing its association with additional types of disease.
As reviewed extensively elsewhere (Gao and Wei, 2017), recent studies reported the association of IncRNAs with PCa and other types of cancer susceptibility. Notably, in a recent work (Guo et al., 2016), the PCa risk variant of rs7463708 was found to disrupt the binding of ONECUT2 and increased the expression of PCAT1, a well-studied PCa-associated IncRNA (Gao and Wei, 2017). These findings defined the relationships between IncRNAs and SNPs within major part of human genome with non-protein-coding capacity. In current study, we find a new IncRNA PCAT19 as a plausible PCa susceptibility gene with high levels of expression in malignant tumors of the prostate. Furthermore, we provide evidence that this IncRNA could regulate the expression of a newly identified oncogene CEACAM21 but not a loop formation between rs11672691 enhancer and CEACAM21. Together with an independent study of the rs11672691 effect on PCAT19 expression (Hua et al., 2018), the data imply an alternative mechanism by which the rs11672691 enhancer may effect indirectly through PCAT19 on CEACAM21 expression. Moreover, unknown or known transcription factors such as HOXA2, HOXB13, AR and ERG, as well as NKX3.1 and YY1 (Hua et al., 2018) may facilitate loop formation at rs11672691 locus to regulate PCAT19 and CEACAM21 gene expression. Clinically, the expression levels of PCAT19 or CEACAM21 may synergize with rs11672691 genotypes to predict PCa severity.
One daunting challenge with mechanistic assessment of common, noncoding SNPs is having direct evidence to support the effect of each variant on gene expression and disease phenotype. Here we modified the existing CRISPR/Cas9 genome editing protocol (Ran et al., 2013) to change the genotype of rs11672691, and revealed a direct role of rs11672691 allele G in enhanced chromatin binding of HOXA2, elevated expression of CEACAM21 and PCAT19, and tumor cellular property. The other genome editing methods such as TALEN have also been successfully applied to change the genotype of the SNPs, e.g. rs339331 (Spisak et al., 2015), which was found to enhance chromatin binding of HOXB13 and elevate RFX6 expression driving PCa progression (Huang et al., 2014). In comparison with TALEN, CRISPR/Cas9 is much more efficient, accurate and easy to optimize for single nucleotide editing.
Our study may have clinical implications and translational value to benefit patients. We show that risk genotype of rs11672691 contributes to an elevated expression of CEACAM21 and PCAT19, We also show that increased expression of the two genes and HOXA2 are associated with poor prognosis and their knockdown reduces invasion and migration of PCa cells. Thus, the findings may allow better prognostic prediction and distinguishing a more lethal phenotype to identify high-risk group patients that need radical treatment regimens because of their poorer treatment outcomes. Clearly, CEACAM21 and PCAT19 are not only PCa susceptibility genes but also responsible for PCa aggressive phenotype. To date, there is no known therapeutic compound that directly targets these genes. Identification of such a compound will be important for more effective targeted therapies. Whether inhibition of the expression or function of these genes and their products affect tumor cell growth in clinical setting is an important topic for future studies.
In summary, we provide several lines of evidence together with clinical follow-up analysis to show biological roles of rs11672691 connecting with a regulatory circuit of HOXA2, PCAT19 and CEACAM21 for PCa cell growth and invasion, and their expression in association with disease progression. A major remaining question will be how this regulatory circuit directly or indirectly initiates PCa. Genetically engineered pre-clinical mouse models and patient-derived tumor grafts seem warranted to test this hypothesis.
CONSORTIA
The members of the PRACTICAL Consortium are Rosalind Eeles, Doug Easton, Zsofia Kote-Jarai, Ali Amin Al Olama, Sara Benlloch, Kenneth Muir, Graham G. Giles, Fredrik Wiklund, Henrik Gronberg, Christopher A. Haiman, Johanna Schleutker, Maren Weischer, Ruth C. Travis, David Neal, Paul Pharoah, Kay-Tee Khaw, Janet L. Stanford, William J. Blot, Stephen Thibodeau, Christiane Maier, Adam S. Kibel, Cezary Cybulski, Lisa Cannon-Albright, Hermann Brenner, Jong Park, Radka Kaneva, Jyotsna Batra, Manuel R. Teixeira, and Hardev Pandha.
STAR METHODS
CONTACT FOR REAGENT AND RESOURCES SHARING
Further information and requests for resources and reagents should be directed to and will be fulfilled by the Lead Contact, Dr. Gong-Hong Wei (gonghong.wei@oulu.fi).
EXPERIMENTAL MODEL AND SUBJECT DETAILS
Cell Lines
22Rv1, LNCaP, VCaP, RWPE1, COS-1, and 293T cell lines were originally purchased from ATCC, and DuCaP was a gift from Olli Janne’s lab at University of Helsinki. All cell lines were confirmed to be mycoplasma free during our study. All the cells were cultured at 37 °C, with 95 % air and 5 % CO2. VCaP, COS-1, 293T and DuCaP was grown in DMEM (Invitrogen), LNCaP and 22Rv1 in RPMI1640 (Merck), and MCF7 in EMEM (ATCC). RWPE1 cells were grown in Keratinocyte-Serum Free Medium. Keratinocyte-SFM Kit including epidermal growth factor (EGF), and Bovine Pituitary extract (BPE) supplements was purchased from Invitrogen (17005-042, Invitrogen). 10 % FBS and 1% of Penicillin/Streptomycin were supplied to the base medium. MCF7 cell line is female, and others are male. In order to study AR activity we cultured the VCaP, LNCaP and 22Rv1 cells in charcoal stripping media up to at least 48 hours. AR activity was induced by treating cells with 100 nM dihydrotestosterone (DHT). For ectopic expression, we inserted HOXA2 or CEACAM21 into pcDNA3.1 V5-HisA vector (Invitrogen), and the CEACAM21-V5 was amplified from pcDNA3.1 V5-HisA vector and subcloned into pLVET-IRES-GFP vector (Zhang et al., 2017) between the restriction sites PmeI and EcoRI.
Study subjects
Prostate cancer cases and controls genotyped in this study were nested population- and hospital-based samples of Finnish origin. Written informed consent was obtained from each study subject. The study involved only males. The study protocol was approved by the research ethics committee at Pirkanmaa Hospital District (Tampere, Finland) and by the National Supervisory Authority for Welfare and Health (VALVIRA). For rs11672691 variant, 2738 unselected non-familial eligible prostate cancer cases were analyzed. Control subjects (n=2427) were derived from the control group of the Finnish arm of The European Randomized Study of Screening for Prostate Cancer (ERSPC) (Schroder et al., 2009). Control subjects were population-matched healthy individuals who had undergone PSA screening. Their disease status is annually evaluated from the records of the Finnish Cancer Registry. Clinical information on study participants, including PSA at diagnosis, Gleason score, stage of disease (TNM), prostate cancer specific mortality, PSA progression and presence of castration resistance prostate cancer (CRPC), was obtained through in-person interviews or medical or death records. Subjects to experimental groups of aggressive and non-aggressive prostate cancer were allocated based on their clinical data. Aggressive disease was defined as PSA >100 ng/mL, or Gleason score >8, or tumor stage T3/T4, or tumor in nodes (N1), or metastasis present (M1), or prostate cancer-associated death (Table 1). The study was conducted according to the guidelines and regulations of the Helsinki Declaration (1975).
METHOD DETAILS
SNP genotyping
Genotyping of germline blood DNA for rs11672691 was carried out by the Prostate Cancer Association Group to Investigate Cancer Associated Alterations in the Genome (PRACTICAL) Consortium using custom Illumina iSelect SNP genotyping array platform, which was designed as part of the Collaborative Oncological Gene-Environment Study (COGS), according to the manufacturer’s instructions. Individuals were excluded from the study based on strict quality control criteria, including overall genotype call rate <95%, low or high heterozygosity, genotypically non-European origin, samples that were XX or XXY and therefore not genotypically males (XY), samples not concordant with previous genotyping within PRACTICAL, genotypes for the duplicate sample that appeared to be from a different individual, and cryptic duplicates where the phenotypic data indicated that the individuals were different.
Genotyping of rs11672691 in prostate cancer cell lines
The rs11672691 centered fragment 235 bp was amplified by primers (F: CCAGCGATTAAGGGTCTCGT1, R: TCCCATAAAATGGCCACGCTC). The 2 x Phusion Master Mix with HF Buffer (F531, Thermo) were applied for PCR reactions. PCR products were cleaned with Exonuclease I and FastAP (# EF0651, Thermo) to remove unincorporated primers and degrade unincorporated nucleotides. Then the cleaned products with forward primer in a total volume of 6 ul were sent for Sanger Sequencing. The sequencing reactions were carried out using BigDyeTerminator v1.1 cycle sequencing kit (Applied Biosystems) and ethanol precipitation purification. The samples were run on Applied Biosystems 3500xL Genetic Analyzer.
eQTL analysis
We tested for eQTL associations between genotypes of rs11672691 and gene expression levels of CEACAM21 and PCAT19 using data from TCGA (Cancer Genome Atlas Research Network, 2015; Cerami et al., 2012), Swedish and Wisconsin cohorts, which comprised of 389, 94, and 462 prostate samples, respectively. Association between genotype and gene expression was analyzed using the Matrix Expression Quantitative Trait Loci (Matrix eQTL) R package, parameters “useModel = modelLINEAR”, “errorCovariance = numeric ()” were used. We applied the principal-component analysis covariates for the TCGA cohort. R was used to perform the statistical tests and plot figures for the association between SNP genotypes and gene expression levels. The transcriptional profilings were assessed by Illumina Expression BeadChip in Swedish human prostate tissue samples, while RNA-seq in TCGA samples. The Stockholm and TCGA cohorts were genotyped on Illumina Omni 2.5 and Affymetrix SNP array 6, respectively.
Quantitative RT-PCR
RNA was isolated from cultured cell lines using RNeasy Mini Kit (QIAGEN) or PureLink® RNA Mini Kit (Invitrogen), while DNA in these samples were removed by RNase-Free DNase (QIAGEN). The High-Capacity cDNA Reverse Transcription Kit (Applied Biosystems) was used to synthesize cDNA from 2 ug RNA. The SYBR Select Master Mix (Applied Biosystems) was used in the Quantitative RT-PCR reactions. High specificity primers were selected from at least three pairs of primers for each target. Primer sequences used in this experiment can be found in Table S5.
For the analysis of mRNA levels, each gene was analyzed at least in triplicate and the data was normalized against an endogenous ACTB (β-actin) control. For ChIP-qPCR, all target primers had three technical replicates and the data were normalized to the control regions, then the relative enrichment of the target antibodies at target DNA fragment were determined by compared with the background (IgG control).
Microwell-based transcription factor-DNA binding assay
This experiment was performed according to the previous protocol (Wei et al., 2010). In detail, full-length protein coding region or DNA-binding domain of human genes were amplified from human cDNA library (Stratagene) and cloned into pGEN-MCS-Renilla vector, and expressed in COS-1 cells by Lipofectamine 2000-mediated transfection (Thermo). Lysis buffer (600 mM NaCl and 1 % (wt/vol) Triton X-100 in PBS) was used to extract protein lysates from the cells. Subsequently, the mixture containing double-stranded biotinylated consensus oligo (8.3 µl of 1 εM oligo), Poly(dI-dC)•Poly(dI-dC) (5 µl of 1 εg/εl stock) and competitor, consensus or scrambled oligo (25 εl of 10 εM oligo)) was prepared and incubated at room temperature for 1 h. Then the diluted cell lysate was added into the mixture and incubated at room temperature for 2h. Binding reaction of scramble oligo without biotinylated consensus oligo was set up as background control. The oligo-cell-lysate reaction mix was eventually added into the StrepMax streptavidin-coated 96-well plates (Thermo Scientific) and incubated another 2 h at room temperature. After washing step with high-stringency binding buffer (5 mM NaCl and 20 mM HEPES, pH 7.05), the luciferase activity was determined using Renilla luciferase assay system (Promega) by a Multilabel Reader VICTOR3 V (PerkinElmer Inc.). The relative affinity of the competitor oligo in relation to the consensus oligo was calculated with the following equation:
Kd sample/Kd consensus = {[(Lsample/Lconsensus)-1]/[(Lscrambled/Lconsensus)-(Lsample/Lconsensus)]} × (Lscrambled/Lconsensus) +1 The positional weight matrix scores were calculated by dividing the inverse of the values by the sum of the inverses of the corresponding position. The oligos used for the binding assay are listed in Table S6.
Chromatin immunoprecipitation (ChIP)
The cells were cross-linked in final concentration of 1 % formaldehyde for 10 min at room temperature. The final concentration of 125 mM glycine was added to stop the reaction. Cell pellets were collected and snap frozen in liquid nitrogen for next step experiments (the cell pellets can also be stored at −80 °C). Cell pellets were suspended in hypotonic lysis buffer (20 mM Tris-Cl, pH 8.0, with 10 mM KCl, 10 % glycerol, 2 mM DTT, and cOmplete protease inhibitor cocktail (Roche)) and incubated up to 50 min to isolate nuclei. The nuclei were washed twice with cold PBS and suspended in SDS lysis buffer (50 mM Tris-HCl, pH 8.1, with 0.5 % SDS, 10 mM EDTA, and cOmplete Protease Inhibitor). An average size of 400bp of chromatin was prepared by sonication (Q800R sonicator, Q Sonica). 70 µl of Dynabead protein G (Invitrogen) slurry per each reaction was washed twice with blocking buffer (0.5 % BSA in IP buffer), followed by 10 h incubation with 7 µg of indicated antibodies against the target proteins or control IgG in 1000 µl of 0.5% BSA in IP buffer (20 mM Tris-HCl, pH8.0, with 2 mM EDTA, 150 mM NaCl, 1%Triton X-100, and Protease inhibitor cocktail). After removal of the supernatant, the fragmented chromatin lysate (200-250 µg) diluted in 1.3 ml of IP buffer was added onto bead/antibody complexes with incubation at 4 °C for at least 12 h. Next, the complex was washed once with wash buffer I (20 mM Tris-HCl, pH 8.0, with 2 mM EDTA, 0.1 %SDS, 1 % Triton X-100, and 150 mM NaCl) and once with buffer II (20 mM Tris-HCl pH, 8.0, with 2 mM EDTA, 0.1 % SDS, 1 % Triton X-100, and 500 mM NaCl), followed by two times of washing with buffer III (10 mM Tris-HCl, pH 8.0, with 1 mM EDTA, 250 mM LiCl, 1 % Deoxycholate, and 1 % NP-40) and buffer IV (10 mM Tris-HCl, pH 8.0, and 1 mM EDTA), respectively. Then, 100ul of extraction buffer (10 mM Tris-HCl, pH 8.0, 1 mM EDTA, and 1 % SDS) was added to extract the DNA-protein complexes from the beads. Proteinase K (5 µl from 20mg/ml stock) and NaCl final 0.3 M were added into the complexes incubating overnight at 65 °C to reverse the crosslinks of protein-DNA interactions. Finally, DNA was purified with MinElute PCR Purification Kit (Qiagen) and the target DNA fragments were analyzed by qPCR.
Transfection and luciferase enhancer reporter assay
DNA fragments surrounding rs11672691 (G allele or A allele) were inserted into the pGL3 Promoter vector upstream of SV40 promoter. The SV40 promoter was subsequently replaced by CEACAM21 promoter region (800 bp around the transcriptional start site (TSS) of CEACAM21). The internal Renilla control plasmid pGL4.75 [hRluc/CMV] (Promega) and the target plasmids were reverse co-transfected into LNCaP cells using X-treme GENE™ HP DNA Transfection Reagent (Roche) according to the protocol provided by the manufacturer. The experiments were carried out on the 96-well white plates. 100 µl of 3×10⁵ LNCaP cells / ml was added per well. After 48 h, luciferase activity was measured with Dual-Glo® Luciferase Assay System (Promega). All data was obtained from at least three replicate wells and statistical analyses were performed with a two-tailed Student’s t test.
Western Blot assays
Cell pellets were collected and resuspended in lysis buffer (600mM Nacl, 1% Triton X-100 in PBS, 1 X protease inhibitor). 30 εg of total protein lysates of each sample was separated by electrophoresis in 10 % SDS-PAGE gels and transferred onto 0.45 εm PVDF transfer membranes using a Semi-Dry transfer cell (Trans-Blot SD, Bio-Rad). Membranes were blocked for 1 h at room temperature using blocking buffer (5 % nonfat milk in TBST) and incubated with antibodies against V5 Tag, or V5-HRP (Invitrogen), or β-actin (Santa Cruz). Next, membranes were washed three times using TBST, 5 min each. With the exception for V5-HRP in Western blot assays, HRP-conjugated anti-rabbit IgG or anti-mouse IgG was used as secondary antibody (Invitrogen) followed by a 45 minutes incubation and washing as described above. Chemiluminescence signal was developed with SuperSignal West Femto Maximum Sensitivity Substrate (Thermo Fisher Scientific).
siRNA transfection
50-60 % confluent 22Rv1 cells or 60-70 % confluent VCaP cells were seeded in 6-well plates. 24 h later, lipofectamine RNAiMAX reagent (Invitrogen) was diluted by Opti-MEM, and siRNAs were also diluted by Opti-MEM. The diluted siRNAs were added into diluted lipofectamine RNAiMAX reagent, incubating at room temperature for 10 min. Then, the siRNA-lipid complexes were added to cultured cells. Medium was changed after 24 h and the cells were collected after 48 h.
Lentiviral constructs, lentivirus production and infection
The shRNA constructs targeting HOXA2, HOXB13, CEACAM21, PCAT19, and HOXA10 were ordered from Functional Genomics Unit (University of Helsinki) or designed by BLOCK-iT™ RNAi Designer (Thermo Fisher Scientific) and inserted into pLKO.1 Vector (Addgene). Third generation lentiviral vectors were packaged using 293T cells. In detail, 65-75 % confluent 239T cells were trypsinized and seeded into 3.5-cm plates, 24 h later the growth medium was changed with 1 ml pre-warmed low glucose DMEM (Invitrogen) containing 10 % FBS, 0.1 % penicillin and streptomycin. Cells were co-transfected with indicated shRNA construct or overexpression construct (1.5 µg each), pVSVG (envelope plasmid, 0.5 µg), pMDLg/pRRE (packaging plasmid, 0.5 µg) and pRSV-Rev (packaging plasmid, 0.5 µg) plasmids using 12ul Lipofectamine 2000. The medium was replaced with fresh medium 24 h post transfection and afterwards the virus-containing medium was collected every 12 h up to six times. Lentivirus was passed through 0.45 µm filter unit, snap frozen in liquid nitrogen and stored at −80 °C. For viral transduction, the target cells were seeded in 6-well at a density of 60-70 %. 16-20 h later, cell culture medium was replaced with lentivirus-containing medium with final 8 µg/ml polybrene (Sigma). For lentivirus-mediated knockdown, 24 h later, virus was removed and replaced by normal medium containing final 1 µg/ml puromycin (Sigma). When uninfected control cells completely died, the target cells were cultured in normal growth medium with 0.5 µg/ml puromycin. For lentivirus-mediated overexpression, 22Rv1, LNCaP, DuCaP, and RWPE1 cell lines stably expressing GFP, or CEACAM21-IRES-GFP were generated by lentiviral transduction and the GFP-expressing cells were sorted positively by fluorescence activated cell sorting (FACS) using BD FACSAria™ flow cytometer (BD Biosciences).
Cell viability and proliferation assays
Cells were resuspended and seeded into 96-well cell culture plates (2 × 10³ for 22Rv1, LNCaP and RWPE1, 1 × 10³ for DuCaP per well, respectively). Cell viability and proliferation were determined using Cell Proliferation Kit II (11465015001, Roche). The data was collected at the indicated time points by measuring the absorbance at 450 nm according to the manufacturer’s instructions. Values were obtained from triplicate wells and statistical significance was calculated using two-tailed Student’s t-test.
Invasion and migration assays
Cells were detached by trypsinization and resuspended into growth medium without serum or growth factor (2.5 × 10⁵ cells/ml 22Rv1 or LNCaP, 1 × 10⁵ cells/ml DuCaP, 5 × 10⁵ cells/ml RWPE1). 200 µl of cell suspension was transferred into 8-µm Transwell inserts (Corning Costar) with or without 100 µl Matrigel (diluted with serum free medium to 250 µg/ml) (Corning) coating. The lower chambers were filled with 700 pl of normal growth medium. After 36 h, the cells were fixed in 3.7 % formaldehyde, permeabilized with methanol and stained with Wright-Giemsa (Merck). Cells on the upper surface of the membranes were removed using a cotton swab. Invasive cells that migrated to the bottom surface of the filters were quantified by counting the numbers of cells that penetrated the membrane in eight or twelve microscopic fields (acquired at 20 X magnification) per membrane. A two-tailed Students’ t-test was employed to perform statistical analysis from three replicate inserts.
3D cell culture
The RWPE1 cell lines were prepared for Matrigel overlay cultures as described in the following steps. 100 εl of Matrigel (Corning) was layered onto a 3.5 cm high glass bottom cell culture-dish (IBIDI) and allowed to solidify for 30 minutes at + 37°C (5% CO2). RWPE1 control and CEACAM21 overexpression cells were grown to ~70% confluency, trypsinized and counted. Ten thousand cells per sample were resuspended into 200 εl of ice-cold Keratinocyte-SFM containing 2% (v/v) of Matrigel and 2% of FBS. Resuspended cells were seeded onto Matrigel-coated dishes and incubated for 15 minutes at + 37°C after which 1 ml of Keratinocyte-SFM medium containing 2% Matrigel was added. Matrigel-containing medium was subsequently refreshed every two days. One week later, cells were fixed, stained using DAPI (Merck) and filamentous actin (Merck), and analyzed by using an Olympus FluoView FV1000 confocal microscope equipped with 20 Χ UPLSAPO objective, NA: 0.75. The area of each cyst in the field of view was analyzed by Image J software using the “Particle Analysis” tool with selected sizes defined to range from 5000 εm2 upwards. Statistical analysis was assessed using two-tailed Student’s t test.
Wound healing assays
Cells were seeded into 24 well plates with ready-to-use culture-Inserts 2-Well (IBIDI) and allowed to grow near confluence. Then the inserts were removed and cells were washed twice with PBS. 1 ml of culture medium was added into each well. The wound areas were imaged at 10 h intervals using Zeiss Spinning Disc Confocal Microscope. The area of the wound in each well was analysed using image J software.
Single nucleotide mutation using CRISPR/Cas9
Two pairs of oligos (sgRNA1-top: CACCGAAGTGTAATAAGTGTTCTGT, sgRNA1-bottom: AAACACAGAACACTTATTACACTTC; sgRNA2-top: CACCGAAGTGTAATGAGTGTTCTGT; sgRNA2-bottom: AAACACAGAACACTCATTACACTTC) were designed using well-established CRISPR design tool (http://crispr.mit.edu/). rs11672691 (A or G) centered DNA fragments were cloned into pGL3 basic vector to generate repair templates. Most of the experiment was performed according to the previous protocol (Ran et al., 2013). One sgRNA-expressing plasmid was used for cutting the target region in this experiment instead of using two sgRNA-expressing plasmids as suggested in the protocol (Ran et al., 2013). 1 µl sgRNA-top (100εM) and 1µl sgRNA-bottom (100εM) were annealed in 1 ϗ T4 ligation buffer with 1µl T4 PNK. Then the oligos were inserted into pSpCas9n (BB)-2A-Puro (PX462) V2.0 (a gift from Feng Zhang Lab at MIT). Transfection was performed in 22Rv1 cells with 70 % confluency. 300 ng of indicated Cas9 plasmid (pSpCas9n (sgRNA)) and 300 ng of targeting plasmid were cotransfected into cells using Lipofectamine 3000. Medium was changed after 24 h. 48 h later, 0.8 εg/ml puromycin (Sigma) was added into transfected cells. After non-transfected cells died, the remaining transfected cells were trypsinized and sorted using FACS to establish single cell clones. The single cells were seeded into 96-well plates and checked during 9-14 days to rule out non-single clones. Finally, the single clones were picked up for subculture and genotyping.
Quantitative analysis of chromosome conformation capture assays
Quantitative analysis of chromosome conformation capture assays (3C-qPCR) were performed as described previously (Hagege et al., 2007). All the primers used in this experiment are listed in Table S7. The cells were trypsinized and resuspended in PBS with 10 % FBS. 10-million of cells were fixed in 10 ml of PBS with 10 % FBS and 1 % formaldehyde for 10 min at room temperature. The crosslinking reaction was quenched with 0.57 ml of 2.5 M glycine (ice cold). The cell pellets were washed with cold PBS and resuspended in 5 ml of cold lysis buffer (10 mM Tris-HCl, pH 7.5; 10 mM NaCl; 0.2 % NP-40; 1×complete protease inhibitor). 22Rv1 cells and VCaP cells were incubated for 13 min in lysis buffer, MCF7 cells for 11 min. Then the nuclei were collected by centrifugation and used for digestion. EcoR I was applied to digest chromatin DNA and the digestion efficiency was verified. The well-digested nuclear lysate will be used in the ligation step. After ligation and reverse crosslinking, DNA was purified and washed by 70 % ethanol. In order to remove DTT, DNA pellet was dissolved in 400 ul water, then 1200 ul 100 % ethanol was added. DNA pellets were picked using pipette tips to separate it from DTT. The concentration of 3C DNA samples was examined by SYBR-based qPCR and diluted to 100 ng/µl. 1 µl of the ligation products, 5µl of Quanti tech probe PCR mix (QIAGEN), 1 µl of Taqman probe (1.5 εM), 1µl of Test + Constant primer (5 µM) and 2 µl ddH2O were used for TaqMan qPCR. We amplified the fragments across each of nine EcoR I cut sites and mix them together as control template. We performed standard curve of each primer using serial dilution of control template. Intercept and slope values from the standard curve were used to quantify the ligation product using the following equation: Value = 10(Ct-intercept)/slope. These values were finally normalized to ERCC3 (loading control).
RNA-Seq
RNA samples were prepared from CEACAM21 overexpressing and control RWPE1 cells each with three biological replicates. Agilent Bioanalyzer 2100 (Agilent Technologies) and Eukaryote Total RNA Nano Kit (Agilent), and Qubit RNA Broad Range kit (Life Techologies) were used to assessing the quality and quantity of total RNA. The RNA integrity number of the samples ranged from 9.8 to 10.1 µg total RNA were used for library preparation using Illumina’s TruSeq® Strnd mRNA Library preparation kit (Illumina) following the manufacturer’s instructions. Quantification and quality assessment of libraries were performed by using the Bioanalyzer 2100 in combination with DNA 1000 Kit (Agilent), Qubit Broad Range DNA-kit (Life Technologies) and qPCR KAPA Library quantification kit (Kapa Biosystems). Illumina NextSeq550 platform in high-output, single-ended, 76 cycle mode, followed by FASTQ generation within BaseSpace (Illumina) was used to sequence the libraries. Sequencing resulted in approximately 40.7 Gb of data with average Q30 values of 96.41% followed by bioinformatics analysis as described below.
QUANTIFICATION AND STATISTICAL ANALYSIS
Statistical analysis
For the association analysis of rs11672691 genotype with aggressive prostate cancer, the Hardy-Weinberg equilibrium equation was used to determine whether the proportion of each genotype obtained was in agreement with the expected values as calculated from the allele frequencies. We conducted case-control unconditional logistic regression analyses to measure the association between the rs11672691 variant and prostate cancer risk or selected clinical features listed above by estimation of per allele odds ratio (OR) and its 95% confidence interval (CI). P-values were 2-sided and p<0.05 was considered to indicate a statistically significant result. Statistical analyses were performed with IBM SPSS version 22 (SPSS Inc, Chicago, USA) and STATA unless otherwise specified.
For assessing the statistics of quantitative real time PCR results and cell proliferation assays, SPSS v20 (IBM Corporation) software was applied. Significance was examined by Student’s t-test (two-tailed), significant differences were considered when P < 0.05. Details for statistical analyses, including replicate numbers, are shown in figure legends and results.
For differential gene expression analysis, we examined differential gene expression across normal prostate, tumor and metastatic tissues of several cohorts from the cBioPortal for Cancer Genomics (Cerami et al., 2012) and Oncomine database (Rhodes et al., 2004). Mann-Whitney U test or Kruskal-Wallis H test was used to assess the statistical significance of gene expression in the course of disease development. R was applied to perform statistical analyses and plot figures. For microarray-based expression profiling, we selected probes with lowest p values.
For survival analysis, we assessed the impact of gene expression levels of CEACAM21, HOXA2, PCAT19 and rs11672691 genotypes on prostate cancer prognosis and survival. We applied the Kaplan–Meier survival analysis in several cohorts from The Cancer Genome Atlas (TCGA) (Cerami et al., 2012), Oncomine database (Rhodes et al., 2004) and Oulu University Hospital. Patients were stratified into two groups based on the mean of gene expression or by the genotype of rs11672691. For the association between rs11672691 genotypes and the prognosis survival, we tested in several scenarios considering both gene expression data and rs11672691 genotype. We used the Cox proportional hazards model to assess the hazard ratio (HR). R package “Survival” was employed in the analyses.
For multivariate analysis, we investigated the association of the PCa patient overall survival with gene expression and clinical variables including Gleason score, PSA, T stage, N stage and age. We performed multivariate Cox proportional hazard analyses on various cohorts as described above. Samples were stratified into two groups with higher and lower expression by comparing to the mean values of gene expression levels. The clinical relevance of overall survival and covariates were performed in several different scenarios.
For analysis of gene expression correlation, we tested the linear correlation among the expression levels of CEACAM21, PCAT19 and HOXA2 in benign prostate and tumor issues in several cohorts from Oncomine database (Rhodes et al., 2004). Both Pearson and Spearman correlations were applied. Statistical tests and figures were made in R.
Bioninformatics analysis
For analysis of prostate cancer TCGA expression data (Cancer Genome Atlas Research Network, 2015; Cerami et al., 2012), gene level expression value (reads per million or RPM) was estimated as following: Gene level fragment count was estimated using RSeQC (Wang et al., 2012). The method of trimmed mean of M-values (TMM) in R was applied to normalize library size. Common dispersion and RPM was estimated using the edgeR package in R.
For RNA-seq analysis of RWPE1 cells overexpressing CEACAM21 or controls, we checked the quality of reads with FastQC, followed with Cutadapt (Martin, 2011) for quality control. TopHat2 software was used to align reads to human reference genome hg19. We then quantified the mapped reads using HTSeq-count script in R Bioconductor. Bioconductor package DESeq2 (1.16.1) (Love et al., 2014) was employed to identify differentially expressed genes. We then preformed the gene set enrichment analysis (GSEA) on the hallmark gene sets using GSEAPreranked test (Subramanian et al., 2005). The pre-ranked gene list was created by sign(logFC)*-log(p-value), and then being sorted in a descending order. Enrichment statistic was set to “classic”, Max size: exclude larger sets was set to 5000, and 1000 permutations, while all other parameters remained as default. R was applied to perform statistical analyses and figure plots.
DATA AND SOFTWARE AVAILABILITY
RNA-seq raw data reported in this paper was deposited in the European Nucleotide Archive with the study accession number: PRJEB25719 (https://www.ebi.ac.uk/ena/submit/sra). Mendeley Data can be accessed by this link (https://data.mendeley.com/datasets/7y388dm5ft/draft?a=a7146cca-46e2-4cb5-a936-1c9d780f17a7). Details for public repositories and software availability are in the Key Resource Table.
KEY RESOURCES TABLE.
| REAGENT or RESOURCE | SOURCE | IDENTIFIER |
|---|---|---|
| Antibodies | ||
| Rabbit polyclonal anti-AR | Santa Cruz Biotechnology | Cat#sc-816x |
| Rabbit polyclonal anti-HOXB13 | Santa Cruz Biotechnology | Cat#sc-66923x |
| Rabbit polyclonal anti-ERG | Santa Cruz Biotechnology | Cat#sc-353X |
| Rabbit polyclonal anti-HOXA2 | Santa Cruz Biotechnology | Cat#sc-28596 X |
| Rabbit IgG | Santa Cruz Biotechnology | Cat#sc-2027X |
| Mouse IgG | Santa Cruz Biotechnology | Cat#sc-2025X |
| Mouse monoclonal anti-HOXA10 | Santa Cruz Biotechnology | Cat#sc-271428X |
| Mouse monoclonal anti-V5 | Invitrogen (Thermofishcer) | Cat#R960-25 |
| Mouse monoclonal anti-V5-HRP | Invitrogen (Thermofishcer) | Cat#R961-25 |
| Rabbit polyclonal anti-HOXA13 | Abcam | Cat#ab26084 |
| Rabbit polyclonal anti-HOXA9 | EMD Millipore | Cat#07-178 |
| Goat anti-mouse IgG (H+L) secondary antibody, HRP | Thermo Fisher | Cat#32430 |
| Goat anti-rabbit IgG (H+L) secondary antibody, HRP | Thermo Fisher | Cat#32460 |
| Bacterial and Virus Strains | ||
| DH5α™ Chemically Competent cells | This paper | N/A |
| Stbl3™ Chemically Competent cells | This paper | N/A |
| Chemicals, Peptides, and Recombinant Proteins | ||
| 5α-Dihydrotestosterone (DHT) solution | From Olli A. Jänne lab (University of Helsinki) |
N/A |
| EcoRI-HF | New England Biolabs | Cat#R3101M |
| T4 DNA Ligase | New England Biolabs | Cat#M0202M |
| T4 DNA Ligase Reaction Buffer | New England Biolabs | Cat#B0202S |
| Phalloidin-TRITC | Merck | Cat#P1951 |
| DAPI | Merck | Cat#D9542 |
| DMEM | Invitrogen | Cat#31966021 |
| RPMI1640 | Merck | Cat#R8758 |
| EMEM | ATCC | Cat#30-2003 |
| Keratinocyte-Serum Free Medium | Invitrogen | Cat#17005-042 |
| Dihydrotestosterone | Merck | Cat#D-073-1ML |
| SYBR Select Master Mix | Applied Biosystems | Cat#4472908 |
| Lipofectamine 2000 | Thermo Fisher Scientific | Cat#11668030 |
| Lipofectamine 3000 | Thermo Fisher Scientific | Cat#L3000015 |
| cOmplete™, Mini, EDTA-free Protease Inhibitor Cocktail | Roche | Cat#04693159001 |
| Dynabead protein G | Invitrogen | Cat#10004D |
| X-treme GENE™ HP DNA Transfection Reagent | Roche | Cat#06366236001 |
| SuperSignal West Femto Maximum Sensitivity Substrate | Thermo Fisher Scientific | Cat#34094 |
| Lipofectamine RNAiMAX Transfection Reagent | Invitrogen | Cat#13778030 |
| Low glucose DMEM | Invitrogen | Cat#21885025 |
| Wright-Giemsa | Merck | Cat#WG16-500ml |
| Matrigel Growth Factor Reduced (GFR) Basement Membrane Matrix | Corning | Cat#354230 |
| 35 mm, high Glass Bottom dish | IBIDI | Cat#81158 |
| Cell Proliferation Kit II | Roche | Cat#11465015001 |
| Culture-Insert 2 Well 24 | IBIDI | Cat#80241 |
| Polybrene | Merck | Cat#H9268 |
| Puromycin | Merck | Cat#P9620 |
| Exonuclease I and FastAP | Thermo | Cat#EF0651 |
| 2× Phusion Master Mix with HF Buffer | Thermo | Cat#F531 |
| Quanti tech probe PCR mix | QIAGEN | Cat#204343 |
| Critical Commercial Assays | ||
| RNeasy Mini Kit | QIAGEN | Cat#74106 |
| PureLink® RNA Mini Kit | Invitrogen | Cat#12183018A |
| RNase-Free DNase | QIAGEN | Cat#79254 |
| High-Capacity cDNA Reverse Transcription Kit | Applied Biosystems | Cat#4368814 |
| Renilla luciferase assay system | Promega | Cat#E2820 |
| MinElute PCR Purification Kit | QIAGEN | Cat#28006 |
| Dual-Glo® Luciferase Assay System | Promega | Cat#E2940 |
| Deposited Data | ||
| Raw RNA-seq data | This paper | European Nucleotide Archive: PRJEB25719 |
| cDNA microarray assay of gene expression profiling | Arredouani et al., 2009 | GEO:GSE55945 |
| Genome-wide CRISPR/Cas9 screening of cancer cell survival genes | Aguirre et al., 2016 | http://wwwbroadinstituteorg/achilles |
| cDNA microarray assay of gene expression profiling | Chandran et al., 2007 | GEO: GSE6752 |
| Processed RNA-seq data | Cancer Genome Atlas Research Network, 2015 | http://www.cbioportal.org/ |
| Oncomine database | Rhodes et al., 2004 | https://www.oncomine.org/resource/login.html |
| Processed and raw cDNA microarray data | Grasso et al., 2012 | GEO: GSE35988 |
| Processed and raw ChIP-seq data | Kron et al., 2017 | GEO: GSE96652 |
| Raw STARR-seq data | Liu et al., 2017 | GEO: GSE94140 |
| Processed and raw cDNA microarray data | Liu et al., 2006 | ArrayExpress: E-TABM-26 |
| Processed ChIP-seq data | Mei et al., 2017 | http://cistrome.org/db/#/ |
| Raw RNA-seq data | Ren et al., 2012 | ArrayExpress: E-MTAB-567 |
| Processed and raw cDNA microarray data | Taylor et al., 2010 | GEO: GSE21032 |
| Processed and raw cDNA microarray data | Tomlins et al., 2007 | GEO: GSE6099 |
| Processed ChIP-seq data | Whitington et al., 2016 | http://tomwhi.github.io/prcagwas/ |
| Experimental Models: Cell Lines | ||
| 22Rv1 | ATCC | Cat#CRL-2505 |
| LNCaP | ATCC | Cat#CRL-1740 |
| DuCaP | From Olli A. Jänne lab (University of Helsinki) |
Cat#RRID:CVCL_2025 |
| COS-1 | ATCC | Cat#CRL-1650 |
| RWPE1 | ATCC | Cat#CRL-11609 |
| VCaP | ATCC | Cat#CRL-2876 |
| MCF7 | ATCC | ATCC® HTB-22™ |
| 293T Cells | ATCC | Cat#CRL-11268 |
| Oligonucleotides | ||
| Control siRNA: | This paper | N/A |
| AGGUAGUGUAAUCGCCUUG | ||
| PCAT19 siRNAl: | This paper | N/A |
| CCAUUGGAGAUACUCAUUA | ||
| PCAT19 siRNA2 | This paper | N/A |
| UCAAGAAGAUGCUCAUCUA | ||
| AllStars Negative Control siRNA | Qiagen | Cat#SI03650318 |
| ERG-siRNA1 | Qiagen | Cat#SI03064726 |
| ERG-siRNA2 | Qiagen | Cat#SI03089443 |
| Control-shRNA | Functional Genomics Unit (University of Helsinki) |
Cat#SHC002 |
| HOXB13-shRNA | Functional Genomics Unit (University of Helsinki) |
Cat#TRCN0000020846 |
| HOXA2-shRNA1 | Functional Genomics Unit (University of Helsinki) |
Cat#TRCN0000015061 |
| HOXA2-shRNA2 | Functional Genomics Unit (University of Helsinki) |
Cat#TRCN0000015058 |
| CEACAM21-shRNA1 | Functional Genomics Unit (University of Helsinki) |
Cat#TRCN0000146920 |
| CEACAM21-shRNA2 | Functional Genomics Unit (University of Helsinki) |
Cat#TRCN0000150236 |
| CEACAM21-shRNA3 | Merck | Cat#TRCN0000371717 |
| CEACAM21-shRNA4 | Merck | Cat#TRCN0000371716 |
| HOXA10 shRNA1 | Functional Genomics Unit (University of Helsinki) |
Cat#TRCN0000015248 |
| HOXA10 shRNA2 | Functional Genomics Unit (University of Helsinki) |
Cat#TRCN0000015252 |
| Primers for ChIP-qPCR, RT-qPCR, clone and shRNAs, see Table S5 | This paper | N/A |
| Primers for transcription factor-DNA binding assays, see Table S6 | This paper | N/A |
| Primers for 3C-qPCR experiments, see Table S7 | This paper | N/A |
| Recombinant DNA | ||
| pGEN-MCS-Renilla | Wei et al., 2010 | N/A |
| pcDNA3.1/V5-His A | Invitrogen | Cat#V81020 |
| pLVET-IRES-GFP | Zhang et al., 2017 | N/A |
| pGL3-Basic | Promega | Cat#E1751 |
| pGL3-Promoter Vector | Promega | Cat#E1761 |
| pLKO.1 Puro Vector | Stewart et al., 2003 | Addgene #8453 |
| pSpCas9n (BB)-2A-Puro (PX462) | Feng Zhang Lab at MIT | N/A |
| pGL4.75 [hRluc/CMV] | Promega | Cat#E6931 |
| Software and Algorithms | ||
| HaploReg v4.1 | Ward and Kellis. 2012 | http://archive.broadinstitute.org/mammals/haploreg/haploreg.php |
| FastQC | Babraham Bioinformatics Institute | https://www.bioinformatics.babraham.ac.uk/projects/fastqc/ |
| Matrix eQTL | R Bioconductor | https://bioconductor.org/ |
| Trimmed mean of M-values (TMM) | R Bioconductor | https://bioconductor.org/ |
| Cutadapt | Martin. 2011 | https://cutadapt.readthedocs.io/en/stable/ |
| Tophat2 | Center for Computational Biology at Johns Hopkins University | https://ccb.jhu.edu/software/tophat/index.shtml |
| HTSeq | Bioconductor | https://htseq.readthedocs.io/en/release_0.9.1/ |
| DESeq2 | Love et al., 2014 | https://bioconductor.org/packages/release/bioc/html/DESeq2.htmlor.org/packages/release/bioc/html/DESeq2.html |
| GSEA | Subramanian et al., 2005 | http://software.broadinstitute.org/gsea/index.jsp |
| CRISPR design tool | Feng Zhang Lab at MIT | http://crispr.mit.edu/ |
| BLOCK-iT™ RNAi Designer | Thermo Fisher Scientific | https://rnaidesigner.thermofisher.com/rnaiexpress/ |
| Enhancer Element Locator | Hallikas et al., 2006 | https://www.cs.helsinki.fi/u/kpalin/EEL/ |
| edgeR | R Bioconductor | http://bioconductor.org/packages/release/bioc/html/edgeR.html |
| R Version 3.4.1 | R | https://www.rproject.org/ |
Supplementary Material
(A) Quantitative RT-PCR analysis of the mRNA levels of PCAT19 in the PCa cells 22Rv1, DuCaP and LNCaP infected with lentiviral particles carrying different shRNAs against PCAT19. Error bars, ± SD from three technical replication. (B and C) PCAT19 promotes PCa cell growth measured by XTT colorimetric assay (absorbance at 450nm (OD450); mean ± SD of triplicate experiments), and metastasis behaviors by migration and invasion assays (mean ± SEM of triplicate experiments) in the PCa cell lines DuCaP (B) and LNCaP (C) infected with control shRNA or the shRNAs against PCAT19. In A-C, *P < 0.05, **P < 0.01, ***P < 0.001 were assessed using two-tailed Student’s t test. (D and E) Representative images of migration (D) and invasion (E) assays for 22Rv1, DuCaP and LNCaP cells infected with control and PCAT19 shRNAs. Scale bars, 100 µm. (F) The mRNA levels of CEACAM21 in the PCa cells 22Rv1, DuCaP and LNCaP infected with lentiviral particles carrying CEACAM21-specific shRNAs. Data shown are mean ± SD of three technical replicates. (G and H) Depletion of CEACAM21 inhibits PCa cell proliferation measured by XTT colorimetric assay (absorbance at 450nm (OD450); mean ± SD of triplicate experiments), and aggressive behaviors by migration and invasion assays (mean ± SEM of triplicate experiments) in the PCa cell lines DuCaP (G) and LNCaP (H) infected with control shRNA or the different shRNAs against CEACAM21. In A-C, *P < 0.05, **P < 0.01, ***P < 0.001 were evaluated by two-tailed Student’s t test. (I and J) Representative images of migration (I) and invasion (J) assays for the tested PCa cell lines, including 22Rv1, DuCaP and LNCaP infected with control and CEACAM21-specific shRNAs. Scale bars, 100 µm.
(A) Overexpression of CEACAM21 in the human PCa cell lines, including 22Rv1, LNCaP, DuCaP and RWPE1. CEACAM21 protein levels were determined by western blot analysis. Lanes 1, 3, 5, 7, empty vector-transfected cells as experimental controls. Lanes 2, 4, 6, 8, cells transfected with expression vectors containing CEACAM21. (B) Cell growth and viability were analyzed by XTT assays in the four tested PCa cell models. (C) Similar to the experiments shown in A, except that the overexpression of CEACAM21 was mediated by lentivirus expression constructs. (D) XTT proliferation assay showing the effect of CEACAM21 overexpression on cell growth rate. In B and D, *P < 0.05, **P < 0.01, ***P < 0.001, were examined by two-tailed Student’s t test. (E) CEACAM21 overexpression stimulates the growth of RWPE1 cells in 3D cyst culture. Left panel: Confocal slices of control (lenti-control) and CEACAM21 overexpressing (lenti-CEACAM21) RWPE1 cysts. Note that both types of cysts have large central lumens while the overall size of CEACAM21 cysts is obviously larger. Cysts were grown for one week followed by fixation, permeabilization and staining with DAPI (nucleus, blue) and TRITC-Phailloidin (Actin, red). Scale bar is 100 μm. Right panel: Cyst areas of the two RWPE1 cell samples were measured (n=60 cysts each condition) as described in supplementary materials and methods. The data are shown as average cyst area ± SD. Statistical significance was assessed using two-tailed Student’s t test. *** represents P < 0.0001. (F and G) Transient transfection (F) or lentivirus expression construct-mediated (G) overexpression of CEACAM21 enhance the migration and invasion of the tested PCa cell lines of 22Rv1, LNCaP and DuCaP (mean ± SEM of triplicate experiments). Error bars, ± SD of triplicate experiments. *P < 0.05, **P < 0.01, were assessed using two tailed Student’s t test. Accordingly, representative images of migration and invasion assays are shown. (H) Representative images of migration (upper panel) and invasion (lower panel) assays for RWPE1 cells infected with lenti control vector or CEACAM21 lenti expression constructs. Scale bars, 100 µm.
(A) CEACAM21 overexpression in the human immortalized prostatic epithelial RWPE1 cells. CEACAM21 protein expression was determined by western blot analysis. Lanes 1-3, lentivirus empty vector-transfected cells as experimental controls. Lanes 4-6, cells transfected with lentivirus vectors haboring CEACAM21. (B) Raw RPKM expression correlation among three biological replicates of controls and experiments, respectively, from RWPE1 RNA-seq data. (C) Heat maps for expression level of genes down- or upregulated by CEACAM21 overexpression in RWPE1 cells. The number of genes determined by RNA-seq (DESeq2, FDR < 0.01). (D) GSEA was performed on RNA-seq from RWPE1 cells with CEACAM21 overexpression by using the hallmark gene sets. Enrichment plot indicates elevated expression of MYC gene sets upon CEACAM21 overexpression in RWPE1 cells. (E) PCAT19 and (F) CEACAM21 mRNA expression were elevated in human prostate tumors than that in normal prostate gland. The P values were calculated using Mann-Whitney U-tests.
(A) rs11672691 enhancer activity was determined by the modified self-transcribing active regulatory region sequencing (STARR-seq) assays. (B and C) Prediction of the affinity of HOXA2 binding to the difference alleles of rs11672691 (B) and rs887391 (C). (D and E) Relative binding affinity of HOXA2 to the DNA sequences with rs11672691. In D, Error bars, ± SD of six replicate experiments. (F and J) ChIP-qPCR for HOXA9, HOXA13, HOXB13, AR, and HOXA10 chromatin binding at the rs11672691 containing region in 22Rv1 or VCaP cell lines. (K) ChIP followed by allele-specific quantitative PCR (qPCR) validation of overexpressed HOXA2 binding at rs11672691 in 22Rv1 cells. In F-K, Error bars, ± SEM of three technical replicates. NS, non-significant. *P < 0.05, **P < 0.01, ***P < 0.001, were assessed using two-tailed Student’s t test.
(A) The mRNA level of HOXA2 was induced upon DHT treatment in VCaP cells. (B) The number of 22Rv1 cells infected with control shRNA or HOXA2 shRNA in migration assays. (C and D) Representative images of migration (C) and invasion (D) assays for 22Rv1 cells infected with control and HOXA2 shRNA. Scale bars, 100 pm. Error bars, ± SEM from triplicate experiments. *P < 0.05, **P < 0.01, ***P < 0.001, P values were assessed using two-tailed Student’s t tests. (E and F) Multivariate analysis of the risk for BCR-free survival in a large cohort of PCa patients with the expression data of HOXA2 and other clinical variables. (G and H) In comparison with the data shown in Figure 3H, HOXA2 expression data shows no predictive values for biochemical recurrence in the patient group with Gleason Score 6 (low risk) or Gleason Score ≥8 (high risk).
(A and B) Knockdown of HOXB13 (shRNA) (A) or ERG (siRNAs) (B) in VCaP cells diminishes the mRNA levels of PCAT19 and CEACAM21. (C) Knockdown of HOXA10 in 22Rv1 cells has no effect on the mRNA levels of PCAT19 or CEACAM21. (D and E) DHT stimulation induces slight upregulation of PCAT19 (D) and obvious elevation of CEACAM21 mRNA levels (E) in VCaP cells. (F) The mRNA levels of CEACAM21 decreased upon knockdown of PCAT19 in VCaP cells. Error bars, ± SD from three technical replicates. *P < 0.05, **P < 0.01, ***P < 0.001, two-tailed Student’s t test. (G) The virtual 4C mode of the 3D Genome Browser reveals a strong interaction of the SNP rs11672691 (red line) with CEACAM21 region (the highest peak) in LNCaP. Here the remote chromatin interaction effect of SNP rs11672691 was explored by plotting the virtual 4C from LNCaP Hi-C data set (Wang et al., 2017). (H) 3C analysis of chromatin interactions between CEACAM21 and rs11672691 loci in 22Rv1 cells with or without shRNA-mediated depletion of PCAT19 expression. Graphic data shows the relative crosslinking frequencies of CEACAM21 promoter (anchor fragment) and the other cutting sites of EcoRI in this nearly 100 kb region (chr19:41982282-42079092) in 22Rv1 cells measured by 3C-qPCR. Data shown are mean ± SD of triplicate experiments.
(A and B) Multivariate analysis of the risk for BCR-free survival in a large cohort of PCa patients with the expression data of CEACAM21 (A) or PCAT19 (B) with additional clinical variables.
Highlights.
SNP rs11672691 at 19q13 associates with aggressive PCa, PCAT19 and CEACAM21 expression
rs11672691 G empowers prognostic factor HOXA2 to elevate its eQTL gene expression
rs11672691 directly impacts gene regulation, PCa cellular phenotype and progression
rs11672691 genotype and PCAT19 or CEACAM21 expression synergize in PCa prognosis
ACKNOWLEDGMENTS
We thank Johanna Myllyharju, Kalervo Hiltunen, Peppi Karppinen, and Taina Pihlajaniemi for study support; Antti Viklund, Aira Erkkilä, Jaana Träskelin, Katri Pylkäs, Leena Keskitalo, Meeri Otsukka, Veli-Pekka Ronkainen, BCO Sequencing and Imaging Core for technical service; Fredrik Wiklund, Johan Lindberg, and Thomas Whitington for eQTL data; CSC-IT Center for Computing server and TCGA Research Network. This work was funded by Academy of Finland (284618/279760 to G.-H.W., 251074/310115 to J.S.); UO Strategic Funds (G.-H.W.); Jane and Aatos Erkko Foundation (G.-H.W.); Finnish Cancer Foundation (G.-H.W. and J.S.); Sigrid Juselius Foundation (J.S.); Turku University Hospital (M3002/M4807 to J.S.); National Institute of Health (R01CA157881 to L.W.); and China Scholarship Council fellowship (201206300074 to P.G.).
Footnotes
AUTHOR CONTRIBUTIONS
G.-H.W. conceptualized, designed and supervised the project. P.G., J.-H.X., X.-M.D., and Y.Y. assisted by S.S., N.G., and Q.H. performed the experiments. C.S., T.L.J.T., A.A., and J.S. contributed to cohort data of PCa patients and analysis. Q.Z. performed bioinformatics analysis. H.-M.L. did ChIP-seq reanalysis. L.G.W analysed TCGA RNA-seq data. P.Z., J.Z., and L.W. contributed to eQTL analysis. S.P.C., K.Z., and A.M. contributed to 3D cell culture and phenotyping. S.L. and X.W. did STARR-seq. M.H.V. provided PCa clinical data. G.-H.W., and P.G. wrote the manuscript with help from J.-H.X., C.S., Q.Z., A.M., L.W., and input from other co-authors.
DECLARATION OF INTERESTS
The authors declare no competing interests.
Publisher's Disclaimer: This is a PDF file of an unedited manuscript that has been accepted for publication. As a service to our customers we are providing this early version of the manuscript. The manuscript will undergo copyediting, typesetting, and review of the resulting proof before it is published in its final citable form. Please note that during the production process errors may be discovered which could affect the content, and all legal disclaimers that apply to the journal pertain.
REFERENCES
- Aguirre AJ, Meyers RM, Weir BA, Vazquez F, Zhang CZ, Ben-David U, Cook A, Ha G, Harrington WF, Doshi MB, et al. (2016). Genomic Copy Number Dictates a Gene-Independent Cell Response to CRISPR/Cas9 Targeting. Cancer. Discov 6, 914–929. [DOI] [PMC free article] [PubMed] [Google Scholar]
- Al Olama AA, Kote-Jarai Z, Berndt SI, Conti DV, Schumacher F, Han Y, Benlloch S, Hazelett DJ, Wang Z, Saunders E, et al. (2014). A meta-analysis of 87,040 individuals identifies 23 new susceptibility loci for prostate cancer. Nat. Genet 46, 1103–1109. [DOI] [PMC free article] [PubMed] [Google Scholar]
- Alkelai A, Lupoli S, Greenbaum L, Kohn Y, Kanyas-Sarner K, Ben-Asher E, Lancet D, Macciardi F, and Lerer B (2012). DOCK4 and CEACAM21 as novel schizophrenia candidate genes in the Jewish population. Int. J. Neuropsychopharmacol 15, 459–469. [DOI] [PubMed] [Google Scholar]
- Amin Al Olama A, Kote-Jarai Z, Schumacher FR, Wiklund F, Berndt SI, Benlloch S, Giles GG, Severi G, Neal DE, Hamdy FC, et al. (2013). A meta-analysis of genome-wide association studies to identify prostate cancer susceptibility loci associated with aggressive and non-aggressive disease. Hum. Mol. Genet 22, 408–415. [DOI] [PMC free article] [PubMed] [Google Scholar]
- Arredouani MS, Lu B, Bhasin M, Eljanne M, Yue W, Mosquera JM, Bubley GJ, Li V, Rubin MA, Libermann TA, et al. (2009). Identification of the transcription factor single-minded homologue 2 as a potential biomarker and immunotherapy target in prostate cancer. Clin. Cancer Res 15, 5794–5802. [DOI] [PMC free article] [PubMed] [Google Scholar]
- Berndt SI, Wang Z, Yeager M, Alavanja MC, Albanes D, Amundadottir L, Andriole G, Beane Freeman L, Campa D, Cancel-Tassin G, et al. (2015). Two susceptibility loci identified for prostate cancer aggressiveness. Nat. Commun 6, 6889. [DOI] [PMC free article] [PubMed] [Google Scholar]
- Bishr M, and Saad F (2013). Overview of the latest treatments for castration-resistant prostate cancer. Nat. Rev. Urol 10, 522–528. [DOI] [PubMed] [Google Scholar]
- Blumenthal RD, Leon E, Hansen HJ, and Goldenberg DM (2007). Expression patterns of CEACAM5 and CEACAM6 in primary and metastatic cancers. BMC Cancer 7, 2. [DOI] [PMC free article] [PubMed] [Google Scholar]
- Cancer Genome Atlas Research Network. (2015). The Molecular Taxonomy of Primary Prostate Cancer. Cell 163, 1011–1025. [DOI] [PMC free article] [PubMed] [Google Scholar]
- Cerami E, Gao J, Dogrusoz U, Gross BE, Sumer SO, Aksoy BA, Jacobsen A, Byrne CJ, Heuer ML, Larsson E, et al. (2012). The cBio cancer genomics portal: an open platform for exploring multidimensional cancer genomics data. Cancer. Discov 2, 401–404. [DOI] [PMC free article] [PubMed] [Google Scholar]
- Chandran UR, Ma C, Dhir R, Bisceglia M, Lyons-Weiler M, Liang W, Michalopoulos G, Becich M, and Monzon FA (2007). Gene expression profiles of prostate cancer reveal involvement of multiple molecular pathways in the metastatic process. BMC Cancer 7, 64. [DOI] [PMC free article] [PubMed] [Google Scholar]
- Dang CV (2012). MYC on the path to cancer. Cell 149, 22–35. [DOI] [PMC free article] [PubMed] [Google Scholar]
- Deplancke B, Alpern D, and Gardeux V (2016). The Genetics of Transcription Factor DNA Binding Variation. Cell 166, 538–554. [DOI] [PubMed] [Google Scholar]
- Ferlay J, Soerjomataram I, Dikshit R, Eser S, Mathers C, Rebelo M, Parkin DM, Forman D, and Bray F (2015). Cancer incidence and mortality worldwide: sources, methods and major patterns in GLOBOCAN 2012. Int. J. Cancer 136, E359–86. [DOI] [PubMed] [Google Scholar]
- Gao P, and Wei GH (2017). Genomic Insight into the Role of IncRNA in Cancer Susceptibility. Int. J. Mol. Sci 18, pii: E1239. [DOI] [PMC free article] [PubMed] [Google Scholar]
- Grasso CS, Wu YM, Robinson DR, Cao X, Dhanasekaran SM, Khan AP, Quist MJ, Jing X, Lonigro RJ, Brenner JC, et al. (2012). The mutational landscape of lethal castration-resistant prostate cancer. Nature 487, 239–243. [DOI] [PMC free article] [PubMed] [Google Scholar]
- Guo H, Ahmed M, Zhang F, Yao CQ, Li S, Liang Y, Hua J, Soares F, Sun Y, Langstein J, et al. (2016). Modulation of long noncoding RNAs by risk SNPs underlying genetic predispositions to prostate cancer. Nat. Genet 48, 1142–1150. [DOI] [PubMed] [Google Scholar]
- Hagege H, Klous P, Braem C, Splinter E, Dekker J, Cathala G, de Laat W, and Forne T (2007). Quantitative analysis of chromosome conformation capture assays (3C-qPCR). Nat. Protoc 2, 1722–1733. [DOI] [PubMed] [Google Scholar]
- Hallikas O, Palin K, Sinjushina N, Rautiainen R, Partanen J, Ukkonen E, and Taipale J (2006). Genome-wide prediction of mammalian enhancers based on analysis of transcription-factor binding affinity. Cell 124, 47–59. [DOI] [PubMed] [Google Scholar]
- Henriquez-Hernandez LA, Valenciano A, Foro-Arnalot P, Alvarez-Cubero MJ, Cozar JM, Suarez-Novo JF, Castells-Esteve M, Fernandez-Gonzalo P, De-Paula-Carranza B, Ferrer M, et al. (2014). Single nucleotide polymorphisms in DNA repair genes as risk factors associated to prostate cancer progression. BMC Med. Genet 15, 143–014- 0143–0. [DOI] [PMC free article] [PubMed] [Google Scholar]
- Hsu FC, Sun J, Wiklund F, Isaacs SD, Wiley KE, Purcell LD, Gao Z, Stattin P, Zhu Y, Kim ST, et al. (2009). A novel prostate cancer susceptibility locus at 19q13. Cancer Res 69, 2720–2723. [DOI] [PMC free article] [PubMed] [Google Scholar]
- Hua TJ, Ahmed M, Guo H, Zhang Y, Chen S, Soares F, Lu J, Zhou S, Wang M, Li H, et al. (2018). Risk SNPs mediated promoter-enhancer switching promotes prostate cancer progression through IncRNA PCAT19. [DOI] [PubMed] [Google Scholar]
- Huang Q, Whitington T, Gao P, Lindberg JF, Yang Y, Sun J, Vaisanen MR, Szulkin R, Annala M, Yan J, et al. (2014). A prostate cancer susceptibility allele at 6q22 increases RFX6 expression by modulating HOXB13 chromatin binding. Nat. Genet 46, 126–135. [DOI] [PubMed] [Google Scholar]
- Jolma A, Yan J, Whitington T, Toivonen J, Nitta KR, Rastas P, Morgunova E, Enge M, Taipale M, Wei G, et al. (2013). DNA-binding specificities of human transcription factors. Cell 152, 327–339. [DOI] [PubMed] [Google Scholar]
- Kopp F, and Mendell JT (2018). Functional Classification and Experimental Dissection of Long Noncoding RNAs. Cell 172, 393–407. [DOI] [PMC free article] [PubMed] [Google Scholar]
- Kron KJ, Murison A, Zhou S, Huang V, Yamaguchi TN, Shiah YJ, Fraser M, van der Kwast T, Boutros PC., et al. (2017). TMPRSS2-ERG fusion co-opts master transcription factors and activates NOTCH signaling in primary prostate cancer. Nat Genet. 49:1336–1345. [DOI] [PubMed] [Google Scholar]
- Larson NB, McDonnell S, French AJ, Fogarty Z, Cheville J, Middha S, Riska S, Baheti S, Nair AA, Wang L, et al. (2015). Comprehensively evaluating cis-regulatory variation in the human prostate transcriptome by using gene-level allele-specific expression. Am. J. Hum. Genet 96, 869–882. [DOI] [PMC free article] [PubMed] [Google Scholar]
- Liu P, Ramachandran S, Ali Seyed M, Scharer CD, Laycock N, Dalton WB, Williams H, Karanam S, Datta MW, Jaye DL, et al. (2006). Sex-determining region Y box 4 is a transforming oncogene in human prostate cancer cells. Cancer Res 66, 4011–4019. [DOI] [PubMed] [Google Scholar]
- Liu S, Liu Y, Zhang Q, Wu J, Liang J, Yu S, Wei GH, White KP, and Wang X (2017). Systematic identification of regulatory variants associated with cancer risk. Genome Biol 18, 194. [DOI] [PMC free article] [PubMed] [Google Scholar]
- Love MI, Huber W, and Anders S (2014). Moderated estimation of fold change and dispersion for RNA-seq data with DESeq2. Genome Biol 15, 550. [DOI] [PMC free article] [PubMed] [Google Scholar]
- MacArthur J, Bowler E, Cerezo M, Gil L, Hall P, Hastings E, Junkins H, McMahon A, Milano A, Morales J, Pendlington ZM, et al. (2017). The new NHGRI-EBI Catalog of published genome-wide association studies (GWAS Catalog). Nucleic Acids Res. 45, D896–D901. [DOI] [PMC free article] [PubMed] [Google Scholar]
- Martin M (2011). Cutadapt removes adapter sequences from high-throughput sequencing reads. EMBnet.Journal 17, [Google Scholar]
- Mei S, Qin Q, Wu Q, Sun H, Zheng R, Zang C, Zhu M, Wu J, Shi X, Taing L, et al. (2017). Cistrome Data Browser: a data portal for ChIP-Seq and chromatin accessibility data in human and mouse. Nucleic Acids Res. 45, D658–D662. [DOI] [PMC free article] [PubMed] [Google Scholar]
- Mills IG (2014). Maintaining and reprogramming genomic androgen receptor activity in prostate cancer. Nat. Rev. Cancer. 14, 187–198. [DOI] [PubMed] [Google Scholar]
- Mucci LA, Hjelmborg JB, Harris JR, Czene K, Havelick DJ, Scheike T, Graff RE, Holst K, Moller S, Unger RH, et al. (2016). Familial Risk and Heritability of Cancer Among Twins in Nordic Countries. JAMA 315, 68–76. [DOI] [PMC free article] [PubMed] [Google Scholar]
- Orom UA, Derrien T, Beringer M, Gumireddy K, Gardini A, Bussotti G, Lai F, Zytnicki M, Notredame C, Huang Q, et al. (2010). Long noncoding RNAs with enhancer-like function in human cells. Cell 143, 46–58. [DOI] [PMC free article] [PubMed] [Google Scholar]
- Pomerantz MM, Li F, Takeda DY, Lenci R, Chonkar A, Chabot M, Cejas P, Vazquez F, Cook J, Shivdasani RA, et al. (2015). The androgen receptor cistrome is extensively reprogrammed in human prostate tumorigenesis. Nat. Genet 47, 1346–1351. [DOI] [PMC free article] [PubMed] [Google Scholar]
- Ran FA, Hsu PD, Wright J, Agarwala V, Scott DA, and Zhang F (2013). Genome engineering using the CRISPR-Cas9 system. Nat. Protoc 8, 2281–2308. [DOI] [PMC free article] [PubMed] [Google Scholar]
- Ren S, Peng Z, Mao JH, Yu Y, Yin C, Gao X, Cui Z, Zhang J, Yi K, Xu W, et al. (2012). RNA-seq analysis of prostate cancer in the Chinese population identifies recurrent gene fusions, cancer-associated long noncoding RNAs and aberrant alternative splicings. Cell Res. 22, 806–821. [DOI] [PMC free article] [PubMed] [Google Scholar]
- Rhodes DR, Yu J, Shanker K, Deshpande N, Varambally R, Ghosh D, Barrette T, Pandey A, and Chinnaiyan AM (2004). ONCOMINE: a cancer microarray database and integrated data-mining platform. Neoplasia 6, 1–6. [DOI] [PMC free article] [PubMed] [Google Scholar]
- Saxton RA, and Sabatini DM (2017). mTOR Signaling in Growth, Metabolism, and Disease. Cell 168, 960–976. [DOI] [PMC free article] [PubMed] [Google Scholar]
- Schroder FH, Hugosson J, Roobol MJ, Tammela TL, Ciatto S, Nelen V, Kwiatkowski M, Lujan M, Lilja H, Zappa M, et al. (2009). Screening and prostate-cancer mortality in a randomized European study. N. Engl. J. Med 360, 1320–1328. [DOI] [PubMed] [Google Scholar]
- Shui IM, Lindstrom S, Kibel AS, Berndt SI, Campa D, Gerke T, Penney KL, Albanes D, Berg C, Bueno-de-Mesquita HB, et al. (2014). Prostate cancer (PCa) risk variants and risk of fatal PCa in the National Cancer Institute Breast and Prostate Cancer Cohort Consortium. Eur. Urol 65, 1069–1075. [DOI] [PMC free article] [PubMed] [Google Scholar]
- Spisak S, Lawrenson K, Fu Y, Csabai I, Cottman RT, Seo JH, Haiman C, Han Y, Lenci R, Li Q, et al. (2015). CAUSEL: an epigenome- and genome-editing pipeline for establishing function of noncoding GWAS variants. Nat. Med 21, 1357–1363. [DOI] [PMC free article] [PubMed] [Google Scholar]
- Stewart SA, Dykxhoorn DM, Palliser D, Mizuno H, Yu EY, An DS, Sabatini DM, Chen IS, Hahn WC, Sharp PA, Weinberg RA, and Novina CD (2003). Lentivirus-delivered stable gene silencing by RNAi in primary cells. RNA 9, 493–501. [DOI] [PMC free article] [PubMed] [Google Scholar]
- Subramanian A, Tamayo P, Mootha VK, Mukherjee S, Ebert BL, Gillette MA, Paulovich A, Pomeroy SL, Golub TR, Lander ES, et al. (2005). Gene set enrichment analysis: a knowledge-based approach for interpreting genome-wide expression profiles. Proc. Natl. Acad. Sci. U. S. A 102, 15545–15550. [DOI] [PMC free article] [PubMed] [Google Scholar]
- Taylor BS, Schultz N, Hieronymus H, Gopalan A, Xiao Y, Carver BS, Arora VK, Kaushik P, Cerami E, Reva B, et al. (2010). Integrative genomic profiling of human prostate cancer. Cancer Cell. 18:11–22. [DOI] [PMC free article] [PubMed] [Google Scholar]
- Tomlins SA, Mehra R, Rhodes DR, Cao X, Wang L, Dhanasekaran SM, Kalyana-Sundaram S, Wei JT, Rubin MA, Pienta KJ, et al. (2007). Integrative molecular concept modeling of prostate cancer progression. Nat. Genet 39, 41–51. [DOI] [PubMed] [Google Scholar]
- Wang L, Wang S, and Li W (2012). RSeQC: quality control of RNA-seq experiments. Bioinformatics 28, 2184–2185. [DOI] [PubMed] [Google Scholar]
- Wang Y, Zhang B, Zhang L, An L, Xu J, Li D, Choudhary MN, Li Y, Hu M, Hardison R, et al. (2017). The 3D Genome Browser: a web-based browser for visualizing 3D genome organization and long-range chromatin interactions. bioRxiv [DOI] [PMC free article] [PubMed] [Google Scholar]
- Ward LD and Kellis M (2012). HaploReg: a resource for exploring chromatin states, conservation, and regulatory motif alterations within sets of genetically linked variants. Nucleic Acids Res. 40, D930–934. [DOI] [PMC free article] [PubMed] [Google Scholar]
- Wei GH, Badis G, Berger MF, Kivioja T, Palin K, Enge M, Bonke M, Jolma A, Varjosalo M, Gehrke AR, et al. (2010). Genome-wide analysis of ETS-family DNA-binding in vitro and in vivo. EMBO J. 29, 2147–2160. [DOI] [PMC free article] [PubMed] [Google Scholar]
- Whitington T, Gao P, Song W, Ross-Adams H, Lamb AD, Yang Y, Svezia I, Klevebring D, Mills IG, Karlsson R, et al. (2016). Gene regulatory mechanisms underpinning prostate cancer susceptibility. Nat. Genet 48, 387–397. [DOI] [PubMed] [Google Scholar]
- Zhang K, Myllymaki SM, Gao P, Devarajan R, Kytola V, Nykter M, Wei GH, and Manninen A (2017). Oncogenic K-Ras upregulates ITGA6 expression via FOSL1 to induce anoikis resistance and synergizes with alphaV-Class integrins to promote EMT. Oncogene 36, 5681–5694. [DOI] [PMC free article] [PubMed] [Google Scholar]
Associated Data
This section collects any data citations, data availability statements, or supplementary materials included in this article.
Supplementary Materials
(A) Quantitative RT-PCR analysis of the mRNA levels of PCAT19 in the PCa cells 22Rv1, DuCaP and LNCaP infected with lentiviral particles carrying different shRNAs against PCAT19. Error bars, ± SD from three technical replication. (B and C) PCAT19 promotes PCa cell growth measured by XTT colorimetric assay (absorbance at 450nm (OD450); mean ± SD of triplicate experiments), and metastasis behaviors by migration and invasion assays (mean ± SEM of triplicate experiments) in the PCa cell lines DuCaP (B) and LNCaP (C) infected with control shRNA or the shRNAs against PCAT19. In A-C, *P < 0.05, **P < 0.01, ***P < 0.001 were assessed using two-tailed Student’s t test. (D and E) Representative images of migration (D) and invasion (E) assays for 22Rv1, DuCaP and LNCaP cells infected with control and PCAT19 shRNAs. Scale bars, 100 µm. (F) The mRNA levels of CEACAM21 in the PCa cells 22Rv1, DuCaP and LNCaP infected with lentiviral particles carrying CEACAM21-specific shRNAs. Data shown are mean ± SD of three technical replicates. (G and H) Depletion of CEACAM21 inhibits PCa cell proliferation measured by XTT colorimetric assay (absorbance at 450nm (OD450); mean ± SD of triplicate experiments), and aggressive behaviors by migration and invasion assays (mean ± SEM of triplicate experiments) in the PCa cell lines DuCaP (G) and LNCaP (H) infected with control shRNA or the different shRNAs against CEACAM21. In A-C, *P < 0.05, **P < 0.01, ***P < 0.001 were evaluated by two-tailed Student’s t test. (I and J) Representative images of migration (I) and invasion (J) assays for the tested PCa cell lines, including 22Rv1, DuCaP and LNCaP infected with control and CEACAM21-specific shRNAs. Scale bars, 100 µm.
(A) Overexpression of CEACAM21 in the human PCa cell lines, including 22Rv1, LNCaP, DuCaP and RWPE1. CEACAM21 protein levels were determined by western blot analysis. Lanes 1, 3, 5, 7, empty vector-transfected cells as experimental controls. Lanes 2, 4, 6, 8, cells transfected with expression vectors containing CEACAM21. (B) Cell growth and viability were analyzed by XTT assays in the four tested PCa cell models. (C) Similar to the experiments shown in A, except that the overexpression of CEACAM21 was mediated by lentivirus expression constructs. (D) XTT proliferation assay showing the effect of CEACAM21 overexpression on cell growth rate. In B and D, *P < 0.05, **P < 0.01, ***P < 0.001, were examined by two-tailed Student’s t test. (E) CEACAM21 overexpression stimulates the growth of RWPE1 cells in 3D cyst culture. Left panel: Confocal slices of control (lenti-control) and CEACAM21 overexpressing (lenti-CEACAM21) RWPE1 cysts. Note that both types of cysts have large central lumens while the overall size of CEACAM21 cysts is obviously larger. Cysts were grown for one week followed by fixation, permeabilization and staining with DAPI (nucleus, blue) and TRITC-Phailloidin (Actin, red). Scale bar is 100 μm. Right panel: Cyst areas of the two RWPE1 cell samples were measured (n=60 cysts each condition) as described in supplementary materials and methods. The data are shown as average cyst area ± SD. Statistical significance was assessed using two-tailed Student’s t test. *** represents P < 0.0001. (F and G) Transient transfection (F) or lentivirus expression construct-mediated (G) overexpression of CEACAM21 enhance the migration and invasion of the tested PCa cell lines of 22Rv1, LNCaP and DuCaP (mean ± SEM of triplicate experiments). Error bars, ± SD of triplicate experiments. *P < 0.05, **P < 0.01, were assessed using two tailed Student’s t test. Accordingly, representative images of migration and invasion assays are shown. (H) Representative images of migration (upper panel) and invasion (lower panel) assays for RWPE1 cells infected with lenti control vector or CEACAM21 lenti expression constructs. Scale bars, 100 µm.
(A) CEACAM21 overexpression in the human immortalized prostatic epithelial RWPE1 cells. CEACAM21 protein expression was determined by western blot analysis. Lanes 1-3, lentivirus empty vector-transfected cells as experimental controls. Lanes 4-6, cells transfected with lentivirus vectors haboring CEACAM21. (B) Raw RPKM expression correlation among three biological replicates of controls and experiments, respectively, from RWPE1 RNA-seq data. (C) Heat maps for expression level of genes down- or upregulated by CEACAM21 overexpression in RWPE1 cells. The number of genes determined by RNA-seq (DESeq2, FDR < 0.01). (D) GSEA was performed on RNA-seq from RWPE1 cells with CEACAM21 overexpression by using the hallmark gene sets. Enrichment plot indicates elevated expression of MYC gene sets upon CEACAM21 overexpression in RWPE1 cells. (E) PCAT19 and (F) CEACAM21 mRNA expression were elevated in human prostate tumors than that in normal prostate gland. The P values were calculated using Mann-Whitney U-tests.
(A) rs11672691 enhancer activity was determined by the modified self-transcribing active regulatory region sequencing (STARR-seq) assays. (B and C) Prediction of the affinity of HOXA2 binding to the difference alleles of rs11672691 (B) and rs887391 (C). (D and E) Relative binding affinity of HOXA2 to the DNA sequences with rs11672691. In D, Error bars, ± SD of six replicate experiments. (F and J) ChIP-qPCR for HOXA9, HOXA13, HOXB13, AR, and HOXA10 chromatin binding at the rs11672691 containing region in 22Rv1 or VCaP cell lines. (K) ChIP followed by allele-specific quantitative PCR (qPCR) validation of overexpressed HOXA2 binding at rs11672691 in 22Rv1 cells. In F-K, Error bars, ± SEM of three technical replicates. NS, non-significant. *P < 0.05, **P < 0.01, ***P < 0.001, were assessed using two-tailed Student’s t test.
(A) The mRNA level of HOXA2 was induced upon DHT treatment in VCaP cells. (B) The number of 22Rv1 cells infected with control shRNA or HOXA2 shRNA in migration assays. (C and D) Representative images of migration (C) and invasion (D) assays for 22Rv1 cells infected with control and HOXA2 shRNA. Scale bars, 100 pm. Error bars, ± SEM from triplicate experiments. *P < 0.05, **P < 0.01, ***P < 0.001, P values were assessed using two-tailed Student’s t tests. (E and F) Multivariate analysis of the risk for BCR-free survival in a large cohort of PCa patients with the expression data of HOXA2 and other clinical variables. (G and H) In comparison with the data shown in Figure 3H, HOXA2 expression data shows no predictive values for biochemical recurrence in the patient group with Gleason Score 6 (low risk) or Gleason Score ≥8 (high risk).
(A and B) Knockdown of HOXB13 (shRNA) (A) or ERG (siRNAs) (B) in VCaP cells diminishes the mRNA levels of PCAT19 and CEACAM21. (C) Knockdown of HOXA10 in 22Rv1 cells has no effect on the mRNA levels of PCAT19 or CEACAM21. (D and E) DHT stimulation induces slight upregulation of PCAT19 (D) and obvious elevation of CEACAM21 mRNA levels (E) in VCaP cells. (F) The mRNA levels of CEACAM21 decreased upon knockdown of PCAT19 in VCaP cells. Error bars, ± SD from three technical replicates. *P < 0.05, **P < 0.01, ***P < 0.001, two-tailed Student’s t test. (G) The virtual 4C mode of the 3D Genome Browser reveals a strong interaction of the SNP rs11672691 (red line) with CEACAM21 region (the highest peak) in LNCaP. Here the remote chromatin interaction effect of SNP rs11672691 was explored by plotting the virtual 4C from LNCaP Hi-C data set (Wang et al., 2017). (H) 3C analysis of chromatin interactions between CEACAM21 and rs11672691 loci in 22Rv1 cells with or without shRNA-mediated depletion of PCAT19 expression. Graphic data shows the relative crosslinking frequencies of CEACAM21 promoter (anchor fragment) and the other cutting sites of EcoRI in this nearly 100 kb region (chr19:41982282-42079092) in 22Rv1 cells measured by 3C-qPCR. Data shown are mean ± SD of triplicate experiments.
(A and B) Multivariate analysis of the risk for BCR-free survival in a large cohort of PCa patients with the expression data of CEACAM21 (A) or PCAT19 (B) with additional clinical variables.