

Abstract
This paper describes the design, fabrication, and testing of a microfluidic sensor for dielectric spectroscopy (DS) of human whole blood during coagulation. The sensor, termed ClotChip, employs a three-dimensional (3D), parallel-plate, capacitive sensing structure with a floating electrode integrated into a microfluidic channel. Interfaced with an impedance analyzer, the ClotChip measures the complex relative dielectric permittivity, εr, of human whole blood in a frequency range of 40Hz to 100MHz. The temporal variation in the real part of the blood dielectric permittivity at 1MHz features a time to reach a permittivity peak, Tpeak, as well as a maximum change in permittivity after the peak, Δεr,max, as two distinct parameters of ClotChip readout. The ClotChip performance was benchmarked against rotational thromboelastometry (ROTEM) to evaluate the clinical utility of its readout parameters in capturing the clotting dynamics arising from coagulation factors and platelet activity. Tpeak exhibited a very strong positive correlation (r = 0.99, p < 0.0001) with the ROTEM clotting time (CT) parameter, whereas Δεr,max exhibited a strong positive correlation (r = 0.85, p < 0.001) with the ROTEM maximum clot firmness (MCF) parameter. This work demonstrates the ClotChip potential as a point-of-care (POC) platform to assess the complete hemostatic process using <10μL of human whole blood.
Keywords: Blood coagulation, capacitive sensor, dielectric coagulometry, dielectric spectroscopy, hemostasis, microfluidics, permittivity, point-of-care diagnostics, whole blood
I. Introduction
Timely characterization of the coagulation system and platelet function is a critical component of caring for patients who are severely injured (and hemorrhaging), undergoing surgery, or receiving antiplatelet/anticoagulant therapies. In these scenarios, physicians must make time-critical decisions on therapeutic management and transfusion practices, or to maintain safe anticoagulant levels [1]. Currently available conventional coagulation tests include the activated partial thromboplastin time (aPTT), prothrombin time (PT), and international normalized ratio (INR). These in-hospital tests are performed on blood plasma and require a central laboratory with trained personnel. However, access to specialized coagulation testing in a central laboratory is often limited in community hospitals as well as at point-of-injury in remote battlefield or civilian conditions, and the long delay associated with such tests means that results are obtained at time points much later than the onset of hemostatic imbalance.
On the other hand, several handheld, point-of-care (POC) coagulation devices are currently commercially available [2]. However, POC INR devices exhibit variable performance and are primarily limited to monitoring patients on warfarin anticoagulant therapy, while other devices have low thromboplastin and partial thromboplastin reagent sensitivity (e.g., i-STAT), resulting in only a crude snapshot of the coagulation process. Furthermore, no existing handheld, portable device can provide concurrent information on platelet function. Thromboelastography (TEG) and rotational thromboelastometry (ROTEM) are two viscoelastic whole blood assays that allow for the analysis of several aspects of clot formation and strength, representing a global measure of hemostasis. In fact, TEG and ROTEM can be used at the patient bedside, and are increasingly being utilized in the diagnosis and treatment of patients at high risk of bleeding, such as those undergoing cardiac surgery or suffering from trauma [3]–[6]. However, TEG and ROTEM are not easily miniaturized due to the presence of moving parts and require highly trained technical personnel. Additionally, their results are operator-dependent and prone to processing/sampling errors, and the mechanical force introduced by these assays can interfere with the natural coagulation process.
Recently, several microfabricated sensors have been developed for POC blood coagulation monitoring. Blood viscosity during coagulation can be measured by monitoring a frequency shift when the blood sample is in direct contact with a microfabricated resonant structure such as a magnetoelastic transducer [7], piezoelectric quartz crystal [8], thin-film bulk acoustic resonator [9], or microfabricated cantilever beam [10], [11]. In other devices, blood viscosity as well as platelet retraction forces are measured by using optical methods to monitor the deflection of microfabricated pillars in contact with blood during the coagulation process [12], [13]. Nonetheless, the force applied when blood is in direct contact with a mechanical transducer can potentially interfere with the natural coagulation process. Non-contact methods have also been developed; however, they require the use of discrete ultrasonic transducers [14] or laser illumination and optical microscopy [15], and require a blood sample volume of 100μL to 1mL.
In contrast, dielectric spectroscopy (DS) is a fully electrical, label-free, and nondestructive measurement technique that can enable a simple and easy-to-use POC device for extracting information on the physiologic properties of blood in real time. DS is the quantitative measurement of the complex relative dielectric permittivity, εr, of a material-under-test (MUT) versus frequency, and is a well-established method to study the molecular and cellular composition of a variety of biomaterials [16], [17]. The main DS response of blood in the MHz-frequency range is characterized as a dispersion region that arises from the interfacial polarization of cellular components [18], [19]. In fact, DS in the MHz-range has been previously used to determine the properties of blood cellular components [20], [21] and, in particular, is shown to be sensitive to red blood cell (RBC) aggregation and deformation [22]–[24], two critical processes involved in blood coagulation [25]. DS to assess the blood coagulation process is termed dielectric coagulometry, and while early work on dielectric coagulometry revealed sensitivity to both clotting time and platelet activity [26]–[28], this technique has been restricted to studies using laboratory-based benchtop measurement equipment and >100μL-volume samples [29]-[31].
In this paper, we present a novel microsensor, termed ClotChip, to perform dielectric coagulometry measurements in a low-cost and disposable microfluidic channel using <10μL of whole blood. We have expanded our previous work [32], [33] by performing controlled experiments with healthy human whole blood samples that are modified in vitro with various activators and inhibitors of the coagulation process. We then examine the ClotChip readout, defined as the normalized real part of the blood permittivity at 1MHz, and evaluate two distinct parameters of the ClotChip readout that are sensitive to two different aspects of the coagulation process. Specifically, the time to reach a peak in permittivity is shown to be sensitive to coagulation time (i.e., time for a fibrin clot to form), and the maximum change in permittivity after the peak is shown to be sensitive to platelet activity. This is accomplished by demonstrating a strong positive correlation between the ClotChip readout parameters and clinically relevant diagnostic parameters of ROTEM.
A dielectric microsensor that can extract distinct information pertaining to abnormalities of the coagulation process, arising from coagulation factors or platelet activity, from a single drop of whole blood paves the way for developing a handheld instrument, as conceptually illustrated in Fig. 1, to rapidly provide a comprehensive diagnostic profile of hemostatic defects at the POC.
Fig. 1.
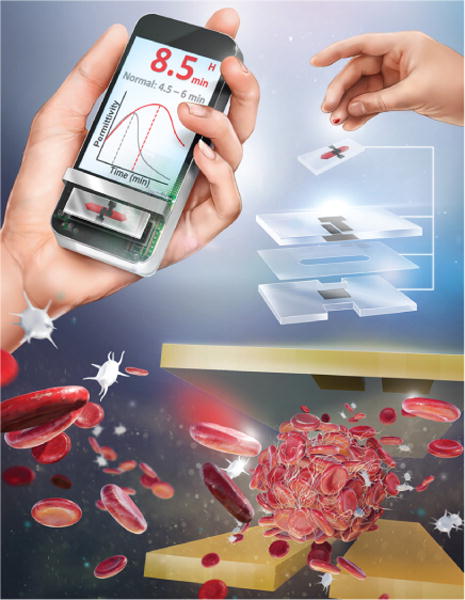
Conceptual illustration of a POC dielectric coagulometer utilizing the proposed ClotChip microfluidic sensor.
The paper is organized as follows. Section II describes the analysis, design, and fabrication of the ClotChip sensor along with the experimental methods. Section III presents our results from controlled experiments with healthy human whole blood samples, showcasing the ClotChip utility in assessing the blood coagulation time and platelet activity. Finally, Section IV draws some conclusions from this work.
II. Sensor Design and Methods
A. ClotChip Design and Analysis
A novel, microfluidic, dielectric sensor with a parallel-plate capacitive sensing structure has been developed, as illustrated in Fig. 2A. A microfluidic channel separates a pair of planar sensing electrodes from a floating electrode to form two three-dimensional (3D) capacitive sensing areas that are connected in series through the floating electrode. As the MUT passes through this capacitive sensing area, the sensor impedance changes based on the dielectric permittivity of the MUT. At the measurement frequency, ω, the complex impedance, ZS, of the capacitive sensing area can be expressed as [34]:
| (1) |
where C0 is the nominal, series-connected, air-gap capacitance of the parallel-plate capacitive sensing area. and are the real and imaginary parts, respectively, of εr of the MUT and can be calculated from the measurements of ZS using:
| (2) |
and
| (3) |
The permittivity of human whole blood in a microfluidic dielectric sensor exhibits several distinct frequency-dependent regions. For frequencies below a few hundreds of kHz, is dominated by the impedance of the capacitive double-layer (CDL) that forms at the electrode-solution interface and is primarily due to the blood ionic content. The CDL is also known to be influenced by other factors, including the electrode geometry and material, surface roughness, and temperature, which are unrelated to the biological properties of blood, and might exhibit a time-dependent drift. Therefore, measurements within a CDL-dominated frequency range may be affected by factors not related to the blood coagulation process. On the other hand, exhibits a characteristic dispersion region from a few hundreds of kHz to a few tens of MHz that arises from the interfacial polarization between the suspended RBCs and the surrounding conducting medium (plasma). Measurements of within this range are sensitive to the RBC shape and aggregation. Moreover, measurements of at 100MHz and above are close to the permittivity of water and are thus insensitive to the effects of RBC interfacial polarization. Finally, is dominated by a combination of the CDL effect and the bulk solution conductivity of blood over the entire frequency range. A detailed analysis of εr for human whole blood in a microfluidic dielectric sensor and a corresponding circuit model is previously reported in [34]. In this work, we aim to capture the blood coagulation dynamics, including aggregation of RBCs in a fibrin clot and their subsequent shape change as a result of contractile forces from activated platelets. Hence, measurements of ZS are performed over the frequency range of 40Hz to 100MHz to capture the complete frequency-dependent characteristics of , including the dispersion region attributed to the RBC interfacial polarization. The time course of variation in can then be analyzed for blood coagulation monitoring.
Fig. 2.
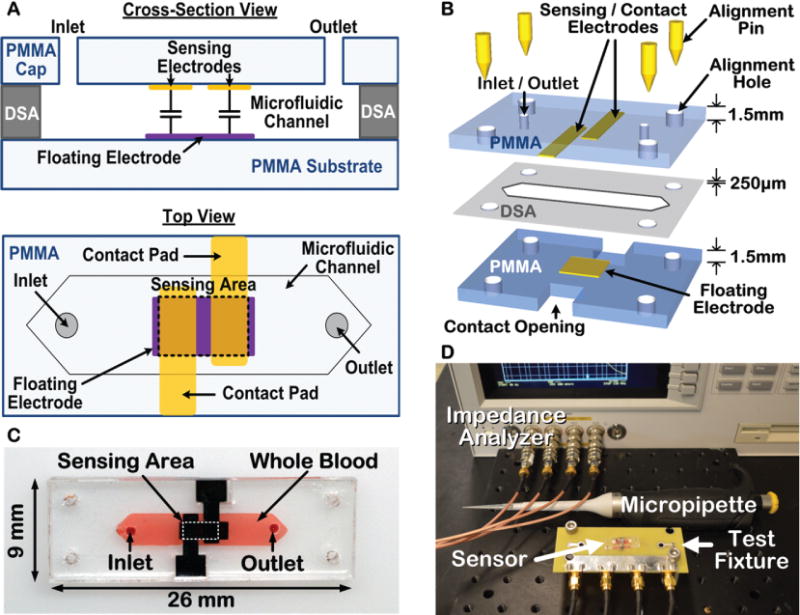
Illustration of the ClotChip design and fabrication steps along with the experimental setup. A) Cross-sectional and top views of the ClotChip. B) ClotChip fabrication and assembly procedure. C) Photograph of the fabricated ClotChip loaded with human whole blood as the MUT. D) Photograph of the testing setup.
B. ClotChip Fabrication and Assembly
Dielectric coagulometry measurements with human whole blood were first performed using a first-generation (Gen-1) ClotChip that was based on a commercially available printed-circuit board (PCB) for the substrate and sensing electrodes, as previously reported in [32], [34]. To minimize the potential for artificial contact activation of the coagulation process, we subsequently manufactured a second-generation (Gen-2) ClotChip that was based on a biocompatible, chemically inert, polymethyl methacrylate (PMMA) plastic substrate and cap [33]. The Gen-2 sensor fabrication and assembly process, as shown in Fig. 2B, was based on a low-cost (< $1 material cost per chip) batch-fabrication method of screen-printing gold electrodes onto PMMA plastic material. Screen-printing is a low-temperature fabrication method suitable for biocompatible plastic materials that does not require a cleanroom or advanced microfabrication facilities. A 1.5mm-thick PMMA substrate was first cleaned using diluted ethyl alcohol. Gold sensing electrodes (3.5mm × 1.3mm with spacing of 0.5mm) and a floating electrode (4mm × 1.5mm) were screen-printed onto the PMMA material using gold ink (E4464, Ercon Inc, Wareham, MA) and then cured in an oven at 110°C for 15 minutes. The PMMA material was then laser micromachined (Versa Laser, Scottsdale, AZ) to form the substrate and microfluidic cap. A microfluidic channel with dimensions of 12mm × 3mm was formed by laser micromachining of a double-sided-adhesive (DSA) film and attaching the PMMA cap to the PMMA substrate using the DSA film. The DSA film had a thickness of 250μm that defined the microfluidic channel height. The Gen-2 ClotChip had a total sample volume of 9μL, which is less than the volume of blood obtained by a finger stick. For all tests, a micropipette was used to inject a sample into the microfluidic channel of the ClotChip through inlet/outlet holes in the PMMA cap. Fig. 2C shows a picture of the fabricated sensor prototype loaded with human whole blood as the MUT. As seen in Fig. 2D, measurements with an impedance analyzer (Agilent 4294A, Santa Clara, CA) were performed using 1m-long 4-terminal extension cables and a custom PCB test fixture that included spring-loaded contact pins to provide a plug-and-play-type connection between the sensor contact pads and measurement equipment. All sensor measurements were corrected for parasitic impedances contributed by the cables and the test fixture via calibration with standard impedances applied to the contact pins.
C. ClotChip Calibration
The ClotChip was calibrated using five reference materials: 20% isopropyl alcohol (IPA) in de-ionized (DI) water, 5% IPA in DI water, 2.5% IPA in DI water, 20% ethanol in DI water, and 10% ethanol in DI water. A commercial dielectric probe kit (Agilent 85070E, Santa Clara, CA) was first used to obtain a reference permittivity for each material. Next, the ZS parameter of the sensor loaded with each reference material was measured using the impedance analyzer. A linear least-squares fit between of the reference materials and ZS parameter of the sensor loaded with the reference materials was performed based on (2) to find C0. The calibration procedure was performed for five frequencies in 14–100MHz, and C0 was found to be frequency-independent with a value of 25fF ± 0.07fF for Gen-1 ClotChip and 42.8fF ± 0.86fF for Gen-2 ClotChip. After this one-time calibration was complete, additional sensors were tested without any further calibration, and of the blood sample in the microfluidic channel was obtained from the sensor impedance measurements using (2).
D. Testing with Human Whole Blood Samples
De-identified, healthy, human whole blood samples were obtained from Research Blood Components, LLC (Brighton, MA) and the Hematopoietic Biorepository and Cellular Therapy Core at Case Western Reserve University under an institutional review board (IRB)-approved protocol. Following the guidelines of the Clinical and Laboratory Standards Institute for blood coagulation testing [35], all blood samples were collected in standard vacutainer tubes containing 3.2% sodium citrate anticoagulant. In some tests, the samples were treated in vitro to modulate the coagulation time or platelet activity, as described further in Section III.
E. Assessment of Blood Coagulation Using ClotChip
A heating chamber (Thermotron, Holland, MI) was used to keep the experimental setup at 37°C. After pipetting 25.6μL of 250mM CaCl2 in 300μL of citrated blood sample, 9μL of the mixture was immediately injected into the microfluidic channel of the ClotChip. Excess blood at the inlet/outlet ports was wiped, and the ports were sealed using an adhesive tape to prevent dehydration of the sample. The impedance analyzer was used to measure the ZS parameter of the sensor over a frequency range of 40Hz to 100MHz. These measurements were performed every 30 seconds over 30 minutes.
F. Assessment of Blood Coagulation Using ROTEM
To determine the correlative power of ClotChip to an existing, clinically relevant, whole blood assay of global hemostasis, we carried out studies with the ClotChip and subjected the sample to concurrent ROTEM measurements. In ROTEM measurements, a pin is suspended into a whole blood sample by a torsion wire. The pin rotates within a stationary cup containing the blood sample, and the deflection of the pin is optically measured to determine the viscoelastic properties of blood as it clots [36]. The ROTEM readout is defined as the deflection of the pin (in mm) and can be used to obtain important information on all stages of the coagulation process. The ROTEM clotting time (CT) parameter is the time from the start of the measurement to the initial detection of clot formation as determined when the ROTEM readout reaches an amplitude of 2mm. The ROTEM maximum clot firmness (MCF) parameter is the maximum amplitude of the ROTEM readout, which is a measure of clot stability that is influenced by platelet activity. We therefore chose to compare the ClotChip readout to the ROTEM CT and MCF parameters that provide distinct information on coagulation time and platelet activity, respectively. The ROTEM measurements were performed on a quad-channel computerized device (ROTEM Delta TEM International, Munich, Germany). Citrated whole blood samples were warmed to 37°C and then 300μL of each sample was placed in a disposable cuvette using an electronic pipette. Blood samples were re-calcified with 20μL of 0.2M CaCl2 prior to the start of the measurement. All pipetting and mixing steps were performed in a standardized way by following an automated electronic pipette program. Each ROTEM measurement lasted 60 minutes and was performed within 2 hours of the time of blood collection, as recommended in [37]. Hence, only two tests were conducted on a given blood sample for all ROTEM measurements.
G. Statistical Analysis
The data obtained in this study are reported as mean ± standard deviation unless stated otherwise. The data were analyzed using analysis of variance (ANOVA) with Tukey’s post hoc test for multiple comparisons, with the statistical significance threshold set at 95% confidence level for all tests (p < 0.05). Statistical analyses were performed with Minitab 17 (Minitab, State College, PA) and GraphPad Prism (GraphPad Software, La Jolla, CA) software suites. Pearson’s correlation was used to obtain correlative statistics between the ClotChip readout parameters and ROTEM parameters.
III. Measurement Results and Discussion
A. Variation in of Human Whole Blood versus Time and Frequency during Coagulation
The surface plot in Fig. 3A shows the variation in over time and frequency for human whole blood (supplemented with sodium citrate as anticoagulant) upon addition of CaCl2 to initiate coagulation. The readouts were obtained by the Gen-1 ClotChip and normalized to the permittivity values at the start of the experiment (i.e., t = 0). An increase in the normalized permittivity was observed in the dispersion region (~ 500kHz to 50MHz), with the maximum rise occurring around 1MHz followed by a fall in permittivity values. The frequency point at which the normalized permittivity exhibited the highest value was obtained for all the CaCl2-treated blood samples, and is referred to as the peak frequency herein.
Fig. 3.
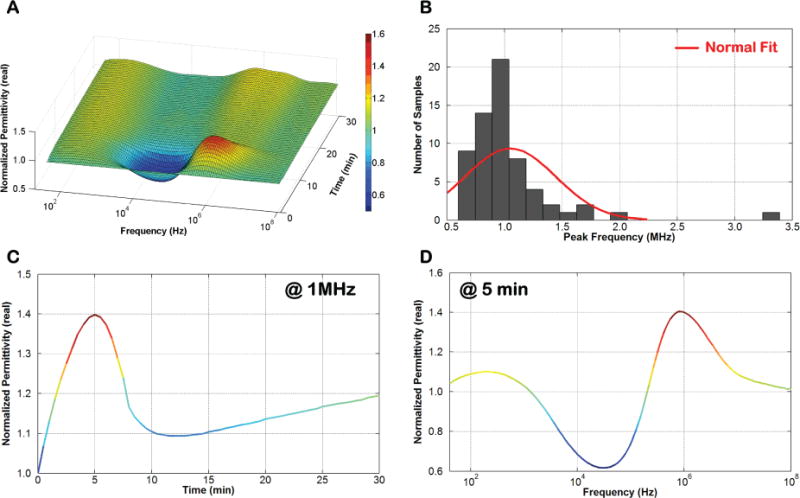
Variation in of blood during coagulation. A) Surface plot of the variation in of human whole blood versus time and frequency. B) Histogram plot of the peak frequency for all tested blood samples. C) 2D slice of the surface plot showing variation in versus time at 1MHz. D) 2D slice of the surface plot showing variation in versus frequency at 5 minutes.
A histogram of all the peak frequency values is plotted in Fig. 3B, demonstrating that the majority of the blood samples exhibited a peak frequency around 1MHz. Subsequently, the frequency point of 1MHz was selected to capture the temporal variation in normalized permittivity of a given blood sample in order to provide an estimate of its coagulation time. Fig. 3C depicts a 2D slice of the surface plot, showing the temporal variation in normalized permittivity at 1MHz, whereas Fig. 3D depicts another slice of the surface plot, showing variation in normalized permittivity versus frequency at t = 5 minutes.
Fig. 4 shows the temporal variation in at 1MHz for another CaCl2-treated human whole blood sample undergoing coagulation in the ClotChip. Similar to Fig. 3C, the plot (blue diamond) revealed a permittivity peak at around t = 4.5 minutes, referred to as Tpeak herein, which was taken to be indicative of the coagulation time. The coagulation time was also independently assessed visually by periodically dipping a micropipette tip every two minutes in a polypropylene tube containing the same blood sample, and was observed to be around 6 minutes [32]. The same blood sample was also tested in the ClotChip without re-calcification, as a control measurement in which blood coagulation did not occur. The second plot (black square) in Fig. 4 shows the temporal variation in for the anticoagulated blood sample without CaCl2 treatment (i.e., control). No permittivity peak was observed in the control blood sample. Furthermore, visual observation of the sample also revealed no clot formation even after an hour of monitoring. Collectively, these results showed that the ClotChip Tpeak parameter was a plausible surrogate for the coagulation time.
Fig. 4.
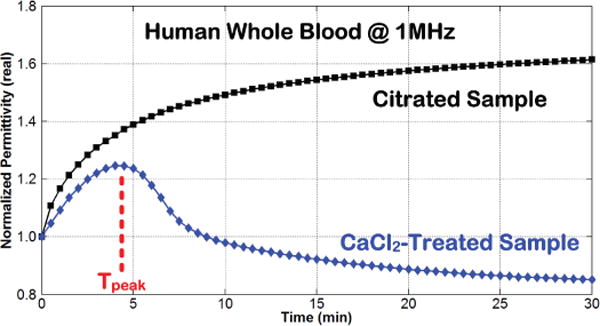
Time course of variation in at 1MHz for human whole blood without (black square) and with (blue diamond) coagulation initiated by the addition of CaCl2 to a citrated (anticoagulated) blood sample [32].
B. Variation in Coagulation Time with Temperature
Earlier studies have shown that temperature variation causes a change in the blood coagulation time [38]. In this study, the ambient temperature was changed and its effect on the coagulation time of a CaCl2-treated whole blood sample (supplemented with sodium citrate as anticoagulant) was investigated. Following temperature equilibration and addition of 250mM CaCl2, the blood sample was injected into the ClotChip, and the temporal variation in its was recorded for 30 minutes at four different temperatures of 25°C, 31°C, 37°C, and 43°C, as shown in Fig. 5A. The experiments were repeated using the same blood sample in a polypropylene tube kept at the same temperature for visual observation of the coagulation time. Fig. 5B shows the mean coagulation times of human whole blood at each temperature obtained with the ClotChip as well as with visual observation of the sample. The Tukey’s HSD test was performed, which indicated a statistically significant change in coagulation time versus temperature for both the ClotChip and visual observation-based procedure. Interestingly, the test also indicated that the ClotChip was capable of detecting a statistically significant change in the coagulation time between 31°C and 43°C, which was not detectable by visual observation alone. Fig. 5C shows a plot of the ClotChip readout of the coagulation time (i.e., Tpeak) versus temperature, illustrating a power relationship between the two parameters. Such a relationship has also been previously shown using standard laboratory assays (PT) to measure the effect of temperature on the plasma coagulation time [39]. Furthermore, these findings were also in agreement with previous reports, which stated that decreasing the temperature results in reduction of enzyme activity and platelet function as well as dysregulation of clotting factors, thereby prolonging the blood coagulation time [40]. The absence of statistically significant change in the coagulation time between 31°C and 37°C in Fig. 5B was also in agreement with previous reports, which stated that both platelet function and enzyme activity are only slightly reduced in the mild hypothermic range (~ 33°C to 37°C) and vary significantly only when the temperature is much lower than that [41]-[43].
Fig. 5.
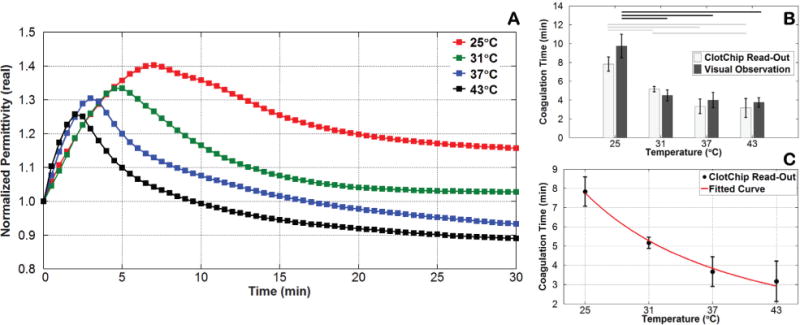
Variation in coagulation time induced by a change in temperature. A) Time course of variation in at 1MHz for CaCl2-treated human whole blood at various temperatures. B) Bar graph comparing the ClotChip readout parameter Tpeak versus visual observation-based readings of the coagulation time for various temperatures. Horizontal lines indicate statistically significant difference in coagulation time at different temperatures (p < 0.05). C) Fitted curve to the ClotChip readout parameter Tpeak showing a power relationship between the coagulation time and temperature (R2 = 0.8876). Error bars represent the standard deviation of measurements run in triplicate for each temperature.
C. Variation in Coagulation Time with CaCl2 Concentration
Earlier studies have also reported that the presence of free Ca2+ ions is necessary for the blood coagulation process to initiate [44]. As stated previously, to prevent immediate commencement of this process, whole blood was collected in tubes coated with 3.2% sodium citrate anticoagulant, where the citrate acted as a chelating agent by binding with the calcium present in the blood (ratio of blood to anticoagulant = 9:1). To mimic blood coagulation in vitro, CaCl2 was then added to the citrated blood so that there would be an excess of Ca2+ ions to initiate blood coagulation [45]. The effect of varying the CaCl2 concentration on the coagulation time was further investigated in this study.
Following temperature equilibration at 37°C, the citrated blood sample was treated with CaCl2 solution at 30mM, 40mM, 50mM, and 250mM concentrations, and the temporal variation in was subsequently recorded for 30 minutes by the ClotChip. The experiments were repeated using the same blood sample in a polypropylene tube and at the same CaCl2 concentration for visual observation of the coagulation time. Fig. 6A shows the mean coagulation times of human whole blood at each CaCl2 concentration obtained with the ClotChip as well as with visual observation of the sample. Similar to the temperature studies, the Tukey’s HSD test indicated a statistically significant change in coagulation time versus CaCl2 concentration for both the ClotChip and visual observation-based procedure. In fact, these measurements revealed that the ClotChip was capable of detecting a statistically significant change in the coagulation time between CaCl2 concentrations of 30mM and 40mM, in contrast to visual observation alone. Fig. 6B depicts a plot of the ClotChip readout of the coagulation time (i.e., Tpeak) versus CaCl2 concentration, illustrating a power relationship between the two parameters. Such a relationship has been previously reported between the coagulation time of citrated human plasma and concentration of free Ca2+ ions added to plasma [46]. With lower CaCl2 concentrations of 10mM and 20mM, no coagulation was observed even after 30 minutes of visual observation. At such low concentrations of CaCl2, a relatively small number of free Ca2+ ions were added into the citrated whole blood sample, and hence the coagulation was very weak and not observable. As the CaCl2 concentration was increased beyond 30mM, the coagulation time rapidly decreased until it reached a value of around 5 minutes at a concentration of 50mM. Increasing the CaCl2 concentration beyond this point had little effect on the coagulation time.
Fig. 6.
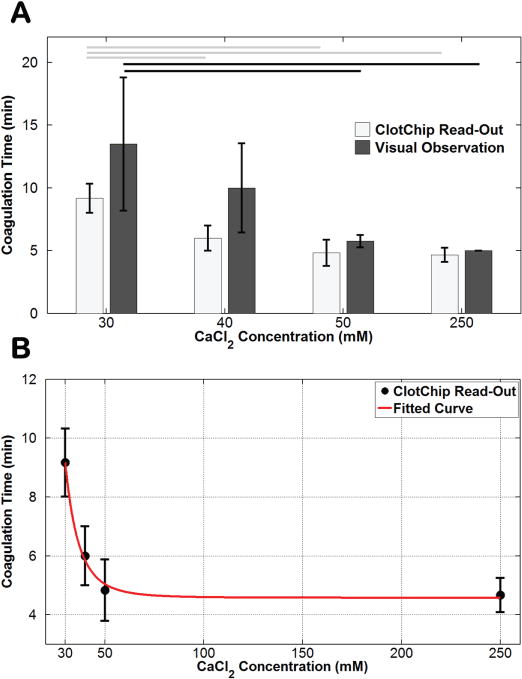
Variation in coagulation time induced by changes in CaCl2 concentration. A) Bar graph comparing the ClotChip readout parameter Tpeak versus visual observation-based readings of the coagulation time for various CaCl2 concentrations. Horizontal lines indicate statistically significant difference in coagulation time at different concentrations (p < 0.05). B) Fitted curve to the ClotChip readout parameter Tpeak showing a power relationship between the coagulation time and CaCl2 concentration (R2 = 0.8344). Error bars represent the standard deviation of measurements run in triplicate for each CaCl2 concentration.
D. ClotChip Response to Coagulation Defects via Thrombin Inhibition and Comparison to ROTEM CT Parameter
Human whole blood samples from three healthy volunteers were subjected to in vitro treatment for modulating the ClotChip Tpeak and ROTEM CT parameters. Argatroban is a direct thrombin inhibitor that can function as an antithrombotic agent even in the absence of any other cofactors. Its selective inhibitory mechanism enables Argatroban to block both circulating and clot-bound thrombin, thereby increasing the coagulation time [47]. On the other hand, thrombin is a strong pro-coagulant agent that accelerates clot formation. Thrombin has multiple functions in the blood coagulation process, including activation of platelets through their thrombin receptors, enhancing the conversion of fibrinogen into fibrin, and activation of factors V, VIII, XI, and XIII [48], [49]. Each blood sample was therefore tested as untreated, treated with Argatroban (Sellcheck, Houston, TX) with a final Argatroban concentration of 5μM or 10μM, or treated with human gamma thrombin (Enzyme Research Laboratories, South Bend, IN) with a final thrombin concentration of 150pM or 300pM. Blood samples treated with Argatroban were incubated for an additional 15 minutes at 37°C before adding CaCl2, whereas no such additional incubation time was used with the thrombin-treated samples.
The Gen-2 ClotChip was utilized for these studies in which the Tpeak parameter of the ClotChip readout was compared against the ROTEM CT parameter. Fig. 7A shows the temporal variation in at 1MHz for an untreated, anti-thrombin-treated (final Argatroban concentration of 10μM), and thrombin-treated (final thrombin concentration of 150pM) human whole blood sample from one of the healthy volunteers. As compared to the untreated sample, for which the ClotChip Tpeak parameter was found to be 330s ± 30s, the ClotChip readout exhibited a prolonged Tpeak of 1,440s ± 120s for the anti-thrombin-treated sample. On the other hand, Tpeak was shortened to 45s ± 15s for the thrombin-treated sample.
Fig. 7.
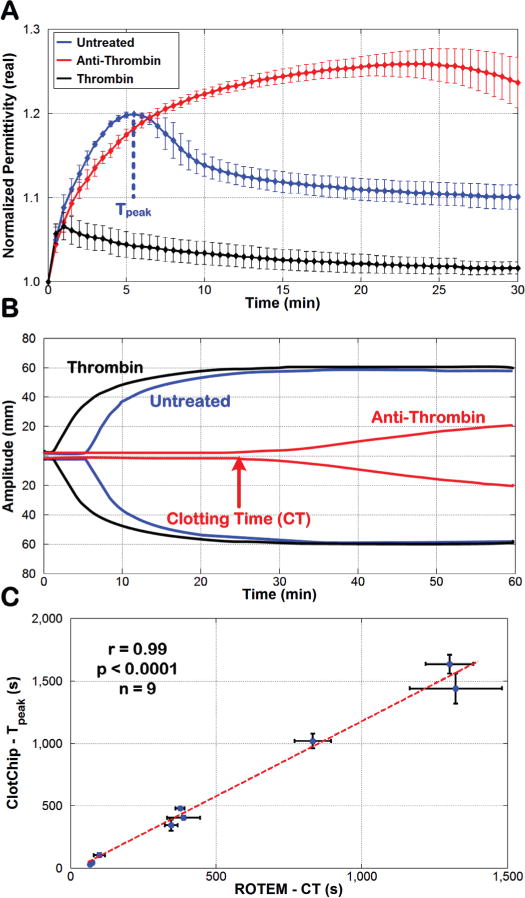
Comparison of ClotChip Tpeak and ROTEM CT parameters. A) Time course of variation in at 1MHz for an untreated whole blood sample and for the same sample treated with anti-thrombin as well as thrombin. B) ROTEM profiles obtained for the three blood samples used in Fig. 7A. The arrow shows the clotting time (CT) of the anti-thrombin-treated blood sample, defined as the time taken for the ROTEM profile to reach an amplitude of 2mm. C) A very strong positive correlation (r = 0.99, p < 0.0001, n = 9) was observed between the ClotChip Tpeak and ROTEM CT parameters. For all plots, error bars indicate duplicate measurements and are presented as mean ± standard error of the mean (SEM).
Fig. 7B shows the corresponding ROTEM readouts for the same three blood samples in Fig. 7A that are overlaid on top of each other. The ROTEM CT parameter for the untreated sample was recorded as 346s ± 22s. Similar to the ClotChip results, the ROTEM recorded the longest CT (1,328s ± 163s) for the anti-thrombin-treated sample and the shortest CT (75s ± 5s) for the thrombin-treated sample.
Next, results from all nine untreated, anti-thrombin-treated, and thrombin-treated whole blood samples were used to assess the correlative power of the ClotChip Tpeak parameter to the ROTEM CT parameter. As shown in Fig. 7C, Tpeak exhibited a very strong positive correlation (r = 0.99, p < 0.0001) to the ROTEM CT parameter. The latter is a clinically important indicator of a patient’s coagulation status and is prolonged in patients with clotting factor deficiencies or on anticoagulant therapy. Hence, the strong correlation between Tpeak and CT parameters shows the ClotChip potential to provide clinically important information on a patient’s coagulation status.
E. ClotChip Response to Platelet Activity Inhibition and Comparison to ROTEM MCF Parameter
To investigate the effect of platelet activity inhibition on the ClotChip measurements, human whole blood samples from four healthy volunteers were subjected to in vitro treatment with cytochalasin D (CyD) with various final concentrations in the range of 0μM (i.e., untreated) to 10μM. CyD is a potent inhibitor of actin polymerization and hence inhibits platelet activation and hemostatic function [50], [51]. Blood samples from three volunteers were treated with three different CyD concentrations, whereas the sample from the remaining volunteer was treated with four different CyD concentrations, resulting in a total of 13 blood samples. All samples were re-calcified with CaCl2 prior to measurements with the Gen-2 ClotChip and ROTEM.
Fig. 8A shows the temporal variation in at 1MHz for three samples with final CyD concentrations of 0μM, 2.5μM, and 10μM. As can be seen, for increased concentrations of CyD (i.e., an increased effect of platelet activity inhibition), the ClotChip readout exhibited a decreased Δεr,max parameter, which was defined as one minus the ratio of final permittivity (i.e., permittivity at 30 minutes) and peak permittivity (i.e., permittivity at Tpeak). This showed that the ClotChip Δεr,max parameter was sensitive at measuring platelet function.
Fig. 8.
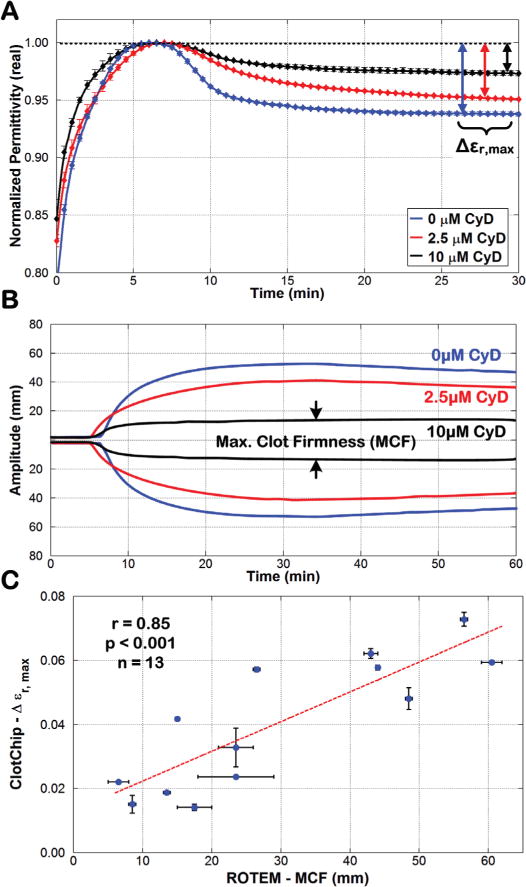
Comparison of ClotChip Δεr,max and ROTEM MCF parameters. A) Time course of variation in at 1MHz for an untreated whole blood sample (CyD concentration of 0μM) and for the same sample treated with CyD concentrations of 2.5μM and 10μM. B) ROTEM profiles obtained for the three blood samples used in Fig. 8A. The arrows show the maximum clot firmness (MCF) of the 10μM-CyD-treated blood sample. C) A strong positive correlation (r = 0.85, p < 0.001, n = 13) was observed between the ClotChip Δεr,max and ROTEM MCF parameters. For all plots, error bars indicate duplicate measurements and are presented as mean ± SEM.
Fig. 8B shows the corresponding ROTEM readouts for the same three blood samples in Fig. 8A that are overlaid on top of each other. The addition of CyD significantly reduced the ROTEM MCF parameter, with blood samples with higher CyD concentrations recording lower MCF values. Finally, all thirteen whole blood samples were used to assess the correlative power of the ClotChip Δεr,max parameter to the ROTEM MCF parameter. As shown in Fig. 8C, Δεr,max exhibited a strong positive correlation (r = 0.85, p < 0.001) to the ROTEM MCF parameter.
The results of all these experiments establish that the ClotChip readout is sensitive to multiple components of the hemostatic process and can provide a discriminatory readout of coagulation time and platelet activity through two independent readout parameters. Furthermore, strong positive correlation of the ClotChip readout parameters to those of ROTEM demonstrates that monitoring the time course of variation in blood dielectric permittivity at 1MHz during the coagulation process has the potential to provide clinically important information on the complete hemostatic process from a single drop of whole blood on a single disposable sensor. Unlike ROTEM, the ClotChip does not require sensitive mechanical components to interact with the blood sample. Leveraging the fully electrical technique of DS, the ClotChip can ultimately be developed into a small-sized, handheld platform for POC assessment of hemostasis.
IV. Conclusion
This paper reported on the design, fabrication, and testing of a low-cost, microfluidic, capacitive sensor, termed ClotChip, for the analysis of blood coagulation process. The sensor was shown to measure the real part of the complex relative dielectric permittivity of human whole blood in a frequency range of 40Hz to 100MHz, and to provide a readout of the blood coagulation process from the temporal variation in dielectric permittivity at 1MHz using <10μL of blood sample volume. Two independent parameters of the ClotChip readout, Tpeak and Δεr,max, were shown to provide distinct information related to the coagulation time and platelet activity, respectively. Further evaluation of the ClotChip readout and its comparison to the clinically important ROTEM assay revealed a very strong positive correlation (r = 0.99, p < 0.0001) between the ClotChip Tpeak and the ROTEM CT parameters, and a strong positive correlation (r = 0.85, p < 0.001) between the ClotChip Δεr,max and the ROTEM MCF parameters. The ClotChip holds potential to be a truly low-cost, small-sized, disposable microfluidic sensor that enables rapid and comprehensive diagnosis of blood coagulation and platelet defects at the POC. Our future work will focus on the clinical evaluation of the ClotChip with blood samples from patients with coagulation and platelet defects, as well as patients on antiplatelet/anticoagulant therapies.
Acknowledgments
The authors would like to thank Grace Gongaware, MIM Software, Beachwood, OH for illustrating Fig. 1.
This work was supported by the Case School of Engineering’s San Diego-based Wireless Health program, the Case-Coulter Translational Research Partnership, and the Advanced Platform Technology (APT) Center – A Veterans Affairs (VA) Research Center of Excellence at Case Western Reserve University.
Footnotes
Conflict Of Interests Disclosure
Debnath Maji, Michael Suster, Umut Gurkan, Evi Stavrou, and Pedram Mohseni are inventors of intellectual property related to the ClotChip that has been licensed by Case Western Reserve University to XaTek, Inc., Cleveland, OH.
Contributor Information
Debnath Maji, Electrical Engineering and Computer Science Dept, Case Western Reserve University, Cleveland, OH, USA.
Michael Suster, Electrical Engineering and Computer Science Dept, Case Western Reserve University, Cleveland, OH, USA.
Erdem Kucukal, Mechanical and Aerospace Engineering Dept, Case Western Reserve University, Cleveland, OH, USA.
Ujjal Sekhon, Biomedical Engineering Dept, Case Western Reserve University, Cleveland, OH, USA.
Anirban Sen Gupta, Biomedical Engineering Dept, Case Western Reserve University, Cleveland, OH, USA.
Umut Gurkan, Mechanical and Aerospace Engineering Dept, Case Western Reserve University, Cleveland, OH, USA.
Evi Stavrou, Division of Hematology/Oncology, Dept of Medicine, Case Western Reserve University, Cleveland, OH, USA; Division of Hematology/Oncology, Louis Stokes Cleveland Dept of Veterans Affairs Medical Center, Cleveland, OH, USA.
Pedram Mohseni, Electrical Engineering and Computer Science Dept, Case Western Reserve University, Cleveland, OH, USA.
References
- 1.Gonzalez E, et al. Trauma-induced coagulopathy: An institution’s 35 year perspective on practice and research. Scandinavian J Surgery. 2014 Jun;103(2):89–103. doi: 10.1177/1457496914531927. [DOI] [PMC free article] [PubMed] [Google Scholar]
- 2.Harris L, Castro-López V, Killard A. Coagulation monitoring devices: past, present, and future at the point-of-care. TrAC Trends in Analytical Chemistry. 2013;50:85–95. [Google Scholar]
- 3.Schöchl H, et al. Goal-directed coagulation management of major trauma patients using thromboelastometry (ROTEM)-guided administration of fibrinogen concentrate and prothrombin complex concentrate. Critical Care. 2010;14(2):R55. doi: 10.1186/cc8948. [DOI] [PMC free article] [PubMed] [Google Scholar]
- 4.Eastridge B, et al. Death on the battlefield (2001–2011) J Trauma and Acute Care Surgery. 2012;73:S431–S437. doi: 10.1097/TA.0b013e3182755dcc. [DOI] [PubMed] [Google Scholar]
- 5.da Luz LT, Nascimento B, Rizoli S. Thromboelastography (TEG): practical considerations on its clinical use in trauma resuscitation. Scandinavian J Trauma, Resuscitation and Emergency Medicine. 2013;21(1):1–8. doi: 10.1186/1757-7241-21-29. [DOI] [PMC free article] [PubMed] [Google Scholar]
- 6.Karon BS. Why is everyone so excited about thromboelastography (TEG)? Clinica Chimica Acta. 2014 Sep;436:143–148. doi: 10.1016/j.cca.2014.05.013. [DOI] [PubMed] [Google Scholar]
- 7.Puckett LG, et al. Magnetoelastic transducers for monitoring coagulation, clot inhibition, and fibrinolysis. Biosensors Bioelectronics. 2005 Mar;20(9):1737–1743. doi: 10.1016/j.bios.2004.06.051. [DOI] [PubMed] [Google Scholar]
- 8.Müller L, et al. Investigation of prothrombin time in human whole-blood samples with a quartz crystal biosensor. Anal Chem. 2010 Jan;82(2):658–663. doi: 10.1021/ac9021117. [DOI] [PubMed] [Google Scholar]
- 9.Xu W, Appel J, Chae J. Real-time monitoring of whole blood coagulation using a microfabricated contour-mode film bulk acoustic resonator. J Microelectromech Syst. 2012 Apr;21(2):302–307. [Google Scholar]
- 10.Djakov V, Huq E, Vernon P. Fluid probe. 2013 Dec 17; US8607619 B2. [Google Scholar]
- 11.Cakmak O, et al. A cartridge-based sensor array platform for multiple coagulation measurements from plasma. Lab Chip. 2015;15(1):113–120. doi: 10.1039/c4lc00809j. [DOI] [PubMed] [Google Scholar]
- 12.Judith RM, et al. Micro-elastometry on whole blood clots using actuated surface-attached posts (ASAPs) Lab Chip. 2015;15(5):1385–1393. doi: 10.1039/c4lc01478b. [DOI] [PMC free article] [PubMed] [Google Scholar]
- 13.Liang XM, et al. Platelet retraction force measurements using flexible post force sensors. Lab Chip. 2010;10(8):991–998. doi: 10.1039/b918719g. [DOI] [PMC free article] [PubMed] [Google Scholar]
- 14.Viola F, et al. A novel ultrasound-based method to evaluate hemostatic function of whole blood. Clinica Chimica Acta. 2010 Jan;411(1–2):106–113. doi: 10.1016/j.cca.2009.10.017. [DOI] [PMC free article] [PubMed] [Google Scholar]
- 15.Tripathi MM, Hajjarian Z, Van Cott EM, Nadkarni SK. Assessing blood coagulation status with laser speckle rheology. Biomed Optics Express. 2014 Mar;5(3):817–831. doi: 10.1364/BOE.5.000817. [DOI] [PMC free article] [PubMed] [Google Scholar]
- 16.Kaatze U, Feldman Y. Broadband dielectric spectrometry of liquids and biosystems. Meas Sci Technol. 2006;17:R17–R35. [Google Scholar]
- 17.Kremer F. Dielectric spectroscopy – yesterday, today and tomorrow. J Non-Crystalline Solids. 2002 Jul;305(1–3):1–9. [Google Scholar]
- 18.Abdalla S, Al-Ameer SS, Al-Magaishi SH. Electrical properties with relaxation through human blood. Biomicrofluidics. 2010;4(034101):1–16. doi: 10.1063/1.3458908. [DOI] [PMC free article] [PubMed] [Google Scholar]
- 19.Wolf M, Gulich R, Lunkenheimer P, Loidl A. Broadband dielectric spectroscopy on human blood. Biochim Biophys Acta BBA - Gen Subj. 2011 Aug;1810(8):727–740. doi: 10.1016/j.bbagen.2011.05.012. [DOI] [PubMed] [Google Scholar]
- 20.Asami K. Characterization of biological cells by dielectric spectroscopy. J Non-Crystalline Solids. 2002 Jul;305(1–3):268–277. [Google Scholar]
- 21.Heileman K, Daoud J, Tabrizian M. Dielectric spectroscopy as a viable biosensing tool for cell and tissue characterization and analysis. Biosensors Bioelectronics. 2013 Nov;49:348–359. doi: 10.1016/j.bios.2013.04.017. [DOI] [PubMed] [Google Scholar]
- 22.Asami K, Sekine K. Dielectric modeling of erythrocyte aggregation in blood. J Phys D: Appl Phys. 2007;40(7):2197–2204. [Google Scholar]
- 23.Hayashi Y, et al. Dielectric inspection of erythrocyte morphology. Phys Med Biol. 2008;53(10):2553–2564. doi: 10.1088/0031-9155/53/10/007. [DOI] [PubMed] [Google Scholar]
- 24.Merla C, et al. Dielectric spectroscopy of blood cells suspensions: study on geometrical structure of biological cells. Proc Int IEEE Eng Med Biol Conf (EMBC) 2006 Aug;:3194–3197. doi: 10.1109/IEMBS.2006.259414. [DOI] [PubMed] [Google Scholar]
- 25.Byrnes JR, et al. Factor XIIIa-dependent retention of red blood cells in clots is mediated by fibrin α-chain crosslinking. Blood. 2015 Oct;126(16):1940–1948. doi: 10.1182/blood-2015-06-652263. [DOI] [PMC free article] [PubMed] [Google Scholar]
- 26.Ur A. Determination of blood coagulation using impedance measurements. Biomed Eng. 1970 Jul;5(7):342–345. [PubMed] [Google Scholar]
- 27.Ur A. Detection of clot retraction through changes of the electrical impedance of blood during coagulation. Amer J Clin Pathol. 1971 Dec;56(6):713–718. doi: 10.1093/ajcp/56.6.713. [DOI] [PubMed] [Google Scholar]
- 28.Ur A. Changes in the electrical impedance of blood during coagulation. Nature. 1970 Apr;226(5242):269–270. doi: 10.1038/226269a0. [DOI] [PubMed] [Google Scholar]
- 29.Hayashi Y, et al. Dielectric coagulometry: A new approach to estimate venous thrombosis risk. Anal Chem. 2010 Dec;82(23):9769–9774. doi: 10.1021/ac101927n. [DOI] [PubMed] [Google Scholar]
- 30.Chiba S, et al. Dielectric blood coagulometry as a novel coagulation test. J Sci Res Rep. 2015 Jan;4(3):180–188. [Google Scholar]
- 31.Hayashi Y, Brun MA, Machida K, Nagasawa M. Principles of dielectric blood coagulometry as a comprehensive coagulation test. Anal Chem. 2015 Oct;87(19):10072–10079. doi: 10.1021/acs.analchem.5b02723. [DOI] [PubMed] [Google Scholar]
- 32.Maji D, et al. Monitoring time course of human whole blood coagulation using a microfluidic dielectric sensor with a 3D capacitive structure. Proc Int IEEE Eng Med Biol Conf (EMBC) 2015 Aug;:5904–5907. doi: 10.1109/EMBC.2015.7319735. [DOI] [PubMed] [Google Scholar]
- 33.Maji D, et al. A PMMA microfluidic dielectric sensor for blood coagulation monitoring at the point-of-care. Proc Int IEEE Eng Med Biol Conf (EMBC) 2016 Aug;:291–294. doi: 10.1109/EMBC.2016.7590697. [DOI] [PubMed] [Google Scholar]
- 34.Suster MA, Vitale NH, Maji D, Mohseni P. A circuit model of human whole blood in a microfluidic dielectric sensor. IEEE Trans Circ Syst – Part II: Exp Briefs. 2016 Dec;63(12):1156–1160. [Google Scholar]
- 35.Adcock DM, et al. Collection, transport and processing of blood specimens for testing plasma-based coagulation assays and molecular hemostasis assays: approved guideline – 5th edition. Clinical and Laboratory Standards Institute, CLSI Document H21-A5. 2008;28:1–33. [Google Scholar]
- 36.Bolliger D, Seeberger MD, Tanaka KA. Principles and practice of thromboelastography in clinical coagulation management and transfusion practice. Transfusion Medicine Reviews. 2012;26(1):1–13. doi: 10.1016/j.tmrv.2011.07.005. [DOI] [PubMed] [Google Scholar]
- 37.Chitlur M, et al. Recommendations for performing thromboelastography/thromboelastometry in hemophilia: communication from the SSC of the ISTH. J Thrombosis & Haemostasis. 2014;12(1):103–106. doi: 10.1111/jth.12458. [DOI] [PubMed] [Google Scholar]
- 38.Wolberg AS, Meng ZH, Monroe DMI, Hoffman M. A systematic evaluation of the effect of temperature on coagulation enzyme activity and platelet function. J Trauma and Acute Care Surgery. 2004 Jun;56(6):1221–1228. doi: 10.1097/01.ta.0000064328.97941.fc. [DOI] [PubMed] [Google Scholar]
- 39.Minot GR. The effect of temperature upon the clotting time (prothrombin time) of oxalated plasma with calcium. J Medical Research. 1916 Jan;33(3):503–506. [PMC free article] [PubMed] [Google Scholar]
- 40.Kirkpatrick AW, Chun R, Brown R, Simons RK. Hypothermia and the trauma patient. Canadian J Surgery. 1999;42(5):333–343. [PMC free article] [PubMed] [Google Scholar]
- 41.Reed RL, et al. Hypothermia and blood coagulation: dissociation between enzyme activity and clotting factor levels. Circulatory Shock. 1990 Oct;32(2):141–152. [PubMed] [Google Scholar]
- 42.Reed RL, Johnston TD, Hudson JD, Fischer RP. The disparity between hypothermic coagulopathy and clotting studies. J Trauma and Acute Care Surgery. 1992 Sep;33(3):465–470. doi: 10.1097/00005373-199209000-00022. [DOI] [PubMed] [Google Scholar]
- 43.Gubler KD, Gentilello LM, Hassantash SA, Maier RV. The impact of hypothermia on dilutional coagulopathy. J Trauma. 1994;36(6):847–851. doi: 10.1097/00005373-199406000-00015. [DOI] [PubMed] [Google Scholar]
- 44.Mellanby J. The coagulation of blood. J Physiology. 1908 Dec;38(1):28–112. doi: 10.1113/jphysiol.1908.sp001297. [DOI] [PMC free article] [PubMed] [Google Scholar]
- 45.Dawson M, Milne GR. The collection and storage of blood. Immunological and Blood Products, Butterworth-Heinemann. 1967:133–148. [Google Scholar]
- 46.Ataullakhanov FI, Pohilko AV, Sinauridze EI, Volkova RI. Calcium threshold in human plasma clotting kinetics. Thrombosis Research. 1994 Aug;75(4):383–394. doi: 10.1016/0049-3848(94)90253-4. [DOI] [PubMed] [Google Scholar]
- 47.Escolar G, Bozzo J, Maragall S. Argatroban: A direct thrombin inhibitor with reliable and predictable anticoagulant actions. Drugs of Today. 2006;42(4):223–236. doi: 10.1358/dot.2006.42.4.953588. [DOI] [PubMed] [Google Scholar]
- 48.Crawley JTB, et al. The central role of thrombin in hemostasis. J Thrombosis & Haemostasis. 2007 Jul;5:95–101. doi: 10.1111/j.1538-7836.2007.02500.x. [DOI] [PubMed] [Google Scholar]
- 49.Narayanan S. Multifunctional roles of thrombin. Annals of Clinical & Laboratory Science. 1999 Oct;29(4):275–280. [PubMed] [Google Scholar]
- 50.Olorundare OE, Simmons SR, Albrecht RM. Cytochalasin D and E: effects on fibrinogen receptor movement and cytoskeletal reorganization in fully spread, surface-activated platelets: a correlative light and electron microscopic investigation. Blood. 1992;79(1):99–109. [PubMed] [Google Scholar]
- 51.Lang T, et al. Different effects of abciximab and cytochalasin D on clot strength in thromboelastography. J Thrombosis & Haemostasis. 2004;2(1):147–153. doi: 10.1111/j.1538-7836.2004.00555.x. [DOI] [PubMed] [Google Scholar]