Abstract
Objective
We have developed a wireless opto-electro interface (WOENI) device, which combines electrocorticogram (ECoG) recording and optical stimulation for bi-directional neuromodulation on small, freely behaving animals, such as rodents.
Approach
The device is comprised of two components, a detachable headstage and an implantable polyimide-based substrate. The headstage establishes a Bluetooth Low Energy (BLE) bi-directional data communication with an external custom-designed USB dongle for receiving user commands and optogenetic stimulation patterns, and sending digitalized ECoG data.
Main results
The functionality and stability of the device were evaluated in vivo on freely behaving rats. When the animal received optical stimulation on the primary visual cortex (V1) and visual stimulation via eyes, spontaneous changes in ECoG signals were recorded from both left and right V1 during 4 consecutive experiments with 7-day intervals over a time span of 21 days following device implantation. Immunostained tissue analyses showed results consistent with ECoG analyses, validating the efficacy of optical stimulation to upregulate the activity of cortical neurons expressing ChR2.
Significance
The proposed WOENI device is potentially a versatile tool in the studies that involve long-term optogenetic neuromodulation.
Keywords: wireless opto-electro neural interface (WOENI), small freely behaving animals, ECoG recording, optical stimulation on V1, visual stimulation
1. Introduction
The complex mammalian brain neural network has comprised of billions of interconnected neurons with diverse types, shapes, sizes, and activity patterns [1]. Studying neuronal circuits at cellular level for a fundamental understanding of brain functions requires neural interfaces that can record and modulate the target brain area with a high spatiotemporal resolution [1, 2]. These neural interfaces provide a direct communication pathway between the target neural populations and external devices, which may also enable promising therapies for various brain injuries and disorders that do not respond to medication [1–4]. For more than a century, electrical stimulation was the traditional method of initiating functional response in neurons by injecting current to depolarize their cell membranes [1, 5]. However, this method suffers from indiscriminate stimulation of cell components, large electrical artifacts, and poor spatial resolution due to unpredictable and time-variant current pathways within the neural tissue [6, 7]. Optogenetics, on the other hand, is a technique that uses optical stimulation to activate or inhibit genetically-modified targeted neurons, which express light-sensitive opsin proteins, and provides several distinct advantages, such as cell-type specificity, millisecond temporal precision, and rapid reversibility [7–9]. Also because of its much smaller electrical disturbance, this technique enables simultaneous monitoring of neural response by electrical recording, in the vicinity of stimulation sites [10].
Lasers and LEDs are commonly-used light sources in optogenetics. In laser-based optical systems [11–15], optical fibers, microwave guides, or tapered optrodes are always used to deliver light to target neurons. For behavioral studies, these light conduits are limiting factors affecting natural behavior of animal subjects and may cause complications in surgery [15–17]. LEDs have shrunk in size and improved in efficiency due to recent advances in microfabrication, and show distinct feasibility to integrate with electronics [1, 10, 18, 19]. Various LED-based optical devices have been developed, comprising of detachable headstage and implantable module, enabling untethered experiments with freely behaving animals [20–26]. The implanted module has either been implemented as a probe penetrating into the brain with the LEDs placed on it [23, 25, 26] or optical fibers guiding light from LEDs embedded in the external headstage to the target neurons [20–22, 24]. Devices in [23–26], however, lack neural recording capability, which is necessary as a neural response to optical stimulation or feedback for closed-loop neuromodulation. Likewise, commercial optical devices, such as [27–29] support either recording or stimulation function, and cannot meet the demands for both neuromodulation and recording in the same device. The devices in [20–22] have comprehensive features of optical stimulation and neural recording. However, these features were only tested in an acute experiment on a single animal subject. Therefore, the device stability for longer-term experiments is still unclear.
Eliminating the tethering effect of laser-based optogenetic hardware imposes a new challenge, control of the headstage. Advancements have been made by combining wireless technologies and optogenetics to achieve remote control. In [30] and [31], the stimulation parameters are set by adjusting the transmitted power to control the power received by µLEDs. Infrared (IR) interrogation is implemented in the optical device in [25, 26] to wirelessly receive control signals. The devices in [20–24] use commercially-available off-the-shelf (COTS) radio transceivers, operating in the industrial, scientific, and medical (ISM) band, to establish bidirectional data links. Moreover, remote control of headstage reduces sources of interference that animal subject receives during experiment and enriches the environment for natural behavior, which will in turn improve the quality of the experimental results [32, 33].
To address the requirements of neural interfaces for extended experiments with small freely behaving animals, we have developed a wireless opto-electro neural interface (WOENI) device, capable of optical stimulation and ECoG recording, referring to [34, 35]. A proof of concept prototype, presented in this manuscript, is fabricated on polyimide-based substrate, and includes four µLEDs and two epidural microelectrodes. Section 2 describes the entire system, data communication link, substrate fabrication process, measurement setup, surgical preparation, and in vivo experiment design. Section 3 presents the specifications of the wireless headstage and in vivo experiment results to verify system functionality and stability. Section 4 discusses the advantages and limitations of the entire system and future steps, followed by concluding remarks.
2. Methods
2.1. System Overview
As shown in figure 1(a), the entire system consists of: 1) a detachable headstage, 2) an implantable polyimide-based substrate, 3) a custom-designed USB dongle, and 4) a PC that runs the graphical user interface (GUI) for parameter setting, data representation, processing, and storage. The headstage can wirelessly receive stimulation parameters set by the user in the GUI via the Bluetooth Low Energy (BLE) link between the headstage and USB dongle, to selectively drive the µLEDs, and send the amplified, filtered, and digitalized ECoG data to the USB dongle. Data samples are plotted in the GUI in real time to monitor the functionality of the system and ongoing state of the animal subject brain, and also saved locally for offline data processing. The headstage, which is shown with more details in figure 1(b), includes a 3.7 V, 45 mAh rechargeable battery, and COTS electronics mounted on three PCBs. One of the PCBs is mounted vertically and holds an Omnetics connector (PZN-08-AA), which provides 8 electrical contacts to the implanted polyimide-based substrate through a mating Omnetics (PZN-08-DD) connector, while supporting four addressable µLEDs and two epidural recording microelectrodes.
Figure 1.
(a) A simplified conceptual representation of the WOENI system for optical stimulation and ECoG recording on small freely behaving rats. (b) A 3D view of the WOENI device prototype, including a detachable headstage and a polyimide-based substrate integrating four addressable µLEDs and two epidural recording microelectrodes.
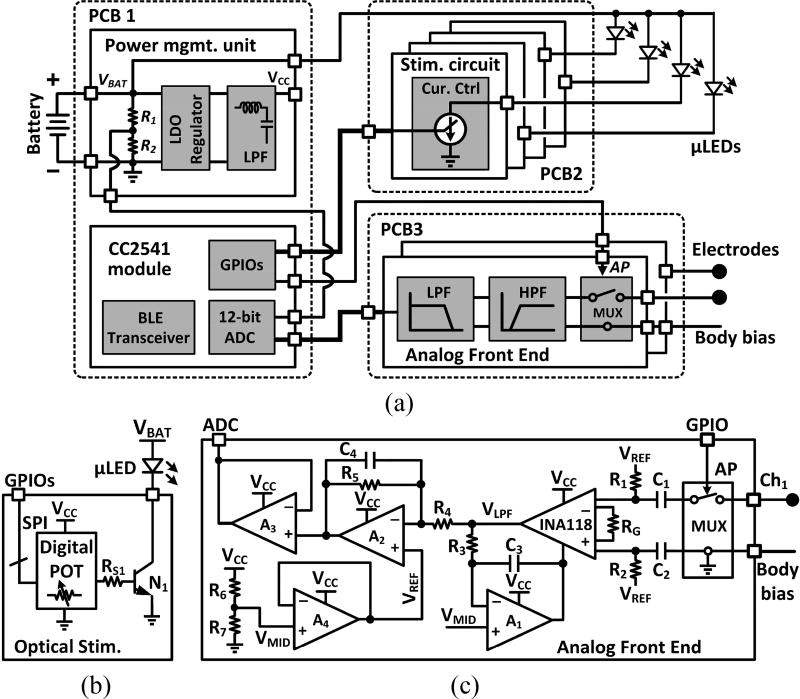
The headstage circuit schematic is shown in figure 2(a). An adjustable regulator (TPS79901) stabilizes the battery output, VBAT, to generate VCC = 3.3 V, which is also low-pass filtered. The built-in analog-to-digital converter (ADC) of the CC2541 microcontroller (MCU) takes samples of VBAT to allow users monitor the battery voltage. The optical stimulation circuitry drives four µLEDs with adjustable current (5~30 mA), stimulation period (100~900 ms with 100 ms steps, or 1~10 s with 1 s steps), and stimulation pulse duty cycle (0.1~0.9% with 0.1% steps, or 1~10% with 1% steps). The two-channel analog front-end (AFE) amplify and filter ECoG signals by a factor of 49 dB within 1–200 Hz band, respectively, from two microelectrodes. The MCU also digitalizes the two AFE outputs at 1 kHz sampling rate, packetizes, and transmits data to the USB dongle via the BLE link.
Figure 2.
(a) A simplified block diagram of the key building blocks involved in the headstage. Schematic diagram of a single channel of the optical stimulation (b) and the AFE (c).
Figure 2(b) shows a single channel optical stimulation circuitry. A bipolar junction transistor (BJT) is driven by general-purpose I/O (GPIO) ports through a digital potentiometer (POT) (AD5160BRJZ100), which variable resistance adjusts the current flowing through the selected µLED in 256 steps (8-bits) [35]. Figure 2(c) shows a single channel AFE, which mainly includes three stages, referring to [21]. C1 and C2 eliminate the DC offset at the electrode-electrolyte interface at the instrumentation amplifier (INA118) inputs, which are further biased by R1 and R2. In the 1st stage, INA118 output, VLPF, is low pass filtered by an amplifier (AD8603), R3, and C3, and subtracted from the input signal to provide a high-pass filtered version of the input signal with a cut-off frequency of 1/(2π·R3·C3). The 2nd stage, formed by A2, R4, R5, and C4, is used as a low-pass filter (LPF) with the gain set by −R5/R4. AFE connects to the built-in ADC of CC2541 through a buffer stage. The common-mode voltage, VREF, is set at half of the supply voltage. To protect AFEs from photoelectric artifacts [1, 4, 7, 8], an artifact rejection pulse, AP, is generated during stimulation to briefly disconnect the INA118 inverting input from the microelectrode and short it to ground.
2.2. Data Communication Protocol
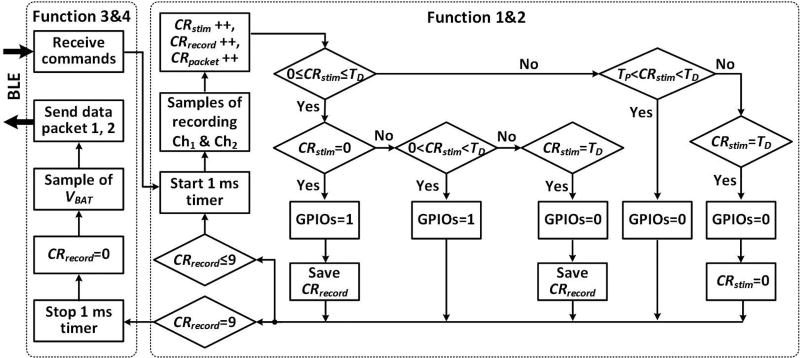
The headstage firmware has four functions: 1) precisely timed stimulation, 2) continuous recording, 3) command data reception, and 4) neural data transmission. Once the BLE connection is established, the user can lunch functions 1 and 2 by triggering a 1 ms timer in a loop, as shown in figure 3. Four tasks of function 2 are executed in each sequence. First, the built-in ADC captures a sample of the neural data from each AFE channel. Second, recording (CRrecord), stimulation (CRstim), and data packet (CRpacket) counters are added by one. CRstim is then compared with 0, duty cycle (TD), and stimulation period (TP) to turn on/off the selected µLEDs and decide whether to save the current CRrecord. To synchronize stimulation with recording for offline data analysis, CRrecord will be saved if CRstim = 0 and CRstim = TD, corresponding to the start and end of a stimulation pulse, respectively. Finally, CRrecord is compared with 10 to decide whether to repeat the loop or move forward to functions 3 and 4. When functions 3 and 4 trigger, the MCU takes one sample from VBAT, and packetizes it with the other 10 samples from AFE, and wirelessly transmits the packaged data to CC2540 on the USB dongle. If the BLE connection is lost, the two MCUs try to reconnect automatically [36].
Figure 3.
Simplified control flowchart of the MCU firmware.
2.3. Polyimide-Based Substrate Fabrication Process
The optical stimulation and recording electrodes are fabricated on separate polyimide films, as shown in figure 4, which are flexible and bio-compatible. Stimulation channels are divided into two sub-arrays, each with two µLEDs separated by 1 mm to ensure enough illumination fields distinction. A 9 µm thick double-sided copper (Cu) clad polyimide film was used as the substrate. Cu was patterned to create interconnections and pads for µLED bonding. Commercial surface mounted µLEDs (270 µm×220 µm×50 µm, TR2227TM) from Cree (Durham, NC) with peak wavelength of 460 nm were bonded on the interconnect pads by applying low melting point solder (~62 °C, 144 Alloy Field's Metal from Rotometals, Inc.) [9]. This flexible stimulator was then packaged using Parylene-C, a polymer that has shown superior biocompatibility (ISO 10993 & USP Class VI), good flexibility, optical transparency in the visible spectrum, colorless behavior, chemical inertness, and low permeability [37, 38].
Figure 4.
The fabrication procedure of the polyimide-based substrate.
The recording electrodes are positioned 5 mm from the closest µLED to not only record strong light-evoked ECoG signal but also reduce photoelectric artifacts, therefore, ensuring recorded ECoG signals with high signal-to-noise ratio (SNR). Our design allows the stimulation and/or recording from multiple sites of the cortex. Fabrication of the recording array initiated with chemical vapor deposition of 12 µm Parylene (SCS Labcoter®2 PDS 2010, Specialty Coating Systems) on a silicon wafer, followed by thin films of titanium (Ti) and gold (Au) deposition using an Edward Auto306 thermal evaporator. Au and Ti were patterned by potassium iodide and hydrofluoric acid, respectively, to create 500 µm diameter recording electrodes. The array was then packaged by Parylene-C, followed by oxygen plasma etching to selectively expose the recording sites. Finally, the flexible array was released from the silicon wafer and bonded with the stimulation array using medical grade epoxy.
2.4. Benchtop Measurements
The headstage, connected to the polyimide-based substrate, executed user commands to drive a single µLED with pulse width of 10 ms at 1 Hz. The digital potentiometer value is determined by (256-D)/256×100 kΩ+0.06 kΩ, where D is the decimal equivalent of the binary code loaded in its 8-bit register (max resistance = 100 kΩ). The µLED current at each D was measured from the voltage across a 10 Ω current-sensing resistor in series with the selected µLED. The emitted light during a pulse was collected from the µLED surface by an optical power meter (Newport 1835-C). Details of µLED optical properties tested with brain tissue can be found in [9].
The AFE was characterized after immersing the polyimide-based substrate in 0.9% saline solution. The noise spectrum, harmonic distortion, and frequency response of the AFE channels were measured with a dynamic signal analyzer (Agilent, 35670A). The electrochemical impedance of the recording microelectrode was analyzed using a potentiostat (Electrochemical Analyzer, CH Instruments) in a three-electrode cell, with the Au microelectrode as the working electrode (WE), an Ag/AgCl electrode as the reference electrode (RE), and a platinum electrode as the counter electrode (CE).
2.5. Surgical Preparation
In vivo experiments were conducted on five freely behaving adult Long Evans rats (female, 300~400 g) to establish the surgical procedure and verify the functionality of the prototype WOENI device. All procedures were approved by the Institutional Animal Care and Use Committee (IACUC) at Michigan State University. Prior to device implantation, four of them received virus injection (AAV-hSyn-hChR2 (H134R)-m Cherry; UNC Vector Core) in their V1 to express neurons with light-sensitive channelrhodopsin-2 (ChR2) while one non-transfected rat was used as a negative control. For virus injection, each subject was anesthetized with an inhalation anesthetic (Isoflurane and oxygen mixture, 4% vaporizer) and placed on a stereotaxic apparatus. Using sterile surgical procedures, a 3~4 cm incision was made in the skin overlying the skull and small holes were made on the skull to get access to V1. Using a Hamilton syringe, the AAV virus solution (1012~1013 genome/mL) was injected in both left and right V1 cortices, with 3 equidistant locations on each cortex and 1.0 µL per side. The cortex then was covered with Gelfoam and the skin overlying the skull was sutured and closed. After recovery from anesthesia, the transfected rats were housed separately, and given pain medication and antibiotics to minimize discomfort and infection until they recovered from the injection surgery.
The four transfected rats and one non-transfected rat were anesthetized and placed on the stereotaxic frame for device implantation. Two small pieces of bone were removed to expose the left and right V1 cortices, respectively, with the coordinates of the skull openings (P=6.3 mm, L=3.6 mm) over V1, while the dura remained intact. The polyimide-based substrate was surgically implanted over V1 and firmly attached onto the skull using dental cement. The grounding wire was inserted under the skin. The skin was sutured closed, leaving only the Omnetics connector exposed for the detachable headstage. These experiments were performed 4 weeks after virus injection to ensure that the cortical neurons are expressing ChR2 opsin.
2.6. In vivo Experiment Design and Setup
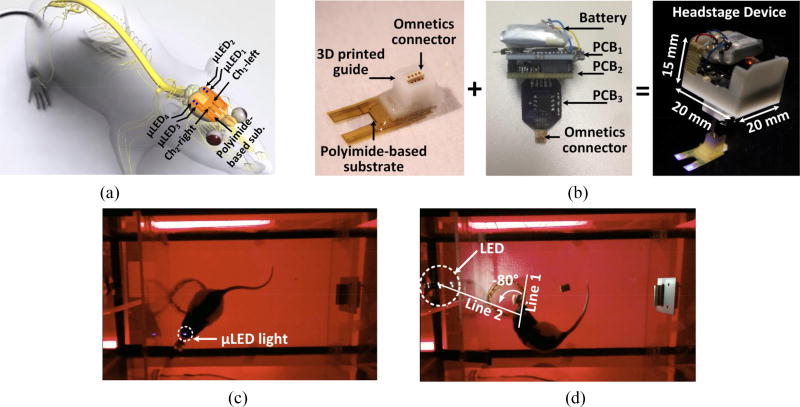
Figure 5(a) shows µLED1, µLED2, and channel-1 left (Ch1-left) microelectrode above the left V1 lobe, and µLED3, µLED4, and channel-2 right (Ch2-right) microelectrode above the right V1 lobe of the rat brain. Figure 5(b) shows the fabricated WOENI device prototype with four optical stimulation and two ECoG recording channels. A small 3D-printed guide is glued on to the back-end of the flexible substrate around the Omnecitcs connector to facilitate insertion, prevent blockage with dental cement, and provide additional mechanical support for the headstage. The headstage electronics and rechargeable battery are housed in a 3D-printed box (15×20×20 mm3) to avoid moisture and mechanical damage by the animal actions. The headstage weighs 5.5 g, well below the level that would cause any discomfort or interference with the natural behavior of rats. Prior to in vivo experiments, the rats were handled to attach the headstage and habituated to the homecage for 5 minutes. In figure 5(c), the top view of the experiment setup is shown when the optical stimulation on V1 was performed by turning on/off a subset of µLEDs. In figure 5(d), a commercial white LED (Chanzon) with diffuse white light was placed in the middle of the left wall at a height of 8 cm from the bottom of homecage to apply visual stimulation. The angle between two straight lines, one connecting the midpoint between two ears to the rat nose, and the other one connecting the ears midpoint to the LED is defined as the visual angle (VA) to indicate the relative positioning of the external LED to rats’ eyes. Clockwise rotation from line 1 to 2 is considered as positive VA, while anticlockwise rotation is considered as negative VA.
Figure 5.
(a) Anatomical location of the polyimide-based substrate on rat brain. (b) WOENI device with four optical stimulation and two ECoG recording channels. In vivo experimental setup for (c) optical stimulation on V1 and (d) visual stimulation.
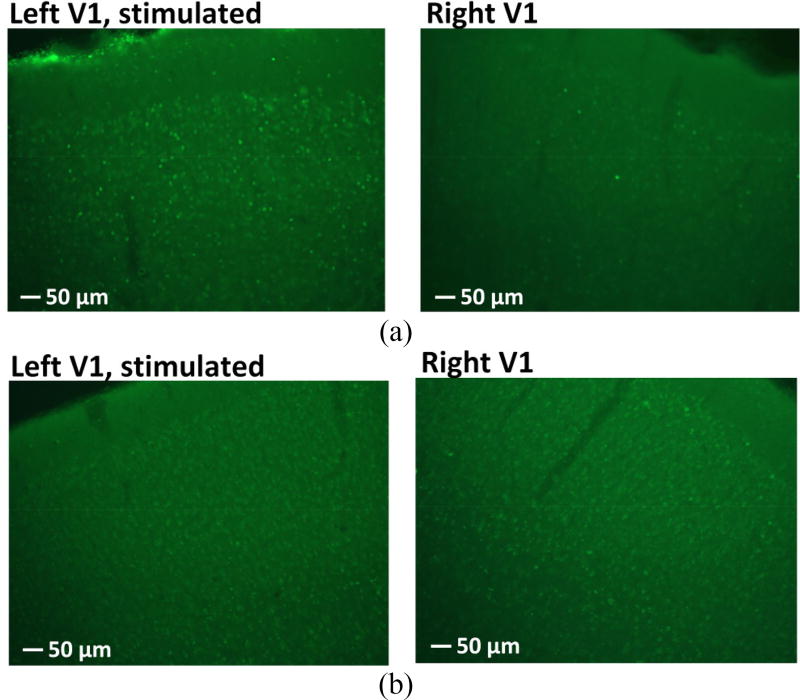
C-Fos was used as a biomarker to validate neuronal activity induced by optical stimulation. Experiments were performed on one transfected rat (rat #1) and one non-transfected control. Both received 45-min optical stimulation on the left V1 with 10 ms light exposure and 5 mA current at 1 Hz. After the stimulation, each rat was given a 75~90 min survival period, prior to perfusing with chilled saline and 4% paraformaldehyde and post-fixing brain tissue overnight at 4°C in the same solution. Tissue sections with a thickness of 50 µm were cut in chilled 0.1 M phosphate buffer and stored in 24 well tissue culture dishes for post immunohistology chemical processing, after which the processed sections were mounted on microscope glass slides and covered by coverslips with an anti-fade solution for c-Fos expression imaging under a fluorescent microscope (Nikon MICROPHOT-FXA).
To evaluate the device performance, the ECoG signals from both the stimulated and unstimulated V1 of other two transfected rats, rat #2 and rat #3, were recorded and compared. For each rat, four experiments were conducted on days 0, 7, 14, and 21, post polyimide substrate implantation. During each experiment, the headstage was attached to drive the remotely selected µLEDs with current of 5 mA, while recording ECoG from both channels, simultaneously. Each experiment included 150 successive optical stimulations on the left V1 lobe and 150 successive optical stimulations on the right V1 lobe. Each optical stimulation trial started with a 10 ms light exposure and lasted 1 s. Experiments were repeated on the non-transfected control using the same protocol and the ECoG signals were compared to the data recorded from the transfected rats.
Previous studies have reported that a given side of the V1 lobe responded to the visual stimuli from the opposite half of the field of view [39]. We hypothesized that we will observe a similar result by applying visual stimulation on rat #4 on days 0, 7, 14, and 21 after implantation. The external LED was controlled by pulses of 1 s duration and 10 s intervals (0.1 Hz), while wirelessly recording ECoG from the implanted microelectrodes. Each experiment included 30 trials, each of which started with 1 s visual stimulation and lasted 10 s. Similar to optogenetic stimulation, the ECoG data was transmitted to the external PC in real time and saved locally for offline data processing, using MATLAB Chronux toolbox [40].
3. Results
3.1. Optogentic Stimulation and ECoG Recording
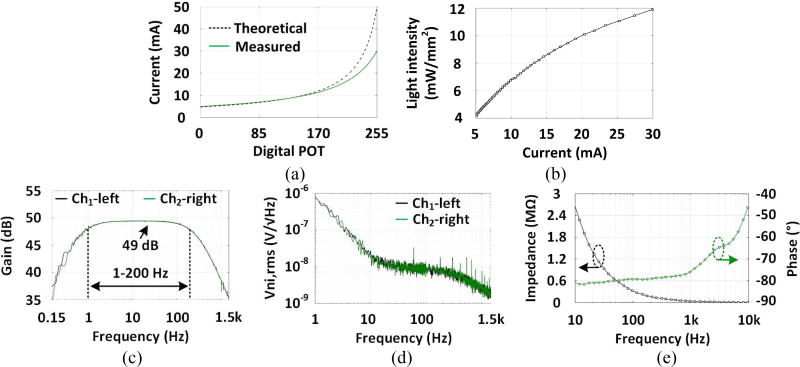
Figure 6(a) shows how the µLED current increments from 5 to 30 mA as a function of D. Parasitic resistance of the battery limits the µLED current, preventing it from following the theoretical value as D exceeds 170. Figure 6(b) shows the measured light intensity of a single µLED as a functional of its current. At the minimum current of 5 mA, the light intensity is 4 mW/mm2, which is above the threshold for effective optical modulation of neural activities [1, 41]. Figure 6(c) shows the measured AFE frequency response from 0.15 Hz to 1.5 kHz. It can be seen that the midband gain of ~49 dB was relatively constant within important 1 Hz to 200 Hz band of interest, resulting in low distortion. Figure 6(d) shows the measured AFE input-referred voltage noise spectrum. The thermal noise level is 10 nV/√Hz and 1/f noise corner occurs at 10 Hz. Integration under this curve from 1 Hz to 1.5 kHz yields a root mean square (RMS) noise voltage of 8.47 µVrms and 8.64 µVrms for channels 1 and 2, respectively. Distortion stays below 1% total harmonic distortion (THD) for input below 11.3 mVPP, resulting in a dynamic range of ~53.4 dB. In figure 6(e), the frequency-dependent impedance magnitude and phase were measured from 10 Hz to 100 kHz when a 5 mVRMS sinusoid waveform was applied to the WE. The impedance magnitude at 1 kHz was ~ 36.2 kΩ, which is suitable for ECoG recording [42][42]. The WOENI specifications are summarized in table 1.
Figure 6.
(a) Theoretical estimate and measured current through one of the µLEDs used in the WOENI device as a function of the digital potentiometer input. (b) Light intensity of the µLED vs. current. (c) Two-channel AFE frequency response. (d) Input-referred voltage noise spectral density of 2-ch AFEs. (e) Changes in the gold microelectrode impedance magnitude and phase vs. frequency.
Table 1.
The WOENI specifications
| ECoG recording | Optical stimulation | ||
|---|---|---|---|
| # of channels | 2 | # of channels | 4 |
| Mid-band gain | 49 dB | Stim. current | 5~30 mA, 8 bits |
| Bandwidth | 1~200 Hz | Light intensity | 4~12 mW/mm2 |
| Input-referred noise | 8.47 µVrms, 8.64 µVrms | Stim. period | 0.1~0.9 s in 10 steps, 1~10 s in 10 steps |
| THD (11.3 mVPP input) | 1% | Duty cycle | 0.1~0.9% in 10 steps, 1~10% in 10 steps |
| Dynamic range (1% THD) | 53.5 dB, 53.3 dB | Data transmission | |
| Input impedance @ 1 kHz | 10 MΩ | Data throughput | 32 kbps |
| CMRR | >110 dB @ 1 kHz | Dara error rate | < 0.3% |
| PSRR | >80 dB @ 1 kHz | Transmission range | ~3 m |
| Power consumption | 1.5 mW/channel | ENOB | 11 bits |
| Recovery time | 5 ms | Sampling rate | 1 kS/s |
3.2. In vivo Optical stimulation on V1
The immunostained tissue analysis of rat #1 and the non-transfected control are shown in figure 7(a) and 7(b), respectively. Fluorescent images were taken under 10× magnification. The green fluorescence indicates cells expressing c-Fos. For the cortical tissues expressing ChR2 (figure 7(a)), there was a significant up-regulation of the c-Fos expression in the left V1, implying that the stimulation resulted in an increase in neuronal activity. In contrast, the right V1 showed only a mild increase in the c-Fos immunostaining. This mild increase in the c-Fos expression of the control is mainly attributed to the baseline level of the cortical neuron activity and the normal visual stimulation of cortex since the rats had their eyes open. In figure 7(b), there is no significant difference of c-Fos expression between the left and right V1 of the non-transfected rat. The results of the immunohistochemical analysis demonstrate the efficacy of the optogenetic stimulation on the transfected cortical tissue.
Figure 7.
c-Fos expression in the left and right V1 of (a) rat #1 and (b) the non-transfected rat with optical stimulation on the left V1.
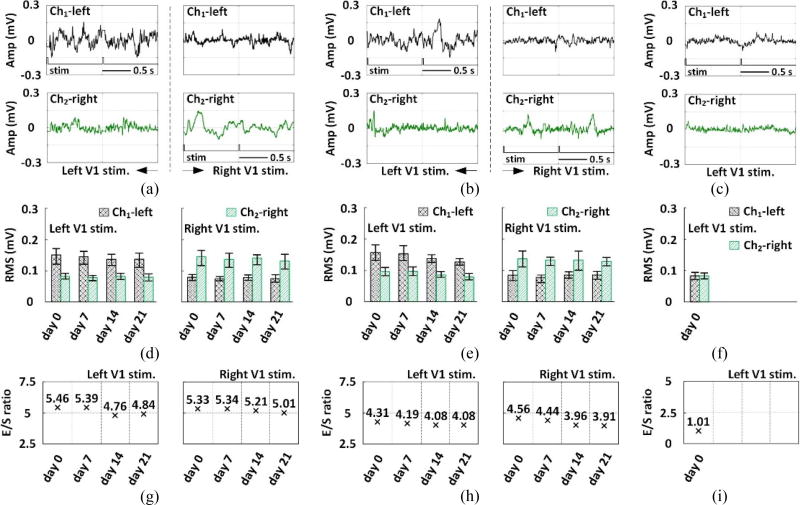
Figure 8(a) and 8(b) illustrate ECoG recordings from rat #2 and rat #3, respectively. The optical stimulation on the left V1 induced larger ECoG variation in Ch1-left. Similarly, larger ECoG variation was observed in Ch2-right with optical stimulation on the right V1. However, for the non-transfected rat, there is no significant difference in the ECoGs between the stimulated left V1 and unstimulated right V1, as shown in figure 8(c). Figures 8(d) and 8(e) show the RMS amplitudes of the ECoG signal during a single trial in each of the four consecutive experiments on days 0, 7, 14, and 21 after polyimide substrate implantation on rats #2 and #3, respectively. The RMS amplitudes of the ECoG signal during a single trial (day-0) on the non-transfected rat is shown in figure 8(f). The independent two-sample t-test (significance level, α = 0.05) was applied, where the RMS values of the left and right lobe ECoGs in each trial were calculated to obtain two sets of 150 RMS samples of each experiment, one from each of the two sets being compared. The significant effect of the optical stimulation on the ECoG signal from the stimulated V1 was confirmed by p<0.05 in all four experiments only for rats #2 and #3, and not for the non-transfected rat.
Figure 8.
Examples of 2 s long ECoG data recorded from the left and right V1 of (a) rat #2, (b) rat #3, and (c) the non-transfected rat, with V1 optical stimulation flags on the stimulated side. RMS values of the ECoG recorded from Ch1-left and Ch2-right in each experiment performed on (d) rat #2, (e) rat #3, and (f) the non-transfected rat, indicating the optically stimulated V1. Evoked-to-spontaneous (E/S) ECoG RMS ratios of the experiments performed on (g) rat #2 and (h) rat #3, and (i) the non-transfected rat.
We defined evoked-to-spontaneous ECoG ratio (E/S ratio) as the RMS amplitude of the ECoG signal of the stimulated V1 divided by that of the unstimulated V1. The E/S ratios of both rats #2 (figure 8(g)) and #3 (figure 8(h)) decayed by ~15% over four experiments, but still remained > 3.9 during 21 days, which demonstrated that the ECoG signals from stimulated and unstimulated V1 were distinguishable. In figure 8(i), the E/S ratio of the non-transfected rat is ~1, implying the negligible difference between the ECoG signals from the stimulated and unstimulated V1.
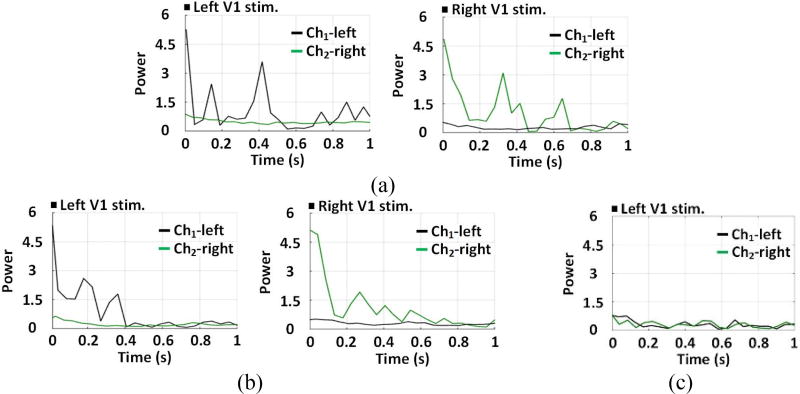
Each channel ECoG signal was averaged over four consecutive experiments and mapped onto a time-frequency map of the color-coded normalized power spectral density (PSD) distribution in 1~200 Hz frequency range [43]. In figure 9(a) and 9(b), the ECoG signal from stimulated V1 show significant increase in PSD, which is concentrated within a relatively narrow 1~40 Hz band. In figure 9(c), there was no significant difference of PSD between the stimulated and unstimulated V1 of the non-transfected rat. Integrating the normalized PSD within 1~40 Hz at each time point yields the time-varying power of the ECoG signal. The ECoG power of the experiment (day-0) was compared between one channel to the other. In figure 10(a) and 10(b), higher ECoG power from the stimulated V1 was observed on the transfected rats #2 and #3, which were validated by the independent two-sample t-test (α=0.05) with p < 0.05. In figure 10(c), no significant ECoG power increase was observed on the stimulated V1 of the non-transfected rat.
Figure 9.
Time-frequency maps of the averaged and normalized PSD from two ECoG channels of (a) rat #2, (b) rat #3, and (c) the non-transfected rat, within 1~200 Hz frequency range and 1 s time window, with stimulation markers. The dashed line indicates the 1~40 Hz frequency band, where most of the ECoG power has been concentrated.
Figure 10.
(a) Averaged time-varying ECoG power for Ch1-left and Ch2-right channels of (a) rat #2, (b) rat #3, and (c) the nontransfected rat, within 1~40 Hz band and 1s time window, with stimulation markers.
Figure 11 shows the Hilbert transformation of instantaneous phases of day-0 ECoG recordings within 1~40 Hz [44]. Colors indicate the instantaneous phase of each trial, aligned based on the stimulus ON time, and stacked. For the transfected rat #2 and #3, the ECoG signal from the stimulated V1 showed longer phase synchronization following each stimulus, while almost no phase synchrony is observed in the control lobe. The neural modulation was reliable across over 150 trials. The optical stimulation generated close to deterministic phase-locked neuronal oscillations without any latency for ~0.25 s (Ch1-left) and ~0.2 (Ch2-right) of rat #2 and ~0.3 s (Ch1-left) and ~0.2 s (Ch2-right) of rat #3, as validated by the nonparametric Wilcoxon signed rank test (α = 0.05) with p < 0.05. However, in figure 11(c), the ECoG signal from the stimulated and unstimulated V1 of the non-transfected rat did not show phase synchrony.
Figure 11.
Instantaneous phase of the ECoG from Ch1-left and Ch2-right channels of (a) rat #2, (b) rat #3, and (c) non-transfected rat, within 1~40 Hz band and 1s time window, with stimulation markers. The dashed line indicates the phase locking period.
3.3. Visual Stimulation
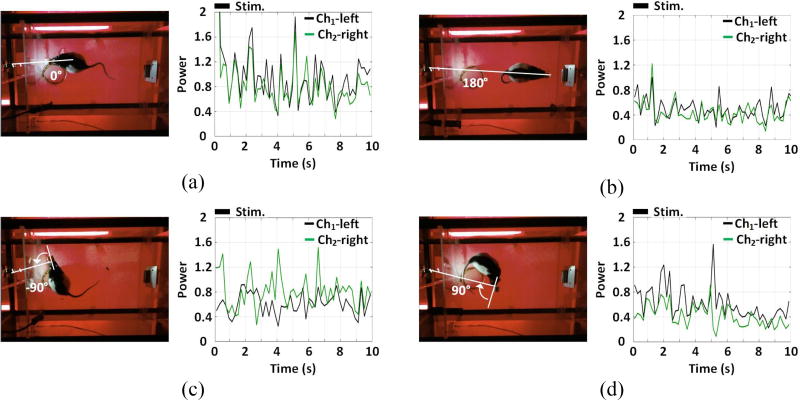
Two-channel ECoG recordings in each trial were converted to the corresponding time-varying power by integrating the normalized PSD in 1~40 Hz band at every time point, compared against one another. Figure 12 shows the ECoG power of each channel when rat #4 had VA of 0°, 180°, −90°, and 90° to visualize all possible comparisons between ECoG power results from the two channels. The relative positioning of the rat’s eyes to the external LED is almost unchanged during the 1s stimulation pulse. The inter-channel difference of ECoG power is not visible at 0° (figure 12(a)) and 180° (figure 12(b)). The ECoG signals of both channels at 0° VA, however, show higher power than that at 180° VA. At VA = −90° in figure 12(c), the ECoG power of Ch2-right V1 is stronger than that of Ch1-left, while the ECoG power of Ch1-left is higher than Ch2-right at VA = 90° in figure 12(d).
Figure 12.
Time-varying ECoG power from Ch1-left and Ch2-right channels in a single trial at visual angles of (a) VA = 0°, (b) VA = 180°, (c) VA = −90°, and (d) VA = 90°, within 1~40 Hz band and 10 s time window, with stimulation markers.
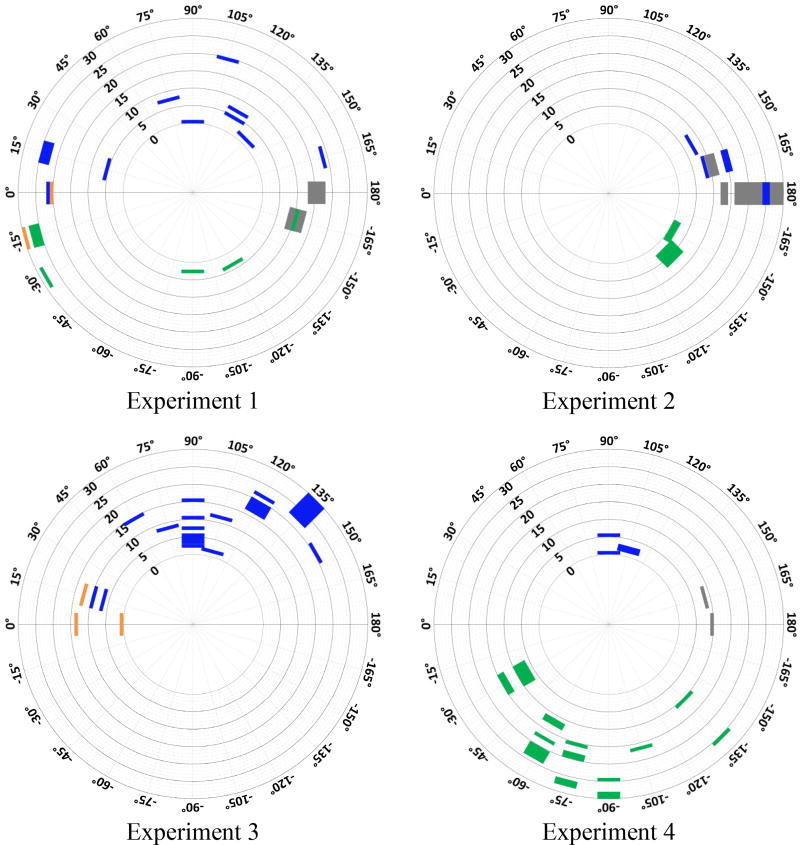
In figure 13, we have divided the ECoG from four consecutive experiments into four categories based on their power variances and labeled by different colors, grey: low ECoG power in both channels, orange: high ECoG power in both channels, blue: higher ECoG power in Ch1-left, green: higher ECoG power in Ch2-right. For each experiment, the color-coded comparison for each trial placed on a circular map, which orientation and radius correspond with the manually observed VA from the homecage top view (see figure 5(d)) and trial number, respectively. By applying the nonparametric Wilcoxon signed rank test (α=0.05), it was observed that blue and green were found mainly in the VA ranges of 30°~150° and −30°~−150°, respectively, with both p < 0.05. Orange was not observed within VA range of −165°~165°, while gray did not appear within VA range of −15°~15°. Our conclusion is that the difference between ECoG power levels from left and right channels could be caused by different amounts of light entering the subject eyes. Expectedly, the difference between ECoG power levels become smaller and less predictable when VA falls within −165°~165° and −15°~15°, in which both eyes are likely receive similar amounts of light when the LED is on.
Figure 13.
Comparing ECoG power in each trial in experiments 1~4, marked based on VA (orientation) and trial number (radius). Grey: low ECoG power in both channels, Orange: high ECoG power in both channels. Blue: higher ECoG power in Ch1-left. Green: higher ECoG power in Ch2-right.
4. Discussion
To reduce the constraint imposed by conventional laser-based optical systems, particularly on small freely behaving animals, we have developed the WOENI device. While this work is primarily focused on the neural excitation, the wide selection of the µLEDs at various wavelengths makes it easy to switch to red, yellow, or a mix of these colors for applications in neural inhibition. The headstage, built by COTS, is cost-effective and easily to implement. Since the back-end BLE system is capable of independently controlling multiple headstages, it is possible to perform experiments on multiple interacting animals, housed together. The polyimide substrate design can be expanded up to 32 µLEDs and 32 microelectrodes, following the design in [9]. The headstage can also be modified accordingly to support all µLEDs and microelectrodes. To achieve reasonable size, weight, and wireless link bandwidth in a 32-ch headstage, an application-specific integrated circuit (ASIC) solution needs to be employed similar to what we have demonstrated in [45].
Other efforts on developing wireless LED-based optical system are summarized in table 2. Compared with [23–26], the key advantage of this design is the ability to simultaneously apply optical stimulation and continue electrophysiological recording as feedback, allowing for bi-directional optical neuromodulation. While the system in [20] can apply multichannel neural recording and optical stimulation, it was only tested on an anesthetized rat, and its feasibility experiments on freely behaving animals is still unclear. The functionality of the WOENI device was evaluated in vivo on freely behaving rats. In the case of optical stimulation on V1, immunostained tissue-based and ECoG signal-based proofs were achieved from the comparison between the transfected and non-transfected rats, and between the stimulated and unstimulated V1. Significant increases in c-Fos expression, ECoG variation, ECoG power, and phase synchronization were observed on the stimulated V1 of the transfected rats. However, the light-evoked phenomenon did not occur on the non-transfected rat and the difference between the left and right V1 in terms of c-Fos expression and ECoG signals were also negligible. In the case of visual stimulation on a freely behaving rat, a well-documented study [39] was also repeated, where ECoG signal from a given side of V1 was evoked when the opposite half of visual field receives stimuli. The in vivo experimental results match with expectations and therefore can prove the functionality of the proposed device.
Table 2.
Benchmarking of the wireless µLED-based neural interface systems
| Parameters | [20] | [23] | [24] | [25] | [26] | This work |
|---|---|---|---|---|---|---|
| Technology | COTS | COTS | COTS | COTS | COTS | COTS |
| Power source | Battery | Battery | Battery | Battery | Battery | Battery |
| Standby power | 119 mW | NA | NA | NA | NA | 42 mW |
| No. of stim. | 32-ch, 1-ch (test) | 2 channels | 1 channel | 2/3 channels | 4 channels | 4 channels |
| Stim. current | 150 mA | 20 mA | 25 mA | 20 mA | NA | 30 mA |
| No. of recording | 32-ch, 8-ch (test) | NA | NA | NA | NA | 2 channels |
| Data link | 2.4 GHz RF transceiver | 2.4 GHz RF transceiver | 2.4 GHz RF transceiver | Infrared interrogation | Infrared interrogation | 2.4 GHz RF transceiver |
| Device size | 18×17×10 mm3 w/o BAT | 14×17×5 mm3 w/ BAT | 12×11×7 mm3 w/ BAT | 14×14×10 mm3 w/ BAT | NA | 15×20×20 mm3 w/ BAT |
| Device weight | 4.9 g w/ BAT | 2.9 g w/BAT | 1.6 g w/BAT | 2.4 g w/BAT | 1.8 g w/BAT | 5.5 g w/BAT |
| Animal subject | Rat | Mouse | Mouse | Mouse | Mouse | Rat |
| Freely moving | No | Yes | Yes | Yes | Yes | Yes |
| Implant duration | NA | 41 days | >5 days | NA | >1 week | 21 days |
The highly replicable ECoG analysis results, under two types of optical stimulation, during four conservative experiments within 21 days demonstrate the stability of the proposed device, which is critical for chronic studies. The evoked-to-spontaneous ECoG ratio reduced by ~15% in both rats over four experiments, which could be linked to glial cell and scar formation, inflammation, and mechanically induced trauma as a result of impedance mismatch between implanted devices and soft brain tissue [1, 46–48]. The light-evoked ECoG, however, was still distinguishable from the spontaneous ECoG, implying the efficacy of the optical stimulation and ECoG recording up to 21 days after implantation. Nevertheless, further longer-term studies with small freely behaving animals need to be conducted with follow up histological analysis to fully characterize the new interface.
While the size and weight of the current headstage were tailored for the rat model, the same concept can be used to design the headstage for mice. Moreover, there is always a compromise between the size/weight of the battery and uninterrupted duration of experiments. Currently, we are developing the next generation headstage, which can be inductively powered in the EnerCage-HC2 system [36, 49, 50], to support experiments with unlimited duration on both rats and mice. The new headstage will use an ASIC, which is more costly to develop than the current version that only uses COTS components.
5. Conclusion
The WOENI device, equipped with optical stimulation and ECoG recording for bi-directional neuromodulation, has been presented. The wireless data transmission link between the headstage and a USB dongle, ensures remote control of the headstage, resulting in an untethered system with a low risk of biasing the animal behavior. The functionality of the WOENI device has been demonstrated in vivo by applying cortical optical stimulation and visual stimulation on freely behaving rats. Moreover, the consistency of in vivo results observed in four consecutive experiments, evenly distributed over 21-days post-implantation, can validate the stability and utility of the WOENI device.
Acknowledgments
This work is supported in part by the National Science Foundation (NSF) awards ECCS-1407880 and the National Institutes of Health (NIH) award 1R21EB018561.
References
- 1.Fan B, Li W. Miniaturized optogenetic neural implants: a review. Lab on a Chip. 2015;15:3838–3855. doi: 10.1039/c5lc00588d. [DOI] [PubMed] [Google Scholar]
- 2.Mohanty SK, Lakshminarayananan V. Optical techniques in optogenetics. J. Modern Optics. 2015;62:949–970. doi: 10.1080/09500340.2015.1010620. [DOI] [PMC free article] [PubMed] [Google Scholar]
- 3.Lebedev M. Brain-machine interfaces: an overview. Translational Neuroscience. 2014;5:99–110. [Google Scholar]
- 4.Pashaie R, Baumgartner R, Richner TJ, et al. Closed-loop optogenetic brain interface. IEEE Transactions on Biomedical Engineering. 2015;62:2327–2337. doi: 10.1109/TBME.2015.2436817. [DOI] [PubMed] [Google Scholar]
- 5.Cogan SF. Neural stimulation and recording electrodes. Annu. Rev. Biomed. Eng. 2008;10:275–309. doi: 10.1146/annurev.bioeng.10.061807.160518. [DOI] [PubMed] [Google Scholar]
- 6.Butovas S, Schwarz C. Spatiotemporal effects of microstimulation in rat neocortex: a parametric study using multielectrode recordings. Journal of neurophysiology. 2003;90:3024–3039. doi: 10.1152/jn.00245.2003. [DOI] [PubMed] [Google Scholar]
- 7.Gilja V, Chestek CA, Diester I, Henderson JM, Deisseroth K, Shenoy V. Challenges and opportunities for next-generation intracortically based neural prostheses. IEEE Trans. Biomed. Eng. 2011;58:1891–1899. doi: 10.1109/TBME.2011.2107553. [DOI] [PMC free article] [PubMed] [Google Scholar]
- 8.Rivnay J, Wang H, Fenno L, Deisseroth K, Malliaras GG. Next-generation probes, particles, and proteins for neural interfacing. Science Advances. 2017;3:e1601649. doi: 10.1126/sciadv.1601649. [DOI] [PMC free article] [PubMed] [Google Scholar]
- 9.Kwon KY, Sirowatka B, Weber A, Li W. Opto-µECoG array: A hybrid neural interface with transparent µECoG electrode array and integrated LEDs for optogenetics. IEEE transactions on biomedical circuits and systems. 2013;7:593–600. doi: 10.1109/TBCAS.2013.2282318. [DOI] [PubMed] [Google Scholar]
- 10.Goncalves SB, Ribeiro JF, Silva AF, Costa RM, Correia JH. Design and manufacturing challenges of optogenetic neural interfaces: a review. Journal of Neural Engineering. 2017;14 doi: 10.1088/1741-2552/aa7004. [DOI] [PubMed] [Google Scholar]
- 11.LeChasseur Y, Dufour S, Lavertu G, Bories C, Deschênes M, Vallée R, De Koninck Y. A microprobe for parallel optical and electrical recordings from single neurons in vivo. Nature methods. 2011;8:319–325. doi: 10.1038/nmeth.1572. [DOI] [PubMed] [Google Scholar]
- 12.Dufour S, Lavertu G, Dufour-Beauséjour S, et al. A multimodal micro-optrode combining field and single unit recording, multispectral detection and photolabeling capabilities. PloS one. 2013;8:e57703. doi: 10.1371/journal.pone.0057703. [DOI] [PMC free article] [PubMed] [Google Scholar]
- 13.Wang J, Wagner F, Borton DA, et al. Integrated device for combined optical neuromodulation and electrical recording for chronic in vivo applications. Journal of neural engineering. 2011;9:016001. doi: 10.1088/1741-2560/9/1/016001. [DOI] [PubMed] [Google Scholar]
- 14.Tamura K, Ohashi Y, Tsubota T, et al. A glass-coated tungsten microelectrode enclosing optical fibers for optogenetic exploration in primate deep brain structures. Journal of neuroscience methods. 2012;211:49–57. doi: 10.1016/j.jneumeth.2012.08.004. [DOI] [PubMed] [Google Scholar]
- 15.Aravanis AM, Wang LP, Zhang F, Meltzer LA, Mogri MZ, Schneider MB, Deisseroth K. An optical neural interface: in vivo control of rodent motor cortex with integrated fiberoptic and optogenetic technology. Journal of neural engineering. 2007;4:S143. doi: 10.1088/1741-2560/4/3/S02. [DOI] [PubMed] [Google Scholar]
- 16.Grill WM, Norman SE, Bellamkonda RV. Implanted neural interfaces: biochallenges and engineered solutions. Annual review of biomedical engineering. 2009;11:1–24. doi: 10.1146/annurev-bioeng-061008-124927. [DOI] [PubMed] [Google Scholar]
- 17.Donoghue JP. Bridging the brain to the world: a perspective on neural interface systems. Neuron. 2008;60:511–521. doi: 10.1016/j.neuron.2008.10.037. [DOI] [PubMed] [Google Scholar]
- 18.Mohanty SK, Thakor NV. Optogenetics: optical methods for cellular control. In Proc. of SPIE. 2013;8586:858601–1. [Google Scholar]
- 19.McCall JG, Kim TI, Shin G, et al. Fabrication and application of flexible, multimodal light-emitting devices for wireless optogenetics. Nature protocols. 2013;8:2413–2428. doi: 10.1038/nprot.2013.158. [DOI] [PMC free article] [PubMed] [Google Scholar]
- 20.Gagnon-Turcotte G, LeChasseur Y, Bories C, Messaddeq Y, Koninck DY, Gosselin B. A wireless headstage for combined optogenetics and multichannel electrophysiological recording. IEEE transactions on biomedical circuits and systems. 2017;11:1–14. doi: 10.1109/TBCAS.2016.2547864. [DOI] [PubMed] [Google Scholar]
- 21.Gagnon-Turcotte G, Kisomi AA, Ameli R, et al. A wireless optogenetic headstage with multichannel electrophysiological recording capability. Sensors. 2015;15:22776–22797. doi: 10.3390/s150922776. [DOI] [PMC free article] [PubMed] [Google Scholar]
- 22.Gagnon-Turcotte G, LeChasseur Y, Bories C, Koninck DY, Gosselin B. An optimized adaptive spike detector for behavioural experiments. IEEE International Symposium on Circuits and Systems (ISCAS) 2016:1098–1101. [Google Scholar]
- 23.Rossi MA, Go V, Murphy T, Fu Q, Morizio J, Yin HH. A wirelessly controlled implantable LED system for deep brain optogenetic stimulation. Frontiers in integrative neuroscience. 2015;9 doi: 10.3389/fnint.2015.00008. [DOI] [PMC free article] [PubMed] [Google Scholar]
- 24.Lee ST, Williams PA, Braine CE, Lin DT, John SW, Irazoqui PP. A miniature, fiber-coupled, wireless, deep-brain optogenetic stimulator. IEEE Transactions on Neural Systems and Rehabilitation Engineering. 2015;23:655–664. doi: 10.1109/TNSRE.2015.2391282. [DOI] [PubMed] [Google Scholar]
- 25.Hashimoto M, Hata A, Miyata T, Hirase H. Programmable wireless light-emitting diode stimulator for chronic stimulation of optogenetic molecules in freely moving mice. Neurophotonics. 2014;1:011002–011002. doi: 10.1117/1.NPh.1.1.011002. [DOI] [PMC free article] [PubMed] [Google Scholar]
- 26.Jeong JW, McCall JG, Shin G, et al. Wireless optofluidic systems for programmable in vivo pharmacology and optogenetics. Cell. 2015;162:662–674. doi: 10.1016/j.cell.2015.06.058. [DOI] [PMC free article] [PubMed] [Google Scholar]
- 27.Plexon headstages for multichannel neuronal recording, [Online] Available: http://www.plexon.com/products/headstages.
- 28.EiCOM, Optogenetics, [Online] Available: https://www.eicomusa.com/teleopto/
- 29.Triangle Biosystems Inc., [Online] Available: http://www.trianglebiosystems.com/inductive-power.html.
- 30.Park SI, Brenner DS, Shin G, et al. Soft, stretchable, fully implantable miniaturized optoelectronic systems for wireless optogenetics. Nature biotechnology. 2015;33:1280–1286. doi: 10.1038/nbt.3415. [DOI] [PMC free article] [PubMed] [Google Scholar]
- 31.Montgomery KL, Yeh AJ, Ho JS, et al. Wirelessly powered, fully internal optogenetics for brain, spinal and peripheral circuits in mice. Nature methods. 2015;12:969–974. doi: 10.1038/nmeth.3536. [DOI] [PMC free article] [PubMed] [Google Scholar]
- 32.Simpson J, Kelly J. The impact of environmental enrichment in laboratory rats-behavioural and neurochemical aspects. Behavioural Brain Research. 2011;222:246–264. doi: 10.1016/j.bbr.2011.04.002. [DOI] [PubMed] [Google Scholar]
- 33.Brauner A, Kurjiaka D, Ibragimov A, Baldwin A. Imapct of cage size and enrichment (tube and shelf) on heart rate variability in rats. Science. 2010;37 [Google Scholar]
- 34.Jia Y, Khan W, Lee B, Fan B, Guo Y, Madi F, Weber AJ, Li W, Ghovanloo M. A Wireless opto-electro neural interface for experiments with small freely-behaving animals. IEEE Biomedical Circuits and Systems Conference (BioCAS) 2017 doi: 10.1088/1741-2552/aac810. [DOI] [PMC free article] [PubMed] [Google Scholar]
- 35.Jia Y, Wang Z, Mirbozorgi SA, Ghovanloo M. A closed-loop wireless homecage for optogenetic stimulation experiments. IEEE Biomedical Circuits and Systems Conference (BioCAS) 2015 [Google Scholar]
- 36.Jia Y, Mirbozorgi SA, Wang Z, Hsu CC, Madsen T, Rainnie D, Ghovanloo M. Position and orientation insensitive wireless power transmission for EnerCage-Homecage system. IEEE Transactions on Biomedical Engineering. 2017;64:2439–2449. doi: 10.1109/TBME.2017.2691720. [DOI] [PMC free article] [PubMed] [Google Scholar]
- 37.Parylene Conformal Coating Specifications & Properties [Online] Available: http://scscoatings.com.
- 38.Jeong YS, Ratier B, Moliton A, Guyard L. UV-visible and infrared characterization of poly(p-xylylene) films for waveguide applications and OLED encapsulation. Synthetic Metals. 2002;127:189–193. [Google Scholar]
- 39.Hubel DH. Eye, brain, and vision. Scientific American Library/Scientific American Books 1995 [Google Scholar]
- 40.Chonux, Chronux Analysis Software [Online] Available at: http://chronux.org/
- 41.Stark E, Koos T, Buzsáki G. Diode probes for spatiotemporal optical control of multiple neurons in freely moving animals. Journal of neurophysiology. 2012;108:349–363. doi: 10.1152/jn.00153.2012. [DOI] [PMC free article] [PubMed] [Google Scholar]
- 42.Castagnola E, Ansaldo A, Maggiolini E, et al. Smaller, softer, lower-impedance electrodes for human neuroprosthesis: a pragmatic approach. Frontiers in neuroengineering. 2014;7 doi: 10.3389/fneng.2014.00008. [DOI] [PMC free article] [PubMed] [Google Scholar]
- 43.Leuthardt EC, Schalk G, Wolpaw JR, et al. A brain–computer interface using electrocorticographic signals in humans. Journal of neural engineering. 2004;1:63–71. doi: 10.1088/1741-2560/1/2/001. [DOI] [PubMed] [Google Scholar]
- 44.Le Van Quyen M, Foucher J, Lachaux JP, et al. Comparison of Hilbert transform and wavelet methods for the analysis of neuronal synchrony. Journal of neuroscience methods. 2001;111:83–98. doi: 10.1016/s0165-0270(01)00372-7. [DOI] [PubMed] [Google Scholar]
- 45.Lee B, Koripalli MK, Jia Y, Acosta J, Sendi M, Choi Y, Ghovanloo M. An implantable peripheral nerve recording and stimulation system for experiments on freely moving animal subjects. Scientific Reports. 2018;8:6115. doi: 10.1038/s41598-018-24465-1. [DOI] [PMC free article] [PubMed] [Google Scholar]
- 46.Subbaroyan J, Martin DC, Kipke DR. A finite-element model of the mechanical effects of implantable microelectrodes in the cerebral cortex. Journal of neural engineering. 2005;2:103. doi: 10.1088/1741-2560/2/4/006. [DOI] [PubMed] [Google Scholar]
- 47.Polikov VS, Tresco PA, Reichert WM. Response of brain tissue to chronically implanted neural electrodes. Journal of neuroscience methods. 2005;148:1–18. doi: 10.1016/j.jneumeth.2005.08.015. [DOI] [PubMed] [Google Scholar]
- 48.Harris JP, Capadona JR, Miller RH, et al. Mechanically adaptive intracortical implants improve the proximity of neuronal cell bodies. Journal of neural engineering. 2011;8:066011. doi: 10.1088/1741-2560/8/6/066011. [DOI] [PMC free article] [PubMed] [Google Scholar]
- 49.Jia Y, Mirbozorgi SA, Lee B, Khan W, Madi F, Weber AJ, Li W, Ghovanloo M. A mm-Sized Free-Floating Wirelessly Powered Implantable. IEEE International Solid-State Circuits Conference (ISSCC) 2017:468–470. doi: 10.1109/TBCAS.2019.2918761. [DOI] [PMC free article] [PubMed] [Google Scholar]
- 50.Mirbozorgi SA, Jia Y, Canales D, Ghovanloo M. A wirelessly-powered homecage with segmented copper foils and closed-loop power control. IEEE Transactions on Biomedical Circuits and Systems. 2016;10:979–989. doi: 10.1109/TBCAS.2016.2577705. [DOI] [PMC free article] [PubMed] [Google Scholar]


