

Abstract
Objective:
To describe the trajectory of patient and caregiver mental health from diagnosis through the first year of treatment for pediatric cancer and assess whether rates of clinically relevant symptoms were elevated compared to norms. We examined mean levels of internalizing and externalizing symptoms and post-traumatic stress symptoms (PTSS) in children with cancer, and depression, anxiety and PTSS in caregivers through in the first year of treatment; the proportion of patients and caregivers that scored in the clinical range at each time point; the typical trajectory of symptoms in patients and caregivers and whether trajectories differed between individuals.
Method:
Families (N=159) of children newly diagnosed with cancer (Mage=5.6 years; range=2–18 years) participated in a short-term prospective study. Primary caregivers provided monthly reports of their own and their child’s psychological adjustment.
Results:
On average, children were well adjusted. However, compared to norms there was a higher than expected proportion of children with clinically relevant internalizing symptoms around the time of diagnosis. On average children’s symptoms declined over time, though variability was observed. Caregivers were less well-adjusted on average, with a high proportion reporting clinically relevant symptoms over time for depression and anxiety. Caregiver symptoms also declined over time, though considerable variability was observed.
Conclusion:
While most children remain well-adjusted during the first year of treatment, many caregivers experience clinically-relevant symptoms of psychological distress. Implications for development of interventions targeting at-risk patients and caregivers are discussed. Identifying processes that predict between-family variability in trajectories of psychopathology is an important next step.
Childhood cancer is a stressful experience for both the patient and their caregivers, and there has been increased interest in the degree to which children and caregivers experience adverse psychological symptoms. Among long-term survivors of pediatric cancer, some studies suggest that on average children are similar to their peers in terms of psychological maladjustment (Wechsler & Sanchez-Iglesias, 2012). However, consistent evidence has also shown that a subset of approximately 25–30% of children with cancer continue to show psychological distress over time (Furlong et al, 2012; Kupst et al, 2005; Pai et al, 2007; Schulz et al., 2007).
Fewer studies have examined psychological adjustment among children soon after diagnosis or during active treatment. Among those that have, there are mixed findings regarding children’s psychological adjustment. In a meta-analysis, Pinquart & Shen (2011) reported moderately elevated levels of internalizing but not externalizing symptoms in children with cancer compared to normative samples (Pinquart & Shen, 2011). In a prospective study of anxiety, depression and behavior problems in children with acute lymphoblastic leukemia, Myers et al (2014) reported that mean scores for parental report of anxiety, depression, aggression and hyperactivity were similar to population norms, however, the frequency of depression scores in the at-risk or clinically significant range was greater than expected based on population norms at 1, 6 and 12 months post-diagnosis. The frequency of anxiety scores in the at-risk or clinically significant range was greater than expected based on population norms at 1 month after diagnosis but reverted to expected levels at 6 and 12 months post diagnosis. For a subset of these children, high initial levels of distress did not dissipate over time. Kunin-Batson et al (2016) reported that at 3 months post-treatment, approximately 24% of survivors of acute lymphoblastic leukemia had at-risk or clinically elevated anxiety scores and 28% had elevated depression scores, which are significantly higher than the expected 15% based on population norms and similar to the rates observed near the time of diagnosis. Taken together, these data provide emerging evidence that while average levels of child anxiety and depression are no different than population norms, a significant subset of children show sub-clinical or clinical levels of depression throughout the first year of treatment and sub-clinical or clinical levels of anxiety at the initial stage of diagnosis.
Psychological adjustment has also been examined in parents of children with cancer during the first year post-diagnosis. Symptoms of anxiety and depression in parents appear to be most frequent around the time of diagnosis (Compas et al., 2015; Allen, Newman & Souhami, 1997; Yeh, 2002; Santacroce, 2002). For example, Compas et al (2015) reported that 29% of mothers and 13% of fathers of children with recently diagnosed cancer reported moderate-to-severe levels of depressive symptoms. Parents of children newly diagnosed or in active treatment reported more anxious and depressive symptoms than parents of children off active therapy (Yeh, 2002, Santacroce, 2002; Von Essen, Sjoden & Mattsson, 2004). Studies of post-traumatic stress disorder (PTSD) and post-traumatic symptoms stress symptoms (PTSS) among caregivers of children with cancer report conflicting findings that in part vary depending on the criteria used for determining cutoff scores. Phipps and colleagues (2014) reported low rates of current and lifetime PTSD in parents of children on active treatment compared to controls. Similarly, parents of children on active treatment endorsed similar levels of PTSS as control parents (Jurbergs, Long, Ticona, & Phipps, 2009; Phipps et al, 2015). Dunn et al (2012) reported that 11% of mothers and 9% of fathers of children newly diagnosed with cancer met modified diagnostic criteria for PTSD, while 41% of mothers and 30% of fathers had elevated levels of PTSS. Other studies report similarly high levels of PTSS in caregivers of children with cancer. For example, Kazak and colleagues (2005) reported that approximately 68% of mothers and 57% of fathers of children currently in treatment report post-traumatic stress symptoms (PTSS) in the moderate to severe range. Parents of children recently diagnosed or currently in treatment report higher rates of both PTSS and post-traumatic stress disorder (PTSD) compared to parents of childhood cancer survivors (Kazak et al, 2004, 2005; Lindahl-Norberg, Lindblad & Boman, 2005; Phipps, Long, Hudson & Rai, 2005; Santacroce, 2002). Taken together, data on psychological adjustment in caregivers suggests that anxiety and depression are most elevated at the time of diagnosis, few caregivers meet criteria for PTSD but a significant subset of caregivers show elevated rates of PTSS.
In studies of child and caregiver psychological adjustment, it is important not only to determine whether distress is elevated but also the degree to which distress is rising to the level of clinical concern. Substantial variability exists between studies regarding the percentage of caregivers exhibiting significant or clinically relevant levels of psychological distress. Among studies of depressive symptoms in parents of children on active treatment, estimates range from 14% - 65% for mothers, and 9% - 50% for fathers (Allen et al., 1997; Barrera et al., 2004; Bonner et al., 2007; Compas et al, 2015; Frank et al., 2001; Iqbal & Siddiqui, 2002). While fewer studies have examined clinically relevant anxiety symptoms, those that do have also reported estimates ranging from 5% - 50% across caregivers (Bonner et al., 2007; Frank et al., 2001). Finally, in studies of PTSS and PTSD, estimates span a large range from about 1.6% - 80% across caregivers (Dunn et al, 2012; Fuemmeler et al., 2001; Kazak et al., 2005; Kazak et al., 2004a, Nam, Warner, Morreall, Kirchhoff, Kinney & Fluchel, 2016; Norberg et al., 2005b; Phipps et al, 2015). Variability in percentages of psychological distress may be due to differences in operationalization of distress and timing of assessment, as symptoms may reduce with time since diagnosis (Pai et al., 2007). Frequent assessments during active treatment using measures that specify clinical cut-offs are needed to gain a cohesive understanding of what proportion of caregivers experience clinically relevant distress and what proportion continue to experience high distress over time.
Studies to date have several methodological and conceptual limitations. First, many studies are cross-sectional and among those that are prospective (e.g., Barrera et al., 2003; Kunin-Batson et al, 2016; Myers et al, 2014; Sawyer et al., 2000), there is variability in the timing of assessment after diagnosis. As such, it is possible that findings to date do not fully capture the range of distress experienced after diagnosis and during treatment. Additionally, prospective studies typically include two or three assessment points, which does not allow for a clear understanding of fluctuations in adjustment over time or identify key time points for intervention (Drotar, 1994). Longitudinal follow up assessments also vary in time from 1 week to more than 7-years post-treatment with an average of 22 months (Robinson, 2007), making it difficult to compare results across studies and understand trajectories over time.
Second, most studies provide little descriptive information about child and parent distress over the first year of treatment. While a general decline in parental psychological distress has been observed (Pai et al, 2007), there is less information about the temporal course of distress over the first year of treatment (for exceptions, see Kunin-Batson et al, 2016 and Myers et al., 2014). The first year of treatment is a particularly vulnerable time, and there may be key time points that are associated with increases in psychological distress. Understanding both the typical trajectory of psychological distress over the first year of treatment, as well as variability in trajectories, can help us identify which family members are at greatest risk and build interventions that target at risk individuals as they face the challenges of a cancer diagnosis.
Third, studies to date have predominantly relied on auto-regressive statistical methods (i.e. multiple regression, cross-lagged panel models) to examine change in average levels of symptoms over time. Autoregressive models do not provide information about average change within individuals over time, only how rank order at one point is related to rank order at the next. Conversely, growth curve models (Bollen & Curran, 2006) such as Hierarchical Linear Models (HLM) confer substantial advantages over autoregressive models for longitudinal analysis by providing description of the average trajectory of within-person change, allowing for assessment of non-linear change trajectories, and estimating between-person differences in within-person change (or the degree to which individual adjustment trajectories differ from one another). Research employing growth curve models can help us develop a comprehensive understanding of the average trajectory of psychological adjustment and variability in this trajectory among children with cancer and their parents immediately after diagnosis and during the first year of active treatment.
In the current paper, we describe the trajectory of child and caregiver psychological adjustment beginning around the time of diagnosis through the first year of treatment. Monthly assessments of child and caregiver anxiety, depression, and PTSS were obtained. Growth curve models using an HLM approach were used to describe the trajectory of psychological adjustment for children and caregivers. Three main questions were addressed: (1) What is the average level of child and caregiver anxiety, depression and PTSS at each time point in the first year of treatment, (2) What proportion of children and caregivers fall into the clinical range of anxiety, depression and PTSS at each time point, and what proportion of children and caregivers remain in the clinical range over time?, and (3) What is the typical trajectory of child and caregiver anxiety, depression and posttraumatic stress symptoms during the first year of treatment, and to what degree is there between-person variability in these trajectories? We hypothesized that psychological distress would be highest at diagnosis for both children and caregivers, with symptoms decreasing over time. Because of the absence of reliable estimates, specific hypotheses were not made regarding the proportion of children and caregivers in the clinical range of psychological distress.
Method
Participants.
One hundred and fifty-nine families participated in the present study. Children were aged 2–18 (M = 6.3 years, SD = 3.5 years, 49% male) and had been recently diagnosed with cancer. Though children aged 2–10 years comprised the majority of the sample, 19 adolescents were also included. Families were asked to identify the primary and secondary caregiver for the child with cancer. Most families identified the primary caregiver as the mother (85.5%), and the secondary caregiver as the father (77.0%). Among caregivers, 78.3% were married, and families had 2.4 children on average (SD = .91). The majority of children were identified by the primary caregiver as White/Caucasian (84.1%) followed by Black/African American (5.6%). Regarding cancer diagnosis, the majority of children were diagnosed with leukemia (32.8%) followed by lymphoma (12.6%), with 18.5% of the children having been diagnosed with a Central Nervous System (CNS) tumor.
Procedures
Participants were recruited as part of a larger study from two children’s hospitals in urban areas of the Northwest and Southeast United States. Families were approached within two weeks since diagnosis. Families were considered eligible if they were English-speaking, the child had no history of developmental delay, and current caregivers were the same as prior to the child’s diagnosis. Children with Neurofibromatosis Type 1 (NF1), relapsed cancer, or secondary malignancies were not eligible. Of 502 eligible families across both sites, 309 were approached, 176 enrolled, and 159 completed at least one study component. Systematic differences were assessed between approached families who enrolled vs. declined based on child age, gender, and diagnosis. Based on two-sided binomial exact tests, families who declined were more likely to have a child with a neuroblastoma (9% vs. 4%, p = .02) and a child who was male (65% vs. 46%, p = .01). Based on a T-test, no differences were found between groups on child age (t (230)= 1.20, p = .23). Families were recruited through brochures provided by their physician or nurse, after which they could consent to be approached in-person or by phone by a member of the study team. Brochures stated that the study was “examining family functioning in the year following a child’s cancer diagnosis”, and provided information regarding confidentiality and payment for participation. Common reasons eligible families were not approached were that they did not consent to be approached because they felt too overwhelmed, they had been recruited to another study, or physicians were unable to or did not approve of approach within the study window. Of the families approached who did not enroll, common reasons for refusal were due to either excessive time required or no reason was given. IRB approval was received from the University of Washington, Seattle Children’s Hospital, and Vanderbilt University for all study procedures.
Data were collected over a 12-month period beginning with a questionnaire packet distributed at the time of consent, followed by monthly questionnaire packets distributed through the mail. All families remained eligible through the course of the study, and no children died while on study. Packets were completed by primary caregivers, yielding 12 points of measurement. Primary caregivers completed 6.8 packets on average. After the initial packet, the highest proportion of primary caregivers were retained at Month 6 (67.5%), and the lowest at Month 2 (5%). Number of completed packets was not associated with any demographic variables, and no relationship was found between initial symptom scores and amount of missing data over the study period across all adjustment measures.
Measures
Child anxiety/depression symptoms.
Symptoms of anxiety and depression in children was measured via primary caregiver report using the Child Behavior Checklist (CBCL; Achenbach, 1991), a well-validated measure of child functioning. Caregivers rated the frequency of symptoms within the past month. Caregivers of children ages 2 to 5 completed the preschool form, and caregivers of children ages 6 to 18 completed the school-age form. T-scores normed for child age and gender were used. Because evidence suggests that use of somatic complaints T-score may be problematic with chronically ill populations (Perrin, Stein & Drotar, 1991), only the anxious/depressed T-score was used to assess internalizing symptoms. This syndrome scale has a cut score of 65, with respondents scoring 65–69 considered in the borderline clinical range (≥ 93rd percentile), and those with scores ≥70 considered in the clinical range (≥ 97th percentile; Achenbach & Rescorla, 1991).
Child externalizing symptoms.
Symptoms of externalizing in children were also measured via primary caregiver report using the CBCL. Caregivers rated the frequency of symptoms within the past month. The externalizing symptoms factor score is comprised of gender and age normed syndrome scales of rule-breaking and aggressive behavior. This scale has a cut score of 60, with respondents scoring 60–63 considered in the borderline clinical range (≥ 83rd percentile), and those with a score of 64 or higher in the clinical range (≥ 90th percentile; Achenbach & Rescorla, 1991).
Child post-traumatic stress symptoms.
Post-traumatic stress symptoms (PTSS) were assessed via primary caregiver report using the UCLA Posttraumatic Stress Disorder Reaction Index (UCLA PTSD-RI; Steinberg et al., 2004). This 21-item questionnaire assesses trauma exposure and post-traumatic stress symptoms in children within the past month, and yields an overall symptom severity score ranging from 0–68. A cut-score of 40 or greater has been used to indicate severe symptoms for which a clinical PTSD diagnosis may be likely (Cloitre et al., 2009). Reliability was high over the course of the study, with Cronbach’s alpha ranging from .82-.91, with an average of .87 across the twelve time points.
Caregiver depressive symptoms.
Depression was measured via self-report using the shortened form of the Center for Epidemiological Studies Depression Scale (CESD-10; Andresen, Malmgren, Carter, & Patrick, 1994;). The CESD-10 has strong predictive accuracy compared to the original CES-D (Radloff, 1977). This 10-item self-report scale asks caregivers to rate the frequency of symptoms within the past month, yielding a total sum score. Scores range from 0–30, with higher scores representing more frequent symptoms. While this measure is not intended for use as a diagnostic tool, respondents with a score of ≥10 are considered at risk for clinical depression (Andresen et al., 1994). In our sample, reliability was high, with Cronbach’s alpha ranging from .83 to .91, with an average of .87 across the twelve time points.
Caregiver anxiety symptoms.
Symptoms of anxiety in primary caregivers were measured via self-report using the anxiety subscale of the Depression, Anxiety, and Stress Scale (DASS; Lovibond & Lovibond, 1995). This 7-item subscale assesses frequency of anxiety symptoms in the past month, yielding a possible total score ranging from 0 to 21, with higher scores indicating more frequent symptoms. Norms for this scale in a non-clinical sample suggest an average score of 1.88 (SD = 2.95). Because no pre-specified clinical cut-off exists for this measure, scores were compared to norms in a non-clinical sample (Henry & Crawford, 2005). As a score of 3 was considered to be the 79th percentile, we specified clinically relevant symptoms as those that were greater than this cut-off. In our sample, reliability was acceptable, with Cronbach’s alpha ranging from .73 - .88, with an average of .84 across the twelve time points.
Caregiver post-traumatic stress symptoms.
PTSS was measured via self-report using the Impact of Events Scale – Revised (IES-R; Weiss & Marmar, 1997). This 22-item scale assesses traumatic stress symptoms within the past month and provides an overall distress score ranging from 0–88, and categorizes symptoms as mild (13–35), moderate (36–61), or severe (62+). For the current study, two methods were used to assess clinically relevant symptoms: (1) caregivers with overall PTSS distress scores in the moderate and severe ranges (those ≥ 36) were considered to have clinically relevant symptoms; and (2) modified diagnostic criteria of PTSD using symptom counts within clusters as proposed by Jurbergs et al., 2009 and Schwartz & Drotar, 2006. Using this method, a severity score of 3 or higher on any item was considered an endorsement of that symptom. Caregivers who endorsed one or more symptoms from Cluster B (Intrusion), three of more from Cluster C (Avoidance), or two or more from Cluster D (Hyperarousal) were considered as likely diagnostic criteria for PTSD. Reliability was high in our sample, with Cronbach’s alpha ranging from .92-.95, with an average of .94 across all twelve time points.
Data Analytic Strategy
Two strategies were used to account for missing data in the current study. First, subsequent monthly time points were pooled resulting in six time points (Time 1 for months one and two, Time 2 for months three and four, …Time 6 for months eleven and twelve). This method resulted in inclusion of an average of 25 additional families per pooled time point (see Supplemental Figure 1 for number of respondents per pooled time point). For families with complete data, the mean of the subsequent time points was used. Pooled time points were highly correlated, with an average correlation of r = .77 for caregiver variables and r = .79 for child variables. Given these high correlations, we do not believe that pooling resulted in an over- or underestimation of symptom levels. Second, initial psychological adjustment scores were correlated with number of completed questionnaires for each construct to see whether families who were experiencing more psychological distress were less likely to complete questionnaires. Number of completed questionnaires was not associated with initial levels of caregiver depression (r = −.03, p = .75 ), anxiety (r = −.11, p = .23 ), or PTSS (r = −.03, p = .78), or child externalizing (r = −.05, p = .54), anxiety/depression (r = .09, p =.23), or PTSS (r = −.07, p = .38). Thus, we were more confident with the assumption that any missing data was Missing At Random (MAR).
To address our first two research questions related to mean levels and proportion of the sample in the clinical range at each time point, descriptive information for 6 pooled time points over the first year of treatment was used. Proportion of children and caregivers in the clinical range at each time point were calculated relative to total respondents for that measure at that time point. Mean levels were determined to be within the normal or clinical ranges based on established cutoffs for each measure (see Measures description). To compare percentages of the current sample to percentages expected based on population norms, two-sided binomial exact tests were used akin to Kunin-Batson and colleagues (2016). For child externalizing and anxiety/depression and caregiver depression and anxiety, rates were compared to norms provided by instrument validation studies using the same clinical cut-offs (Achenbach & Rescorla 2001; Andresen et al., 1994: Henry & Crawford, 2005). For child PTSS, rates were compared to those found in a large sample of trauma-referred youth using the same measure and clinical cut-off (Cloitre et al., 2009). For caregiver PTSS, rates were compared to a sample of 108 caregivers of healthy children (see Jurbergs et al., 2009).
To address our third research question related to change over time, we estimated growth curve models using a Multilevel Modeling (MLM) approach, with the Maximum Likelihood estimator (ML) in SPSS 18.0. Because MLM accounts for missing data by using all available time points per family (as opposed to listwise deletion) and examines average intraindividual change trajectories over time rather than monthly fluctuations, the 12 original monthly assessments were treated separately (not pooled). Multilevel models are a useful tool for examining non-independent data such as repeated measures nested within individuals. Multilevel models are also able to assess both within and between cluster effects simultaneously (Raudenbush & Bryk, 2002). In other words, they can provide information about the typical trajectory of change in symptoms and variability around that sample average pattern.
Modeling proceeded as follows: We first estimated an unconditional growth model with time estimated as a linear function. This model estimated two fixed effects: an intercept parameter representing the starting point of the symptom variable (i.e. the baseline assessment), as well as a linear time parameter representing the rate of linear change over time in symptoms and the direction of such change (i.e., increase or decrease over the first year of treatment). Thus, time was coded from 0, Baseline to 11, representing the 12 month follow up. In addition to the intercept and linear time parameters, we then tested whether estimating random effects for these parameters improved model fit using −2LL differences (Raudenbush & Bryk, 2002). In these models, random effects test whether there were between-person differences in the initial levels or rate of change over time in level of symptoms. When inclusion of random effects improved model fit, this suggested that there was sufficient variance between-persons to test potential predictors that may account for these within-person differences in trajectories of symptoms over time. Finally, we tested whether adding a fixed and subsequent random quadratic effect improved model fit, which tested whether the rate of change accelerated or decelerated over time, and whether variability existed in acceleration or deceleration.
Results
Child Adjustment
Average levels of child adjustment.
Table 1 contains descriptive information on child psychopathology symptoms at each time point. Mean levels of depression/anxiety symptoms in children were within the normal range (<65) across all time points, with the highest mean level of symptoms occurring during Months 1–2 (M = 56.18, SD = 7.70). Mean levels of externalizing symptoms in children were also within the normal range (<60) across all time points, with the highest mean level of symptoms also occurring during Months 1–2 (M = 49.11, SD = 11.34). Finally, mean levels of post-traumatic stress symptoms in children were substantially below the clinical range (<40) across all time points, with the highest mean levels of symptoms occurring at Time 1 (M = 12.91, SD = 8.93). Thus, on average, symptoms were not elevated compared to norms.
Table 1.
Child and Caregiver Adjustment: Descriptive Information
| Months | 1–2 | 3–4 | 5–6 | 7–8 | 9–10 | 11–12 |
|---|---|---|---|---|---|---|
| Child Anxiety/Depression | ||||||
| n | 130 | 99 | 92 | 89 | 90 | 120 |
| M (SD) | 56.18 (7.70) | 54.50 (6.79) | 53.21 (5.40) | 52.84 (5.18) | 53.19 (5.75) | 54.85 (7.18) |
| CL n(%) Clinical | 9 (6.9%) | 5 (5.1%) | 7 (7.6%) | 1 (1.1%) | 1 (1.1%) | 3 (2.5%) |
| BCL n(%) Borderline | 14 (10.8%) | 2 (2.0%) | 6 (6.5%) | 4 (4.5%) | 2 (2.2%) | 3 (2.5%) |
| Child Externalizing | ||||||
| n | 130 | 99 | 120 | 92 | 89 | 90 |
| M | 49.11 (11.34) | 48.19 (11.61) | 47.85 (11.53) | 45.14 (10.61) | 44.34 (11.02) | 44.38 (10.51) |
| CL n(%) | 14 (10.8%) | 9 (9.1%) | 12 (10.0%) | 8 (8.7%) | 5 (5.6%) | 5 (5.6%) |
| BCL n(%) | 9 (6.9%) | 10 (10.1%) | 7 (5.8%) | 4 (4.3%) | 4 (4.5%) | 3 (3.3%) |
| Child PTSS | ||||||
| n | 137 | 101 | 119 | 93 | 89 | 90 |
| M | 12.91 (8.93) | 11.30 (7.64) | 12.45 (8.54) | 10.75 (8.18) | 9.93 (7.68) | 9.58 (8.01) |
| CL n(%) | 1 (.07%) | 1 (1.0%) | 2 (1.6%%) | 2 (2.2%) | 0 (0%) | 0 (0%) |
| Caregiver Depression | ||||||
| n | 132 | 102 | 122 | 94 | 89 | 90 |
| M (SD) | 13.84 (5.76) | 11.38 (5.70) | 11.18 (6.24) | 10.47 (6.63) | 10.04 (6.46) | 8.93 (5.56) |
| CL n(%) | 98 (74.3%) | 59 (57.8%) | 73 (59.8%) | 46 (48.9%) | 42 (47.2%) | 30 (33.3%) |
| Caregiver Anxiety | ||||||
| n | 132 | 101 | 121 | 94 | 89 | 90 |
| M (SD) | 3.88 (3.83) | 2.72 (3.08) | 2.73 (3.42) | 2.50 (3.85) | 2.37 (3.39) | 2.04 (2.82) |
| CL n(%) | 60 (45.5%) | 36 (35.6%) | 34 (28.1%) | 22 (23.4%) | 22 (24.7%) | 21 (23.3%) |
| Caregiver PTSS | ||||||
| n | 134 | 101 | 121 | 87 | 93 | 90 |
| M (SD) | 30.77 (16.38) | 24.47 (14.41) | 23.48 (14.92) | 22.32 (16.15) | 20.32 (15.05) | 18.82 (13.78) |
| (1) CL n(%) | 50 (37.3%) | 20 (19.8%) | 27 (22.3%) | 14 (16.0%) | 14 (15.1%) | 12 (13.3%) |
| (2) CL n(%) | 13 (9.7%) | 6 (6.0%) | 7 (5.8%) | 5 (5.7%) | 4 (4.3%) | 3 (3.3%) |
Note. CL = Clinical Range; BCL = Borderline Clinical Range. For caregiver PTSS: (1) clinical cut-off of 36 (moderate-severe PTSS symptoms); (2) PTSD diagnosis likely based on symptom count by cluster
Proportion of children in clinical range.
For depression/anxiety symptoms, based on norms 3% of children would be expected to fall in the clinical range and 4% in the borderline clinical range (Achenbach & Rescorla, 2001). In the current sample, during Months 1–2 and Months 5–6 the percentage of children in the clinical range was greater than normative rates (6.9% vs. 3%, p = .02; 7.6% vs. 3%, p < .02). During Months 1–2 the percentage of children in the borderline clinical range was also greater than normative rates (11% vs. 4%, p < .001), though were not statistically different thereafter. For externalizing symptoms, based on norms 10% of children would be expected to fall in the clinical range and 7% in the borderline clinical range (Achenbach & Rescorla, 2001). In the current sample, percentage of children in the borderline or clinical ranges were not statistically different from these rates at any time point. Thus, rates of anxiety/depression in the clinical ranges were elevated around the time of diagnosis and at approximately six months post diagnosis compared to norms though rates of externalizing in the clinical ranges were not elevated.
Finally, for PTSS, rates of clinically relevant symptoms were compared to a group of trauma-referred children in which 23.3% reported clinically relevant PTSS symptoms (Cloitre et al., 2009). Rates in the current sample were significantly lower at all time points (1% vs. 23.3%, p < .001; 2% vs. 23.3%, p < .001), suggesting that rates of clinically relevant symptoms were not comparable to other trauma-referred children.
Trajectory of child adjustment.
See Table 2 for all model building information, including fit comparisons, as well as final parameter estimates for the final models.
Table 2.
Growth Model Building and Final Parameter Estimates
| AIC | Int. b (SE) | Linear b (SE) | Quad. b (SE) | Int. σ2 (SE) | Lin. σ2 (SE) | Quad σ2 (SE) | |
|---|---|---|---|---|---|---|---|
| Child Anxiety/Depression | |||||||
| 1. | 6239.1 | 55.75 (.41)*** | −.30 (.06)*** | - | - | - | - |
| 2. | 5692.1 | 55.71 (.52)*** | −.29 (.04)*** | - | 28.45 (3.83) | - | - |
| 3. | 5612.6 | 55.73 (.61)*** | −.28 (.06)*** | - | 44.78 (6.35) | .28 (.06) | - |
| 4. | 5607.2 | 53.84 (.50)*** | −.31(.06)*** | .04 (..01)*** | 29.06 (3.84) | .28 (.06) | - |
| 5. | 5594.0 | 53.90 (.51)*** | −.31 (.06)*** | .04 (.01)** | 31.18 (4.38) | .32 (.06) | .007 (.003) |
| Child Externalizing | |||||||
| 1. | 7274.2 | 49.04 (.70)*** | −.46 (.11)*** | - | - | - | - |
| 2. | 6154.2 | 49.07 (.91)*** | −.37 (.05)*** | - | 104.40 (13.01) | - | - |
| 3. | 6106.4 | 49.19 (.93)*** | −.39 (.07)*** | - | 110.24 (14.56) | .37 (.09) | - |
| Child PTSS | |||||||
| 1. | 6814.2 | 12.76 (.50)*** | −.30 (.08)*** | - | - | - | - |
| 2. | 6219.6 | 12.87 (.66)***. | −.28 (.05)*** | - | 46.99 (6.31) | - | - |
| 3. | 6171.8 | 12.91 (.70)***. | −.28 (.08)*** | - | 57.50 (8.85) | .42 (.10) | - |
| Caregiver Depression | |||||||
| 1. | 6283.1 | 12.99 (.38)*** | −.39 (.06)*** | - | - | - | - |
| 2. | 5614.5 | 13.04 (.49)*** | −.36 (.04)*** | - | 26.53 (3.53) | - | - |
| 3. | 5565.4 | 13.09 (.47)*** | −.38 (.05)*** | - | 24.47 (3.76) | - | - |
| 4. | 5563.3 | 10.84 (.47)*** | −.40 (.05)*** | .03 (.01)** | 26.79 (3.59) | .20 (.05) | - |
| 5. | 5522.5 | 10.89 (.47)*** | −.41 (.06)*** | .03 (.01)* | 33.75 (4.67) | .27 (.05) | .01 (.003) |
| Caregiver Anxiety | |||||||
| 1. | 5135.6 | 3.33 (.22)*** | −.13 (.03)*** | - | - | - | - |
| 2. | 4515.3 | 3.43 (.28)*** | −.09 (.02)*** | - | 8.72 (1.17) | - | - |
| 3. | 4495.2 | 3.48 (.29)*** | −.11 (.03)*** | - | 9.85 (1.48) | .05 (.01) | - |
| 4. | 4497.6 | 2.74 (.27)*** | −.12 (.02)*** | .02 (.01)* | 8.74 (1.17) | .07 (.01) | - |
| Caregiver PTSS | |||||||
| 1. | 7919.4 | 28.79 (.95)*** | −1.01 (.15)*** | - | - | - | - |
| 2. | 7150.6 | 29.41 (1.23)*** | −.99 (.09)*** | - | 175.07 (22.79) | - | - |
| 3. | 7113.8 | 29.62 (1.35)*** | −1.06 (.12)*** | - | 225.48 (31.71) | 1.00 (.25) | - |
| 4. | 7097.2 | 23.00 (1.19)*** | −1.14 (.12)*** | .12 (.02)*** | 175.869 (22.75) | 1.01 (4.04) | - |
| 5. | 7089.2 | 23.10 (1.26)*** | −1.14 (.13)*** | .10 (.03)*** | 197.207 (26.89) | 1.20 (.27) | .03 (1.4) |
Note. Intercept b = estimate of average starting point; linear b = estimate of average rate of change; quadratic b = estimate of acceleration or deceleration in linear rate of change. Intercept σ2 = variance in starting point; linear σ2 = variance in rate of change; quad σ2 = variance in acceleration/deceleration of linear rate of change. Final models are italicized.
For symptoms of anxiety/depression, the final best-fitting model indicated that on average symptoms of anxiety/depression declined over time, with the rate of decline decelerating over time. Additionally, random effects indicated that variance existed between children in trajectories, or that children differed in their starting points and rates of change (both linear and quadratic). For a depiction of this variance, see Figure 1. This figure depicts the average trajectory of children’s anxiety/depression symptoms, observed variability around that trajectory, and differing trajectories based initial symptoms levels. For externalizing symptoms, the final model suggested that symptoms declined over time on average, such that for every one-month change in time, externalizing symptoms reduced by 0.39. Random effects also indicated variance between children in trajectories. Finally, for PTSS, the final model suggested that PTSS decreased over time, such that for every one-month change in time, symptoms reduced by 0.28. Random effects again indicated variability between children in trajectories.
Figure 1.
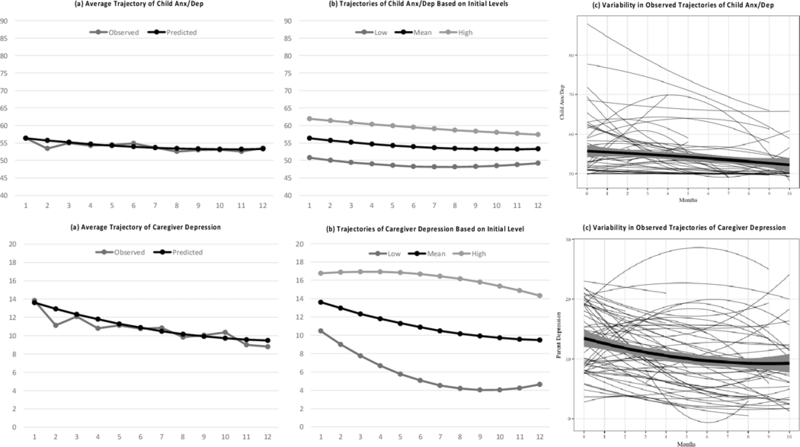
Trajectories of Child Anxiety/Depression and Caregiver Depression. Includes: (a) comparison between observed and model implied trajectories, (b) model implied trajectories based on correlation between initial symptom levels and rates of change in symptoms over time, (c) observed trajectories for a randomly selected subsample of 75 families.
Overall, similar trajectories and patterns of variability were observed across symptom types. That is, while on average children would be expected to decline over time in symptoms of anxiety/depression, externalizing, and PTSS, variance exists between children suggesting that not all children will follow this trajectory.
Primary Caregiver Adjustment
Average levels of adjustment.
Table 1 contains descriptive information on caregiver psychopathology symptoms at each time point. Average levels of depression symptoms in primary caregivers were in the clinical range (≥10.0) during Months 1–10, and were highest during Months 1–2 (M = 13.84, SD = 5.76). Mean levels of anxiety symptoms in primary caregivers were above the 80th percentile compared to normative samples (> 3.0) during Months 1–2 only, and were also highest during Months 1–2 (M = 3.88, SD = 3.83). Mean levels of PTSS in primary caregivers were within the mild range at all time points, and were highest during Months 1–2 (M = 30.77, SD = 16.38). Thus, on average, caregiver depression was elevated during the first 10 months post-diagnosis, anxiety was elevated for the first two months post-diagnosis, and PTSS was mild though not clinically relevant across time.
Proportion of caregivers in distressed/clinical range.
For depressive symptoms, norms for this measure suggest that 11.7% of the population would be expected to score above the clinical cut-off (Andresen et al., 1994). In our sample, rates were significantly higher in comparison at every time point, with the highest proportion scoring above the clinical cut-off during Months 1–2 (74.3% vs. 11.7%, p < .001), and the lowest proportion during Months 11–12 (44.4% vs. 11.7%, p < .001). For anxiety symptoms, 20% of the population is expected to score above a 3.0 (Henry & Crawford, 2005). In our sample, rates were significantly higher during Months 1–2 (45.5% vs. 20%, p < .001), Months 3–4 (35.6% vs. 20%, p = .01), and Months 5–6 (28.1% vs. 20%, p = .03) though were not statistically different thereafter. Finally, for PTSS, two methods were used to assess clinically relevant symptoms (see Measure description). When assessing frequency of moderate-to-severe symptoms, the proportion of caregivers above the cut-off ranged from 13.3% to 37.3%, with the highest occurring during Months 1–2 and the lowest during Months 11–12. Using modified diagnostic criteria of PTSD, rates ranged from 3.3% to 9.7%, with the highest proportion occurring during Months 1–2 and lowest in Months 11–12. Rates of PTSD using the modified diagnostic criteria were compared to Jurbergs et al’s (2009) sample of caregivers of healthy children where 9.8% of caregivers met these criteria (Jurbergs et al., 2009). The rates of likely cases of PTSD did not differ from rates among caregivers of healthy children during Months 1–10, and rates in Months 11–12 were significantly lower (3.3% vs. 9.8%, p = .03). Thus, while rates of clinically relevant symptoms of depression and anxiety in caregivers were higher than expected norms in the first six months following diagnosis, rates of likely cases of PTSD were comparable to norms.
Trajectories of caregiver adjustment.
For caregiver depression, the final model suggested that on average depressive symptoms declined over time with the rate of decline decelerating. Random effects also indicated that variance existed between caregivers in these trajectories. For a visual of this variance, see Figure 1. This figure depicts the average trajectory of caregivers’ depressive symptoms, observed variability around this trajectory, and differing trajectories based on initial symptom levels. For caregiver anxiety, the final model suggested that on average symptoms declined over time, with the rate of decline decelerating. Random effects also indicated variance between caregivers in trajectories. Finally, caregiver PTSS followed a similar pattern to depressive and anxiety symptoms, with the final growth model suggesting that symptoms declined over time with the rate of decline decelerating, and with random effects indicating that variance existed between caregivers in trajectories.
Overall, similar trajectories and patterns of variability were observed across symptom types for caregivers as well. That is, while most caregivers would be expected to decline over time in symptoms of depression, anxiety, and PTSS, some caregivers may decrease more rapidly than others and a small subset may remain stable or increase slightly.
Discussion
Using a prospective longitudinal design with monthly assessments, the present study described the average levels and trajectories of psychological adjustment in children with cancer and their caregivers during the first year of treatment for pediatric cancer. Most children with cancer showed relatively good psychological adjustment, which is consistent with a prior body of research suggesting that these children may not be at elevated risk for mental health difficulties (Phipps et al., 2014; Sharp et al., 2015; Wechsler & Sanchez-Iglesias, 2013). In contrast, many caregivers showed elevated symptoms, with a substantial number scoring in the clinically-relevant range over time.
Among children, symptoms of externalizing, anxiety/depression, and PTSS declined over time on average. Average levels of child PTSS were well below the clinical cut-off at each time point, and number of children in the clinical range was substantially below rates found in trauma-referred samples. These findings align with previous reports suggesting little evidence of PTSS within this population (Phipps et al., 2014). Consistent with Pinquart & Shen (2011), mean scores and percentage of children in the clinical ranges on externalizing behaviors were comparable to normative samples. We extend Pinquart & Shen’s (2011) findings by noting that comparability to normative samples occurred at each time point.
Rates of internalizing symptoms in the current study were both consistent with and differed from findings in earlier studies. Similar to Myers et al (2014), mean scores for anxiety and depression were within the normative range at each time point. However, in our data, rates of borderline clinical and clinical symptoms were elevated compared to norms in the early months of treatment while Myers et al (2014) reported elevations in frequency of clinically relevant depression across a longer period of time post-diagnosis (i.e., at 1, 6 and 12 months post-diagnosis). Differences between our sample and Myers et al (2014) may be accounted for by use of different instruments to measure symptom levels. While the CBCL provides data for a combined depression/anxiety score, Myers et al’s (2014) used the Behavior Assessment System for Children (BASC) which separates out depression and anxiety. In their data, rates of depression were higher than population norms at 1, 6 and 12 months post-diagnosis but rates of anxiety were only high at 1 month post-diagnosis and were no different than population norms thereafter. One possibility is that the combined assessment of depression and anxiety in the current study may have obscured differential patterns of change in depression and anxiety over time. Additional longitudinal research with multiple assessments of child depression and anxiety over the first year of treatment can provide a clearer picture of the key time points when depression and anxiety are elevated relative to population norms or reduce to expected levels. Such data can guide the timing of intervention and target those symptoms most in need of attention.
In contrast to children, many caregivers were struggling with the psychological ramifications of having a child with cancer. While earlier studies have reported that symptoms of depression and anxiety in caregivers are most elevated around the time of diagnosis, our data indicate that despite an average decline over time, rates of depression and anxiety symptoms were markedly elevated through a substantial part of the first year of treatment. Mean levels of caregiver depression were in the clinical range throughout the first ten months of treatment and percentages of caregivers scoring in the clinical range were greater than would be expected in the normal population at every time point. Mean levels of caregiver anxiety were also elevated during the first two months after diagnosis and rates of elevated symptoms were greater than would be expected in the population during the first six months of cancer treatment.
The findings provide additional estimates of elevated PTSS in parents of children with cancer. The findings varied depending on which of the two criteria were used to identify elevated PTSS. When examining the proportion of caregivers exhibiting moderate-to-severe symptoms, 37.3% of caregivers had total symptoms above the clinical cut-off at the time of diagnosis. These results are comparable to rates found by Dunn et al (2012), where 41% of mothers had elevated symptoms. The current study also extends Dunn et al (2012) by examining rates of caregiver PTSS across the first year of treatment. Although a steady decline in proportion of caregivers with moderate-to-severe symptoms was observed across the first year of treatment, elevated PTSS is evident among a sizeable subgroup of caregivers at each time point (Kazak et al, 2005; Nam et al, 2016; Santacroce, 2002). When using the more conservative method of identifying likely cases of PTSD, rates of PTSD in caregivers of children with cancer did not differ from rates among caregivers of healthy children during the initial 10 months of treatment and were significantly lower by the end of the first year. While most caregivers of children with cancer are not showing diagnostic levels of PTSD that would require more intensive intervention, a subgroup of caregivers are experiencing substantial levels of trauma-related symptoms that may benefit from supportive mental health services.
To our knowledge, this was the first study to assess within-person trajectories of symptoms through treatment and variability between individuals in these trajectories among both children with cancer and their caregivers. Specifically, while our findings replicate prior research showing declines in symptoms over time (Pai et al., 2007) we also identified substantial variability in trajectories for both caregivers and children, suggesting a more complex picture. For example, based on the model depicted in Figure 1(b), a caregiver with levels of depression one standard deviation above the mean during the first month post-diagnosis would be expected to maintain symptom levels through the first 6-months followed by a slow decline, though remaining in the clinically relevant range throughout the first year. Conversely, a caregiver with symptoms one standard deviation below the mean in the first month would be expected to decline rapidly during the first few months, with levels falling below the clinical range by the second month, and continue to decline thereafter. This both exemplifies the varying trajectories of symptoms caregivers experience and, consistent with findings from Kunin-Batson and colleagues (2016), suggests that examining severity of initial levels of symptoms after diagnosis may be one way of predicting who may recover more quickly versus who may maintain higher levels of symptoms over time. Though beyond the scope of the current paper, an important next step for this work will be to identify additional predictors of different trajectories of child and caregiver psychopathology in order to inform early identification of at risk individuals.
Clinical implications of this work suggest that intervention services for caregivers are needed. As parental psychological adjustment is a lead indicator of child and family well-being (Lewis & Miller, 1990; Brown et al., 1993), these data highlight the importance of monitoring parental psychological adjustment throughout the first year of treatment. Intervention services for parents who are struggling to maintain their own emotional well-being early in the treatment process can prevent potential negative downstream effects on partners, siblings, as well as their child with cancer. These data also suggest that depressive symptoms may be the most likely form of psychological distress as rates were higher at every time point, and a larger proportion of the sample fell into the clinical range for depressive symptoms compared to anxiety and PTSS at each time point. Thus, intervention services targeting depressive symptoms may be particularly useful for this population of caregivers. While challenges enrolling caregivers in interventions soon after a child’s cancer diagnosis have been reported (Stehl et al., 2009), such interventions may play an important role in improving caregiver quality of life (Northouse et al., 2010). Integrating interventions in ways that minimize extra burden on caregivers and bolster participation is needed, such as providing intervention session via home visits or electronically, or allowing individual rather than family-level participation (Stehl et al., 2009). Additionally, linking caregivers with access to other psychosocial services may also be important in minimizing distress through the treatment process.
The study had several strengths as well as limitations. One limitation is the varied response rates at each time point. Our calculation of percentages of distressed children and caregivers was based on the total number of respondents at each time, and thus assumed any missing data was missing at random, which may not have been the case. This may have resulted in over- or under-estimation of these percentages depending on factors that influenced response rates. A second limitation is that all measures were completed by primary caregivers, who were primarily white, educated mothers, so generalizability of findings should be considered in light of this relatively homogenous sample. Additionally, single-reporter bias may have influenced our results. However, it is noteworthy that caregivers reported little psychological distress in their children despite their own overall high levels of distress, which is in contrast to typical findings that distress in caregivers is associated with higher ratings of psychopathology in children (Youngstrom et al., 2000). This suggests that single reporter bias may be mitigated in our data. Third, children in the current study had access to psychological services through their hospitals, though it is unknown if families utilized these services. While psychological service utilization may have accounted for diminished rates of symptoms through the year, given that other studies have identified similar patterns (e.g., Pai et al, 2007) this is likely not the sole reason for decline. Fourth, because the DASS does not provide a clinical cut-off for anxiety symptoms, the estimation of the proportion of caregivers with distressing anxiety levels reflects those in the top 20th percentile relative to non-clinical samples. It is therefore less clear whether these individuals are reporting levels of anxiety that would warrant clinical attention. Finally, child PTSS was compared to a sample of trauma-referred children rather than the general population due to lack of an available comparison group assessing PTSS in a normative sample. Thus, implications of this comparison differ from others as it examines whether children with cancer look similar in PTSS to other children who have experienced traumatic events, rather than whether children with cancer differ from typically developing children.
Strengths of the study include the monthly assessments of psychological adjustment in children and primary caregivers, which allowed for a nuanced and statistically rigorous description of changes in mental health over the first year of treatment. Use of well-validated measures of child psychological distress and caregiver depression and PTSS with clear clinical-cutoffs also allowed us to determine the number of children and caregivers showing clinically significant difficulties.
Though a growing body of literature has examined the effect of pediatric cancer on child and caregiver adjustment, the current study extends prior knowledge by examining proportions of individuals with clinically relevant symptoms and demonstrating patterns of variability in symptoms over time. Findings provide evidence that during the first year of cancer treatment symptoms decline over time for both parents and children. However, while most children are not showing substantial distress, most caregivers are suffering during the early months with particularly high rates of depressive symptoms and a significant subset are not improving over time. To prevent negative outcomes for parents and potential negative downstream effects on their children and other family members, there is a need to understand both which caregivers are at highest risk and how to prevent continued psychological distress during and after treatment.
Supplementary Material
References
- Achenbach TM (1991). Child behavior checklist/4–18 University of Vermont, psychiatry. [Google Scholar]
- Achenbach TM, & Rescorla L (2001). ASEBA school-age forms & profiles [Google Scholar]
- Allen R, Newman SP, & Souhami RL (1997). Anxiety and depression in adolescent cancer: findings in patients and parents at the time of diagnosis. European Journal of Cancer, 33(8), 1250–1255. [DOI] [PubMed] [Google Scholar]
- Andresen EM, Malmgren JA, Carter WB, & Patrick DL (1994). Screening for Depression in Well Older Adults: Evaluation of. Prev Med, 10, 77–84. [PubMed] [Google Scholar]
- Barrera M, Wayland LA, D’Agostino NM, Gibson J, Weksberg R, & Malkin D (2003). Developmental differences in psychological adjustment and health-related quality of life in pediatric cancer patients. Children’s Health Care, 32(3), 215–232. [Google Scholar]
- Bollen KA, & Curran PJ (2006). Latent curve models: A structural equation perspective (Vol. 467). John Wiley & Sons. [Google Scholar]
- Boman K, & Bodegård G (1995). Psychological long‐term coping with experience of disease and treatment in childhood cancer survivors. Acta Paediatrica, 84(12), 1395–1402. [DOI] [PubMed] [Google Scholar]
- Bonner MJ, Hardy KK, Willard VW, & Hutchinson KC (2007). Brief report: Psychosocial functioning of fathers as primary caregivers of pediatric oncology patients. Journal of Pediatric Psychology, 32(7), 851–856. [DOI] [PubMed] [Google Scholar]
- Brown RT, Kaslow NJ, Madan-Swain A, Doepke KJ, Sexson SB, & Hill LJ (1993). Parental psychopathology and children’s adjustment to leukemia. Journal of the American Academy of Child & Adolescent Psychiatry, 32(3), 554–561. [DOI] [PubMed] [Google Scholar]
- Cloitre M, Stolbach BC, Herman JL, Kolk BVD, Pynoos R, Wang J, & Petkova E (2009). A developmental approach to complex PTSD: Childhood and adult cumulative trauma as predictors of symptom complexity. Journal of traumatic stress, 22(5), 399–408. [DOI] [PubMed] [Google Scholar]
- Compas BE, Bemis H, Gerhardt CA, Dunn MJ, Rodriguez EM, Desjardins L, Preacher KJ, Manring S, & Vannatta K (2015). Mothers and fathers coping with their child’s cancer: Individual and interpersonal processes. Health Psychology , 34, 783–793. [DOI] [PMC free article] [PubMed] [Google Scholar]
- Compas BE, Desjardins L, Vannatta K, Young-Saleme T, Rodriguez EM, Dunn M, Bemis H, Snyder S, & Gerhardt CA (2014). Children and adolescents coping with cancer: Self- and parent-reports of coping and anxiety/depression. Health Psychology, 33, 853–861. [DOI] [PMC free article] [PubMed] [Google Scholar]
- Costanzo ES, Lutgendorf SK, Mattes ML, Trehan S, Robinson CB, Tewfik F, & Roman SL (2007). Adjusting to life after treatment: distress and quality of life following treatment for breast cancer. British Journal of Cancer, 97(12), 1625–1631. [DOI] [PMC free article] [PubMed] [Google Scholar]
- Drotar D (1994). Psychological research with pediatric conditions: if we specialize, can we generalize?. Journal of Pediatric Psychology, 19(4), 403–414. [DOI] [PubMed] [Google Scholar]
- Frank NC, Brown RT, Blount RL, & Bunke V (2001). Predictors of affective responses of mothers and fathers of children with cancer. Psycho‐Oncology, 10(4), 293–304. [DOI] [PubMed] [Google Scholar]
- Friedman DL, & Meadows AT (2002). Late effects of childhood cancer therapy. Pediatric Clinics of North America, 49(5), 1083–1106. [DOI] [PubMed] [Google Scholar]
- Fuemmeler BF, Mullins LL, Van Pelt J, Carpentier MY, & Parkhurst J (2005). Posttraumatic stress symptoms and distress among parents of children with cancer. Children’s Health Care, 34(4), 289–303. [Google Scholar]
- Henry JD, & Crawford JR (2005). The short‐form version of the Depression Anxiety Stress Scales (DASS‐21): Construct validity and normative data in a large non‐clinical sample. British journal of clinical psychology, 44(2), 227–239. [DOI] [PubMed] [Google Scholar]
- Iqbal A, & Siddiqui KS (2002). Depression among parents of children with acute lymphoblastic leukemia. Blue Collar, 6(03), 09. [PubMed] [Google Scholar]
- Jurbergs N, Long A, Ticona L, & Phipps S (2007). Symptoms of posttraumatic stress in parents of children with cancer: Are they elevated relative to parents of healthy children?. Journal of Pediatric Psychology, 34(1), 4–13. [DOI] [PMC free article] [PubMed] [Google Scholar]
- Kazak AE (2005). Evidence-based interventions for survivors of childhood cancer and their families. Journal of Pediatric Psychology, 30(1), 29–39. [DOI] [PubMed] [Google Scholar]
- Kazak AE, Barakat LP, Meeske K, Christakis D, Meadows AT, Casey R, ... & Stuber ML (1997). Posttraumatic stress, family functioning, and social support in survivors of childhood leukemia and their mothers and fathers. Journal of consulting and clinical psychology, 65(1), 120. [DOI] [PubMed] [Google Scholar]
- Kazak AE, Boeving CA, Alderfer MA, Hwang WT, & Reilly A (2005). Posttraumatic stress symptoms during treatment in parents of children with cancer. Journal of Clinical Oncology, 23(30), 7405–7410. [DOI] [PubMed] [Google Scholar]
- Koocher GP, & O’Malley JE (1981). The Damocles syndrome: Psychosocial consequences of surviving childhood cancer McGraw-Hill Companies. [Google Scholar]
- Kunin-Batson AS, Lu X, Balsamo L, Graber K, & Devidas M (2016). Prevalence and predictors of anxiety and depression after completion of chemotherapy for childhood acute lymphoblastic leukemia : A prospective longitudinal study. Cancer , 122(10), 1608–17. doi: 10.1002/cncr.29946. [DOI] [PMC free article] [PubMed] [Google Scholar]
- Lewis M, & Miller S (1990) Handbook of Developmental Psychology New York: Plenum Press. [Google Scholar]
- Lindahl Norberg A, & Boman KK (2008). Parent distress in childhood cancer: Acomparative evaluation of posttraumatic stress symptoms, depression and anxiety. Acta Oncologica, 47(2), 267–274. [DOI] [PubMed] [Google Scholar]
- Lovibond PF, & Lovibond SH (1995). The structure of negative emotional states: Comparison of the Depression Anxiety Stress Scales (DASS) with the Beck Depression and Anxiety Inventories. Behaviour research and therapy, 33(3), 335–343. [DOI] [PubMed] [Google Scholar]
- Myers RM, Balsamo L, Lu X, Devidas M, Hunger SP, Carroll WL, ... & Kadan‐Lottick NS (2014). A prospective study of anxiety, depression, and behavioral changes in the first year after a diagnosis of childhood acute lymphoblastic leukemia. Cancer, 120(9), 1417–1425. [DOI] [PMC free article] [PubMed] [Google Scholar]
- Noll RB, Gartstein MA, Vannatta K, Correll J, Bukowski WM, & Davies WH (1999). Social, emotional, and behavioral functioning of children with cancer. Pediatrics, 103(1),71–78. [DOI] [PubMed] [Google Scholar]
- Norberg AL, Lindblad F, & Boman KK (2005). Parental traumatic stress during and after paediatric cancer treatment. Acta Oncologica, 44(4), 382–388. [DOI] [PubMed] [Google Scholar]
- Northouse LL, Katapodi MC, Song L, Zhang L, & Mood DW (2010). Interventions with family caregivers of cancer patients: meta‐analysis of randomized trials. CA: a cancer journal for clinicians, 60(5), 317–339. [DOI] [PMC free article] [PubMed] [Google Scholar]
- Pai AL, Greenley RN, Lewandowski A, Drotar D, Youngstrom E, & Peterson CC (2007). A meta-analytic review of the influence of pediatric cancer on parent and family functioning. Journal of Family Psychology, 21(3), 407. [DOI] [PubMed] [Google Scholar]
- Patenaude AF, & Kupst MJ (2005). Psychosocial functioning in pediatric cancer. Journal of pediatric psychology, 30(1), 9–27. [DOI] [PubMed] [Google Scholar]
- Patterson JM, Holm KE, & Gurney JG (2004). The impact of childhood cancer on the family: a qualitative analysis of strains, resources, and coping behaviors. Psycho‐Oncology, 13(6), 390–407. [DOI] [PubMed] [Google Scholar]
- Perrin EC, Stein RE, & Drotar D (1991). Cautions in using the Child Behavior Checklist: Observations based on research about children with a chronic illness. Journal of Pediatric Psychology, 16(4), 411–421. [DOI] [PubMed] [Google Scholar]
- Pinquart M, & Shen Y (2011). Behavior problems in children and adolescents with chronic physical illness: A meta-analysis. Journal of Pediatric Psychology , 36, 1003–1016. doi: 10.1093/jpepsy/jsq104 [DOI] [PubMed] [Google Scholar]
- Phipps S, Klosky JL, Long A, Hudson MM, Huang Q, Zhang H, & Noll RB (2014). Posttraumatic stress and psychological growth in children with cancer: Has the traumatic impact of cancer been overestimated?. Journal of Clinical Oncology, 32(7), 641–646. [DOI] [PMC free article] [PubMed] [Google Scholar]
- Phipps S, Long A, Hudson M, & Rai SN (2005). Symptoms of post‐traumatic stress in children with cancer and their parents: Effects of informant and time from diagnosis. Pediatric blood & cancer, 45(7), 952–959. [DOI] [PubMed] [Google Scholar]
- Radloff LS (1977). The CES-D scale a self-report depression scale for research in the general population. Applied psychological measurement, 1(3), 385–401. [Google Scholar]
- Raudenbush SW, & Bryk AS (2002). Hierarchical linear models: Applications and data analysis methods (Vol. 1). Sage. [Google Scholar]
- Russell KM, Hudson M, Long A, & Phipps S (2006). Assessment of health‐related quality of life in children with cancer. Cancer, 106(10), 2267–2274. [DOI] [PubMed] [Google Scholar]
- Santacroce S (2002). Uncertainty, anxiety, and symptoms of posttraumatic stress in parents of children recently diagnosed with cancer. Journal of Pediatric Oncology Nursing, 19(3), 104–111. [DOI] [PubMed] [Google Scholar]
- Sawyer M, Antoniou G, Toogood I, Rice M, & Baghurst P (2000). Childhood cancer: A 4-year prospective study of the psychological adjustment of children and parents. Journal of pediatric hematology/oncology, 22(3), 214–220. [DOI] [PubMed] [Google Scholar]
- Schwartz L, & Drotar D (2005). Posttraumatic stress and related impairment in survivors of childhood cancer in early adulthood compared to healthy peers. Journal of Pediatric Psychology, 31(4), 356–366. [DOI] [PubMed] [Google Scholar]
- Steinberg AM, Brymer MJ, Decker KB, & Pynoos RS (2004). The University of California at Los Angeles post-traumatic stress disorder reaction index. Current psychiatry reports, 6(2), 96–100. [DOI] [PubMed] [Google Scholar]
- Steinberg AM, Brymer MJ, Kim S, Briggs EC, Ippen CG, Ostrowski SA, ... & Pynoos RS (2013). Psychometric properties of the UCLA PTSD reaction index: part I. Journal of traumatic stress, 26(1), 1–9. [DOI] [PubMed] [Google Scholar]
- Stehl ML, Kazak AE, Alderfer MA, Rodriguez A, Hwang WT, Pai AL, ... & Reilly A (2008). Conducting a randomized clinical trial of an psychological intervention for parents/caregivers of children with cancer shortly after diagnosis. Journal of Pediatric Psychology, 34(8), 803–816. [DOI] [PMC free article] [PubMed] [Google Scholar]
- Stuber ML, Christakis DA, Houskamp B, & Kazak AE (1996). Posttraumatic symptoms in childhood leukemia survivors and their parents. Psychosomatics, 37(3), 254–261. [DOI] [PubMed] [Google Scholar]
- Trask PC, Paterson AG, Trask CL, Bares CB, Birt J, & Maan C (2003). Parent and adolescent adjustment to pediatric cancer: associations with coping, social support, and family function. Journal of Pediatric Oncology Nursing, 20(1), 36–47. [DOI] [PubMed] [Google Scholar]
- Varni JW, & Katz ER (1997). Stress, social support and negative affectivity in childrenwith newly diagnosed cancer: a prospective transactional analysis. Psycho‐Oncology, 6(4), 267–278. [DOI] [PubMed] [Google Scholar]
- Weiss DS, & Marmar CR (1997). The Impact of Event Scale-Revised. In Wilson JP & Keane TM (Eds.), Assessing Psychological Trauma and PTSD (pp.399–411). New York: Guilford. [Google Scholar]
- Yeh CH (2002). Gender differences of parental distress in children with cancer. Journal of advanced nursing, 38(6), 598–606. [DOI] [PubMed] [Google Scholar]
- Youngstrom E, Loeber R, & Stouthamer-Loeber M (2000). Patterns and correlates of agreement between parent, teacher, and male adolescent ratings of externalizing and internalizing problems. Journal of consulting and clinical psychology, 68(6), 1038. [DOI] [PubMed] [Google Scholar]
Associated Data
This section collects any data citations, data availability statements, or supplementary materials included in this article.