

Abstract
Introduction
A permanent drug donation box (“drop-box”) is one strategy implemented in communities across the United States to reduce the availability of excess controlled medications, including prescription opioids, for diversion. The objective of this study was to examine correlates of the diffusion and implementation of drop-boxes in North Carolina.
Methods
We assessed the number and location of drop-boxes implemented in North Carolina. Cox proportional hazards models were used to examine covariates associated with drop-box implementation in NC counties (n=100) between 2007 and 2016.
Results
There were 311 drop-boxes implemented in 91 (out of 100) counties. Most drop-boxes were in law enforcement agencies (78.8%) and a growing number were in pharmacies (14.5%). Counties with a higher percentage of whites, more educated residents, a substance abuse prevention coalition, higher rates of controlled medications dispensed and prescription opioid overdose, and that were Appalachian were more likely to be early adopters. Rural counties were less likely to have a drop-box. In the multivariate model, only higher rate of controlled medicines dispensed was significant.
Conclusions
A growing number of drop-boxes are being implemented in law enforcement offices and pharmacies. Given that communities with higher rates of controlled medication dispensing likely have the highest need for disposal opportunities, it is promising that they are early adopters of drop-boxes. Future research should assess the effectiveness of drop-boxes as they become more widespread in a variety of locations.
Keywords: prescription drug, opioid, prevention, disposal, diversion
1. Introduction
Nonmedical prescription drug use (NMPDU), the use of a controlled medication without a prescription or for the experience and feeling the drugs cause, is the second most common illicit drug use behavior in the United States (Center for Behavioral Health Statistics and Quality, 2015). It is associated with a myriad of adverse consequences, including overdose deaths (CDC, 2015a; Chen, Hedegaard, & Warner, 2015), emergency department visits (SAMHSA, 2013; Warner, Hedegaard, & Chen, 2014), dependence and addiction (Compton et al., 2006), infectious diseases (Bruneau, Roy, Arruda, Zang, & Jutras-Aswad, 2012; Conrad et al., 2015; Zibbell et al., 2015), and community consequences (Berning, Compton, & Wochinger, 2015; Goodnough, 2010).
The supply of controlled medications is high; over 3.9 billion controlled medications are being dispensed by retail pharmacies annually (CDC, 2015b). Not only are a substantial number of controlled medications being dispensed but many are going unused. Previous studies found that only 2%–34% of individuals use all of their prescribed medications (Bates et al., 2011; Kuspis & Krenzelok, 1996; Lewis et al., 2014), and 7.2–91.0% report retaining prescribed medications in their homes, even after ceasing use or the medication expired (Bates et al., 2011; Harris et al., 2013; Kennedy-Hendricks et al., 2016; Kuspis & Krenzelok, 1996; Lewis et al., 2014; Ma et al., 2014; Seehusen & Edwards, 2006). Thus, personal medicine cabinets may be a primary source of controlled medications for nonmedical use, knowingly or unknowingly to the prescription-holder (Ross-Durow, McCabe, & Boyd, 2013; Stewart et al., 2014). In fact, research consistently has found that the most commonly reported sources of controlled medications for nonmedical use are friends or family for free (Center for Behavioral Health Statistics and Quality, 2015; McCabe & Boyd, 2005).
Based on the availability hypothesis, which suggests that the ease and convenience of obtaining substances is related to subsequent use or abuse (Babor, Caetano, et al., 2010), reducing the availability of excess controlled medications by facilitating their disposal may be a promising strategy to reduce NMPDU. A permanent drug donation box (herein referred to as “drop-box”) is one of the common medication disposal strategies implemented in communities across the United States (DEA, 2014b; ONDCP, 2011). The Secure and Responsible Drug Disposal Act of 2010 provides national guidelines for the implementation of drop-boxes (DEA, 2014b). Initially, drop-boxes could only be located at law enforcement offices but following the establishment of the final rule to the Secure and Responsible Drug Disposal Act of 2010, in October 2014, drop-boxes could be implemented by authorized manufacturers, distributors, reverse distributors, narcotic treatment programs, hospitals/clinics with an on-site pharmacy, and retail pharmacies (DEA, 2014b). Currently, drop-boxes can be made available to the public year-round under 24–7 surveillance by a Drug Enforcement Administration (DEA)-authorized collector (e.g., law enforcement and pharmacies). In order for drop-boxes to be effective, they must be available and easily accessible to community members. While it is known that organizations, such as law enforcement agencies and pharmacies, have been voluntarily implementing drop-boxes, in accordance with the Secure and Responsible Drug Disposal Act of 2010, to our knowledge, no study has systematically examined drop-box diffusion and implementation or community characteristics associated with implementation. Diffusion theories have been used by multiple fields, including substance abuse prevention (Rogers, 2010), to examine transfer of knowledge, experiences with the application of technologies and practices, and the spread of technologies and practices through populations (Green, Ottoson, García, & Hiatt, 2009). One such theory is Roger’s Diffusion of Innovation Theory (Rogers, 2010). According to Rogers’s theory, diffusion is the process by which an innovation (e.g., a new idea, practice, or object) is communicated through certain channels over time among members of a social system. Characteristics of both innovations and adopters impact how rapidly an innovation is communicated and subsequently implemented. Relative advantage is one innovation characteristic that is thought to influence the rate of adoption, and it refers to the perceived advantage of the innovation by potential adopters (Rogers, 2010). Applied to the diffusion and implementation of drop-boxes, communities with NMPDU problems (e.g., high controlled medication prescribing rates and prescription opioid overdose rates) may perceive high relative advantage of adopting drop-boxes, especially if they are perceived to be effective. Characteristics of potential adopters that influence likelihood of adoption include: more formal education, higher social status, larger units (e.g. communities or organizations), greater change agent contact, and greater knowledge of innovations (Rogers, 2010).
North Carolina (NC) is ranked in the top 20 states for both opioid prescribing and opioid overdose rates. NC has an opioid prescribing rate of 96.6 prescriptions per 100 persons (Paulozzi et al., 2014) and opioid overdose death rate 8.7 per 100,000 (Kaiser Family Foundation, 2017). Thus, NC has a need for effective strategies to address the availability of controlled medications in order to reduce NMPDU and associated consequences. Drop-boxes are one of several strategies implemented by communities in NC to fill this need. The objective of this study was to examine the diffusion and implementation of drop-boxes in NC. We assessed the number and location of drop-boxes implemented in NC and county-level covariates associated with implementation. We hypothesized that (1) many but not all counties would have at least one drop-box; (2) the majority of drop-boxes would be at law enforcement agency offices; (3) high prescription opioid overdose and controlled medication prescribing rates would be positively associated with drop-box adoption since these counties have higher prevention needs based on Rogers’s concept of ‘relative advantage’ (2010); (4) the presence of a local substance abuse prevention coalition would be associated with drop-box adoption since these agencies have been involved in the facilitation of drop-box implementation based on Rogers’s concept of ‘change agent’ (2010); and (5) drop-box adoption would be associated with larger population size, higher socioeconomic status, higher level of education, and proximity to other adopters based on Rogers’s theory pertaining to characteristics of early adopters (2010). The findings from this study provide insight on the spread of drop-boxes across North Carolina, community characteristics associated with drop-box implementation, and whether implementation gaps occur in high-risk areas.
2. Materials and Methods
We created a database of all counties in North Carolina (n=100). County was the unit of analysis since several of the covariates of interest were only available at the county-level (i.e, rate of prescription opioid overdoses and number of controlled medications dispensed). The following variables were added to the database per county: presence of a drop-box; year of implementation of the drop-box; address of the drop-box; rate of prescription opioid overdoses; number of controlled medications dispensed per person; presence of a substance abuse prevention coalition; Appalachian county; county census data (population, race, ethnicity, median income, educational attainment of residents); and adjacency to a county with a drop-box.
2.2 Measures
2.2.1. Drop-boxes
A multi-step approach was used to determine the presence and year of implementation of drop-boxes in counties in North Carolina. First, a list of potential drop-box locations was compiled using the DEA’s Controlled Substance Public Disposal Location (DEA, n.d.-a) and the North Carolina Operation Medicine Drop (Safe KidsNC, n.d.) search utilities. The DEA’s list was used to identify organizations that were required to register and receive approval by the DEA to become an authorized collector of controlled medications (i.e., pharmacies and other health care facilities). Law enforcement agencies, which do not require DEA authorization, were not included on the DEA list so we reviewed the North Carolina Operation Medicine Drop website to identify the law enforcement agencies that had a drop-box. A limitation of the North Carolina Operation Medicine Drop website, at the time of data collection, was that organizations were responsible for submitting their drop-box information to the website in order to be included, and thus it may not have included all drop-box locations in the state. In order to identify law enforcement agencies that may not have been included on the NC Operation Medicine Drop website, a list of all Sheriff’s offices in North Carolina was obtained from the North Carolina Sheriff’s Association (http://ncsheriffs.org/sheriffs) and a list of all police departments in North Carolina was obtained from USACops (http://www.usacops.com/nc/; the final list excluded colleges, schools, business/malls, military bases, & airport public safety). Following the compilation of a list of all possible drop-box locations in North Carolina (i.e., law enforcement agencies and DEA-authorized collectors), a web-search was conducted to determine drop-box implementation and date of implementation for all the locations on list. Search terms included the location name and “drop box” or “dispose” or “disposal.” If a drop-box and/or the date of implementation could not be identified in the web-search, the location was called by phone to determine if they had a drop-box and the year that it was implemented.
2.2.2. Prescription Opioid Overdose Deaths
The number of prescription opioid deaths by year and county from 2010 to 2015 were obtained from the North Carolina State Center for Health Statistics. The rate per 100,000 residents by year and county was calculated based on population size of each county using American Community Survey 5-year estimates (United States Census Bureau/American FactFinder, 2015).
2.2.3. Controlled Medications Dispensed
The number of controlled medication (opioid, benzodiazepine, and stimulant) pills dispensed by year and county from 2011 to 2016 were obtained from the North Carolina Controlled Reporting System which is controlled by NC Department of Health and Human Services (DHHS). The number per person each year was calculated by dividing the total number by the population size of each county using American Community Survey 5-year estimates (United States Census Bureau/American FactFinder, 2015).
2.2.4. Substance Abuse Prevention Coalition
The presence of a substance abuse prevention coalition in each county by year from 2011 to 2016 was determined from lists obtained from the North Carolina Parent Resource Center and the North Carolina Coalition Initiative Coordinating Center at Wake Forest School of Medicine.
2.2.5. Percent of Adjacent Counties with a Drop-Box
In order to create this variable, the number of counties which border or touch each county in North Carolina was determined. Then, the percentage of adjacent counties that had a drop-box each year from 2010 to 2016 was calculated.
2.2.6. Appalachian County
Appalachian counties were identified from the Appalachian Regional Commission and were coded as yes vs no (https://www.arc.gov/appalachian_region/TheAppalachianRegion.asp).
2.2.7. Census Data
Educational attainment, median household income, population size, race (% white), and ethnicity (% Hispanic) were obtained from the American Community Survey 5-year estimates (United States Census Bureau/American FactFinder, 2015). Education attainment was coded as the percent of county residents with a Bachelor degree or higher.
2.3. Statistical Analysis
ESRI ArcGIS software was used to geocode drop-box addresses (Figure 1). Cox proportional hazards regression model was used to assess the relationship between the specified covariates and implementation of a drop-box. The relationship between event incidence and a set of covariates was expressed as a hazard function (the instantaneous event probability at a given time) and a hazard ratio (the logarithm of the hazard function). Thus, a value of βi greater than 0, or a hazard ratio greater than one, is indicative that as ith increases, the event hazard increases and the length of time until implementation decreases (i.e., faster implementation) (Bradburn, Clark, Love, & Altman, 2003a). If the county had a drop-box, the implementation date of the drop-box had to be known and counties had to implement a drop-box no earlier than 2011 (due to years available for time-dependent covariates) in order to be included in the analysis. There were three counties with unknown drop-box implementation dates and two counties that implemented a drop-box before 2011 which resulted in a sample of 95 counties.
Figure 1.
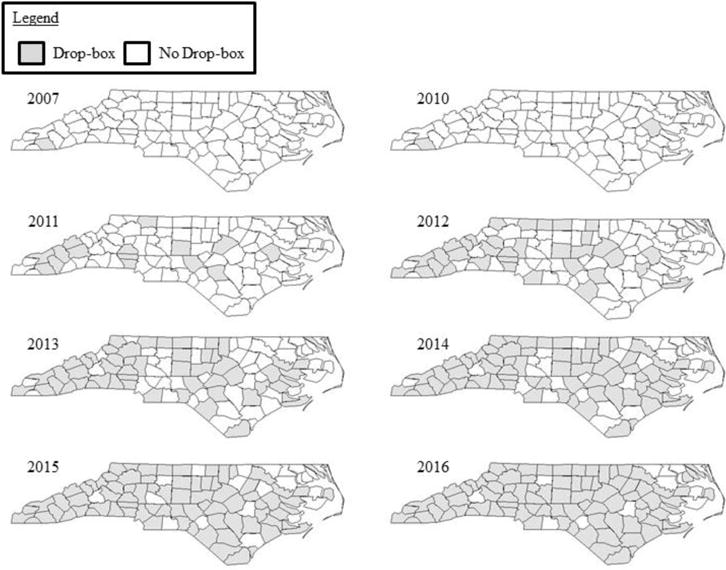
Drop-Box Implementation by County and Year
There were seven time invariant variables: population size, percentage of the population who are white, percentage of the population who are Hispanic, median household income, percentage of the population who live in rural area, percentage of the population with a four-year college degree or higher, and Appalachian county. There were four segmented time-dependent covariates: the annual rate of prescription opioid overdoses per 100,000, annual rate of controlled medications dispensed per person, presence of a substance abuse coalition, and percent adjacent counties with a drop-box. All the time-dependent covariates, except annual rate of controlled medications dispensed, were examined the year prior to drop-box implementation (e.g., association with 2010 rate of prescription opioid overdoses with drop-box implementation in 2011). The annual rate of controlled medications dispensed and drop-box implementation were analyzed in the same year (e.g., 2011 rate of controlled medications dispensed and drop-box implementation in 2011). This was due to annual rate of controlled medications only being available as early as 2011. Tests for collinearity revealed no issues (VIFs were < 2). All analyses were computed using SPSS version 24 (IBM Corp., Armonk, NY).
3. Results
3.1. Drop-Box Implementation
There were 311 drop-boxes implemented in North Carolina as of December 31, 2016 (Table 1). Of those, 154 were at police departments, 91 at Sheriff’s Offices, 45 were at pharmacies, and 21 were at other locations (e.g., hospitals, town halls, and fire stations). Across all nine years, law enforcement agencies (e.g., police departments and Sheriff’s offices) were the most common agencies to implement a drop-box. However, in 2014, following the final rule to the Secure and Responsible Drug Disposal Act of 2010, a growing number of pharmacies started implementing drop-boxes; and in 2016 30 new drop-boxes had been implemented in pharmacies.
Table 1.
Drop-Box Implementation by Location Type and Year
| Year | ||||||||||
|---|---|---|---|---|---|---|---|---|---|---|
| Location | 2007 | 2010 | 2011 | 2012 | 2013 | 2014 | 2015 | 2016 | Unknown | Total |
| Police | 1 | – | 14 | 13 | 23 | 31 | 24 | 36 | 12 | 154 |
| Sheriff | – | 1 | 11 | 19 | 11 | 18 | 15 | 9 | 7 | 91 |
| Pharmacy | – | – | – | 1 | 0 | 5 | 7 | 30 | 2 | 45 |
| Other | – | – | 1 | 2 | 1 | 3 | 2 | 10 | 2 | 21 |
| TOTAL | 1 | 1 | 26 | 35 | 35 | 57 | 48 | 85 | 23 | 311 |
Out of the 100 counties in North Carolina, 91 had a drop-box installed by December 31, 2016 (Figure 1 and Table 2). The first drop-box was installed in 2007 and the second was installed in 2010. There were 13 counties that got their first drop-box in 2011, 20 in 2012, 18 in 2013, 18 in 2014, 9 in 2015, and 8 in 2016 (Figure 1). Agencies in three counties could not recall the exact year that their drop-box had been implemented; these counties were not included in the survival analysis.
Table 2.
Characteristics of North Carolina Counties (n=100)
| Counties (n=100 counties) |
|
|---|---|
|
| |
| Drop-Boxes1 (# (%)) | 91 (91.0%) |
|
| |
| Year of Implementation 1 (# (%)) | |
| 2007 | 1 (1.0%) |
| 2010 | 1 (1.0%) |
| 2011 | 13 (13.0%) |
| 2012 | 20 (20.0%) |
| 2013 | 18 (18.0%) |
| 2014 | 18 (18.0%) |
| 2015 | 9 (9.0%) |
| 2016 | 8 (8.0%) |
| None | 7 (7.0%) |
| Date Unknown | 5 (5.0%) |
|
| |
| Adopter Characteristics | |
|
| |
| Population Size (mean (st. dev.)) | 98,453.3 (151,878.7) |
|
| |
| % White (mean (st. dev.)) | 72.3% (17.4%) |
|
| |
| % Black (mean (st. dev.)) | 20.4% (16.3%) |
|
| |
| % American Indian (mean (st. dev.)) | 1.6% (4.8%) |
|
| |
| % Asian (mean (st. dev.)) | 1.1% (1.3%) |
|
| |
| % Hawaiian or Pacific Islander (mean (st. dev.)) | 0% (0%) |
|
| |
| % Hispanic (mean (st. dev.)) | 6.9% (4.0%) |
|
| |
| Median Income (mean (st. dev.)) | $41,784.20 ($8,024.22) |
|
| |
| % Rural Population (mean (st. dev.)) | 61.3% (28.8%) |
|
| |
| % Residents with Bachelor Degree or Higher (mean (st. dev.)) | 20.3% (9.1%) |
|
| |
| Appalachian County (# (%)) | 29 (29.0%) |
|
| |
| RX Opioid Death Rate, Year Prior to Implementation (mean (st. dev.)) | 10.0 (9.6) |
|
| |
| RX Dispensing Rate, Year of Implementation (mean (st. dev.)) | 103.6 (31.1) |
|
| |
| Opioid | 65.4 (22.5) |
|
| |
| Benzodiazepine | 29.6 (10.84) |
|
| |
| Stimulant | 8.7 (2.5) |
|
| |
| Substance Abuse Coalition, Year Prior to Implementation | 45 (5.0) |
|
| |
| Adjacent to County with Drop-Box, Year of Implementation | 4.0% (3.4%) |
Between January 1, 2007 and December 31, 2016
3.2. Correlates of Drop-Box Implementation
In the univariate analyses (Table 3), counties with a higher percentage of whites (HR=1.02; 95% CI: 1.01, 1.04; p<0.001) and individuals with a bachelor’s degree or higher (HR=1.03; 95% CI: 1.01, 1.05; p=0.009), less rural (HR=0.99; 95% CI: 0.99, 1.00; p=0.045), considered to be Appalachian (HR=2.12; 95% CI: 1.32, 3.39; p=0.002), have a substance abuse prevention coalition (HR=1.59; 95% CI: 1.04, 2.44; p=0.033), higher prescription opioid death rates (HR=1.04; 95% CI: 1.01, 1.06; p=0.001) and higher rates of controlled medications dispensed (HR=1.01; 95% CI: 1.01, 1.02; p=0.001) were associated with drop-box implementation. Opioid (HR=1.01; 95% CI: 1.00, 1.02; p=0.007), benzodiazepine (HR=1.04; 95% CI: 1.02, 1.06; p<0.001), and stimulant (HR=1.13; 95% CI: 1.105, 1.22; p=0.001) dispensing rates were all associated with drop-box implementation (not shown in a table). In the multivariate Cox Regression model (Table 4), after adjusting for all statistically significant variables (at p<0.1), only the rate of controlled medication dispensed per person was statistically significant; with every controlled medicine unit (e.g., pill) dispensed per person the likelihood of drop-box implementation increased by 1% (HR=1.01; 95% CI: 1.00, 1.02; p=0.024).
Table 3.
Hazard ratios from the univariate Cox PH model for drop-box implementation (n=95)
| Univariate Analysis | ||||
|---|---|---|---|---|
| Covariate | Coefficient (bi) | HR [exp(bi)] | 95% CI | P-value |
| Population Size | 0.00 | 1.00 | 1.00, 1.00 | 0.174 |
| % White | 0.03 | 1.02 | 1.01, 1.04 | <0.001 |
| % Hispanic | 0.02 | 1.02 | 0.97, 1.07 | 0.434 |
| Median Income | 0.00 | 1.00 | 1.00, 1.00 | 0.239 |
| % Rural | −0.01 | 0.99 | 0.99, 1.00 | 0.045 |
| Appalachian | 0.75 | 2.12 | 1.32, 3.39 | 0.002 |
| % Bachelor + | 0.03 | 1.03 | 1.01, 1.05 | 0.009 |
| RX Death Rate | 0.03 | 1.04 | 1.01, 1.06 | 0.001 |
| RX Dispensing Rate Per Person | 0.01 | 1.01 | 1.01, 1.02 | 0.001 |
| Substance Abuse Coalition | 0.47 | 1.59 | 1.04, 2.44 | 0.033 |
| % Adjacent Counties with Drop-Box | 0.01 | 1.01 | 1.00, 1.02 | 0.103 |
HR = hazard ratio, CI = confidence interval
Table 4.
Hazard ratios from the multivariate Cox PH model for drop-box implementation (n=95)
| Multivariate Analysis | ||||
|---|---|---|---|---|
| Covariate | Coefficient (bi) | HR [exp(bi)] | 95% CI | P-value |
| % White | 0.01 | 1.01 | 1.00, 1.03 | 0.143 |
| % Rural | −0.01 | 0.99 | 0.98, 1.00 | 0.193 |
| Appalachian | 0.21 | 1.23 | 0.68, 2.22 | 0.494 |
| % Bachelor + | 0.02 | 1.02 | 0.98, 1.06 | 0.282 |
| RX Death Rate | 0.01 | 1.01 | 0.99, 1.04 | 0.332 |
| RX Dispensing Rate | 0.01 | 1.01 | 1.00, 1.02 | 0.024 |
| Substance Abuse Coalition | 0.15 | 1.16 | 0.72, 1.86 | 0.543 |
HR = hazard ratio, CI = confidence interval
4. Discussion
In order for drug disposal programs to have an impact on reducing the availability of controlled medications for nonmedical use, it is imperative that they are readily available and accessible to the general public. To our knowledge, this was the first study to examine the diffusion and implementation of drop-boxes. We found that, over nine years, 311 drop-boxes had been installed in 91 counties in North Carolina. While the number of drop-boxes in North Carolina has been growing, there are only 311 drop-boxes for a population of 9,845,333 spread across 53,819 square miles (United States Census Bureau/American FactFinder, 2015). It is unclear whether or not this is a sufficient number of drop-boxes to prevent initiation of prescription opioid misuse and related consequences.
We found that the majority of drop-boxes were located in law enforcement agency offices but, in recent years, a growing number of pharmacies began to implement drop-boxes. Initially, pharmacies that installed drop-boxes were locally-owned. However, in 2016 Walgreens installed 22 drop-boxes in North Carolina (Fitzgerald, 2016). Currently, research has only assessed the use of drop-boxes at law enforcement agencies (Egan et al., 2016; Gray et al., 2015). Gray et al. quantified controlled medication collections at 8 law enforcement drop-box locations in Northeast Tennessee over two years and found that the mean controlled substance donation rate was 1.39 pounds per 1000 residents (Gray et al., 2015). In order to determine how drop-box collections compare to the number of medications dispensed, Egan et al. compared the number of controlled medicine units disposed at drop-boxes to the number dispensed among a sample of drop-boxes in south central Kentucky. Their findings that less than 1% of controlled medications dispensed were subsequently disposed suggests that improvements could be made to make drop-boxes more effective (Egan et al., 2016) The expansion of drop-boxes in pharmacies, a location where the general public more frequently patrons compared to law enforcement agencies, may result in greater utilization of drop-boxes. Additional research is needed to assess the utilization of drop-boxes that are located in pharmacies in order to evaluate their potential impact.
Controlled medication dispensing rate was the only covariate statistically significant in the multivariate analysis. Consistent with our hypothesis based on Rogers’s concept of ‘relative advantage’ (2010), we found that high prescribing rates were positively associated with drop-box implementation even after controlling for other covariates. This finding suggests that counties with higher controlled medication dispensing rates may have implemented drop-boxes in order to reduce the availability of excess medications. These findings are promising in that counties in need of strategies that impact the availability of prescription drugs for nonmedical use have implemented disposal programs.
Several covariates were significant in a univariate but not the multivariate model. We conducted tests for collinearity which revealed that collinearity was not likely contributing to the loss of significance (VIFs were < 2). This suggests that after accounting for other variables related to drop-box implementation, these variables were no longer related. In univariate models, we found that counties with higher overdose rates, higher percentage of whites, Appalachian, more educated residents, and a substance abuse prevention coalition were more likely to implement drop-boxes. Whites (Vaughn, Nelson, Salas-Wright, Qian, & Schootman, 2016) and people in Appalachian communities (Jr, R, & Cg, 2008; McDonald, Carlson, & Izrael, 2012) are disproportionality impacted by NMPDU and overdose which is consistent with our hypothesis based on Rogers’s concept of ‘relative advantage’ (2010). Higher socioeconomic status, based on more years of formal education, may facilitate earlier knowledge about drop-boxes due to an increased number of communication channels through group membership and conference attendance (e.g., Community Anti-Drug Coalitions of America), as well as, access to opinion leadership who could support drop-box implementation (Rogers, 2010). Substance abuse prevention coalitions may have been ‘change agents’ (Rogers, 2010) involved in facilitation of drop-box implementation. As a change agent, substance abuse prevention coalitions may have emphasized the need for drop-boxes to be installed at law enforcement agencies, provided information about how to obtain and maintain a drop-box, and ensured that the plan was translated into action (Haider & Kreps, 2004). Additionally, substance abuse prevention coalitions may have funding sources to assist with the cost associated with drop-boxes (e.g., Drug-Free Communities). Thus, communities that have substance abuse prevention coalitions may be more willing and better equipped to implement strategies to reduce NMPDU and associated consequences. Given that these covariates were only significant in univariate models, their individual contribution to drop-box implementation should be considered outside of the community-wide context.
The body of literature on community-based disposal programs is growing but still infantile. Additional research is needed as prescription drug disposal programs, especially drop-boxes, continue to be implemented in communities. While we found that the majority of the counties within North Carolina had implemented a drop-box by 2016, it is unclear whether the number of drop-boxes is sufficient or if community members perceive them to be accessible. Future research should examine community members’ perceptions of the accessibility of drop-boxes and willingness to utilize them. Additionally, similar studies should be conducted in other states, especially those with high prevalence of NMPDU and associated consequences, to assess diffusion of drop-boxes and gaps in disposal services. Given that published studies, thus far, have only focused on drop-boxes located at law enforcement agencies, research is especially needed to examine drop-boxes implemented at pharmacies. Specifically, it is important to study the diffusion of drop-boxes at pharmacies, motivations for and barriers to implementation, and the utilization of pharmacy drop-boxes (e.g., quantity of controlled medications disposed).
4.1 Limitations
There were several limitations that should be addressed. First, while the implementation date was found for some drop-box locations through a web-search, many of the dates relied on calls to the agency or business that housed the drop-box. The individuals may not have been able to accurately recall the year that the drop-box was implemented, thus, introducing recall bias. Second, the study was only conducted in North Carolina and may not be generalizable to other states. However, the findings may be more generalizable to states that have similar characteristics as North Carolina especially those ranked in the top 20 for both opioid prescribing and opioid overdose rates and that have Appalachian counties. Additionally, other covariates that were not examined may have contributed to the implementation of drop-boxes. For example, funding opportunities may have had a significant contribution to the implementation of drop-boxes. Over the study period, there were several funding mechanisms that supported substance abuse prevention in communities. These included Substance Abuse and Mental Health Services Administration’s (SAMHSA) Strategic Prevention Framework State Initiative Grant, Office of Juvenile Justice and Delinquency Prevention’s Preventing Underage Drinking, SAMHSA’s Partnerships for Success, North Carolina’s Department of Health and Human Services, and Project Lazarus. Given the variability in the timing of the funding and the limited availability of the data, these funding opportunities were not included as possible covariates. Additionally, there may have been partnerships outside of substance abuse prevention coalitions that facilitated drop-box implementation (e.g., Healthy Carolinians, Safe Kids, environmental organizations). Also, adverse events in a community, such as a prescription opioid overdose death, may have influenced adoption of a drop-box.
5. Conclusions
Given the surplus of controlled medications in communities, opportunities for individuals to safely dispose of unused or expired medications, such as drop-boxes, is an important strategy to reduce the availability of controlled medications for nonmedical use and diversion. However, if drop-boxes are not widely available in locations were the general public frequently patrons, their potential may not be fully utilized. This was the first study to examine the diffusion of drop-boxes to dispose of unused or expired controlled medications. There was a total of 311 drop- boxes implemented in 91 out of 100 counties in North Carolina over nine years. While the majority of drop-boxes were located at law enforcement agencies, there were a growing number of pharmacies that implemented drop-boxes in more recent years. Additionally, the finding that communities with higher rates of controlled medication were more likely to be earlier adopters of drop-boxes is promising given that they likely have the highest need for disposal opportunities. Future research is needed to assess the effectiveness of drop-boxes as they become more widespread in a variety of locations.
Highlights.
There were 311 drop-boxes implemented in 91 (out of 100) counties in NC.
Most drop-boxes were in law enforcement offices; a growing number in pharmacies.
Medication dispensing rate was positively associated with implementation.
Future research should assess effectiveness of drop-boxes at pharmacies.
Acknowledgments
We wish to thank Fred Wells Brason II, CEO of Project Lazarus, for providing assistance with identifying active drop-box locations in North Carolina. Additionally, we would like to show appreciation the community organizations and law enforcement agencies that provided information about active drop-boxes in their communities and the North Carolina Parent Resource Center for providing us with the list of substance abuse prevention coalitions in North Carolina. Dr. Eunyoung Song was instrumental in providing guidance on the use of ArcGIS to create the diffusion graphs.
Funding
This research was supported by the NIDA T32 training grant at the UF Substance Abuse Training Center in Public Health from the National Institutes of Health (T32DA035167). The content is solely the responsibility of the authors and does not necessarily represent the official views of the National Institutes of Health.
Footnotes
Publisher's Disclaimer: This is a PDF file of an unedited manuscript that has been accepted for publication. As a service to our customers we are providing this early version of the manuscript. The manuscript will undergo copyediting, typesetting, and review of the resulting proof before it is published in its final citable form. Please note that during the production process errors may be discovered which could affect the content, and all legal disclaimers that apply to the journal pertain.
Contributors
Kathleen Egan conceptualized the study, collected and analyzed the data, and composed the manuscript. Mark Wolfson assisted with the conceptualization of the study, provided the list of substance abuse prevention coalitions from as the PI of the North Carolina Coalition Initiative Coordinating Center, and provided feedback on the manuscript. William Dudley provided guidance on the statistical analysis and provided feedback on the manuscript. Vincent Francisco, Robert Strack, David Wyrick, and Michael Perko assisted with the conceptualization of the study and provided feedback on the manuscript.
Conflict of Interest
All other authors declare that they have no conflicts of interest.
References
- Babor T, Caetano R, Casswell S, Edwards G, Giesbrecht N, Graham K, Rossow I. Alcohol: No Ordinary Commodity. 2nd. Oxford: Oxford University Press; 2010. Retrieved from https://books.google.com/books/about/Alcohol_No_Ordinary_Commodity.html?id=bbcdAAAAQBAJ. [Google Scholar]
- Bates C, Laciak R, Southwick A, Bishoff J. Overprescription of postoperative narcotics: a look at postoperative pain medication delivery, consumption and disposal in urological practice. The Journal of Urology. 2011;185(2):551–555. doi: 10.1016/j.juro.2010.09.088. [DOI] [PubMed] [Google Scholar]
- Berning A, Compton R, Wochinger K. National Roadside Survey of alcohol and drug use by drivers. Washington, DC: National Highway Traffic Safety Administration; 2015. (No. DOT HS 812 118). Retrieved from http://www.trb.org/Main/Blurbs/172097.aspx. [Google Scholar]
- Bruneau J, Roy É, Arruda N, Zang G, Jutras-Aswad D. The rising prevalence of prescription opioid injection and its association with hepatitis C incidence among street-drug users. Addiction. 2012;107(7):1318–1327. doi: 10.1111/j.1360-0443.2012.03803.x. [DOI] [PubMed] [Google Scholar]
- CADCA. Coalitions in action: michigan coalition combats prescription drug abuse with red med boxes. 2014 Aug 7; Retrieved August 15, 2014, from http://www.cadca.org/resources/detail/coalitions-action-michigan-coalition-combats-prescription-drug-abuse-red-med-boxes.
- CDC. National vital statistics system mortality data. 2015a Retrieved June 11, 2015, from http://www.cdc.gov/nchs/deaths.htm.
- CDC. Data Overview. 2015b Apr 3; Retrieved April 19, 2015, from http://www.cdc.gov/drugoverdose/data/index.html.
- Center for Behavioral Health Statistics and Quality. (NSDUH Series H-50 No. HHS Publication No. SMA 15-4927).Behavioral Health Trends in the United States: Results from the 2014 National Survey on Drug Use and Health. 2015 Retrieved from Retrieved from http://www.samhsa.gov/data/
- Chen L, Hedegaard H, Warner M. Quickstats: rates of deaths from drug poisoning and drug poisoning involving opioid analgesics — united states, 1999–2013. Hyattsville, MD: 2015. (Morbidity and Mortality Weekly Report No. 64). Retrieved from http://www.cdc.gov/mmwr/preview/mmwrhtml/mm6401a10.htm. [Google Scholar]
- Compton WM, Volkow ND. Abuse of prescription drugs and the risk of addiction. Drug & Alcohol Dependence. 2006;83:S4–S7. doi: 10.1016/j.drugalcdep.2005.10.020. [DOI] [PubMed] [Google Scholar]
- Conrad C, Bradley HM, Broz D, Buddha S, Chapman EL, Galang RR, Centers for Disease Control and Prevention (CDC) Community Outbreak of HIV Infection Linked to Injection Drug Use of Oxymorphone–Indiana, 2015. MMWR Morbidity and Mortality Weekly Report. 2015;64(16):443–444. [PMC free article] [PubMed] [Google Scholar]
- DEA. Secure and Responsible Drug Disposal Act of 2010, Pub. L. No. 174, 79 21 CFR Parts 1300, 1301, 1304, 1305, 1307, and 1317 (2014). Retrieved from http://www.deadiversion.usdoj.gov/fed_regs/rules/2014/2014-20926.pdf
- DEA. Controlled Substance Public Disposal Locations - Search Utility. (n.d.) Retrieved May 24, 2017, from https://apps.deadiversion.usdoj.gov/pubdispsearch/spring/main?execution=e1s1.
- Egan K, Gregory E, Sparks M, Wolfson M. From dispensed to disposed: Evaluating the effectiveness of disposal programs through a comparison with prescription drug monitoring program data. The American Journal of Drug and Alcohol Abuse. 2016 doi: 10.1080/00952990.2016.1240801. [DOI] [PubMed] [Google Scholar]
- Fischer B, Murphy Y. Policy Measures for Prescription Opioids and Harms: Enough to Protect Public Health? A Comment on Yanovitzky (2016) and Piper et al. (2016) Journal of Studies on Alcohol and Drugs. 2016;77(4):566–567. doi: 10.15288/jsad.2016.77.566. [DOI] [PubMed] [Google Scholar]
- Fitzgerald E. Walgreens adds local medicine disposal dropoff. 2016 Retrieved April 21, 2017, from http://www.newbernsj.com/business/20160804/walgreens-adds-local-medicine-disposal-dropoff.
- Goodnough A. Police, Battling Wave of Crime, Urge Homeowners to Turn in Old Prescriptions. The New York Times. 2010 Sep 23; Retrieved from http://www.nytimes.com/2010/09/24/us/24drugs.html.
- Gray J, Hagemeier N, Brooks B, Alamian A. Prescription Disposal Practices: A 2- Year Ecological Study of Drug Drop Box Donations in Appalachia. American Journal of Public Health. 2015;105(9):e1–e6. doi: 10.2105/AJPH.2015.302689. [DOI] [PMC free article] [PubMed] [Google Scholar]
- Green LW, Ottoson JM, García C, Hiatt RA. Diffusion theory and knowledge dissemination, utilization, and integration in public health. Annual Review of Public Health. 2009;30:151–174. doi: 10.1146/annurev.publhealth.031308.100049. [DOI] [PubMed] [Google Scholar]
- Haider M, Kreps GL. Forty Years of Diffusion of Innovations: Utility and Value in Public Health. Journal of Health Communication. 2004;9(sup1):3–11. doi: 10.1080/10810730490271430. [DOI] [PubMed] [Google Scholar]
- Jr H, R W, Cg L. Prescription opioid use in the rural Appalachia: a community-based study. Journal of Opioid Management. 2008;4(2):63–71. doi: 10.5055/jom.2008.0010. [DOI] [PubMed] [Google Scholar]
- Kaiser Family Foundation. Prescription Opioid Overdose Deaths and Death Rate per 100,000 Population (Age-Adjusted) 2017 Retrieved April 16, 2017, from http://kff.org/other/state-indicator/prescription-opioid-overdose-deaths-and-death-rate-per-100000-population-age-adjusted/
- Kuspis DA, Krenzelok EP. What happens to expired medications? A survey of community medication disposal. Veterinary and Human Toxicology. 1996;38(1):48–49. [PubMed] [Google Scholar]
- Lewis ET, Cucciare MA, Trafton JA. What do Patients do with Unused Opioid Medications? The Clinical Journal of Pain. 2014;30(8):654–662. doi: 10.1097/01.ajp.0000435447.96642.f4. [DOI] [PubMed] [Google Scholar]
- McCabe SE, Boyd CJ. Sources of prescription drugs for illicit use. Addictive Behaviors. 2005;30(7):1342–1350. doi: 10.1016/j.addbeh.2005.01.012. [DOI] [PMC free article] [PubMed] [Google Scholar]
- McDonald DC, Carlson K, Izrael D. Geographic variation in opioid prescribing in the US. The Journal of Pain: Official Journal of the American Pain Society. 2012;13(10):988–996. doi: 10.1016/j.jpain.2012.07.007. [DOI] [PMC free article] [PubMed] [Google Scholar]
- ONDCP. Epidemic: Responding to America’s Prescription Drug Abuse Crisis. 2011 Retrieved from https://www.whitehouse.gov/sites/default/files/ondcp/issues-content/prescription-drugs/rx_abuse_plan.pdf.
- Paulozzi LJ, Mack KA, Hockenberry JM. Variation among states in prescribing of opioid pain relievers and benzodiazepines — United States, 2012. Journal of Safety Research. 2014;51:125–129. doi: 10.1016/j.jsr.2014.09.001. [DOI] [PubMed] [Google Scholar]
- Rogers EM. Diffusion of Innovations. 4th. New York, NY: Simon and Schuster; 2010. [Google Scholar]
- Ross-Durow PL, McCabe SE, Boyd CJ. Adolescents’ Access to Their Own Prescription Medications in the Home. The Journal of Adolescent Health: Official Publication of the Society for Adolescent Medicine. 2013 doi: 10.1016/j.jadohealth.2013.02.012. [DOI] [PMC free article] [PubMed]
- Safe KidsNC. Drop Boxes by County. (n.d.) Retrieved May 24, 2017 from https://apps.ncdoi.net/f?p=102:24:::NO:::
- SAMHSA. The DAWN Report: Highlights of the 2011 Drug Abuse Warning Network (DAWN) Findings on Drug-Related Emergency Department Visits. Rockville, MD: 2013. Retrieved from http://archive.samhsa.gov/data/2k13/DAWN127/sr127-DAWN-highlights.htm. [PubMed] [Google Scholar]
- Stewart H, Malinowski A, Ochs L, Jaramillo J, McCall K, Sullivan M. Inside Maine’s Medicine Cabinet: Findings From the Drug Enforcement Administration’s Medication Take-Back Events. American Journal of Public Health. 2014;105(1):e1–e7. doi: 10.2105/AJPH.2014.302207. [DOI] [PMC free article] [PubMed] [Google Scholar]
- United States Census Bureau/American FactFinder. 2010–2015 American Community Survey. Census Bureau’s American Community Survey Office; 2015. Retrieved from http://factfinder2.census.gov. [Google Scholar]
- Vaughn MG, Nelson EJ, Salas-Wright CP, Qian Z, Schootman M. Racial and ethnic trends and correlates of non-medical use of prescription opioids among adolescents in the United States 2004–2013. Journal of Psychiatric Research. 2016;73:17–24. doi: 10.1016/j.jpsychires.2015.11.003. [DOI] [PubMed] [Google Scholar]
- Warner M, Hedegaard H, Chen LH. Trends in Drug-poisoning Deaths Involving Opioid Analgesics and Heroin: United States, 1999–2012. Hyattsville, MD: National Center for Health Statistics; 2014. Retrieved from http://www.cdc.gov/nchs/data/hestat/drug_poisoning/drug_poisoning.htm. [Google Scholar]
- Yanovitzky I. The American Medicine Chest Challenge: Evaluation of a Drug Take- Back and Disposal Campaign. Journal of Studies on Alcohol and Drugs. 2016;77(4):549–555. doi: 10.15288/jsad.2016.77.549. [DOI] [PubMed] [Google Scholar]
- Zibbell JE, Iqbal K, Patel RC, Suryaprasad A, Sanders KJ, Moore-Moravian L, Centers for Disease Control and Prevention (CDC) Increases in hepatitis C virus infection related to injection drug use among persons aged ≤30 years - Kentucky, Tennessee, Virginia, and West Virginia, 2006–2012. MMWR Morbidity and Mortality Weekly Report. 2015;64(17):453–458. [PMC free article] [PubMed] [Google Scholar]