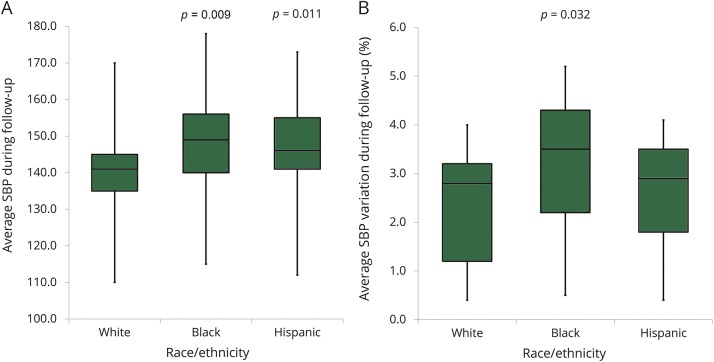
Figure 1. SBP following ICH by race and ethnicity.
(A) Average SBP during follow-up after ICH, by self-reported race/ethnicity. (B) Average SBP variation (SD/mean) during follow-up, by self-reported race/ethnicity. Boxplot upper and lower margins indicate 25th and 75th percentiles of average SBP during follow-up (A) and average SBP variation (%) during follow-up (B). Horizontal lines in boxes indicate corresponding median values. ICH = intracerebral hemorrhage; SBP = systolic blood pressure.

