Abstract
Objective
While epilepsy studies rarely examine brainstem, we sought to examine the hypothesis that temporal lobe epilepsy (TLE) leads to subcortical arousal center dysfunction, contributing to neocortical connectivity and neurocognitive disturbances.
Methods
In this case-control study of 26 adult patients with TLE and 26 controls, we used MRI to measure structural and functional connectivity of the cuneiform/subcuneiform nuclei (CSC), pedunculopontine nucleus, and ventral tegmental area. Ascending reticular activating system connectivity patterns were related to neuropsychological and disease measures.
Results
Compared to controls, patients with TLE demonstrated reductions in ascending reticular activating system structural and functional connectivity, most prominently to neocortical regions (p < 0.05, unpaired t tests, corrected). While reduced CSC structural connectivity was related to impaired performance IQ and visuospatial memory, diminished CSC functional connectivity was associated with impaired verbal IQ and language abilities (p < 0.05, Spearman ρ, t tests). Finally, CSC structural connectivity decreases were quantitatively associated with consciousness-impairing seizure frequency (p < 0.05, Spearman ρ) and the presence of generalized seizures (p < 0.05, unpaired t test), suggesting a relationship to disease severity.
Conclusions
Connectivity perturbations in brainstem arousal centers are present in TLE and may contribute to neurocognitive problems. These studies demonstrate the underappreciated role of brainstem networks in epilepsy and may lead to novel neuromodulation targets to treat or prevent deleterious brain network effects of seizures in TLE.
Mesial temporal lobe epilepsy (TLE) is the most common focal epilepsy syndrome.1,2 Recurrent limbic seizures often lead to gray matter atrophy, cortical hypometabolism, and alterations of functional and structural connectivity throughout diffuse brain regions.3–5 It is likely that these long-term functional and anatomical changes contribute to the neurocognitive and behavioral problems seen in this disorder.6–8 However, it remains unclear how seizures in a “focal” epilepsy syndrome with an epileptogenic zone (EZ) in the mesial temporal lobe might lead to these more “global” brain problems in TLE.
We have hypothesized that ictal events in patients with TLE might lead to persistent interictal subcortical/cortical network disturbances that may influence both neocortical connectivity and neurocognitive function.3,9 Although network studies of epilepsy rarely focus on brainstem structures, many of the subcortical regions most critical for neocortical activation and arousal are contained in the brainstem ascending reticular activating system (ARAS).10–12 In a recent fMRI study, we described overall reductions in functional connectivity between the ARAS and the remainder of the brain in patients with TLE.8 However, network connections between individual ARAS nuclei to specific brain regions have rarely been investigated or related to disease or neurocognitive measures. Also, fMRI measurements alone without structural connectivity analysis provide only limited network information, because direct vs indirect connections cannot be discerned.13 Therefore, herein we present a neuroimaging study examining both structural and functional connectivity of selected ARAS structures, including the cuneiform/subcuneiform nuclei (CSC), pedunculopontine [tegmental] nucleus (PPN), and ventral tegmental area (VTA) in patients with TLE.
Methods
Participants
Participants included 26 adult patients with mesial TLE who underwent evaluation for epilepsy surgery at Vanderbilt University Medical Center from 2012 to 2016 and consented to participate. This number represents approximately one-third of patients with mesial TLE who received surgery during this period. In addition, 26 healthy controls were recruited and individually matched to each patient by age, sex, and handedness to help limit selection bias and confounding. Overall, the mean (±SD) age was 37.9 ± 12.7 years for patients and 38.5 ± 12.9 years for controls, and both participant groups were 50% female and 89% right-handed.
Standard protocol approvals, registrations, and patient consents
Informed consent was obtained from all participants, and all procedures were approved by the Vanderbilt University Medical Center institutional review board.
Imaging
MRI was performed using a Philips Achieva 3T scanner (Philips Healthcare, Best, the Netherlands) utilizing a 32-channel head coil. Image acquisition included (1) 3-dimensional, T1-weighted series for segmentation and normalization (gradient echo, 4.6 milliseconds [ms] echo time, 9.1 ms repetition time, flip angle = 8°, 192 shots, matrix = 256 × 256, 1 × 1 × 1 mm3); (2) 2-dimensional, axial T1-weighted images for structural to functional data coregistration (1 × 1 × 4 mm3); (3) diffusion-weighted imaging (b = 1,600 s/mm2, 92 directions, 2.5 ×. 2.5 × 2.5 mm3); and (4) 2 T2*-weighted blood oxygenation level–dependent fMRI series with eyes closed at rest (field of view = 240 mm, 35 ms echo time, 2 seconds repetition time, 34 axial slices, slice thickness = 3.5 mm/0.5 mm gap, matrix = 80 × 80, 3 × 3 × 4 mm3), with 300 volumes during each of two 10-minute scans. Respiratory and cardiac fluctuations were monitored at 500 Hz.
Structural and functional connectivity measurements
Regions for connectivity analysis included (1) CSC, PPN, and VTA from the Harvard Ascending Arousal Network Atlas (martinos.org/resources/aan-atlas), and (2) 105 cortical/subcortical (excluding cerebellar) regions from the Harvard-Oxford atlas (fmrib.ox.ac.uk/fsl/).
For structural connectivity, diffusion tensor images (DTIs) were processed using FSL (fsl.fmrib.ox.ac.uk/fsl/fslwiki/) probabilistic fiber tracking.14 For the brainstem atlas coregistration, we used a rigid and nonrigid registration through each participant's T1 imaging to the participant fractional anisotropy map. For cortical regions, we used SPM8 (fil.ion.ucl.ac.uk/spm/software/spm8/) and normalized the atlas to the participant's B0 map in the gray matter, since the fractional anisotropy maps do not show cortical gray matter well. Voxel-wise diffusion measurements were estimated using the Bayesian approach in the BEDPOSTX algorithm. The probabilistic fiber-tracking algorithm with crossing fibers (PROBTRACKX) was used to investigate tracts seeded from 3 ARAS structures individually to 105 cortical/subcortical regions (targets). The PROBTRACKX algorithm used 5,000 trials from each voxel in the seed region and tracked a streamline until it exceeded number of steps per sample (2,000), step length (0.5 mm), or curvature (0.2 or ±80°). The tracking was corrected for distance from the seed so that the results would not be driven solely by local connectivity. “Structural connectivity” was estimated as the sum of all tracts from all voxels in the seed region that passed through the target region, to best approximate the overall structural connections between these regions. In addition, for visualization of deterministic diffusion tractography in example participants, we utilized the BrainSuite Diffusion Pipeline (brainsuite.org/), although all quantitative analyses were performed on the results of our probabilistic analysis.
For functional connectivity, SPM8 and MATLAB 2016b (The MathWorks, Inc., Natick, MA) were used to preprocess fMRIs. Preprocessing included slice timing correction, realignment, physiologic correction with Retrospective Image Correction (RETROICOR),15 segmentation into white matter, gray matter, and CSF, and spatial normalization to the MNI (Montreal Neurological Institute) template. We spatially normalized and coregistered the fMRIs through T1 to the cortical/subcortical atlas using SPM. For each fMRI session (2) in each participant, functional connectivity was computed between each (3) ARAS region and each (105) cortical or subcortical area as a partial Pearson correlation between each structure's time series, with 6 motion time series and mean white matter serving as confounds. For each participant, Fisher z score matrix was calculated utilizing the average z score across both fMRI trials. In addition, for visualization of ARAS functional connectivity group differences, we utilized the CONN toolbox 17 (nitrc.org/projects/conn/).
Clinical and neuropsychological data
Patient demographics, seizure semiology, and epilepsy details—including seizure type and frequency, epilepsy duration, and history of secondarily generalized tonic-clonic seizures (GTCS)—were obtained from epileptologist clinical assessments. Overall, 65.4% of patients had a history of GTCS, 73.1% had mesial temporal sclerosis on clinical MRI, and the epileptogenic side was on the right for 69.2% of individuals.
A licensed neuropsychologist administered a neuropsychological examination to patients. These evaluations included tests of verbal IQ, performance IQ, attention and concentration, cognitive processing, executive function, language abilities, verbal memory, and visuospatial memory. The tests utilized in each category have been listed in a previous study.8 Performance within test batteries was estimated as average/above average (40–100th percentile) or below average (0–40th percentile) compared to a standard normative population. One patient without available neuropsychological data was excluded.
Statistical analyses
Unpaired t tests were used to compare mean structural connectivity (number of tracts) and functional connectivity (z score) between patients and controls across 3 ARAS structures and 105 cortical/subcortical regions. Maximum motion in the translational and rotational directions from fMRI sessions were also compared between patients and controls with unpaired t tests. In patients, relationships between mean ARAS structural or functional connectivity were related to continuous/ordinal clinical variables using Spearman ρ and to categorical variables using unpaired t tests. The lasso regression technique16 was utilized (5-fold cross-validation, 10 Monte Carlo repetitions) to examine relationships between IQ values and functional/structural connectivity across the 105 cortical/subcortical regions. MATLAB 2016b and SPSS 23 (IBM Corp., Armonk, NY) were used to perform statistical analyses, with significance assessed at p < 0.05. Corrections for multiple comparisons were performed using the Bonferroni-Holm method where applicable.
Data availability
The present study is compliant with the journal's data availability standards, and any data not provided in the article may be shared at the request of other investigators.
Results
ARAS structural connectivity in patients with epilepsy vs controls
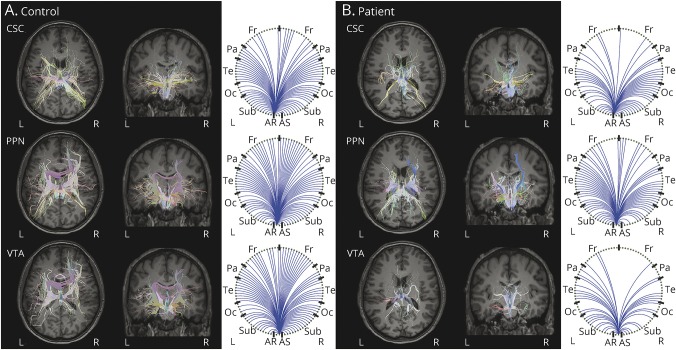
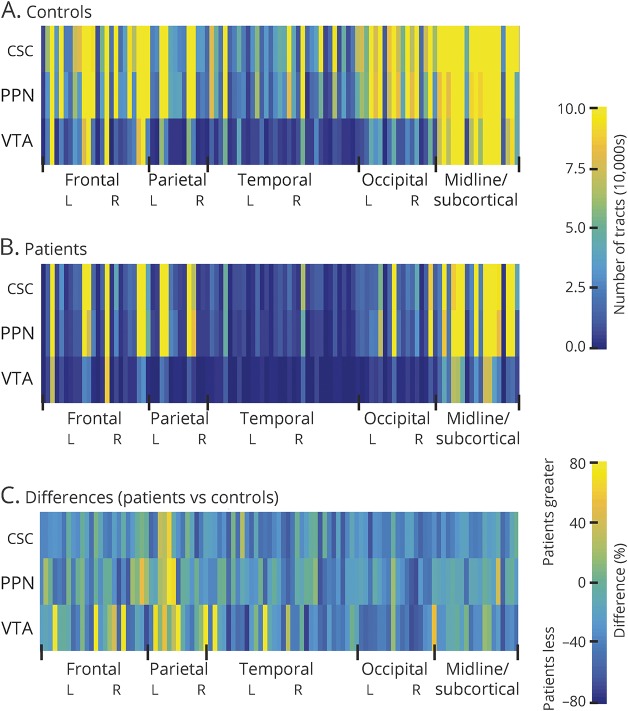
Diffusion tractography in an example control (figure 1A) and example patient (figure 1B) revealed fewer tracts reaching targets seeded from CSC, PPN, and VTA in the patient compared to the control, particularly to distant neocortical regions. Color maps summarizing group data in controls (figure 2A) and patients (figure 2B) demonstrated that CSC, PPN, and VTA structural connectivity was highest in midline and subcortical regions. Overall, mean structural connectivity from all 3 ARAS structures to all 105 cortical/subcortical regions was reduced in patients compared to controls (p < 0.01, t = 3.6) (figure 2C). In 20 patients (77%), overall ARAS structural connectivity was lower than the median value in controls, while 6 patients (23%) had higher connectivity than the control median.
Figure 1. Example ARAS structural connectivity in single participants.
Diffusion tractography seeded from CSC, PPN, and VTA in a 31-year-old right-handed male control participant (A) and a 30-year-old right-handed male with right-sided temporal lobe epilepsy (B) are shown. Figures are generated using the BrainSuite Diffusion Pipeline (brainsuite.org/). On the left of panels A and B, estimated diffusion tensors are overlaid onto T1-weighted axial (furthest to left) and coronal anatomical images using a rigid mutual information-based registration. The circle graphs on the right of panels A and B summarize which regions in BrainSuite's SVReg atlas received projections from the ARAS seed region. Overall, fewer tracts are seen in the patient (B) compared to the control (A) for all 3 ARAS seed regions, particularly to cortical regions. BrainSuite settings: 1 seed/voxel, step-size = 0.25 mm, maximum steps = 500, angle threshold = 10°, fractional anisotropy threshold = 0.05, orientation distribution function sampling = 20, generalized fraction anisotropy/lambda 2 threshold = 0.01. ARAS = ascending reticular activating system; CSC = cuneiform/subcuneiform nuclei; Fr = frontal; Oc = occipital; Pa = parietal; PPN = pedunculopontine nucleus; Sub = subcortical; SVReg = surface-constrained volumetric registration; Te = temporal; VTA = ventral tegmental area.
Figure 2. ARAS structural connectivity patterns in patients with epilepsy vs controls.
(A and B) Color maps representing mean structural connectivity values between 3 ARAS structures and 105 cortical/subcortical regions across controls (A) and patients with epilepsy (B). (C) Color map depicting structural connectivity differences (%) in patients vs controls across all regions, showing mostly decreases in patients. For controls, the mean number of tracts from each of 3 ARAS regions to each of 105 cortical/subcortical regions ranged from 78,775 to 217,049, while in patients, this range was 51,431 to 152,950. Twenty-six patients and 26 matched controls. ARAS = ascending reticular activating system; CSC = cuneiform/subcuneiform nuclei; PPN = pedunculopontine nucleus; VTA = ventral tegmental area.
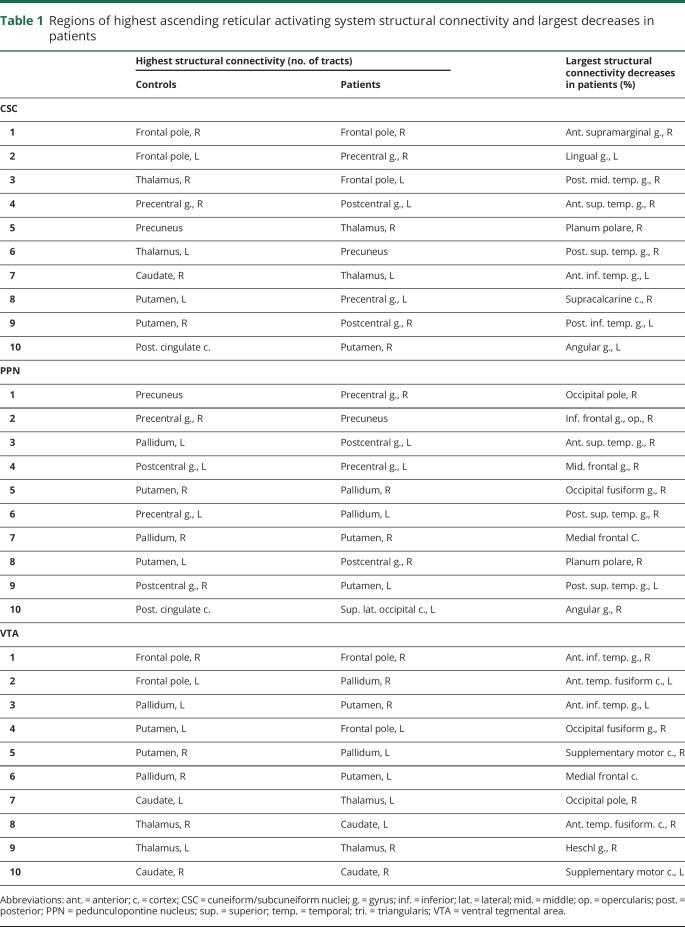
Table 1 lists regions of highest CSC, PPN, and VTA structural connectivity in both controls and patients, as well as the areas of largest connectivity decreases in patients. Overlap between regions of highest ARAS connectivity across individual controls was relatively high for CSC (59.6%), PPN (73.8%), and VTA (70.8%), suggesting adequate reproducibility of the analysis. Only neocortical regions showed the largest decreases in ARAS structural connectivity in patients compared to controls, including temporal, frontal, and occipital cortices. Of note, our structural connectivity measures were influenced by seed region size, but no differences in the number of seed voxels were observed between patients and controls for any ARAS region, and no differences in voxel counts among cortical/subcortical regions were noted between participant groups (p > 0.05 for each, t tests, uncorrected). Furthermore, in an example analysis examining the mean number of tracts per voxel in ARAS regions instead of the sum, mean ARAS structural connectivity remained lower in patients compared to controls (p < 0.01, t test). Finally, maximum translational motion during DTI sessions was 1.6 ± 0.6 mm for controls and 1.9 ± 0.6 mm for patients (p = 0.12, t = 1.9), while maximum rotational motion was 1.3 ± 0.3 degrees for controls and 1.5 ± 0.6 degrees for patients (p = 0.13, t = 1.5).
Table 1.
Regions of highest ascending reticular activating system structural connectivity and largest decreases in patients
ARAS functional connectivity in patients with epilepsy vs controls
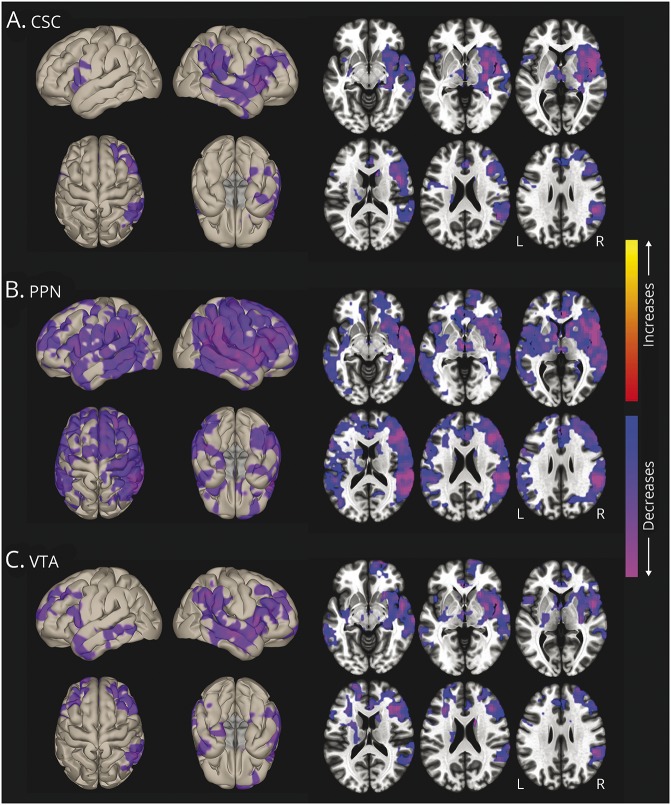
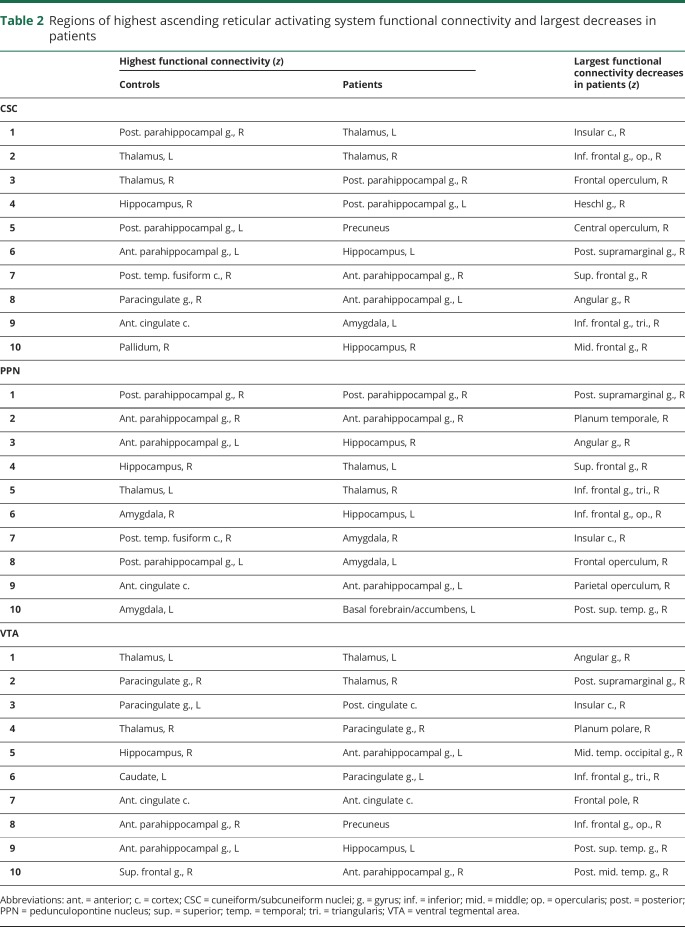
Voxel-wise functional connectivity t-maps (figure 3) showed connectivity reductions in patients in insular, frontal, temporal, and parietal neocortical areas, and more prominent PPN decreases (figure 3B) were noted compared to CSC (figure 3A) and VTA (figure 3C). Overall, mean functional connectivity between all 3 ARAS structures and 105 cortical/subcortical regions was diminished in patients vs controls (p < 0.01, t = 3.5). In 20 patients (77%), overall ARAS functional connectivity was lower than the median value in controls, while 6 patients (23%) had higher connectivity than the control median. Table 2 lists regions with highest ARAS functional connectivity in controls and patients, and areas of largest connectivity decreases in patients.
Figure 3. ARAS functional connectivity decreases in patients with epilepsy.
Surface (left) and axial (right) views of voxel-wise functional connectivity differences in patients compared to controls, seeded from CSC (A), PPN (B), and VTA (C). Seed-to-voxel functional connectivity (bivariate correlation) maps comparing patients and controls (t test) were generated for each ARAS region using the CONN toolbox 17 (nitrc.org/projects/conn/). In all 3 regions, connectivity decreases in patients are observed in insular, frontal, temporal, and parietal neocortical areas, with larger changes on the right side. Decreases appear most prominent in PPN-seeded connectivity maps, also involving subcortical structures such as thalamus and basal ganglia. No increases are seen in patients. Data represent t tests in 26 patients vs 26 matched controls (cluster threshold level p < 0.01, with false discovery rate correction). ARAS = ascending reticular activating system; CSC = cuneiform/subcuneiform nuclei; PPN = pedunculopontine nucleus; VTA = ventral tegmental area.
Table 2.
Regions of highest ascending reticular activating system functional connectivity and largest decreases in patients
Of note, maximum translational motion during fMRI was higher in patients (1.4 ± 0.8 mm; mean ± SD) than controls (0.8 ± 0.4 mm; p < 0.01, t = 3.4), while maximum rotational motion was more similar between patients (1.2 ± 0.8) and controls (0.9 ± 0.7 degrees; p = 0.16, t = 1.4). However, in a subset of 12 of 26 matched participant pairs that were also individually matched for maximum translational motion (±0.5 mm), mean ARAS functional connectivity remained lower in patients vs controls (p = 0.018, t = 2.6).
Comparing overall mean structural and functional ARAS connectivity patterns
As summarized in figure 4, A and B, we observed decreases in both mean structural (figure 4A) and functional connectivity (figure 4B) between CSC and VTA and the mean of all 105 cortical/subcortical regions, as well as diminished PPN functional connectivity (p < 0.05, t = 2.1–4.0). In examining laterality, we did not observe differences in right vs left structural connectivity in controls or patients, either when averaged across all 3 ARAS structures (figure 4C) or when examined individually (not shown). However, ARAS functional connectivity in patients but not controls was diminished in right-sided cortical/subcortical areas compared to left-sided regions (figure 4D). Analyzed differently, no differences were observed between structural (figure 4E) or functional (figure 4F) connectivity in the hemisphere ipsilateral vs contralateral to the EZ in patients (69.2% had a right-sided EZ).
Figure 4. Summary of ARAS functional and structural connectivity in patients vs controls.
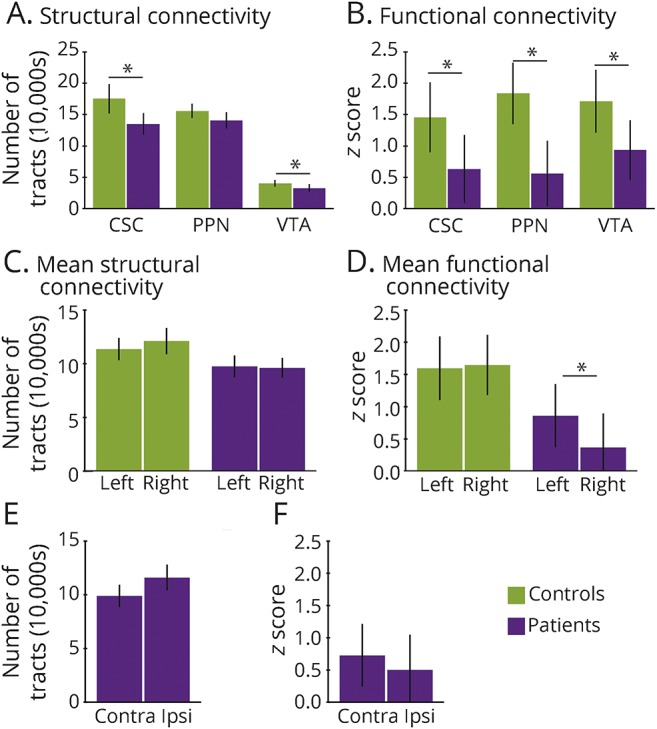
(A) Overall decreases in CSC and VTA structural connectivity are observed in patients vs controls, while the difference in PPN connectivity is not statistically significant. Values represent the mean number of tracts across all 105 cortical/subcortical regions. (B) Decreases in CSC, PPN, and VTA functional connectivity are seen in patients vs controls, with values representing mean z scores across 105 cortical/subcortical regions. (C) Mean ARAS structural connectivity does not differ across left- vs right-sided subcortical/cortical regions, in either patients or controls. Values represent the average of all 3 ARAS structures. (D) In patients, but not in controls, mean ARAS functional connectivity is reduced in the right hemisphere compared to the left. (E and F) In patients, no differences were observed between structural (E) or functional (F) connectivity in the hemisphere ipsilateral to the epileptogenic zone vs the contralateral side. Twenty-six patients and 26 matched controls. *p < 0.05 for each, t test with Bonferroni-Holm correction. Error bars represent 95% confidence interval. ARAS = ascending reticular activating system; Contra = contralateral; CSC = cuneiform/subcuneiform nuclei; Ipsi = ipsilateral; PPN = pedunculopontine nucleus; VTA = ventral tegmental area.
Relationships between connectivity and neuropsychological and disease measures
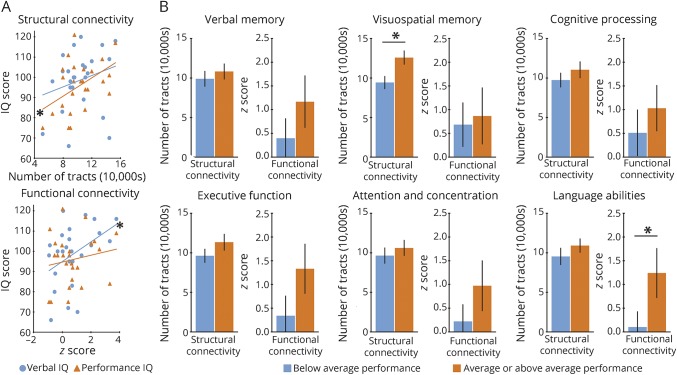
We then examined potential relationships between ARAS connectivity and neuropsychological profiles in patients with epilepsy (figure 5). Lower overall mean structural connectivity was correlated with reduced performance IQ but not verbal IQ, and decreased overall mean functional connectivity was correlated with diminished verbal IQ but not performance IQ (figure 5A). Regarding the relationship between structural connectivity and performance IQ, performance IQ appeared most closely related to structural connectivity between CSC and bilateral thalamus after lasso regression. Repeating this analysis with functional connectivity and verbal IQ, lasso regression revealed that verbal IQ was most closely related to functional connectivity between CSC and limbic structures (parahippocampus gyrus, amygdala), frontotemporal neocortical areas, thalamus, and basal ganglia.
Figure 5. Relationships between ARAS connectivity and neuropsychological performance in patients.
(A) Reduced ARAS structural connectivity is correlated with impaired performance IQ but not verbal IQ, while diminished ARAS functional connectivity is correlated with decreased verbal IQ but not performance IQ. (B) In some instances, improved performance on neuropsychological batteries is associated with increased ARAS connectivity, with relationships noted between increased structural connectivity and improved visuospatial memory, and between higher functional connectivity and better language abilities. For A and B, connectivity values represent mean connectivity for each patient across 3 ARAS structures and all 105 cortical/subcortical regions. Twenty-five patients (one patient excluded because of lack of neuropsychological data). *p < 0.05, Spearman ρ (A) or t test with Bonferroni-Holm correction (B). Error bars represent 95% confidence interval. ARAS = ascending reticular activating system.
We also related overall mean ARAS structural connectivity to performance on other neurocognitive batteries in patients (figure 5B). Individuals with average or above average visuospatial memory showed higher structural connectivity than those with below average visuospatial memory, and patients with average or above average language abilities demonstrated higher functional connectivity than those with below average language abilities (p < 0.05, t = 2.4–3.3). In examining the 3 ARAS regions individually, CSC and PPN structural connectivity was reduced in patients with poor visuospatial memory, and CSC functional connectivity was diminished in individuals with poor language abilities (p < 0.05, t = 2.4–3.7).
Finally, we examined relationships between ARAS connectivity and disease measures. Patients with a history of GTCS had lower overall ARAS structural connectivity than those without GTCS (p < 0.05, t = 2.3), with CSC showing the greatest individual decrease (p < 0.05, t = 2.2). Lower CSC functional connectivity was also noted in patients with GTCS (p = 0.07, t = 1.9). Reduced mean CSC structural connectivity was associated with higher frequency of consciousness-impairing (p < 0.05, ρ = −0.45) but not consciousness-sparing (p > 0.6, ρ = −0.11) seizures, although no similar relationship was seen between seizure frequency and functional connectivity (p > 0.05, ρ = −0.2 to 0). No relationships were seen between structural or functional ARAS connectivity and epilepsy duration (p > 0.05, ρ = −0.3 to 0.3).
Discussion
In this study, we examined both structural and functional connectivity of ARAS structures in patients with TLE, and related disease and neurocognitive measures to specific anatomical connections between various brain regions. While probabilistic tractography has previously been used to examine brainstem connections in neurologic and psychiatric disorders,17,18 few connectivity studies in epilepsy have focused on brainstem regions. Why might brainstem connections have important implications for neurocognition in epilepsy? The ARAS comprises several nuclei involved in maintaining vigilance, in large part through monoaminergic projections to subcortical areas and the neocortex.10,11 CSC and PPN are important for cortical excitation and locomotion control through both cholinergic and glutamatergic projections.19,20 VTA is involved in reward circuits via dopaminergic projections21 and has connections to frontal cortex, basal forebrain, and basal ganglia.12,22 While brainstem structures are infrequently related to neuropsychological function, growing evidence suggests a potentially important role of ARAS networks in modulating behavior and emotion through input to frontal, insular, and other neocortical regions.23 For example, patients with Parkinson disease treated with PPN deep brain stimulation for motor symptoms have shown improvements in executive function and working memory24 as well as better attentional processing, which has been suggested to contribute to improvements in locomotion.25
Our results revealed specific connections between individual ARAS nuclei and other brain regions that were altered in patients, and closely related to neuropsychological and disease-related factors. While CSC, PPN, and VTA showed strong connectivity to several subcortical and limbic structures, the largest decreases in ARAS connectivity in patients with epilepsy were seen in neocortical regions involved in language, attention, and various cognitive processes. Furthermore, patterns and relationships of ARAS functional vs structural connectivity often differed. For instance, diminished structural connectivity between CSC and bilateral thalami was closely associated with reduced performance IQ, while decreased functional connectivity between CSC and frontotemporal neocortex and limbic networks was related to impaired verbal IQ. This may be because many CSC connections to distal brain regions, such as neocortex and limbic regions, are often indirect through synaptic connections in subcortical brain regions, such as thalamus.12 Resting-state fMRI correlations assess functionally connected regions, and can exist absent direct structural connections, presumably reflecting the importance of indirect and polysynaptic pathways.13 However, DTI reflects direct anatomical white matter pathways.26
Prior rodent work has shown that limbic seizure activity spreads to subcortical regions important for cortical activation, including ARAS structures, acutely producing ictal neocortical dysfunction and behavioral arrest.27–30 We hypothesize that TLE may produce long-term connectivity perturbations between these subcortical structures important for cortical excitation and the neocortex, which may lead to decreases in neocortical connectivity, metabolism, and gray matter volume.5,9,31 These neocortical effects may in turn influence neurocognitive sequelae.3,6,7 This is supported by relationships we observed between the presence of GTCS and lower CSC connectivity, and between diminished CSC connectivity and impaired neurocognitive performance. Potential clinical implications of this work include the identification of subcortical/cortical connectivity relationships that may help predict neuropsychological patterns in TLE, as well as the identification of subcortical targets for neuromodulation.
Our study has several limitations to consider. Small brainstem structures are difficult to discern on 3-tesla MRI, and the signal may be susceptible to physiologic noise, motion, volume artifacts, and voxel size. Steps taken to help mitigate these issues include correction for movement and physiologic measures, the exclusion of voxels with susceptibility artifact, and the use of a brainstem atlas established using high-resolution diffusion imaging and microscopic histopathology. Maximum translational motion during fMRI was significantly higher in patients vs controls, representing an important limitation that may influence connectivity results, despite statistical correction for motion. However, we also observed reduced ARAS functional connectivity in patients vs controls within a subset of participant pairs individually matched for motion, suggesting that connectivity differences were not primarily driven by motion artifact.
Next, there are limitations to our tractography methods, as a probabilistic approach may in some cases over- or underestimate the true proportion of white matter fibers connecting regions. Comparing our results with those utilizing deterministic DTI analysis techniques may be useful in subsequent investigations. Furthermore, atrophy of cortical regions is common in TLE,4 and may influence the results of connectivity measurements seeded from brainstem or other regions. Comparing connectivity patterns to regional volumetric measurements should be considered in future studies to clarify this issue. Finally, as with all connectivity studies to date in epilepsy, some results may be confounded by the effects of antiepileptic drugs on connectivity patterns.
In the present study, we performed both structural and functional connectivity analyses of brainstem arousal structures in TLE, relating CSC, PPN, and VTA connectivity patterns to disease and neurocognitive measures. Overall, our results support our previous hypotheses3,8 that consciousness-impairing seizures in TLE may lead to connectivity perturbations between subcortical activating structures and the neocortex, which may be related to long-term neurocognitive problems. While brainstem arousal centers are rarely studied in epilepsy, our results demonstrate the important influence these circuits may have on widespread brain networks and neuropsychological function in this disorder.
Acknowledgment
The authors thank Justin Blaber for technical assistance and Baxter Rogers for advice regarding statistical tests. For atlases and toolboxes used in this study, the authors thank the Harvard Center for Morphometric Analysis (Harvard-Oxford Atlas), the Martinos Center for Biomedical Imaging (Harvard Ascending Arousal Network Atlas), the McGovern Institute for Brain Research (CONN toolbox), and the Leahy/Shattuck neuroimaging collaboration (BrainSuite).
Glossary
- ARAS
ascending reticular activating system
- CSC
cuneiform/subcuneiform nuclei
- DTI
diffusion tensor imaging
- EZ
epileptogenic zone
- GTCS
generalized tonic-clonic seizures
- PPN
pedunculopontine nucleus
- TLE
temporal lobe epilepsy
- VTA
ventral tegmental area
Author contributions
Study concept and design: Englot, Morgan. Acquisition of data: Englot, Gonzalez, Reynolds, Landman, Morgan. Analysis and interpretation of data: Englot, Gonzalez, Konrad, Jacobs, Gore, Morgan. Drafting of the manuscript: Englot. Critical revision of the manuscript for important intellectual content: Englot, Gonzalez, Reynolds, Konrad, Jacobs, Gore, Landman, Morgan. Statistical analysis: Englot. Obtained funding: Englot, Morgan. Study supervision: Englot, Morgan.
Study funding
This work was supported in part by the NIH grants K99 NS097618 (D.J.E.), R01 NS075270 (V.L.M.), T32 EB021937 (H.F.J.G.), T32 GM07347 (H.F.J.G.), and R00 NS097618 (D.J.E.).
Disclosure
The authors report no disclosures relevant to the manuscript. Go to Neurology.org/N for full disclosures.
References
- 1.Englot DJ, Lee AT, Tsai C, et al. Seizure types and frequency in patients who “fail” temporal lobectomy for intractable epilepsy. Neurosurgery 2013;73:838–844. [DOI] [PubMed] [Google Scholar]
- 2.Engel J, Williamson PD, Wieser HG. Mesial temporal lobe epilepsy with hippocampal sclerosis. In: Engel J, Pedley TA, editors. Epilepsy: A Comprehensive Textbook. Philadelphia: Lippincott Williams & Wilkins; 2007:2479–2486. [Google Scholar]
- 3.Englot DJ, Konrad PE, Morgan VL. Regional and global connectivity disturbances in focal epilepsy, related neurocognitive sequelae, and potential mechanistic underpinnings. Epilepsia 2016;57:1546–1557. [DOI] [PMC free article] [PubMed] [Google Scholar]
- 4.Caciagli L, Bernasconi A, Wiebe S, Koepp MJ, Bernasconi N, Bernhardt BC. A meta-analysis on progressive atrophy in intractable temporal lobe epilepsy: time is brain? Neurology 2017;89:506–516. [DOI] [PMC free article] [PubMed] [Google Scholar]
- 5.Aparicio J, Carreno M, Bargallo N, et al. Combined 18F-FDG-PET and diffusion tensor imaging in mesial temporal lobe epilepsy with hippocampal sclerosis. Neuroimage Clin 2016;12:976–989. [DOI] [PMC free article] [PubMed] [Google Scholar]
- 6.Witt JA, Helmstaedter C. Cognition in epilepsy: current clinical issues of interest. Curr Opin Neurol 2017;30:174–179. [DOI] [PubMed] [Google Scholar]
- 7.Berg AT, Altalib HH, Devinsky O. Psychiatric and behavioral comorbidities in epilepsy: a critical reappraisal. Epilepsia 2017;58:1123–1130. [DOI] [PMC free article] [PubMed] [Google Scholar]
- 8.Englot DJ, D'Haese PF, Konrad PE, et al. Functional connectivity disturbances of the ascending reticular activating system in temporal lobe epilepsy. J Neurol Neurosurg Psychiatry 2017;88:925–932. [DOI] [PMC free article] [PubMed] [Google Scholar]
- 9.Englot DJ, Hinkley LB, Kort NS, et al. Global and regional functional connectivity maps of neural oscillations in focal epilepsy. Brain 2015;138:2249–2262. [DOI] [PMC free article] [PubMed] [Google Scholar]
- 10.Moruzzi G, Magoun HW. Brain stem reticular formation and activation of the EEG. Electroencephalogr Clin Neurophysiol 1949;1:455–473. [PubMed] [Google Scholar]
- 11.Steriade M. Ascending control of thalamic and cortical responsiveness. Int Rev Neurobiol 1970;12:87–144. [DOI] [PubMed] [Google Scholar]
- 12.Edlow BL, Takahashi E, Wu O, et al. Neuroanatomic connectivity of the human ascending arousal system critical to consciousness and its disorders. J Neuropathol Exp Neurol 2012;71:531–546. [DOI] [PMC free article] [PubMed] [Google Scholar]
- 13.Honey CJ, Sporns O, Cammoun L, et al. Predicting human resting-state functional connectivity from structural connectivity. Proc Natl Acad Sci USA 2009;106:2035–2040. [DOI] [PMC free article] [PubMed] [Google Scholar]
- 14.Jenkinson M, Beckmann CF, Behrens TE, Woolrich MW, Smith SM. FSL. Neuroimage 2012;62:782–790. [DOI] [PubMed] [Google Scholar]
- 15.Glover GH, Li TQ, Ress D. Image-based method for retrospective correction of physiological motion effects in fMRI: RETROICOR. Magn Reson Med 2000;44:162–167. [DOI] [PubMed] [Google Scholar]
- 16.Carroll MK, Cecchi GA, Rish I, Garg R, Rao AR. Prediction and interpretation of distributed neural activity with sparse models. Neuroimage 2009;44:112–122. [DOI] [PubMed] [Google Scholar]
- 17.Vanegas-Arroyave N, Lauro PM, Huang L, et al. Tractography patterns of subthalamic nucleus deep brain stimulation. Brain 2016;139:1200–1210. [DOI] [PMC free article] [PubMed] [Google Scholar]
- 18.Song YJ, Korgaonkar MS, Armstrong LV, Eagles S, Williams LM, Grieve SM. Tractography of the brainstem in major depressive disorder using diffusion tensor imaging. PLoS One 2014;9:e84825. [DOI] [PMC free article] [PubMed] [Google Scholar]
- 19.Benarroch EE. Pedunculopontine nucleus: functional organization and clinical implications. Neurology 2013;80:1148–1155. [DOI] [PubMed] [Google Scholar]
- 20.Goetz L, Piallat B, Bhattacharjee M, Mathieu H, David O, Chabardes S. On the role of the pedunculopontine nucleus and mesencephalic reticular formation in locomotion in nonhuman primates. J Neurosci 2016;36:4917–4929. [DOI] [PMC free article] [PubMed] [Google Scholar]
- 21.Ranaldi R. Dopamine and reward seeking: the role of ventral tegmental area. Rev Neurosci 2014;25:621–630. [DOI] [PubMed] [Google Scholar]
- 22.Russo SJ, Nestler EJ. The brain reward circuitry in mood disorders. Nat Rev Neurosci 2013;14:609–625. [DOI] [PMC free article] [PubMed] [Google Scholar]
- 23.Venkatraman A, Edlow BL, Immordino-Yang MH. The brainstem in emotion: a review. Front Neuroanat 2017;11:15. [DOI] [PMC free article] [PubMed] [Google Scholar]
- 24.Alessandro S, Ceravolo R, Brusa L, et al. Non-motor functions in parkinsonian patients implanted in the pedunculopontine nucleus: focus on sleep and cognitive domains. J Neurol Sci 2010;289:44–48. [DOI] [PubMed] [Google Scholar]
- 25.Fischer J, Schwiecker K, Bittner V, et al. Modulation of attentional processing by deep brain stimulation of the pedunculopontine nucleus region in patients with parkinsonian disorders. Neuropsychology 2015;29:632–637. [DOI] [PubMed] [Google Scholar]
- 26.Sotnichenko TS. Differentiation of efferent projections of the medial (cuneiform nucleus) and lateral areas of the reticular formation of the midbrain in the cat [in Russian]. Neirofiziologiia 1985;17:646–652. [PubMed] [Google Scholar]
- 27.Englot DJ, Mishra AM, Mansuripur PK, Herman P, Hyder F, Blumenfeld H. Remote neocortical effects of partial temporal lobe seizures in rats. J Neurosci 2008;28:9066–9081. [DOI] [PMC free article] [PubMed] [Google Scholar]
- 28.Englot DJ, Modi B, Mishra AM, DeSalvo M, Hyder F, Blumenfeld H. Cortical deactivation induced by subcortical network dysfunction in limbic seizures. J Neurosci 2009;29:13006–13018. [DOI] [PMC free article] [PubMed] [Google Scholar]
- 29.Motelow JE, Li W, Zhan Q, et al. Decreased subcortical cholinergic arousal in focal seizures. Neuron 2015;85:561–572. [DOI] [PMC free article] [PubMed] [Google Scholar]
- 30.Zhan Q, Buchanan GF, Motelow JE, et al. Impaired serotonergic brainstem function during and after seizures. J Neurosci 2016;36:2711–2722. [DOI] [PMC free article] [PubMed] [Google Scholar]
- 31.Alvim MK, Coan AC, Campos BM, et al. Progression of gray matter atrophy in seizure-free patients with temporal lobe epilepsy. Epilepsia 2016;57:621–629. [DOI] [PubMed] [Google Scholar]
Associated Data
This section collects any data citations, data availability statements, or supplementary materials included in this article.
Data Availability Statement
The present study is compliant with the journal's data availability standards, and any data not provided in the article may be shared at the request of other investigators.


