Abstract
Objective
Duplex ultrasound scanning with B-mode imaging and both color Doppler and Doppler spectral waveforms is relied upon for diagnosis of vascular pathology and selection of patients for further evaluation and treatment. In most duplex ultrasound applications, classification of disease severity is based primarily on alterations in blood flow velocities, particularly the peak systolic velocity (PSV) obtained from Doppler spectral waveforms. We developed a duplex ultrasound simulator for training and assessment of scanning skills.
Methods
Duplex ultrasound cases were prepared from 2-dimensional (2D) images of normal and stenotic carotid arteries by reconstructing the common carotid, internal carotid, and external carotid arteries in 3 dimensions and computationally simulating blood flow velocity fields within the lumen. The simulator displays a 2D B-mode image corresponding to transducer position on a mannequin, overlaid by color coding of velocity data. A spectral waveform is generated according to examiner-defined settings (depth and size of the Doppler sample volume, beam steering, Doppler beam angle, and pulse repetition frequency or scale). The accuracy of the simulator was assessed by comparing the PSV measured from the spectral waveforms with the true PSV which was derived from the computational flow model based on the size and location of the sample volume within the artery.
Results
Three expert examiners made a total of 36 carotid artery PSV measurements based on the simulated cases. The PSV measured by the examiners deviated from true PSV by 8% ± 5% (N = 36). The deviation in PSV did not differ significantly between artery segments, normal and stenotic arteries, or examiners.
Conclusion
To our knowledge, this is the first simulation of duplex ultrasound that can create and display real-time color Doppler images and Doppler spectral waveforms. The results demonstrate that an examiner can measure PSV from the spectral waveforms using the settings on the simulator with a mean absolute error in the velocity measurement of less than 10%. With the addition of cases with a range of pathologies, this duplex ultrasound simulator will be a useful tool for training health-care providers in vascular ultrasound applications and for assessing their skills in an objective and quantitative manner.
Keywords: duplex ultrasound, color-Doppler, Doppler spectral waveform, medical simulation, carotid artery stenosis
Introduction
Simulators have been described for a variety of diagnostic and point-of-care applications of medical ultrasound, including echocardiography, obstetrics, trauma, and critical care, and these devices have been used for both training and assessment of skills.1–4 The main advantages of simulation in this setting are the immediate availability of a wide range of clinical scenarios or pathology and avoiding the patient comfort and safety concerns associated with having trainees perform the clinical examinations. Ultrasound simulators allow learners to repeat examinations as many times as necessary in order to acquire and improve skills. The same simulators can also be used to assess skills in a particular ultrasound application.
Most applications of medical ultrasound are based on acquisition and interpretation of 2-dimensional (2D) B-mode images alone. However, vascular applications are unique in that the classification of disease severity is often based primarily on alterations in velocities and flow patterns detected in the imaged vessels. In duplex ultrasound scanning, these flow patterns are characterized by Doppler spectral waveforms and color Doppler imaging.5 The peak systolic velocity (PSV) obtained from the Doppler spectral waveform is the principal criterion for the classification of arterial stenosis.6 There are currently no ultrasound simulators that provide realistic representations of the color Dop-pler images and Doppler spectral waveforms that must be acquired during performance of a complete duplex scan.
We have developed a computer-based duplex ultrasound simulator that incorporates real-time color Doppler images and Doppler spectral waveforms along with the corresponding B-mode images. This article describes the development and features of this simulator along with a preliminary validation study on the accuracy of the PSV measurements obtained by expert examiners in 2 carotid artery models.
Methods
Simulator Design
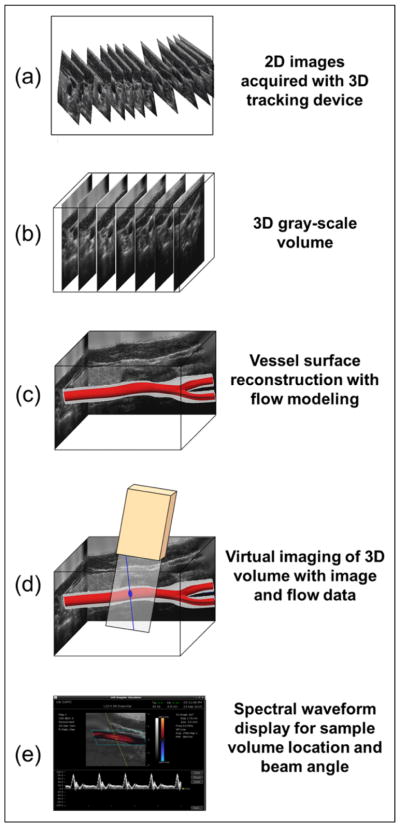
The duplex ultrasound simulator design was based on an echocardiography simulator that we previously developed.7 The hardware consists of a personal computer, a mannequin, and a mock transducer whose spatial location and orientation are measured using a tracking device (Patriot, Polhemus Inc, Colchester, Vermont), as shown in Figure 1. As the examiner manipulates the mock transducer over the mannequin, the computer displays ultrasound images in a 2D B-mode view that changes in real time according to the transducer’s position and orientation. These images are derived from a 3-dimensional (3D) volume of image data previously acquired from a normal volunteer or patient with carotid artery disease (Figure 2A and 2B). In addition, computational fluid dynamics (CFD) modeling is performed using the 3D lumen volume and 1 Doppler spectral waveform measurement of the velocity at the inlet to the arterial segment of interest. The results of this simulation are then used to populate a 3D computer model of the blood vessel with time-varying velocity vectors that define the blood flow at all points within the vessel (Figure 2C). This velocity field is sampled along with the image data to create a spectral waveform display that responds in real time to the control panel settings selected by the examiner (Figure 2D and 2E).
Figure 1.
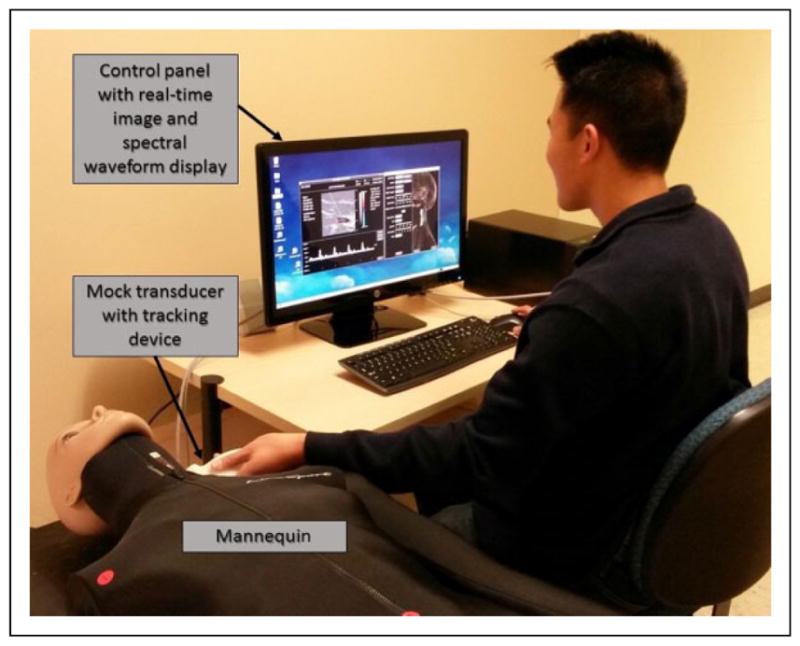
Photograph of the duplex ultrasound simulator in use. As the examiner moves the mock transducer over the mannequin, a 2-dimensional (2D) B-mode image derived from a saved 3-dimensional (3D) data set is displayed. A Doppler spectral waveform display is generated in real time from the velocity database as the examiner positions the Doppler sample volume and adjusts the control panel settings.
Figure 2.
Schematic diagram of the design of the duplex ultrasound simulator. A, 2-dimensional (2D) ultrasound images of a vessel are acquired, while the 3-dimensional (3D) location and orientation of the transducer are tracked and recorded. B, The 2D images are reformatted in a 3D gray-scale volume. C, Surface reconstruction of the vessel of interest produces a 3D model that is populated with blood flow data by computational fluid dynamics modeling. D, Virtual imaging with a spatially tracked mock transducer allows the examiner to interactively position a virtual Doppler sample volume within the flow data. E, A spectral waveform is synthesized and displayed that corresponds to the sample volume location and the Doppler beam angle.
Patient Imaging and Image Processing
Carotid duplex ultrasound data sets were obtained from 2 volunteers. These 3D ultrasound data sets included gray-scale (B-mode) images of the carotid artery and its surrounding structures that were used to create a 3D surface model of the carotid artery lumen. In summary, an ultrasound transducer with an attached tracking device (Flock of Birds, Ascension Technology Corp, Burlington, Vermont) was used to acquire closely spaced B-mode images of the relevant vascular structures. These images were reformatted into a regular 3D grid using a volume reconstruction algorithm.8,9 A 3D surface model of the blood vessel was then generated from traced borders of the vessel lumen.10,11
Calculation of Blood Flow Velocity
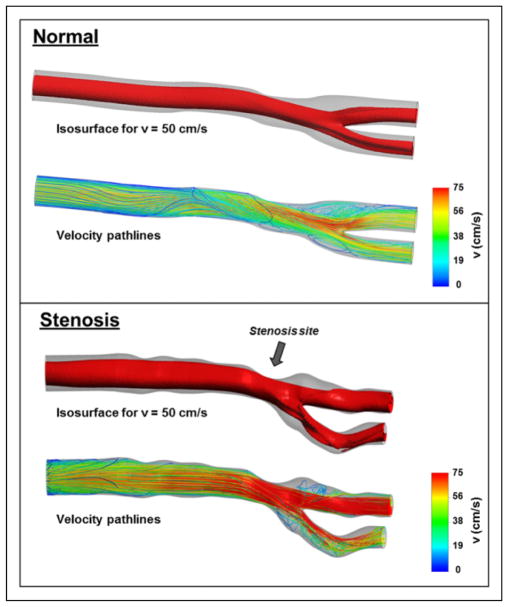
Computational fluid dynamics modeling was applied to the carotid artery to calculate 4-dimensional (4D) flow velocity fields (spatially 3D and temporally resolved) inside the vascular lumen.12–14 The Navier-Stokes equations that describe the flowing blood as an incompressible Newtonian fluid are solved by a commercial CFD software package (Fluent, ANSYS Inc, Canonsburg, Pennsylvania). The computation discretizes the equations of motion into a volumetric mesh that fills the patient-specific lumen geometry. For boundary conditions, 1 fluid velocity Doppler spectral waveform is used at the model inlet, and the peripheral capacitance-resistance is used downstream of the vessel segments. The fluid velocity and pressure are solved inside the vessel of interest with spatial resolution on the order of 100 microns and temporal resolution of 1 millisecond. Ten cardiac cycles are simulated, to allow for chaotic flow to develop, and then phase averaged to obtain a velocity field representative of the blood flow in the vessel, including cycle-to-cycle variability inherent to the complex flow studied, particularly in highly stenotic vessels. The 4D velocity database is exported to the simulator as 3 components of velocity at each node of the computational mesh and for each time step of the cardiac cycle (Figure 3). These data provide the true velocities for every point within the artery.
Figure 3.
Three-dimensional (3D) lumen model and blood velocity flow simulation data for the normal carotid artery and the distal common carotid artery stenosis used in this study. The velocity from the computational fluid dynamics simulation is displayed inside the lumen volume as an isosurface (contour of constant velocity magnitude—50% of the maximum). The distortion of the velocity contour in the stenosis (arrow) highlights the impact of the stenosis on the spatial inhomogeneity of the velocity field. The lower panel for each case shows the velocity path lines (trajectories of a blood particle from the inlet to the outlet of the artery segment), colored by velocity magnitude. The presence of large flow recirculation regions just downstream of the stenosis and the chaotic nature of the fluid velocity (both in magnitude and in direction) in that region are clearly visible.
Examiner Interface
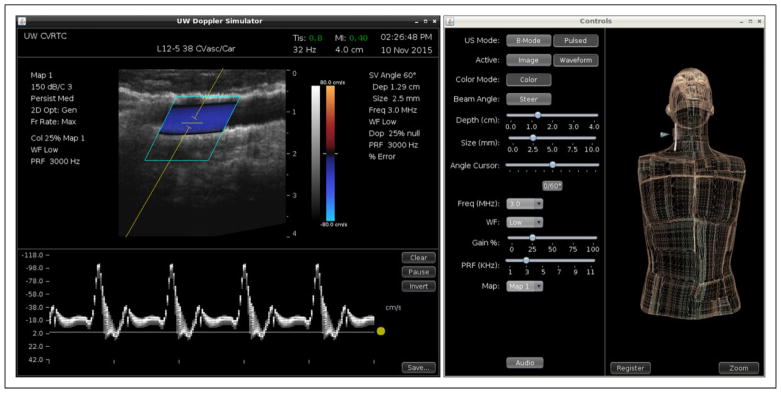
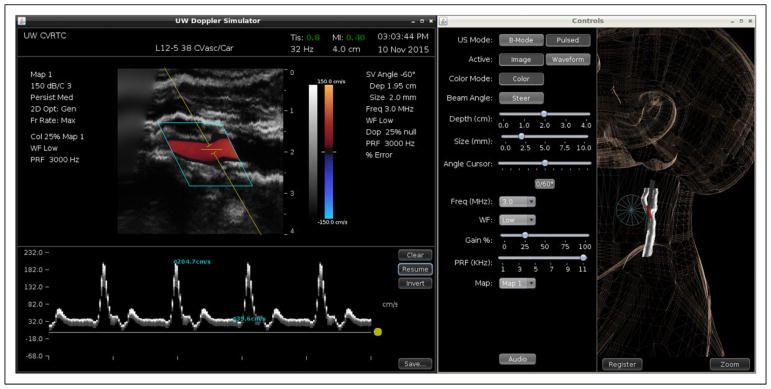
The duplex ultrasound simulator control panel and examiner interface are shown in Figure 4. When the mannequin is “scanned,” the computer displays B-mode images in views corresponding to the position and orientation of the mock transducer. To simulate a clinical ultrasound examination, a control panel on the computer display shows settings analogous to a real duplex ultrasound system, and the examiner is required to steer the Doppler beam, select the size and depth of the Doppler sample volume within the B-mode image, specify the Doppler angle relative to the vessel axis, and adjust the pulse repetition frequency (PRF) to avoid aliasing. After acquiring and saving a spectral waveform on the display, the examiner measures blood flow velocity by positioning a cursor over a selected point on the waveform to obtain the PSV value (Figure 5).
Figure 4.
Duplex ultrasound simulator examiner interface. Left panel: Duplex display showing B-mode image with color Doppler on top and Doppler spectral waveforms below. Right panel: Controls for the ultrasound display mode and Doppler settings (including beam angle, sample volume depth, and sample volume size). The 3-dimensional (3D) display shows the location of the transducer (blue cone) on the mannequin.
Figure 5.
Measurement of peak systolic velocity in a simulated common carotid artery. Left panel: The Doppler spectral waveform has been acquired at a beam angle of 60°, and the cursor has been placed on the displayed waveform resulting in a measured velocity of 79.8 cm/s. Right panel: Ultrasound display mode and Doppler controls. The 3-dimensional (3D) display is shown in zoom mode.
Doppler Simulation and Interface
Doppler spectral waveforms are simulated by retrieving the velocities calculated within the 3D model of the vessel lumen and projecting the 3 components of the velocity within the Doppler sample volume onto the Doppler beam. The B-mode image and fluid velocity data sets are registered with corresponding anatomic landmarks on a mannequin using transducer tracking. Based on the examiner’s settings for beam steering, pulsed Doppler sample volume depth and size, Doppler angle correction, and PRF or velocity scale, the stored 4D velocity field within the 3D sample volume is converted to a spectral waveform display. Frequency shifts are calculated by the Doppler equation using the incident beam angle relative to the blood flow direction provided by the CFD modeling. The simulator waveform display uses the angle correction and PRF specified by the examiner to convert the frequencies to velocities. The spectral waveform display is updated in real time according to the beam angle and the Doppler sample volume size and location specified. A real-time audio output of the simulated Doppler signal is under development and, when available, will provide the examiner with additional realistic feedback regarding the flow pattern and placement of the pulsed Doppler sample volume.
Color Doppler
We implemented a simulation of color Doppler imaging to enhance the realism of our duplex ultrasound simulator (Figure 4). At the intersection of the 2D virtual image plane of the Doppler simulator with the calculated flow field in the 3D vascular models, the CFD velocity vector fields are projected onto the Doppler beam and converted to a color map, animated in real time, within a color box specified by the examiner.
Validation
The accuracy of Doppler velocity measurements obtained by examiners performing a carotid duplex scan on the simulator was determined by comparing the blood flow velocities measured from the simulated spectral waveforms to the true CFD velocities in the ultrasound data sets used to populate the artery models in the simulator. The deviation is expressed as a percentage of the true velocity.
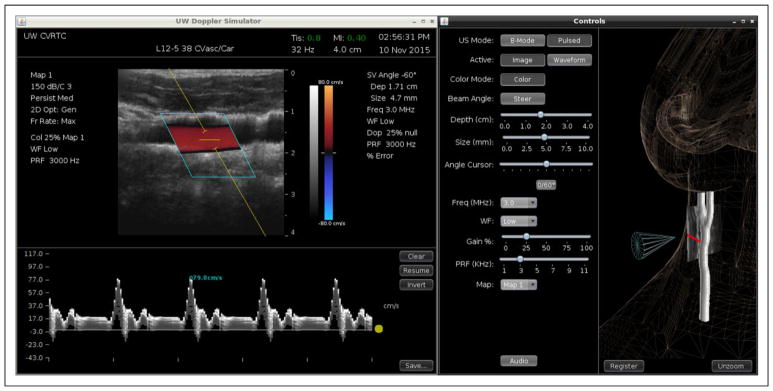
Three experienced examiners (1 vascular sonographer, 1 vascular surgeon, and 1 ultrasound engineer) measured PSV in the common carotid, internal carotid, and external carotid arteries in 2 carotid artery models. For each measurement, the examiner performed a simulated duplex scan that required manipulating the transducer over the mannequin to acquire the desired B-mode image, setting the beam steering, positioning the Doppler sample volume within the B-mode image, setting the size of the sample volume, adjusting the Doppler angle correction cursor, and setting the PRF or velocity scale. After a spectral waveform was acquired and saved, the PSV measurement was obtained by positioning a cursor at the desired location in the waveform (Figures 5 and 6). The examiner was free to make multiple measurements on a waveform and to delete or save any measurement during the scanning session. For each velocity measurement made and saved by the examiner, the true PSV was computed as the maximum of the velocity magnitude from the CFD-generated database within the voxels specified by the examiner’s sample volume.
Figure 6.
Measurement of peak systolic and end-diastolic velocities in a simulated distal common carotid artery stenosis. Left panel: The Doppler spectral waveform has been acquired at a beam angle of 60°, and cursors have been placed on the displayed waveform. The measured velocities are 204.7 cm/s peak systolic and 39.6 cm/s end diastolic. Right panel: Ultrasound display mode and Doppler controls and the 3-dimensional (3D) display.
Statistical Analysis
The mean absolute deviation was computed for each PSV measurement. Measurements on the normal and stenotic carotid artery models were compared using a t test. Measurements made by the 3 examiners on each of the 3 carotid artery segments were compared using analysis of variance. Bias in PSV measurement was assessed using the paired t test.
Results
The 2 carotid artery models used for this validation study included 1 normal case and 1 patient with a distal common carotid artery stenosis. The 3 examiners made a total of 36 velocity measurements. Twenty measurements were made on the normal carotid artery model and 16 measurements were made on the stenotic carotid artery model (1 examiner only made measurements on the normal carotid artery model).
The PSV measured by the examiners deviated from the true PSV by 8 ± 5% overall, and there was no significant difference in performance between examiners (Table 1). The mean absolute deviation in PSV was similar for the normal and stenotic carotid artery models (7 ± 6%, N = 20 vs 8 ± 6%, N = 16, P = NS) and for the 3 carotid artery segments (Table 2).
Table 1.
Comparison of True Versus Measured Peak Systolic Velocity (PSV) by Examiner.
| Examiner 1 | Examiner 2 | Examiner 3 | Pa | |
|---|---|---|---|---|
| Number of measurements | 16 | 7 | 13 | |
| Mean absolute deviation % | 7 ± 4 | 10 ± 7 | 7 ± 6 | NS |
| True PSV, cm/s | 123 ± 48 | 83 ± 9 | 112 ± 45 | |
| Measured PSV, cm/s | 119 ± 50 | 84 ± 9 | 109 ± 49 | |
| Pb | NS | NS | NS |
Abbreviation: NS, not significant.
Analysis of variance, difference between examiners.
Paired t test, true versus measured velocity.
Table 2.
Comparison of True Versus Measured Peak Systolic Velocity (PSV) by Carotid Artery Segment.
| Common Carotid | Internal Carotid | External Carotid | Pa | |
|---|---|---|---|---|
| Number of measurements | 16 | 10 | 10 | |
| Mean absolute deviation % | 6 ± 6 | 9 ± 6 | 8 ± 4 | NS |
| True PSV, cm/s | 104 ± 34 | 115 ± 49 | 120 ± 54 | |
| Measured PSV, cm/s | 98 ± 35 | 108 ± 41 | 125 ± 62 | |
| Pb | .001 | NS | NS |
Abbreviation: NS, not significant.
Analysis of variance, difference between artery segments.
Paired t test, true versus measured velocity.
There was no significant bias in the PSV measurement overall. The true velocity averaged 111 ± 44 cm/s, and the velocity measured by the examiners averaged 108 ± 46 cm/s (N = 36, P = NS). Among the subgroup analyses, the measured PSV was slightly but significantly lower than the true PSV in the common carotid (Table 2). However, the differences were not significant in the internal or external carotid arteries, despite similar magnitudes. There was no significant difference between true PSV and that measured by any of the expert examiners (Table 1).
Discussion
The cost and complexity of modern medical education make traditional patient-based learning impractical in many clinical settings. Simulation-based medical training allows learners to acquire knowledge and skills in an educationally focused environment without overriding concerns regarding patient safety, comfort, or privacy.15 Such training also lets learners progress at their own pace and can provide a wide range of clinical experience in a relatively short period of time. A variety of medical simulator types are available, including standardized patients, computer-based virtual patients, interactive mannequins, and task trainers for procedural skills. Technology-enhanced simulation has been associated with improved knowledge and skills in health professions education, but validity evidence in support of simulation-based assessments is currently lacking.16,17
Simulators are now available for many nonvascular ultrasound applications that require only 2D B-mode imaging.2,3 However, duplex ultrasound for vascular applications combines B-mode imaging with Doppler flow detection in the form of both spectral waveforms and color Doppler images. The acquisition and interpretation of Doppler velocity information, particularly the arterial PSV, plays a key role in the classification of vascular disease severity.5,6 There are some commercially available products that include physical flow models or “flow phantoms” that can simulate vascular flow abnormalities in a highly idealized fashion; however, these Doppler simulators offer a limited range of cases. Clinically realistic simulation is important because “The closer the assessment context resembles a real situation, the more likely it is that an assessment will be able to predict residents’ performance as practicing physicians.”18(p1279)
Duplex ultrasound is being used in both dedicated diagnostic and point-of-care settings for the evaluation of patients with vascular disease. Certification is available for sonographers who are formally trained in the recognized sonography specialties, including vascular ultrasound, but there has been little regulation or oversight for point-of-care applications.19,20 This has created a need for new training paradigms as well as improved methods for assessment of skills.17
While simulation of 2D B-mode images can be accomplished using computer-generated images or images from patient scans, simulation of Doppler information presents a significant technical challenge, given the complexity of creating flow information in real time throughout a volume of simulated tissue. A realistic simulation of duplex scanning requires manipulation of a mock transducer to obtain the appropriate B-mode image and interactive settings for a number of highly variable ultrasound parameters, including Doppler sample volume size and depth, beam angle, and angle correction. The spectral waveforms must then be acquired and a cursor placed for measurement of velocity. Each step in this complex task must be simulated in real time.
To the best of our knowledge, this report is the first description of a duplex ultrasound simulator that provides real-time Doppler spectral waveforms and color Doppler images. In addition to a realistic scanning experience, this simulator can provide an absolute measure of examiner performance because the CFD approach provides the true flow velocity values for all locations in the patient vessel model. This gives the simulator the unique ability to evaluate trainees based on a set of standardized flow velocities. For the 36 velocity measurements in our study, the measured PSV deviated from the true PSV by 8% ± 5%.
The preliminary experience described in this report establishes the feasibility of simulating normal and abnormal carotid duplex scan cases. It also shows that expert examiners can use the simulator to measure PSV with acceptable accuracy. Directions for future work will include creating a library not only of carotid duplex cases but also of cases involving other anatomic areas, where duplex ultrasound is relied upon clinically such as dialysis access sites and peripheral artery stenoses. The goal is to populate the library with enough cases to enable trainees to acquire experience with both commonly encountered and rare vascular abnormalities.18 We will also quantitatively assess the validity of the duplex ultrasound simulator for competency testing and its efficacy as a training tool.
Conclusion
We have developed a computer-based duplex ultrasound simulator that provides real-time color Doppler images and Doppler spectral waveforms in a carotid artery model. The examiner manipulates a mock transducer over a mannequin, and the computer displays a 2D B-mode image of the vessels. Velocity measurements can then be made in a realistic manner with the examiner setting the appropriate Doppler ultrasound parameters. This preliminary experience showed that an examiner can accurately measure PSV from the spectral waveforms with a mean absolute error of less than 10%. With the addition of cases representing a range of pathologies, this duplex ultrasound simulator will be a useful tool for training and assessment of skills in vascular ultrasound.
Acknowledgments
Funding
The author(s) disclosed receipt of the following financial support for the research, authorship, and/or publication of this article: Supported by funding from the National Institute of Biomedical Imaging and Bioengineering and the National Institute of Environmental Health Sciences, National Institutes of Health, Bethesda, Maryland.
Footnotes
Declaration of Conflicting Interests
The author(s) declared the following potential conflicts of interest with respect to the research, authorship, and/or publication of this article: Dr. Sheehan is the founder of VentriPoint, Inc. of which she is a major equity holder. VentriPoint markets a product for measuring right heart function which is not the subject of the present report. Dr. Sheehan is also the founder and President of Sheehan Medical LLC which markets the transthoracic echocardiography (TTE) simulator that she and coinvestigators developed and validated at the University of Washington (UW). Dr. Sheehan supports research in medical education by lending TTE simulators from her laboratory at the UW to investigators for up to 6 months. Neither the coauthors of the present report nor the UW have involvement in Sheehan Medical LLC and none receive any benefit from simulator sales.
References
- 1.Ferrero NA, Bortsov AV, Arora H, et al. Simulator training enhances resident performance in transesophageal echocardiography. Anesthesiology. 2014;120(1):149–159. doi: 10.1097/ALN.0000000000000063. [DOI] [PubMed] [Google Scholar]
- 2.Liu L, Kutarnia J, Belady P, Pedersen PC. Obstetric ultrasound simulator with task-based training and assessment. IEEE Trans Biomed Eng. 2015;62(10):2480–2497. doi: 10.1109/TBME.2015.2433679. [DOI] [PubMed] [Google Scholar]
- 3.Paddock MT, Bailitz J, Horowitz R, Khishfe B, Cosby K, Sergel MJ. Disaster response team FAST skills training with a portable ultrasound simulator compared to traditional training: pilot study. Western J of Emerg Med. 2015;16(20):325–330. doi: 10.5811/westjem.2015.1.23720. [DOI] [PMC free article] [PubMed] [Google Scholar]
- 4.Parks AR, Atkinson P, Verheul G, Leblanc-Duchin D. Can medical learners achieve point-of-care ultrasound competency using a high-fidelity ultrasound simulator?: a pilot study. Crit Ultrasound J. 2013;5(1):9. doi: 10.1186/2036-7902-5-9. [DOI] [PMC free article] [PubMed] [Google Scholar]
- 5.Beach KW, Bergelin RO, Leotta DF, et al. Standardized ultrasound evaluation of carotid stenosis for clinical trials: University of Washington Ultrasound Reading Center. Cardiovasc Ultrasound. 2010;8:39. doi: 10.1186/1476-7120-8-39. [DOI] [PMC free article] [PubMed] [Google Scholar]
- 6.Beach KW, Leotta DF, Zierler RE. Carotid Doppler velocity measurements and anatomic stenosis: correlation is futile. Vasc Endovascular Surg. 2012;46(6):466–474. doi: 10.1177/1538574412452159. [DOI] [PubMed] [Google Scholar]
- 7.Sheehan FH, Otto CM, Freeman RV. Echo simulator with novel training and competency testing tools. Stud Health Technol Inform. 2013;184:397–403. [PubMed] [Google Scholar]
- 8.Leotta DF, Martin RW. Three-dimensional spatial compounding of ultrasound scans with weighting by incidence angle. Ultrason Imaging. 2000;22(1):1–19. doi: 10.1177/016173460002200101. [DOI] [PubMed] [Google Scholar]
- 9.Leotta DF, Martin RW. Three-dimensional ultrasound imaging of the rotator cuff: spatial compounding and tendon thickness measurement. Ultrasound Med Biol. 2000;26(4):509–525. doi: 10.1016/s0301-5629(99)00173-8. [DOI] [PubMed] [Google Scholar]
- 10.Leotta DF, Paun M, Beach KW, Kohler TR, Zierler RE, Strandness DE., Jr Measurement of abdominal aortic aneurysms using three-dimensional ultrasound imaging: preliminary report. J Vasc Surg. 2001;33(4):700–707. doi: 10.1067/mva.2001.112812. [DOI] [PubMed] [Google Scholar]
- 11.Leotta DF, Primozich JF, Beach KW, Bergelin RO, Strandness DE., Jr Serial measurement of cross-sectional area in peripheral vein grafts using three-dimensional ultrasound. Ultrasound Med Biol. 2001;27(1):61–68. doi: 10.1016/s0301-5629(00)00296-9. [DOI] [PubMed] [Google Scholar]
- 12.McGah P, Leotta DF, Beach KW, Zierler RE, Aliseda A. Incomplete restoration of homeostatic shear stress within arteriovenous fistulae. J Biomech Eng. 2013;135(1):011005. doi: 10.1115/1.4023133. [DOI] [PMC free article] [PubMed] [Google Scholar]
- 13.McGah PM, Leotta DF, Beach KW, Zierler RE, Riley JJ, Aliseda A. Hemodynamic conditions in a failing peripheral artery bypass graft. J Vasc Surg. 2012;56(2):403–409. doi: 10.1016/j.jvs.2012.01.045. [DOI] [PMC free article] [PubMed] [Google Scholar]
- 14.McGah PM, Leotta DF, Beach KW, Riley JJ, Aliseda A. A longitudinal study of remodeling in a revised peripheral artery bypass graft using 3D ultrasound imaging and computational hemodynamics. J Biomech Eng. 2011;133(4):041008. doi: 10.1115/1.4003622. [DOI] [PMC free article] [PubMed] [Google Scholar]
- 15.Aggarwal R, Mytton OT, Derbrew M, et al. Training and simulation for patient safety. Qual Saf Health Care. 2010;19(suppl 2):i34–i43. doi: 10.1136/qshc.2009.038562. [DOI] [PubMed] [Google Scholar]
- 16.Cook DA, Hatala R, Brydges R, et al. Technology-enhanced simulation for health professions education: a systematic review and meta-analysis. JAMA. 2011;306(9):978–988. doi: 10.1001/jama.2011.1234. [DOI] [PubMed] [Google Scholar]
- 17.Cook DA, Brydges R, Zendajas B, Hamstra SJ, Hatala R. Technology-enhanced simulation to assess health professionals: a systematic review of validity evidence, research methods, and reporting quality. Acad Med. 2013;88(6):872–883. doi: 10.1097/ACM.0b013e31828ffdcf. [DOI] [PubMed] [Google Scholar]
- 18.Swing SR. Assessing the ACGME general competencies: General considerations and assessment methods. Acad Emerg Med. 2002;9(11):1278–1288. doi: 10.1111/j.1553-2712.2002.tb01588.x. [DOI] [PubMed] [Google Scholar]
- 19.Zierler RE. Credentialing and accreditation. In: Zierler RE, Dawson DL, editors. Strandness’s Duplex Scanning in Vascular Disorders. 5. Philadelphia, PA: Wolters Kluwer; 2015. pp. 31–37. [Google Scholar]
- 20.Moore CL, Copel JA. Point-of-care ultrasonography. N Engl J Med. 2011;364(8):749–757. doi: 10.1056/NEJMra0909487. [DOI] [PubMed] [Google Scholar]


