Abstract
This paper introduces a wireless, solid-state, portable, and automated device capable of measuring the total ammonia [ammonia (NH3) and ammonium (NH4+)] levels of fluids, including biological samples. This device reliably measures the total ammonia of biological samples (e.g., urine) faster than the current ammonia quantification techniques. Medical professionals typically estimate NH4+ levels using error-prone indirect measurement techniques (i.e., urine anion gap), which are time-consuming and are seldom suitable for periodic measurements. Several instantaneous measurements of total ammonia levels in a patient urine could be utilized as an early warning for both acid-base and/or potassium disturbances. Given the device’s operation mechanism, it is able to quantify the total ammonia concentration within a biological sample in only 5 s and can simultaneously transmit data to other devices via Bluetooth. The analytical operation demonstrated high sensitivity, high specificity, fast reversibility, rapid response time, and has enabled the accurate determination of total ammonia concentration in urine samples produced by subjects who had consumed diets of variable protein compositions.
Keywords: Biosensors, chemical sensors, clinical diagnosis, medical diagnosis, optoelectronic devices
The handheld device could semi-continuously measure the total ammonia level in urine samples as a diagnostic device to provide early physiological unbalance warnings.
I. Introduction
The Determination of the total ammonia concentration (ammonia (NH3) and ammonium (NH4+) in biological samples has historically presented numerous technical challenges. Total ammonia concentration in urine is rarely measured directly, instead, medical professionals must estimate urine NH4+ concentration using a flawed indirect indicator (i.e., urine anion gap) [1], [2]. Nitrogen balance is significantly impacted by a number of physiological conditions, and knowledge of the precise total ammonia level of blood, urine, and other biological samples (e.g., breath, sweat), is known to be of great benefit for the diagnosis and/or treatment of several disease states. For instance, blood NH4+ is an important marker used to inform treatment decisions for patients affected by one of the urea cycle disorders [3]–[7].
Additionally, increasing the percentage of dietary protein in terms of total “Calories In” has become a method for healthy weight management in bariatrics (as well as in exercise science). Reported short-term benefits include: i) optimal maintenance of muscle tissue, ii) improved satiation, and iii) insurance against malnutrition (sufficient essential amino acid intake is more assured) [8]–[10]. However, a detailed analysis of these relatively short-term studies is lacking and the long-term metabolic effects (in addition to other health consequences) of significantly increased dietary protein intake have gone largely unexplored. An understanding of the rate of storage of consumed amino acids in relation to the rate of immediate metabolic oxidation (for work-energy and heat production) can be greatly enhanced by measurement of nitrogen balance, which may be performed by an analysis of urine for major nitrogen-containing molecules (e.g., urea, creatinine, and total ammonia). Currently, accurate quantification of these analytes is cumbersome since lab-bench analysis methods are required. Since urine total ammonia has been proposed as a marker of nitrogen balance [7], [10], real-time total ammonia monitoring could allow the end user to better estimate amino acid utilization [7]–[9].
Most measurement techniques for NH3 detection in human samples rely on breath or blood (plasma) [11]. Metal-oxide based sensor technologies [12]–[16] are frequently used for NH3 analysis. However, this type of sensor exhibits limited specificity for NH3 and can be confounded by ethanol, acetone, methane, hydrogen, nitric oxide, and nitrogen dioxide [17]. For blood (plasma), ion selective electrodes (ISE) have been optimized to detect NH3 and NH4+ in clinical applications [17]. In fact, our research has demonstrated ISE’s are highly accurate when compared to gold standard enzymatic methods (see below). However, in our experience ISE’s can be implemented for bed-side reading in near-real time detection, but they require labor since the Ammonia Electrode [18] needs to be calibrated each day before use to minimize measurement drift due to limited sensing membrane stability. Given the complex composition of biological samples, few sensing technologies have been approved by the United States Food and Drug Administration (FDA) for clinical research. For NH4+ detection in blood and urine, enzymatic assays are the only technique that meets the FDA’s standards [19]–[21]. In general, enzymatic assays have limited enzyme storage lifetime, involve multiple incubation steps, require processing times greater than one hour, and involve significant operator labor. Alternatively, NH3 can be detected via absorption spectroscopy by instruments such as Nephrolux™ (Pranalytica, Santa Monica, CA) [22], which uses a tunable laser and an acoustic detector to perform sub-parts per billion (ppb) zero background measurements of NH3 in the presence of interferents like CO2 and water vapor such as in breath. While spectroscopic techniques are extremely sensitive, they usually have bulky components making them impractical for personalized use. Moreover, the optical components used in absorption spectroscopy equipment are prone to misalignment and unsuitable for personalized use [23].
Gas chromatography – mass spectrometry (GC-MS) [24]–[27] and selective ion flow tube – mass spectrometry (SIFT-MS) [28]–[32] are accurate for NH3 measurement but are expensive, and instruments are difficult to maintain. GC-MS separates and identifies NH4+ and NH3 from complex mixtures, but requires expensive instrumentation (~$300,000) and pre-concentration steps that preclude high reproducibility and real-time implementation [24]–[26], [25]. SIFT-MS was developed for real-time detection of low molecular weight volatiles, including NH3, in different biological samples (skin and urine headspace, breath, etc.) but is also expensive (~$200,000) [28], [30]–[32], [38] and rather difficult to maintain.
Many new emerging sensing methods have been proposed and are being developed for the detection of NH3 including: (1) colorimetric sensors, (2) spectroscopic based sensors, (3) nanomaterial based sensors, and (4) contactless conductivity based sensors. (1) Colorimetric sensors are used for measurement of NH3 in wastewater and blood [33]–[35]. This type of sensor consists of a thin membrane embedded with an NH3-sensitive pH dye attached to the end of a fiber optic cable. These devices possess high sensitivity, but further instrumental improvements are required for use with biological samples. (2) Spectroscopic methods of NH3 measurement include pulsed quantum cascade laser spectroscopy [36]–[38] and optical micro-ring resonators [39]. While large (table-top) measurement systems exist, these lack the small size, low weight, and low cost desirable for portable individual monitoring (such as at a hospital bedside). (3) Nanomaterial based chem-resistors [40]–[45] and electrochemical sensors [46], [47] exhibit detection limits matching the clinically relevant NH3 levels (breath- NH3 in ppb and blood- NH3 in  mol/L) under well-defined, near ideal laboratory conditions. However, detection of NH3 in complex samples using these sensors requires further improvement to obtain the selectivity and lifetime necessary for continuous monitoring conditions. (4) Finally, Toda et al.
[48] reported a contactless conductivity based NH3 sensor. However, a solution must be replaced after measurement, making continuous measurement impractical [48].
Human urine total ammonia levels are high and provide an opportunity for development of new sensors [17]. NH4+ ions in liquid are volatile and rapidly turn into NH3, therefore in the medical field, there is currently no standard technique for instantaneous urine NH4+ measurement. A urine reagent stick is in wide clinical use to determine 10 different urine parameters (including specific gravity, pH, protein, leucocytes, nitrites, blood, ketones, glucose, bilirubin, and urobilinogen) [49]. Commercial electronic readers of these urine dipsticks do not include measurements of excreted NH3 or NH4+ [50]. However, NH3-detection reagent sticks are commercialized for use in water samples [51]. The operation of dipsticks is based on irreversible chemical reactions, and therefore they are single-use devices. Although dipsticks are quick and easy to use, they only provide a semi-quantitative assessment of parameters, and do not demonstrate the accuracy and real-time monitoring capability desired in critical applications.
This work introduces for the first time a Colorimetric Optoelectronic Dynamics Analyzer (CODA). The device uses a sensor embedded with an NH3-sensitive sensing probe based on a pH dye. Unlike existing detection methods for human body fluids, which directly measure dissolved NH4+, the new sensing platform detects total ammonia as NH3 by converting liquid NH4+ to gaseous NH3 by alkaline exposure of the fluid before measurement, which provides the device with extraordinary selectivity. Although similar sensing methods based on this concept have been studied [35], [52], they have only been applied to wastewater and pure solution testing. The handheld, solid-state device introduced here utilizes a red LED light source and photodiodes. The photodiodes transduce the color change of the sensor to an electronic signal, which can be wirelessly transmitted to smart devices for readouts. The wireless connection feature allows flexibility to accommodate a variety of situations, and the operational method has been demonstrated to be accurate, providing concentration levels comparable to the ISE method.
II. Experimental
A. Sensor Preparation
The NH3 sensor is based on Bromophenol Blue (BpB) from Sigma-Aldrich. The sensor substrates were cut into a rectangular shape (2.7cm * 1.2 cm) and laminated so that they fit the sensing chamber of the Colorimetric Optoelectronic Dynamics Analyzer (CODA).
B. Optoelectronic Analyzer, Instrument, and Signal
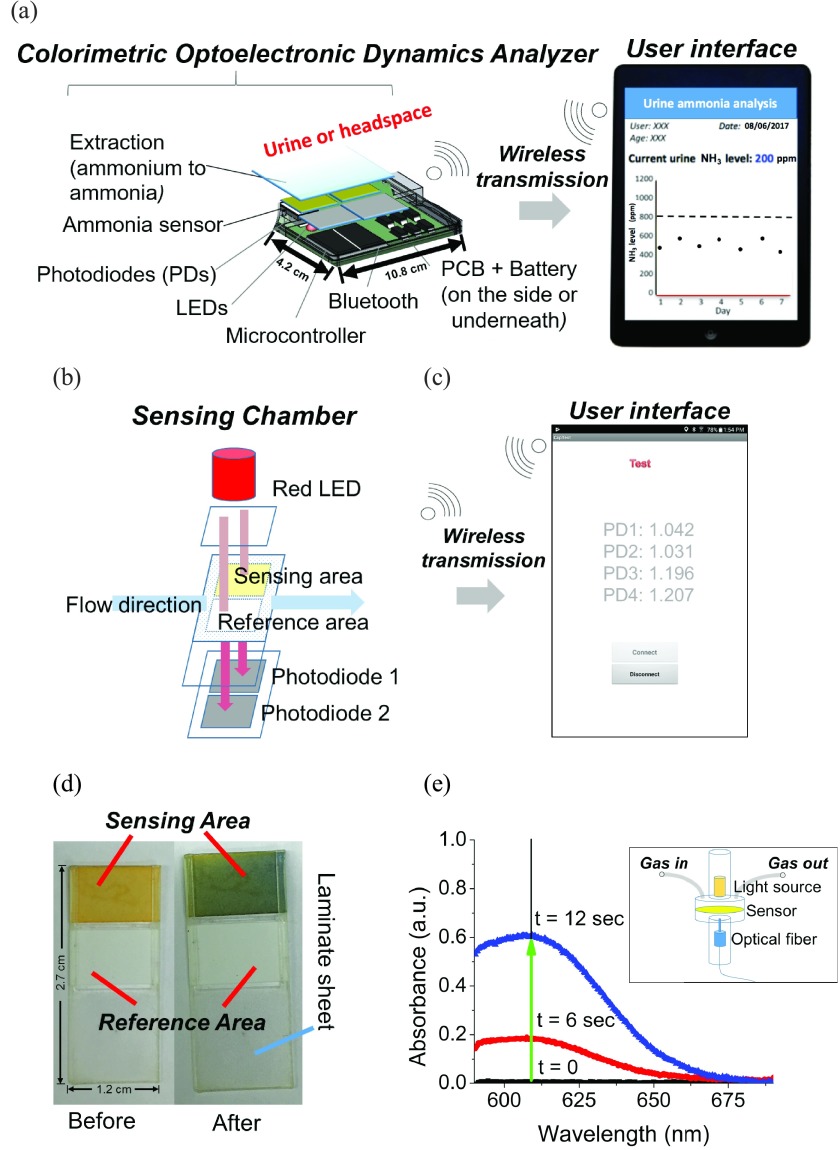
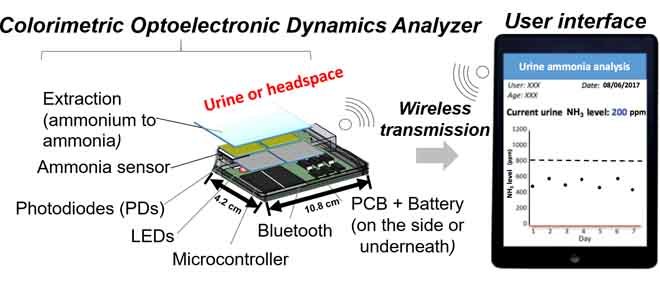
The CODA introduced in this work has a horizontal gas flow channel passing through the sensing chamber, which contains a 610 nm LED at the top of the sensor and four photodiodes (a sensing/reference pair and a sensing/reference backup pair) beneath the sensor (Fig. 1a,b). The target gas is injected into a sensing chamber, where it is exposed to the sensor which then exhibits a color change proportional to the concentration of NH3 in the target gas. The photodiodes were mounted on the printed circuit board (PCB), which was integrated with a Bluetooth unit, allowing signal transmission to an Android phone. An app was created to provide a user interface to show the signal read by the photodiodes (Fig. 1c). The sensor contains a reference area and a sensing area (Fig. 1d). Typically, the background response from the reference and sensing areas when the sensor is in the chamber is around 1.2V. A pair of photodiodes simultaneously read the response of the reference and the sensing areas every 0.2 seconds. The absorbance is calculated by taking the negative logarithm of the signal response from the sensing area (Ssens.) divided by the signal response from the reference area (Sref.) as follows in Equation 1:
 |
FIGURE 1.
The schematic of the Colorimetric Optoelectronic Dynamics Analyzer (CODA). (a) The main components of the CODA (real dimensions added). (b) Schematic of the sensing chamber, and (c) screenshot of the actual user interface, including photodiodes for measuring the signal of the sensing area and the reference area. By comparing the changes on the -log of signal ratio between the sensing and reference areas, the concentration of ammonia (NH3) gas can be determined via absorbance. CODA is able to measure total ammonia level in biological samples up to 59 mmol/L every 2 minutes. (d) The color change of the sensor from orange to blue after exposure to NH3. (e) Spectrum of the absorbance change of the sensor obtained with a JAZ Spectrophotometer (JS) instrument’s sensor chamber (illustrated in the insert). Spectrum before (t=0) and after (t>0) exposure to NH3, indicating the maximum absorbance change wavelength (609 nm) are shown. Insert: Schematic of JS’s sensing chamber. The optical fiber is on the top of the chamber, while the tungsten light source is at the bottom of the chamber. The gas travels from the left tube and discharges into ambient from the right tube.
Calibration curves for the NH3 sensor were performed for a concentration range of 2 – 1000 ppm for NH3 by plotting measured absorbance change versus known concentration of the sample.
1). Optoelectronic Instrument
A JAZ Spectrophotometer (JS) from Ocean Optics was used to conduct the sensitivity tests for the different sensor materials and spectrum measurement before and after exposure to NH3. Fig. 1e insert presents a schematic of the JS measurement device. Whatman no.1 filter paper was cut into a round shape to fit the JS sensing chamber. An NH3 sensor integrated in the shape of a sandwich with an NH3 extraction membrane was used for spectrum measurement. The sensor/membrane assembly consisted of five parts: 1) the distribution layer (filter paper), which makes sure the liquid disperses homogeneously 2) the alkaline layer (impregnated with NaOH solution), extracting NH3 from the sample 3) a polytetrafluoroethylene (PTFE) membrane, precluding liquid from reaching the indicator layer 4) the indicator layer (substrate impregnated with Bromothymol Blue), and 5) the mask made of tape, which protects the sensing probe. A synthetic urine feed (NH4+ solution with other ions simulating urine: NaCl, KH2PO4, CaCl2, MgSO4) was injected from the top of the integrated NH3 sensor membrane. The JS quantifies the NH3 level in sample. The NH3 sensing mechanism is further discussed in section C.
2). Optoelectronic Sensor Signal
As mentioned previously, Bromophenol Blue (BpB) was used as a colorimetric sensing probe for NH3 detection. A BpB solution has a yellow/orange color when it is exposed to a pH level below 3 and a blue color when exposed to a pH above 4.6. The acid/base equilibrium between NH4+ (acid) and NH3 (conjugate base) is determined by the pH of the solution in the overall reaction OH . NH3 has a vapor pressure of 1062 kPa and a pKa of 9.25 at room temperature [53]. Biologically relevant pH conditions are below the pKa of the NH4+/NH3 equilibrium. For example, at a relatively high urine pH of 8, only 6.6% of the total NH4+/NH3 is present as NH3 (gas) [53], [54]. Because of the dynamic nature of biological pH and the variable ratio of urine NH4+ to urine NH3, an alkaline solution is needed to increase the sample pH greater than ~12 to ensure 100% conversion of NH4+ (liquid) to NH3. NH3 causes the sensing surface to become more alkaline, shifting the pH value higher and causing a yellow to blue color transition (Fig. 1d). By quantifying the color change using the CODA, we can determine the corresponding NH3 concentration derived from the sample.
C. Gas Sample Preparation
1). Ammonia Bags
The NH3 gas samples used in this work were diluted with 100 ppm and 1000 ppm calibration NH3 gas purchased from Calibration Technologies, Inc. Dilutions of gas samples in laboratory compressed air were prepared from 100 and 1000 ppm of NH3 calibration gas. These calibration gases were directed into a 40 L bag using a micro diaphragm gas pump for a predetermined amount of time. Additional clean air was also directed into the bag for a controlled amount of time until the concentration of NH3 in the bag reached the desired level. The target NH3 gas concentration was prepared by manipulating the ratio of time of NH3 gas injection to air injection. An alternative NH3 bag was prepared by injecting  of ammonium hydroxide in a 1 L Tedlar™ bag and left in ambient room temperature for 30 minutes to validate the calibration curve for the sensors (respective results shown in Table 1).
TABLE 1. Ammonia Concentration (ppm) Output from Calibrations Performed With 1-Sec and 5-Sec Sampling Times in the NH3 Sensors.
| 1s PD11 | 1s PD22 | 5s PD13 | 5s PD24 | |
|---|---|---|---|---|
| Run 1 | 868 | 875 | 956 | 932 |
| Run 2 | 980 | 1035 | 919 | 914 |
| Run 3 | 1018 | 998 | 1021 | 968 |
| Mean | 955 | 970 | 966 | 938 |
| S.D. | 64 | 68 | 42 | 23 |
1–2 Recovered with 1-second calibration curve from Photodiode 1, and Photodiode 2, respectively
3–4 Recovered with 5-second calibration curve from Photodiode 1, and Photodiode 2, respectively
2). Urine Headspace Bags
A test sample of urine was preconditioned by adding NaOH to a sample of urine, to ensure that the pH of the sample was greater than 12. The preconditioned urine sample was subsequently added to a 4 L Tedlar™ bag and purged with dry air until the bag was full. The Tedlar™ bag was left at ambient room temperature to ensure gas equilibration. This means that all of the NH4+ in the urine reacted with the base and turned into its conjugated phase NH3 in urine headspace. Subjects of this part of the study were approved by the Institutional Review Board of Arizona State University (IRB protocol # 1012005855). Five test subjects participated voluntarily, providing written consent to participate in the study. Three of the subjects are males and the rest are females. All subjects are healthy adults aging between 21 to 27. All tests for this study were conducted from February 2016 – January 2018. The subjects had a small meal (Lean Cuisine), and drank a Whey Protein (GNC Holding Inc., PA or US Nutrition Inc., NY) shake with concentrations of protein ranging from 0 to 1.2 g of protein per Kg of body mass to produce a variable and wide range of urine total ammonia. The subjects urinated periodically at 0, 0.5, 2.5, and 3.5 hours from the intake. Urine samples were collected and analyzed as soon as possible, using ISE method and the CODA.
D. Sensor Detection Procedure
The sensitivity, reversibility, and reusability of the sensors were tested using an NH3 flow system, which contains a micro diaphragm gas pump, a three-way valve, one 40 L air bag, one 40 L sample bag, and the sensing chamber. Tests were conducted by placing one sensor in the sensing chamber each time. The three-way valve was first switched to connect with the air bag for a few seconds so that the sensor could be purged in air before it was exposed to the sample for a few seconds. In order to study the sensitivity of the sensor for different sample exposure times, sampling times varied from 1, 5, 20 and 180 seconds. After exposure to NH3, the valve was switched to allow dry air to pass through the system for a few seconds to test the sensor substrates’ reversibility.
III. Results and Discussion
A. Choice of the CODA Wavelength
The color of the light source for the CODA was selected based on the spectral changes NH3 exposure induced on the sensing probe (BpB) system as measured by the JS instrument. The spectrum of each sensor was recorded before and after exposure to NH3. Fig. 1e shows visible spectrophotometric changes of a BpB-based sensor, and significant increases of absorbance in the range of 575 – 625 nm are clearly observed. Based on these results, the LED color was chosen to be 610 nm. Once the detection wavelength and the first screening of sensor substrate were chosen, the CODA was constructed and used to proceed with the rest of the study.
B. Reproducibility of Sensor Response
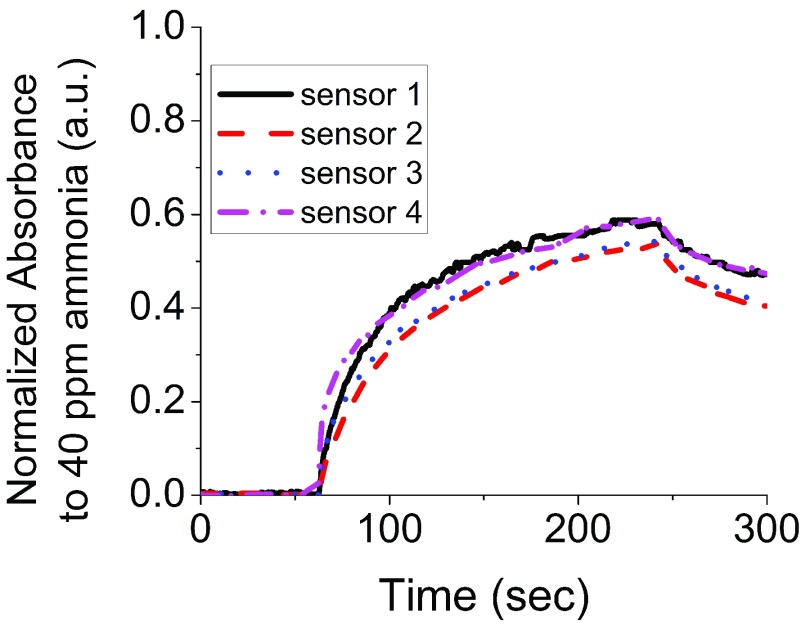
Fig. 2 compares the absorbance response of sensors in the CODA. Four replicate sensors were made and placed in the CODA. Next, the sensors were exposed to NH3 for 180 seconds followed by dry air for additional 60 seconds to determine recovery. The sensors show similar response characteristics with rising absorbance upon the injection of NH3, and decreasing absorbance upon purging with dry air. The sensor responses included 0.58 a.u. with a standard deviation of 0.03 a.u. for measurements performed in multiple sensors from a same batch and a response dispersion across sensor substrates of 5% or less.
FIGURE 2.
The reproducibility of the sensors was determined using four different sensors to detect 40 ppm of ammonia (NH3) through the CODA. The sensors show similar absorbance response.
C. Sensor Calibration to Ammonia
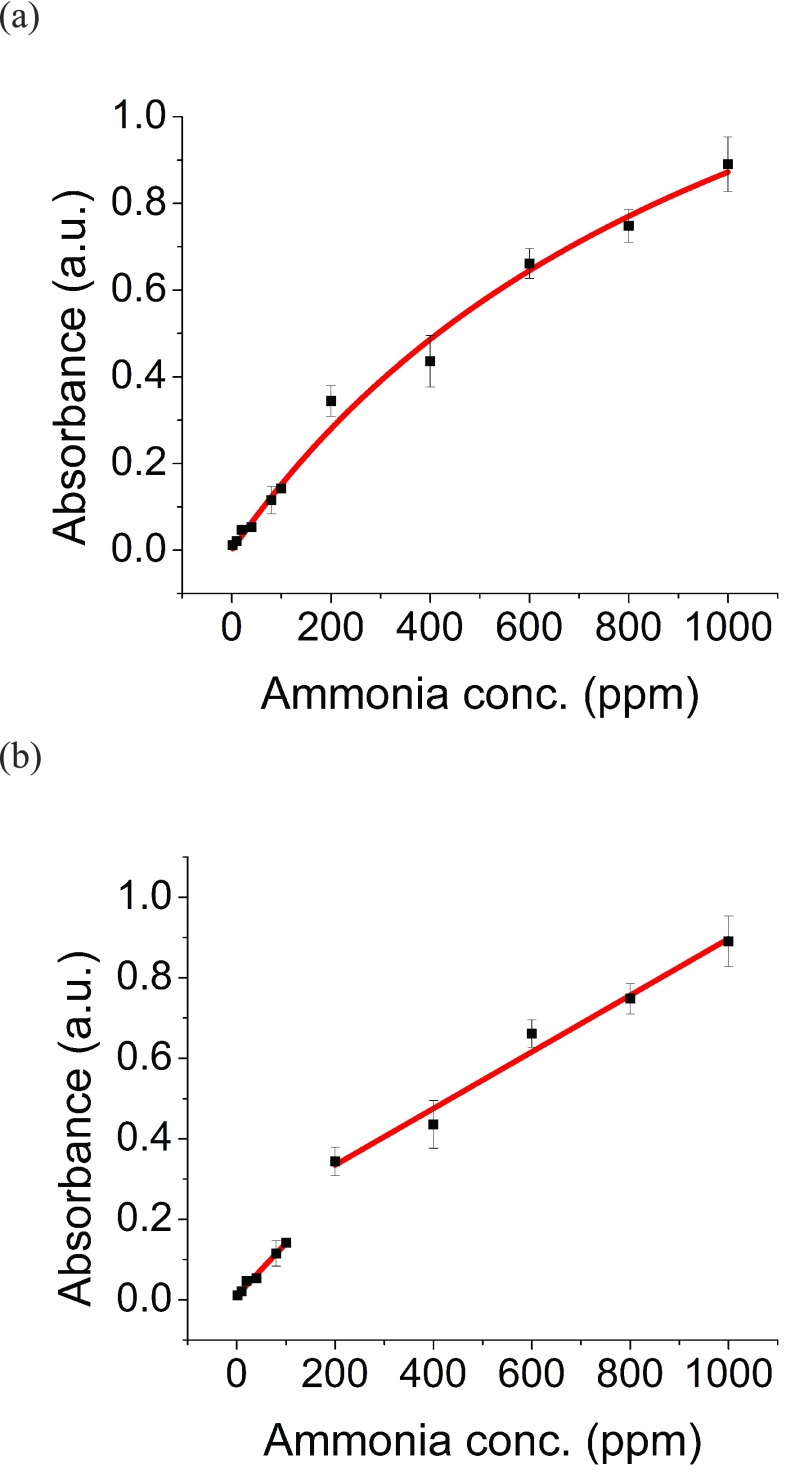
Two calibration curves were developed for the NH3 sensors with the CODA, using 5 second sampling times with NH3 gas levels ranging from 2 ppm to 1000 ppm. In one case, a Langmuir model [55] was applied (Fig. 3a), and exhibited a R2 value greater than 0.99. For the 5 second sampling times, the calibration equation is as follows, where AL represents the absorbance derived from Langmuir model and C represents the corresponding concentration:
 |
FIGURE 3.
Calibration curves were developed by measuring 2 ppm to 1000 ppm of ammonia (NH3) with CODA in 5 seconds. (a) Langmuir model was used to fit the entire NH3 concentration range measurement with an R2 equal to 0.99. (b) A linear fitting was used to fit the lower-range concentration measurements (2–100 ppm) with an R2 equal to 0.98 and another linear fitting was used to fit higher range concentration measurements (200–1000 ppm) with an R2 equal to 0.99.
In the other case, the calibration curve was divided into two ranges for fitting linear regressions: 2 – 150 ppm and 150 – 1000 ppm. Both measurement ranges showed R2 values greater than 0.98 (Fig. 3b). The calibration equations are as follows, where A1 represents the absorbance derived from linear model from 0 – 150 ppm, A2 represents the absorbance derived from linear model from 150 – 1000 ppm, and C represents the corresponding concentration:
 |
In a different set of fittings, linear regressions for absorbance changes assessed at 1 second exposure of NH3 were also obtained, and compared to those obtained at 5 second exposure of NH3. These regressions were used to test an unknown sample concentration, resulting from a mixture of ammonium hydroxide and air inside a bag. Table 1 shows the results assessed for the unknown concentration sample by the sensor, using a 1- and 5- second sample exposure, and the corresponding calibration curves. Both calibration curves (from the 1-second and 5-second exposure data), yielded the same concentration of the prepared NH3 bag of unknown concentration, indicating self-consistency of the calibrations. Additionally, these results indicate consistency between each pair of photodiodes (PD1 (sensing) / PD3 (reference) shown as PD1 and PD2 (sensing) / PD4 (reference) shown as PD2) in the system, as both pair of photodiodes yielded the same response.
D. Sensor Selectivity to Ammonia
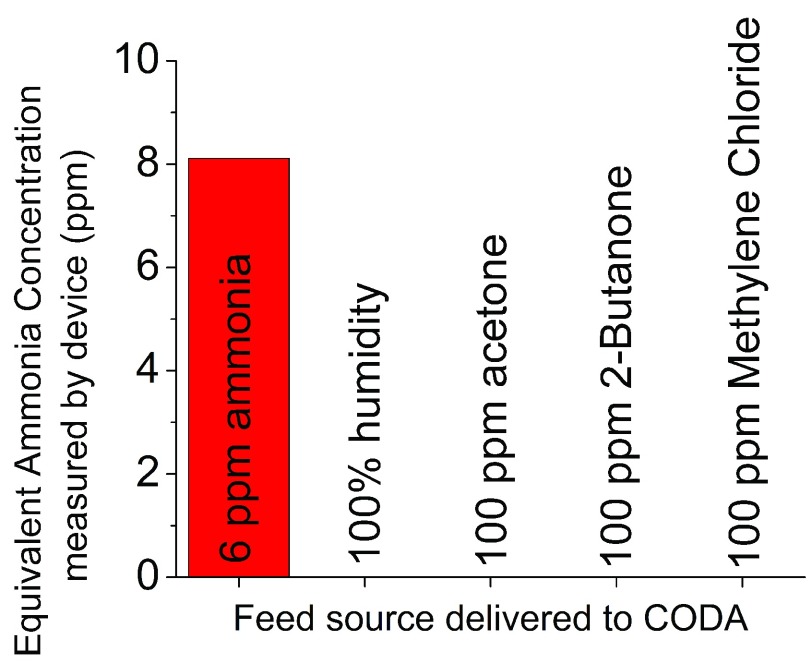
To confirm the sensor is only selective to NH3, the sensor was exposed to several interferents (e.g., acetone, 2-butanone, and methylene chloride) reported to exist in urine headspace [27]. Fig. 4 shows the selectivity of the sensor to NH3. Even with relatively high concentration of interferents (e.g. 100 ppm acetone), the sensor only showed a significant response to NH3. This test confirmed the selectivity of the sensor in the harsh environment of the urine headspace sample.
FIGURE 4.
The concentration of several compounds existing in urine headspace was measured with the CODA in this work. The NH3 sensor only shows response to ammonia.
E. Sensor Reversibility and Reusability
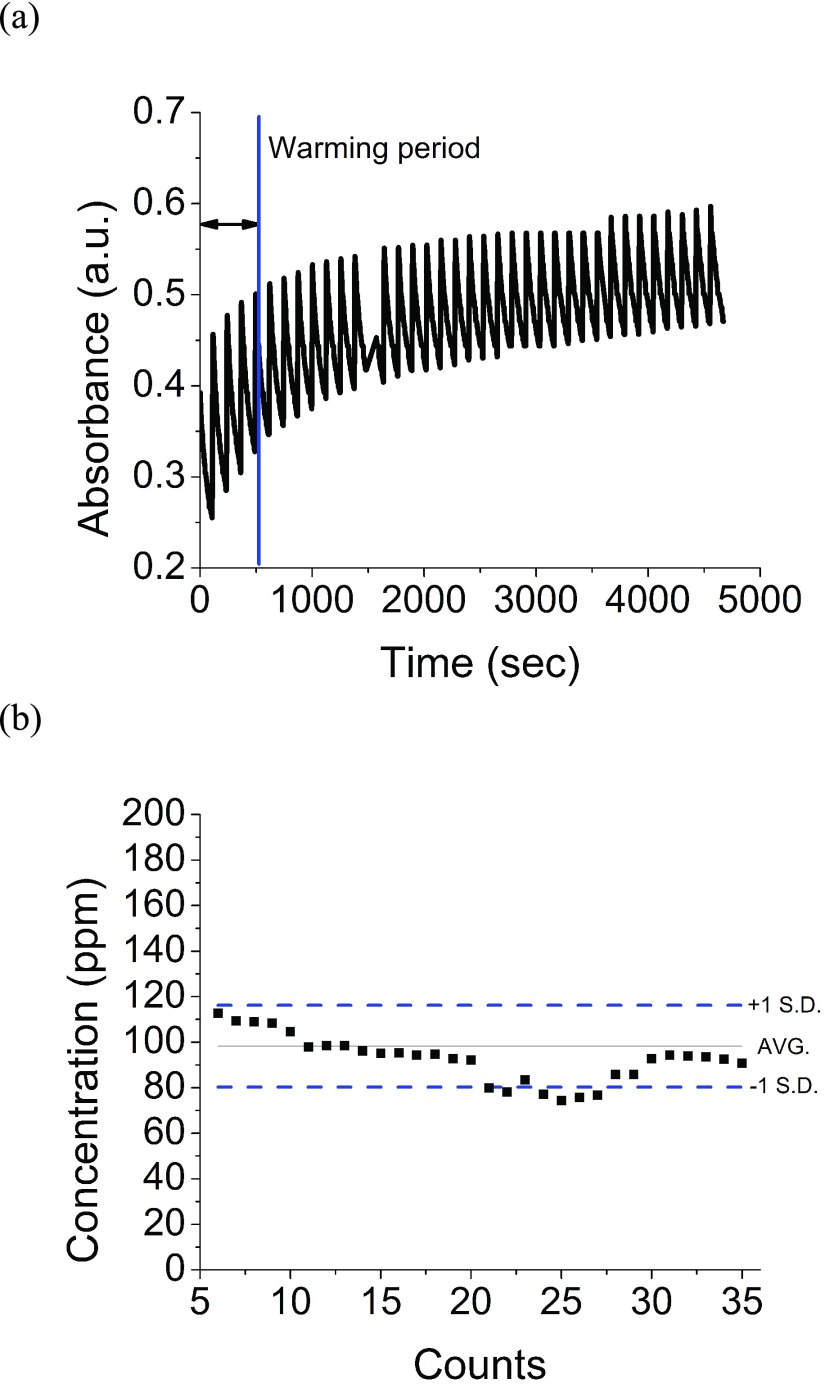
A healthy adult may urinate every 2–3 hours (8–9 times per day) [56]. Current methods to quantify NH4+ in urine for clinical medicine require the patient to collect all excreted urine for 24 hours. There is no clinically used method for instantaneous urine NH3 measurement. Fig. 5a shows the absorbance response of the sensor from this work to alternating exposure to 100 ppm of NH3 and dry air repeatedly over 1.2 hours. The sensor was exposed to a repeating cycle of NH3 for 5 seconds followed by dry air for 120 seconds. The sensor was re-used for over 60 detection cycles without degradation in performance. Fig. 5b shows the measured concentrations from the continuous test after signal analysis, and use of calibration equations. It is important to note that the sensor required a conditioning period of 5–7 exposures. After this conditioning period, the concentration output remained fairly constant throughout the multiple exposures to NH3 and detection events of the same concentration. The detection concentration error was lower than 20%, and could be further improved with a better enclosure of the CODA, which will preclude from ambient light interference.
FIGURE 5.
(a)The reusability of a sensor was determined by exposing 100 ppm of ammonia to a sensor for 5 seconds and then to dry air for 2 minutes for each measurement. (b) 35 measurements were conducted in 1.2 hours before the sensor saturated. Over 80% of the measurements were within ±1 standard deviation.
F. Evaluation of Ion Selective Electrodes as Reference Method
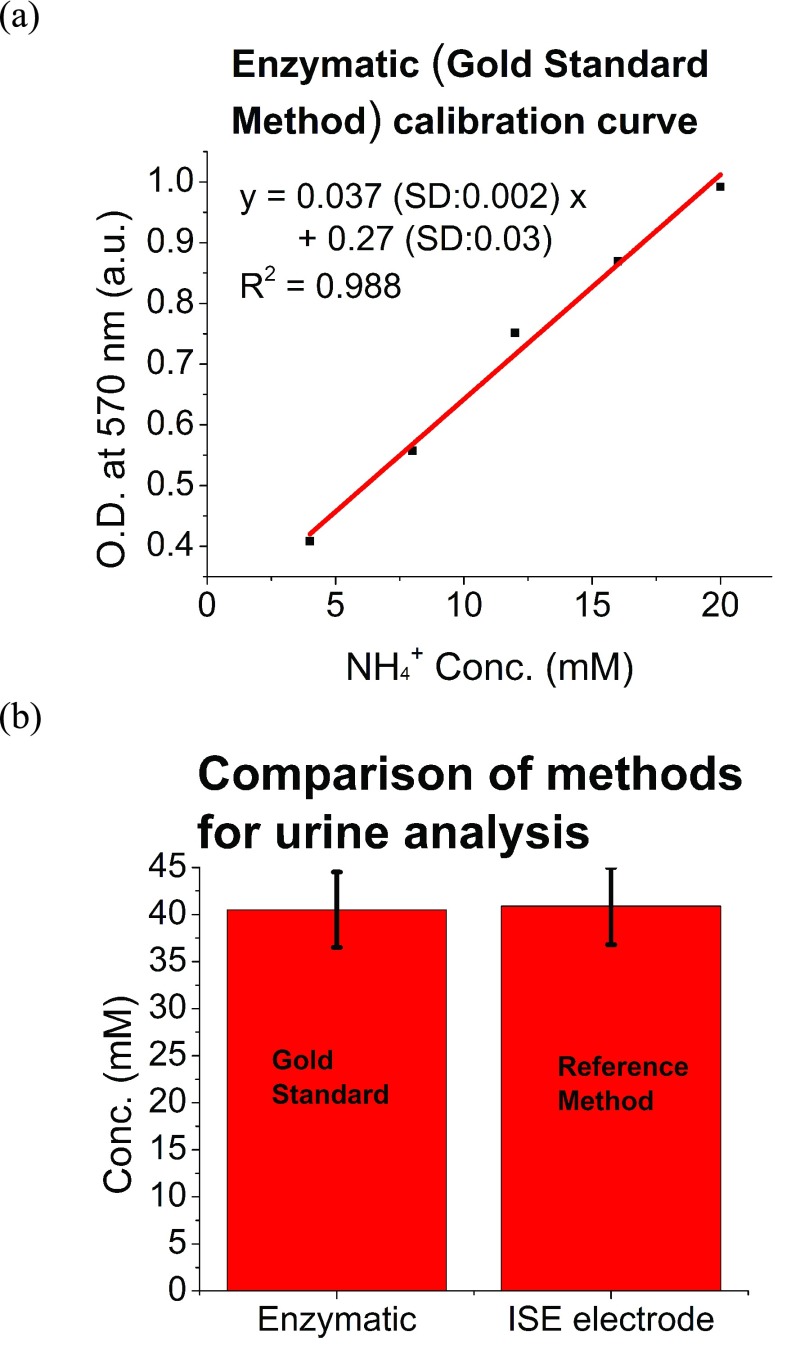
In this work, an ion selective electrode (ISE) (Ammonia High Performance Ion Selective Electrode) from Thermo Fisher Scientific was used as a reference method for total ammonia (NH3 + NH4+) detection. The ISE was chosen due to the relatively inexpensive cost per sample compared with Gold Standard Methods, which are based on enzymatic methods. In addition, ISE enabled the processing of near real-time real urine samples, and the evaluation of results under conditions that were more compatible with the intended use of the CODA. In order to evaluate the accuracy of ISE, the Gold Standard Method from Biovision [57] was used. The method is based on enzymatic reactions, and enables accurate detection of total ammonia expressed as NH4+ levels. In the assay, NH3 or NH4+ is converted to a product that reacts with an enzyme and redox probe to generate color (at Optical Density, OD of 570 nm, which can be easily quantified by a plate reader. The kit can detect 1 nmol ( ) of NH3 or NH4+
[57]. A linear regression of the averaged data for 3 samples at each concentration is shown in Fig. 6a, and was in agreement with the manufacturer specifications. The curve was used to assess total ammonia levels from urine, which were also determined by ISE. Fig. 6b shows the averaged results of urine samples analyzed with the Gold Standard Method (enzymatic) and ISE. The ISE method had an error smaller than 1% when compared with Gold Standard Method, therefore, the ISE method was established as reference method.
FIGURE 6.
Evaluation of accuracy of the reference method, ISE. (a) The evaluation was performed with the gold standard method based on enzymatic reactions from Biovision. The calibration curve of the Biovision method is shown and was used to extract the total ammonia levels that were compared to the total ammonia level assessed from the ISE. (b) Averaged urine levels of 40.5 mM from Biovision test compared to averaged urine total ammonia levels of 40.9 mM from ISE, showing ISE method with an error smaller than 1%.
G. Sensor Use With Urine Samples
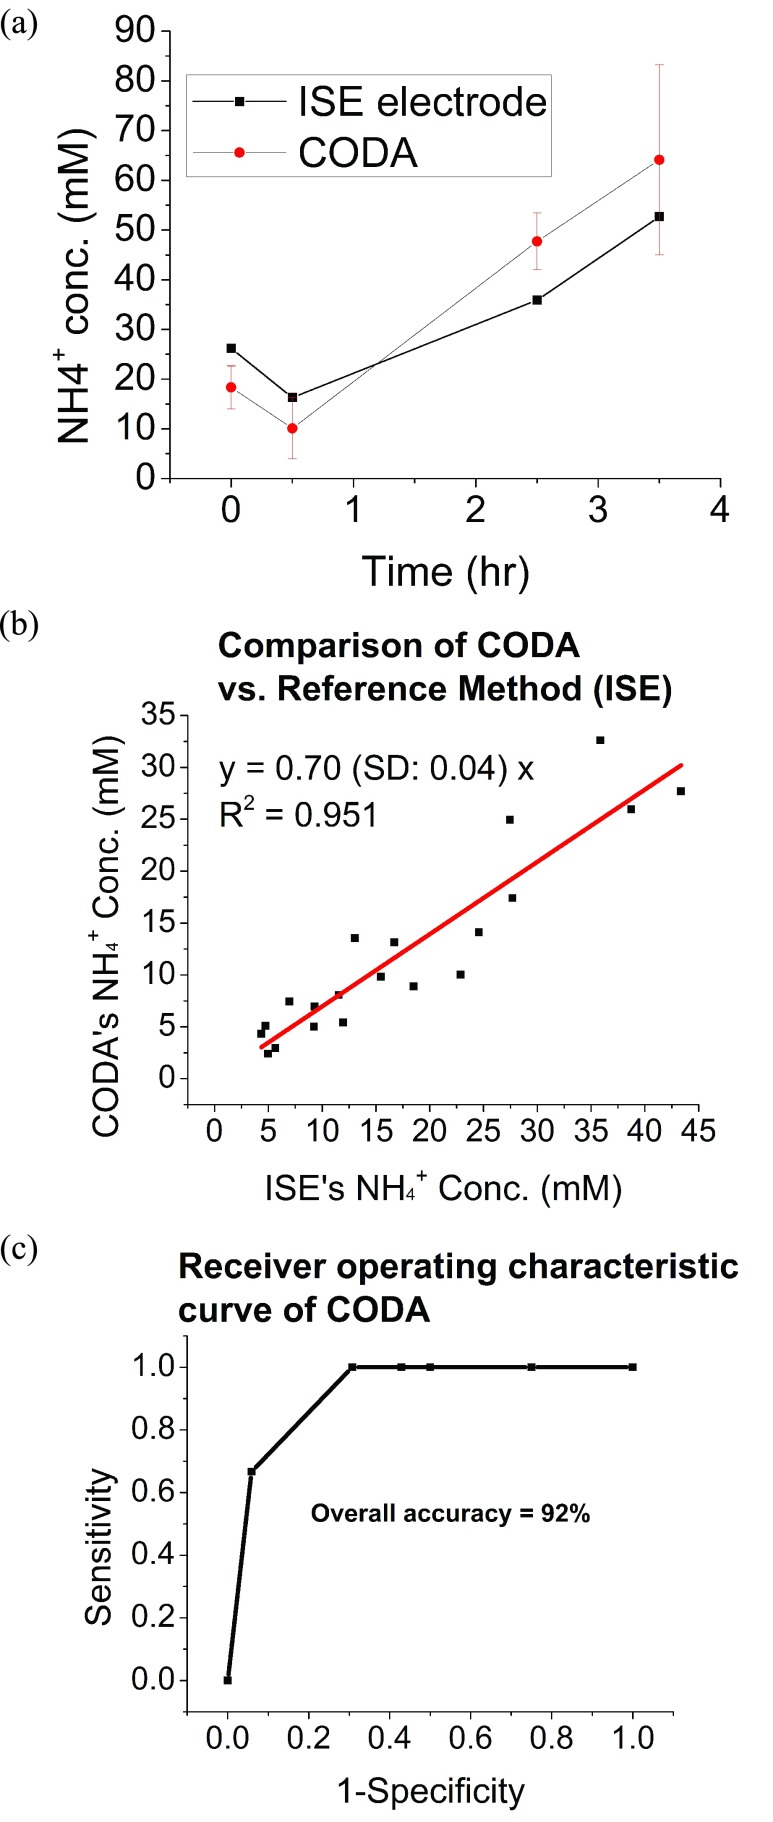
To confirm the feasibility of the CODA and its use of the sensor in real conditions, a urine sample analysis was performed and measurements were recorded from a calibrated batch of sensors, and results were compared with those assessed from the ISE method. Subjects were first asked to urinate and then to eat a small meal and drink a protein shake as described in the experimental section. Next, the samples were measured by the ISE electrode and afterwards measured with the CODA. Fig. 7a presents an example of the measurements from one subject, who consumed a protein shake with 1 g of protein per Kg body mass. A similar result can also be found in literature using SIFT-MS [58]. Fig. 7b shows a correlation plot of results assessed from 5 subjects that had a wide range of protein concentration intake (details shown in experimental section), and urine samples were collected and analyzed with ISE (first) and CODA (second). A total of 20 samples (4 samples per subject) were processed. A good agreement between the measurement with ISE and the CODA was found with a regression coefficient >0.9. However, the slope of the correlation showed smaller values assessed from the CODA with respect to ISE method. This may have been due to the loss of total ammonia as NH3 (gas) promoted by prolonged urine storage, as well as a relatively high average pH of the urine samples tested (~7). This finding highlights the critical importance of reducing the time between collection and analysis of urine samples. In this regard, the team plans to report on progress in a follow up publication.
FIGURE 7.
(a) Measurements of ammonia in urine headspace collected with the CODA and an ISE electrode for 3.5 hrs after the subject drank a protein shake. Both devices show ammonia concentration levels dropped 0.5 hr after drinking the protein shake but continued to rise until the experiment ended. It is worth noticing 17ppm = 1 mM NH4+ (b) The accuracy of the CODA was determined by systematically comparing its measurement to an ammonia ISE electrode (reference method). The measurement of the CODA was converted to NH4+ level in liquid solution for clinical practical use by Medical Professionals. (c) Analytical performance of CODA: Receiver operating characteristic (ROC), using ISE method to determine True diagnostic ability as its discrimination threshold varied from 5, 10, 15, 20, 30, 40 mM NH4+ (read total ammonia levels).
Despite the detected problem, analysis of Receiver Operating Curve (ROC) for the assessed results was performed. Fig. 7c shows the analysis of the analytical performance of the CODA, with a ROC, using ISE method to determine true diagnostic ability. This means that the true positive rate (Sensitivity) was plotted as a function of the false positive rate (100- Specificity) for different threshold cut-off points as its discrimination threshold varied from 5, 10, 15, 20, 30, 40 mM NH4+ (read total ammonia levels) The concentration range covered the normal ammonia total level in urine. As it can be observed, the overall accuracy of the method was 92%, which is a satisfactory result.
Table 2 shows comparative features of the traditional methods used for total ammonia detection in connection to the newly proposed method using the CODA. The setup discussed in this work requires two manual steps: (1) the preparation of preconditioned urine to produce ammonia and (2) the switching the valve to control the sensing time. The team is developing an automatic system that has a preconditioning membrane and electronic valves allowing the omission of these steps. Challenges are that the membrane needs to work for at least 24 hours to meet the need of medical applications. The ultimate goal is to apply CODA as a diagnostic device. With the planned changes accuracy could be improved over 92%.
TABLE 2. Comparative Table of Methods for Total Ammonia Detection.
| Method | Enzymatic (Gold Standard) | ISE (Reference Method) | CODA |
|---|---|---|---|
| Accuracy | >99% compared with Gold Standard | 92% compared to Reference Method | |
| Time per sample | 60+ min | < 5 min | < 2 min (as envisioned with automated sampling) |
| Cost per sample | $5.00+ | < $0.35 | < $0.03 |
IV. Conclusion
The Colorimetric Optoelectronic Dynamics Analyzer (CODA) discussed provides sensitivity, specificity, fast reversibility, and rapid response times for NH3 gas concentrations ranging from 2 ppm to 1000 ppm (corresponding to 0.1 mmol/L to 50 mmol/L of NH4+ in liquid). The CODA measures 30-times faster than current ammonia quantification techniques (e.g. ISE) and requires much less labor to perform measurements. The sensor is very selective to NH3, especially considering the high amount of interferents in urine headspace. The sensor shows good reusability in long sampling periods, enabling daily use for medical applications. CODA can accurately monitor the total ammonia level in urine, as evidenced by comparison to measurements from a commercial reference method (ISE electrode). The device prototype connects wirelessly to smart devices, which provides flexibility for measurements for inpatient, outpatient, or personal health monitoring. As such, this sensor could potentially be a great asset to the medical community, providing a convenient alternative to the slow and bulky measurement techniques that are currently in widespread use.
Acknowledgements
The authors would like to thank Drs. Lenore Dai and Kyle Squires for their support; Drs. Francis Tsow and Devon Bridgeman for the assistance on device electronics; and Dr. NJ Tao, Director of the Center of Bioelectronics and Biosensors, Biodesign Institute, for his constant encouragement for this work.
Funding Statement
The work of P. Cay-Durgun and T. Lai was supported by the National Science Foundation CAREER Award under Grant CBET-1254215. The work of M. Sprowls was supported by the Arizona State University (ASU) Fulton Undergraduate Research Initiative. The work of E. Forzani was supported by the ASU Fulton Schools of Engineering Entrepreneurial Professor Award.
Contributor Information
Leslie Thomas, Email: thomas.leslie@mayo.edu.
Mary Laura Lind, Email: mllind@asu.edu.
Erica Forzani, Email: eforzani@asu.edu.
References
- [1].van de Kant K. D. G., van der Sande L. J. T. M., Jöbsis Q., van Schayck O. C. P., and Dompeling E., “Clinical use of exhaled volatile organic compounds in pulmonary diseases: A systematic review,” Respiratory Res., vol. 13, p. 117, Dec. 2012. [DOI] [PMC free article] [PubMed] [Google Scholar]
- [2].Raphael K. L., Gilligan S., and Lx J. H., “Urine anion gap to predict urine ammonium and related outcomes in kidney disease,” Clin. J. Amer. Soc. Nephrol., vol. 13, no. 2, pp. 205–212, 2018. [DOI] [PMC free article] [PubMed] [Google Scholar]
- [3].Batshaw M. L. and Brusilow S. W., “Treatment of hyperammonemic coma caused by inborn errors of urea synthesis,” J. Pediatrics, vol. 97, no. 6, pp. 893–900, 1980. [DOI] [PubMed] [Google Scholar]
- [4].Brusilow S. W. and Maestri N. E., “Urea cycle disorders: Diagnosis, pathophysiology, and therapy,” Adv. Pediatrics, vol. 43, pp. 127–170, Jan. 1996. [PubMed] [Google Scholar]
- [5].Häberle J.et al. , “Suggested guidelines for the diagnosis and management of urea cycle disorders,” Orphanet J. Rare Diseases, vol. 7, p. 32, May 2012. [DOI] [PMC free article] [PubMed] [Google Scholar]
- [6].Lee B.et al. , “Blood ammonia and glutamine as predictors of hyperammonemic crises in patients with urea cycle disorder,” Genet Med., vol. 17, pp. 561–568, Jul. 2015. [DOI] [PMC free article] [PubMed] [Google Scholar]
- [7].Weiner I. D., Mitch W. E., and Sands J. M., “Urea and ammonia metabolism and the control of renal nitrogen excretion,” Clin. J. Amer. Soc. Nephrol., vol. 10, pp. 1444–1458, Jul. 2014, doi: 10.2215/CJN.10311013. [DOI] [PMC free article] [PubMed] [Google Scholar]
- [8].Lee H. W.et al. , “Effect of dietary protein restriction on renal ammonia metabolism,” Amer. J. Physiol. Renal Physiol., vol. 308, no. 12, pp. F1463–1473, 2015. [DOI] [PMC free article] [PubMed] [Google Scholar]
- [9].Tizianello A.et al. , “Renal ammoniagenesis in the postprandial period,” Contrib. Nephrol., vol. 47, pp. 44–57, 1985. [DOI] [PubMed] [Google Scholar]
- [10].Manore M., Meyer N., and Thompson J., Sport Nutrition for Health and Performance, 2nd, ed. Human Kinetic, 2009. [Google Scholar]
- [11].Barsotti R., “Measurement of ammonia in blood,” J. Pediatrics, vol. 138, pp. S11–S20, Jan. 2001. [DOI] [PubMed] [Google Scholar]
- [12].Clifford P. K. and Tuma D. T., “Characteristics of semiconductor gas sensors I. Steady state gas response,” Sens. Actuators, vol. 3, pp. 233–254, Jan. 1983. [Online]. Available: https://www.sciencedirect.com/science/article/pii/0250687482800267 [Google Scholar]
- [13].Imawan C., Solzbacher F., Steffes H., and Obermeier E., “Gas-sensing characteristics of modified-MoO3 thin films using Ti-overlayers for NH3 gas sensors,” Sens. Actuators B, Chem., vol. 64, pp. 193–197, Jun. 2000. [Google Scholar]
- [14].Sberveglieri G., “Recent developments in semiconducting thin-film gas sensors,” Sens. Actuators B, Chem., vol. 23, pp. 103–109, Feb. 1995. [Google Scholar]
- [15].Srivastava R. K., Lal P., Dwivedi R., and Srivastava S. K., “Sensing mechanism in tin oxide-based thick-film gas sensors,” Sens. Actuators B, Chem., vol. 21, pp. 213–218, Sep. 1994. [Google Scholar]
- [16].Hübner H.-P. and Drost S., “Tin oxide gas sensors: An analytical comparison of gas-sensitive and non-gas-sensitive thin films,” Sens. Actuators B, Chem., vol. 4, pp. 463–466, Jun. 1991. [Google Scholar]
- [17].Georges J., “Determination of ammonia and urea in urine and of urea in blood by use of an ammonia-selective electrode,” Clin. Chem., vol. 25, no. 11, pp. 1888–1890, 1979. [PubMed] [Google Scholar]
- [18].Orion. (May 2009). High-Performance Ammonia Electrode. [Online]. Available: https://www.thermofisher.com/order/catalog/product/9512HPBNWP
- [19].Da Fonseca-Wolheim F., “Enzymatic assay based on 2-oxoglutarate with glutamate dehydrogenase for detection of ammonia in biological samples (Direkte Plasmaarnmoniakbestimmung ohne Enteiweissung),” (in German), J. Clin. Chem. Clin. Biochem., vol. 11, pp. 31–421, Jan. 1973. [Online]. Available: https://edoc.hu-berlin.de/handle/18452/11774 [Google Scholar]
- [20].Timmer B., Olthuis W., and van den Berg A., “Ammonia sensors and their applications—A review,” Sens. Actuators B, Chem., vol. 107, pp. 666–677, Jun. 2005. [Google Scholar]
- [21].Goggs R., Serrano S., Szladovits B., Keir I., Ong R., and Hughes D., “Clinical investigation of a point-of-care blood ammonia analyzer,” Vet. Clin. Pathol., vol. 37, pp. 198–206, Jun. 2008. [DOI] [PubMed] [Google Scholar]
- [22].NEPHROLUX: Breath Ammonia Analyzer. Accessed: Aug. 4, 2017. [Online]. Available: http://www.pranalytica.com
- [23].Hibbard T. and Killard A., “Breath ammonia analysis: Clinical application and measurement,” Crit. Rev. Anal. Chemsitry, vol. 41, no. 1, pp. 21–35, 2011. [Google Scholar]
- [24].Krkosová Z., Kubinec R., Soják L., and Amann A., “Temperature-programmed gas chromatography linear retention indices of all C4–C30 monomethylalkanes on methylsilicone OV-1 stationary phase. Contribution towards a better understanding of volatile organic compounds in exhaled breath,” J. Chromatogr. A, vol. 1179, pp. 59–68, Jan. 2008. [DOI] [PubMed] [Google Scholar]
- [25].Smith S.et al. , “A comparative study of the analysis of human urine headspace using gas chromatography–mass spectrometry,” J. Breath Res., vol. 2, no. 3, p. 037022, 2008, doi: 10.1088/1752-7155/2/3/037022. [DOI] [PubMed] [Google Scholar]
- [26].Grote C. and Pawliszyn J., “Solid-phase microextraction for the analysis of human breath,” Anal. Chem., vol. 69, pp. 587–596, Feb. 1997. [DOI] [PubMed] [Google Scholar]
- [27].Smith S.et al. , “A comparative study of the analysis of human urine headspace using gas chromatography-mass spectrometry,” J. Breath Res., vol. 2, no. 3, p. 037022, 2008. [DOI] [PubMed] [Google Scholar]
- [28].Španěl P. and Smith D., “Progress in SIFT-MS: Breath analysis and other applications,” Mass Spectrometry Rev, vol. 30, pp. 236–267, Mar-Apr 2011. [DOI] [PubMed] [Google Scholar]
- [29].Turner C., Španěl P., and Smith D., “A longitudinal study of ammonia, acetone and propanol in the exhaled breath of 30 subjects using selected ion flow tube mass spectrometry, SIFT-MS,” Physiol. Meas., vol. 27, no. 4, pp. 321–337, 2006. [DOI] [PubMed] [Google Scholar]
- [30].Wang T., Pysanenko A., Dryahina K., Smith D., and Španěl P., “Analysis of breath, exhaled via the mouth and nose, and the air in the oral cavity,” J. Breath Res., vol. 2, no. 3, p. 037013, 2008. [DOI] [PubMed] [Google Scholar]
- [31].Španěl P., Davies S., and Smith D., “Quantification of ammonia in human breath by the selected ion flow tube analytical method using H3O+ and O2 + precursor ions,” Rapid Commun. Mass Spectrometry, vol. 12, no. 12, pp. 763–766, 1998. [DOI] [PubMed] [Google Scholar]
- [32].Davies S., Španěl P., and Smith D., “Quantitative analysis of ammonia on the breath of patients in end-stage renal failure,” Kidney Int, vol. 52, pp. 223–228, Jul. 1997. [DOI] [PubMed] [Google Scholar]
- [33].Airoudj A., Debarnot D., Bêche B., and Poncin-Epaillard F., “A new evanescent wave ammonia sensor based on polyaniline composite,” Talanta, vol. 76, pp. 314–319, Jul. 2008. [DOI] [PubMed] [Google Scholar]
- [34].Airoudj A., Debarnot D., Bêche B., and Poncin-Epaillard F., “New sensitive layer based on pulsed plasma-polymerized aniline for integrated optical ammonia sensor,” Anal. Chim. Acta, vol. 626, pp. 44–52, Sep. 2008. [DOI] [PubMed] [Google Scholar]
-
[35].Jayawardane B. M., McKelvie I. D., and Kolev S. D., “Development of a gas-diffusion microfluidic paper-based analytical device (
 PAD) for the determination of ammonia in wastewater samples,” Anal. Chem., vol. 87, no. 9, pp. 4621–4626, 2015. [DOI] [PubMed] [Google Scholar]
 - [36].Filho M. B.et al. , “Detection of ammonia released from zeolite by the quantum cascade laser based photoacoustic set-up,” Eur. Phys. J. Special Topics, vol. 153, pp. 547–550, Jan. 2008. [Google Scholar]
- [37].Filho M. B.et al. , “Ammonia detection by using quantum-cascade laser photoacoustic spectroscopy,” Appl. Opt., vol. 45, pp. 4966–4971, Jul. 2006. [DOI] [PubMed] [Google Scholar]
- [38].Manne J., Sukhorukov O., Jäger W., and Tulip J., “Pulsed quantum cascade laser-based cavity ring-down spectroscopy for ammonia detection in breath,” Appl. Opt., vol. 45, pp. 9230–9237, Dec. 2006. [DOI] [PubMed] [Google Scholar]
- [39].Passaro V. M. N., Dell’Olio F., and De Leonardis F., “Ammonia optical sensing by microring resonators,” Sensors, vol. 7, pp. 2741–2749, Nov. 2007. [DOI] [PMC free article] [PubMed] [Google Scholar]
- [40].Aguilar A. D., Forzani E. S., Nagahara L. A., Amlani I., Tsui R., and Tao N. J., “A breath ammonia sensor based on conducting polymer nanojunctions,” IEEE Sensors J., vol. 8, no. 3, pp. 269–273, Mar. 2008. [Google Scholar]
- [41].Kharat H. J., Kakde K. P., Savale P. A., Datta K., Ghosh P., and Shirsat M. D., “Synthesis of polypyrrole films for the development of ammonia sensor,” Polym. Adv. Technol., vol. 18, pp. 397–402, May 2007. [Google Scholar]
- [42].Kukla A. L., Shirshov Y. M., and Piletsky S. A., “Ammonia sensors based on sensitive polyaniline films,” Sens. Actuators B, Chem., vol. 37, no. 3, pp. 135–140, 1996. [Google Scholar]
- [43].Lähdesmäki I., Kubiak W. W., Lewenstam A., and Ivaska A., “Interferences in a polypyrrole-based amperometric ammonia sensor,” Talanta, vol. 52, pp. 269–275, Jun. 2000. [DOI] [PubMed] [Google Scholar]
- [44].Prasad G. K., Radhakrishnan T. P., Kumar D. S., and Krishna M. G., “Ammonia sensing characteristics of thin film based on polyelectrolyte templated polyaniline,” Sens. Actuators B, Chem., vol. 106, no. 2, pp. 626–631, May 2005. [Google Scholar]
- [45].Sutar D. S., Padma N., Aswal D. K., Deshpande S. K., Gupta S. K., and Yakhmi J. V., “Preparation of nanofibrous polyaniline films and their application as ammonia gas sensor,” Sens. Actuators B, Chem., vol. 128, no. 1, pp. 286–292, Dec. 2007. [Google Scholar]
- [46].Lähdesmäki I., Lewenstam A., and Ivaska A., “A polypyrrole-based amperometric ammonia sensor,” Talanta, vol. 43, pp. 125–134, Jan. 1996. [DOI] [PubMed] [Google Scholar]
- [47].Ji X., Banks C. E., Silvester D. S., Aldous L., Hardacre C., and Compton R. G., “Electrochemical ammonia gas sensing in nonaqueous systems: A comparison of propylene carbonate with room temperature ionic liquids,” Electroanal., Int. J. Devoted Fundam. Practical Aspects Electroanal., vol. 19, no. 21, pp. 2194–2201, 2007. [Google Scholar]
- [48].Toda K., Li J., and Dasgupta P. K., “Measurement of ammonia in human breath with a liquid-film conductivity sensor,” Anal. Chem., vol. 78, pp. 7284–7291, Oct. 2006. [DOI] [PubMed] [Google Scholar]
- [49].(Jul. 2007). Analysis of Urine With ‘Dipstick’ Strips—Manufacturer’s Specifications. [Online]. Available: http://craigmedical.com/urine_diagnostics.htm
- [50].Kaplan A. K. and Pesce A. J. E., Clinical Chemistry: Theory, Analysis, Correlation. Maryland Heights, MO, USA: Mosby, Inc., 1989. [Google Scholar]
- [51].PrecisionLabs. Ammonia Test Strips. Accessed: Feb. 4, 2017. [Online]. Available: https://preclaboratories.com/product/ammonia-test-strips/
- [52].Jia H.-X., Wang S.-L., Xu Z.-R., and Fang Z.-L., “A microfluidic chip-based flow injection system with gas diffusion separation and photometric detection,” Chem. J. Chin. Universities, vol. 27, no. 9, pp. 1621–1625, 2006. [Google Scholar]
- [53].Haynes W. M., CRC Handbook of Chemistry and Physics, 95th ed. Boca Raton, FL, USA: CRC Press, 2014. [Google Scholar]
- [54].Weiner I. D. and Verlander J. W., “Renal ammonia metabolism and transport,” Comprehensive Physiol., vol. 3, pp. 201–220, Jan. 2013. [DOI] [PMC free article] [PubMed] [Google Scholar]
- [55].Kugel J. F. and Goodrich J. A., Binding and Kinetics for Molecular biologists. Cold Spring Harbor, NY, USA: CSHL Press, 2006. [Google Scholar]
- [56].Lukacz E. S., Whitcomb E. L., Lawrence J. M., Nager C. W., and Luber K. M., “Urinary frequency in community-dwelling women: What is normal?” Amer. J. Obstetrics Gynecol., vol. 200, pp. 552.e1–552.e7, May 2009. [DOI] [PMC free article] [PubMed] [Google Scholar]
- [57].(Jul. 2008). Gold Standard Method for Analysis of Ammonium levels in Urine. [Online]. Available: http://www.biovision.com/ammonia-colorimetric-assay-kit.html
- [58].Smith D. and Španěl P., “Selected ion flow tube mass spectrometry (SIFT-MS) for on-line trace gas analysis,” Mass Spectrometry Rev., vol. 24, pp. 661–700, Sep-Oct 2005. [DOI] [PubMed] [Google Scholar]


