Abstract
Gadolinium (Gd)-based contrast agents (GBCAs) are pharmaceuticals that have been approved for 30 years and used daily in millions of patients worldwide. Their clinical benefits are indisputable. Recently, unexpected long-term presence of Gd in the brain has been reported by numerous retrospective clinical studies and confirmed in preclinical models particularly after linear GBCA (L-GBCA) compared with macrocyclic GBCA (M-GBCA). Even if no clinical consequences of Gd presence in brain tissue has been demonstrated so far, in-depth investigations on potential toxicological consequences and the fate of Gd in the body remain crucial to potentially adapt the clinical use of GBCAs, as done during the nephrogenic systemic fibrosis crisis. Preclinical models are instrumental in the understanding of the mechanism of action as well as the potential safety consequences. However, such models may be associated with risks of biases, often related to the protocol design. Selection of adequate terminology is also crucial. This review of the literature intends to summarize and critically discuss the main methodological aspects for accurate design and translational character of preclinical studies.
Key Words: gadolinium, brain, retention, preclinical, rodent, magnetic resonance imaging, contrast agent, toxicity, translational research, biodistribution
Increased signal intensity on noncontrast T1-weighted magnetic resonance imaging (MRI) scans in various healthy brain structures (notably the dentate nucleus [DN] and globus pallidus) after repeated administration of linear gadolinium (Gd)-based contrast agents (GBCAs) was first reported in early 2014.1 A number of reports, both clinical and preclinical, immediately followed this seminal article. They allowed rapid progress in the understanding of this finding. Nevertheless, until now many crucial aspects of this finding remain unanswered.2,3
On November 23, 2017, after an 18-month period of in-depth review and several expert group meetings and marketing authorization holders hearings, the European Commission endorsed European Medicines Agency (EMA)–proposed restrictions on the use of some linear GBCAs (L-GBCAs) (gadobenic acid only for liver scans and gadopentetic acid only intra-articularly for joint scans) and suspension of the marketing authorizations of other intravenous linear products (gadodiamide, gadoversetamide)4 while maintaining marketing of macrocyclic GBCAs (M-GBCAs) and gadoxetate disodium (a L-GBCA dedicated to liver imaging). Soon after, the Japanese Pharmaceuticals and Medical Devices Agency (PMDA) decided to restrict L-GBCAs as second-line agents while maintaining M-GBCAs as first-line agents.5–7 More recently, on December 19, 2017, the US Food and Drug Administration (FDA) issued a Safety Announcement recognizing officially that L-GBCAs cause more brain retention than M-GBCAs, stating that healthcare professionals should consider the retention characteristics of each compound when choosing a GBCA for patients who may be at higher risk for Gd retention (patients requiring multiple lifetime doses, pregnant women, children, and patients with inflammatory conditions). The FDA also requested radiologists to minimize repeated GBCA imaging studies whenever possible, particularly closely spaced MRI studies. The FDA–requested marketing authorization holders (Bayer AG, Bracco Imaging, GE Healthcare, Guerbet) to conduct postmarketing studies including both preclinical and clinical investigations.8
Clinical studies are the most obvious approach to address the numerous questions still unanswered, notably those related to long-term safety of repeated GBCA administration. However, it is worth underlining that almost all currently published studies followed an observational, retrospective design. A prospective design, addressing the long-term safety issues, could be ethically challenging, would not allow rapid access to results and is vulnerable to observer bias.9 The retrospective collection of clinical data may lead to uncertainty about the number of administered doses and the structural categories of GBCAs administered, leading to misclassification. The assessment of different aspects of Gd presence in the brain, such as localization and chemical forms of Gd, requires a wide range of different expertise and technical equipment to conduct often complex studies.10,11 Furthermore, potential confounding factors such as incomplete clinical history, underlying disease, follow-up duration, time elapsed between last GBCA administration, and access to clinical/biological data are hard to take into account in the interpretation of data. In addition, control groups may be lacking, and there may be heterogeneity in the field strengths, T1-weighted sequences, and methods of image acquisition.9 Definitely, this should not downgrade the crucial importance of clinical studies that have led to rapid and considerable progress in understanding the gradual appearance of increased signal intensity on unenhanced T1-weighted images (hyperintensity) and allowed to distinguish between 2 molecular classes of GBCAs administered to patients.
Preclinical studies allow the investigation of aspects that are difficult to address in humans. In the case of GBCAs, preclinical research has resulted in substantial progress in the understanding of the pathophysiology of nephrogenic systemic fibrosis (NSF).12 Therefore, as highlighted by the FDA during the Medical Imaging Drugs Advisory Committee in September 2017,13 animal studies should be employed on issues least amenable to clinical studies. This includes elemental quantification and speciation of Gd in tissue, investigation of the effect of Gd presence in the brain on neurodevelopment, dose-response, long-term follow-up studies to compare Gd concentrations in tissue before and after a period without Gd exposure, as well as studies on sensitized animal disease models. Because the observed effects in such studies such as MR enhancement or Gd tissue concentration are subtle, it is important to ensure the highest possible accuracy of the results. However, it is not the purpose of this article to implement “good laboratory practices–like” standards because this approach is not appropriate in research-oriented studies. Nevertheless, we would like to present suggestions for harmonization of the study design, terminology, and quality of results to improve comparability and translational character of preclinical studies.
What Have We Learned From Preclinical Models?
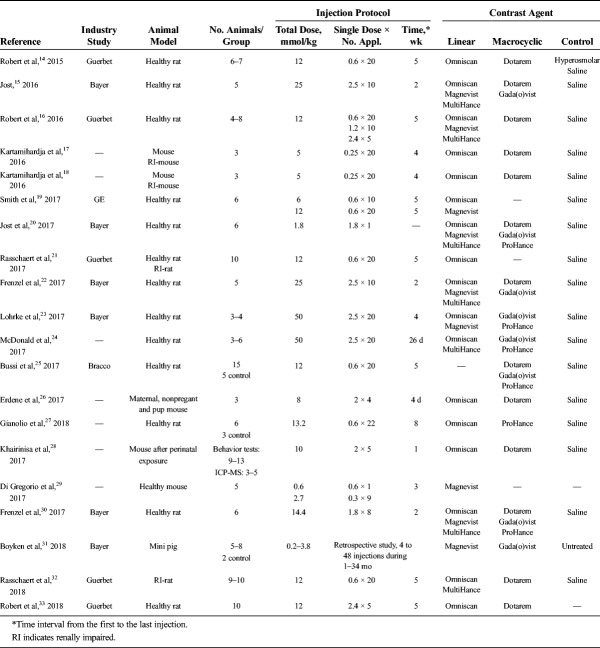
Preclinical evidence of Gd presence in the brain is based on 20 articles published in the past 3 years (Tables 1 and 2). Currently, several aspects are being investigated: How does Gd enter the brain tissue? How much Gd is present in brain? How long does it stay there, where is it located precisely in the tissue and in what molecular form(s)? What is the kinetics of elimination from brain? Are there differences between the GBCAs? Are there potential clinical consequences and differences in at-risk populations? (Fig. 1). In the following section, the current knowledge is summarized.
TABLE 1.
Literature Review: Animal Model and Injection Protocol
TABLE 2.
Literature Review: Methods for Analysis and Tissues of Interest
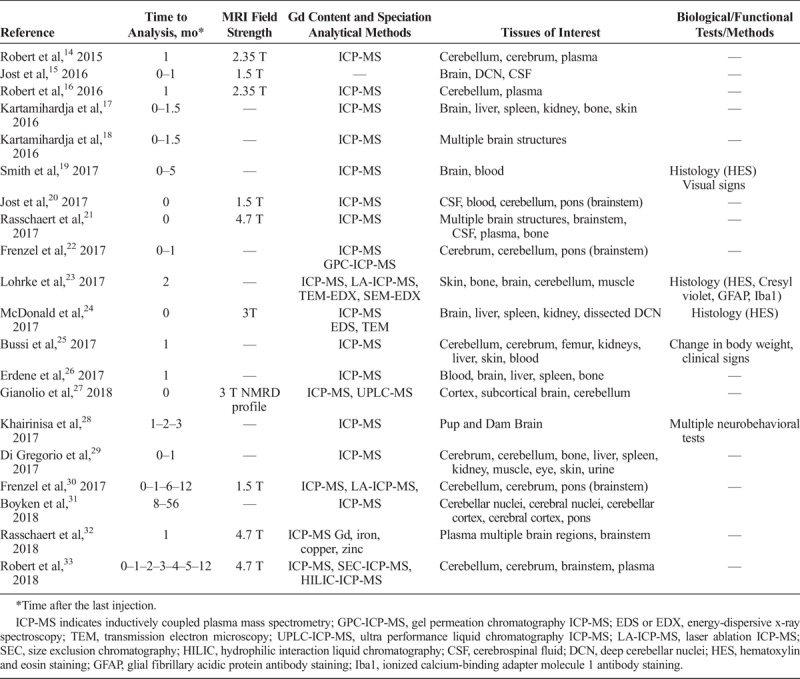
FIGURE 1.
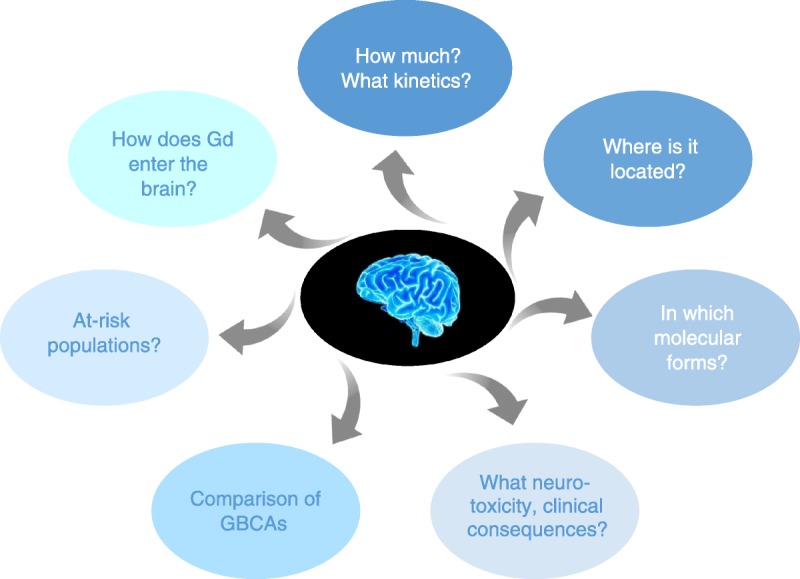
Fields of investigation.
What Do We Know?
GBCA class-effect: Differences are observed in terms of Gd presence in the brain between the less-stable GBCAs and the most-stable GBCAs, according to their thermodynamic and kinetic profiles,34 as already observed with NSF. Linear GBCAs leave more residual total Gd in the brain than macrocyclic GBCAs.14–18,21–24,26–28,32,33,35
Route of Gd into the brain: All GBCAs appear in the cerebrospinal fluid (CSF) within a few minutes after an intravenous injection, by crossing the blood/CSF barrier.20,21
Elimination kinetics of Gd/GBCAs: An elimination or “wash-out” process from the brain exists, which is slow compared with the normal renal excretion of the bulk amount of injected GBCAs, which occurs in the order of hours. Recent data from healthy rats with a 1-year follow-up after multiple injections demonstrated that this process is much more efficient for M-GBCAs than for L-GBCAs. The elimination continues up to at least 1 year for M-GBCAs, which was not observed for the L-GBCAs. A substantial fraction of Gd remained irreversibly retained in the brain after repeated administration of L-GBCAs, but not M-GBCA.30,33
Tissue distribution and subcellular localization of Gd deposits: Precise location of Gd in brain tissue has not yet been fully elucidated. However, laser ablation–inductively coupled plasma mass spectrometry (LA-ICP-MS) revealed presence of Gd not only in the deep cerebellar nuclei (DCN) but also in the granular layer of the cerebellum cortex.23 The majority of the remaining Gd fraction was found in brain regions, which are also rich in iron (DN, globus pallidus, olfactory bulbs…).32 In addition, electron microscopic studies at the subcellular level indicated clustered Gd deposits in the interstitium, the basal membrane of blood microvessels, and in glial (astrocytes) and neuronal cells as well.23,24,35
Molecular form of the residual Gd: Recent speciation studies concluded that the residual Gd found in rat brains after repeated administration of L-GBCAs exists in at least 3 distinctive forms: soluble small molecules, including the intact GBCA, soluble macromolecules, and to a large extent in insoluble species (detectable in part by transmission electron microscopy [TEM]). Conversely, Gd concentrations in the brain after administration of M-GBCAs are much lower, and the Gd could so far only be detected in a soluble small molecular form, which is slowly excreted.22,27,33
Impact of renal impairment: Preexisting mild renal impairment in animals increases the amount of Gd present in brain17,18,21,32 and T1 signal hyperintensity of deep cerebellar nuclei (DCN).21 It was also found that the presence of Gd in the central nervous system (CNS) is increased in renally impaired patients (an underlying clinical pattern common in the population that undergo MR examinations36,37).
Histology: No histopathological findings were detected in the rodent brain.19,23,24
Pregnancy: In utero transplacental Gd retention was found in pups in a mouse model.26,28 Pregnancy seems to increase Gd retention in many maternal organs (L-GBCA>>M-GBCA), but this was observed in a limited number of animals (n = 3/group)26
Behavior: In mice, Gd was transferred to pups in utero and was retained in the brain during postnatal development. A L-GBCA had a more severe effect than did a M-GBCA on neurobehavioral tests.28
What Is Unknown to Date?
Some important aspects have not yet been resolved.
What is the elimination pathway and potential role of the glymphatic system? Once in the CSF, all GBCAs most likely distribute within the brain following the glymphatic pathway.38 However, the exact mechanism of the glymphatic system and its role for or during excretion has not been established.
If so, where, and when does dechelation occur? The step in which dechelation of the L-GBCAs may occur has not yet been clearly identified.22,27 If dechelation occurs, it is currently not known where it happens and in which chemical form Gd reaches the CNS interstitium and neural cells. The role of transmetalation with endogenous metals, such as Gd-Fe transmetalation in the case of L-GBCAs, has not yet been clarified.
Which macromolecules are involved? The identity of soluble Gd-carrying macromolecules has not yet been revealed.22,27,33 The precise distribution of Gd at a cellular and subcellular level also needs to be specified, and it remains unclear whether the Gd species varies between brain location and over time.
Role of other organs (bone, skin…) in the long-term storage of Gd? The involvement of other organs of storage in the body, such as skin and bones, which could constitute a “Gd reservoir”39,40 and constitute a continuum with nephrogenic systemic fibrosis, is of interest.
Juvenile population: Potential differences of Gd storage in the juvenile population in comparison to adults.
Are there clinical consequences? If so, which? None of the many available studies in humans or animals have shown an association between the observed increased signal intensity (SI) in the brain and the occurrence of any clinical adverse events. However, potential clinical consequences of Gd long-term presence in patients remain a crucial issue to be investigated.
Terminology
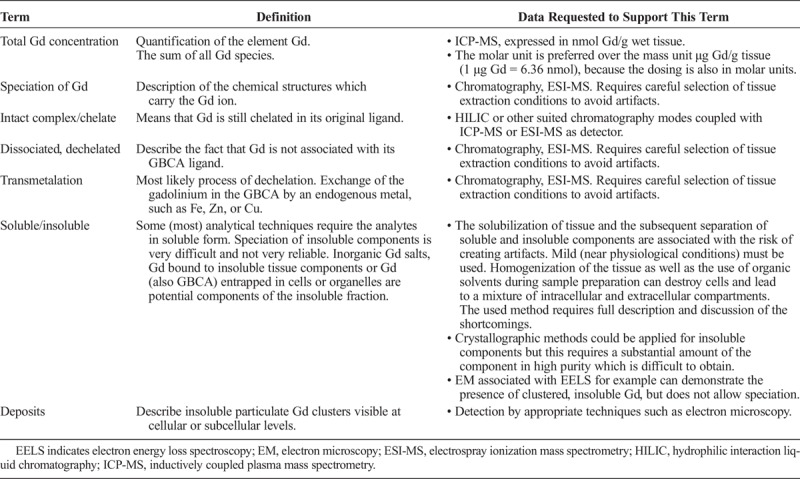
Numerous clinical and preclinical studies have demonstrated the presence of Gd in the brain after administration of GBCAs. Although these studies have investigated identical parameters, the description is not uniform and various terms have been used to describe the same phenomenon: for example, “uptake,” “accumulation,” “retention,” “storage,” or “deposition,” which may lead to misunderstandings. To achieve a uniform and seamless communication, we propose specific definitions for those terms that are frequently used in the literature (Tables 3, 4 and 5).
TABLE 3.
Recommendations for Terminology: General
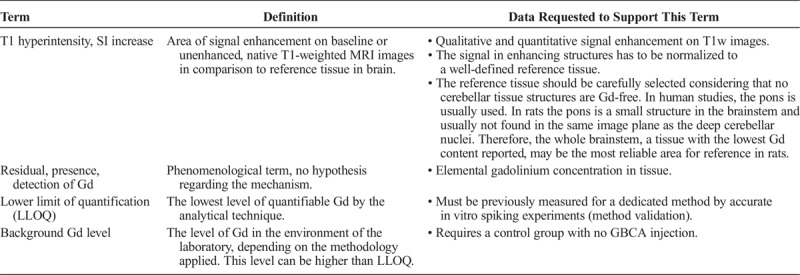
TABLE 4.
Recommendations for Terminology: Kinetics
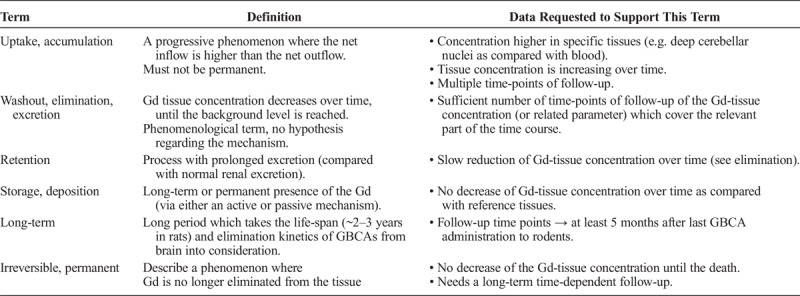
TABLE 5.
Recommendations for Terminology: Chemical Form
General
The initial finding in native or baseline T1-weighted MRI scans was increased signal intensity in some brain areas compared with a reference tissue or compared with earlier images of the same patient. This is called hyperintensity.
We propose to use the terms “presence,” “residual Gd,” or “detection of Gd” in a general way without the intention of pointing to any mechanistic hypotheses. The presence of Gd can only be detected unambiguously by methods that identify the element Gd. The occurrence of a T1 hyperintensity in MRI is only indicative for Gd presence, because signal intensity changes can also be caused by other metals, pathological, or age-related changes in tissue composition. Because Gd is present in tissue only at very low levels, the method for quantification of Gd, usually ICP-MS, requires validation to obtain the lower limit of quantification (LLOQ). The background of Gd in the respective laboratory environment is also a crucial parameter that needs to be determined, for example, by including a saline-treated control group in the study design. Thus, except if specified on its molecular status, Gd should be considered as total Gd in the tissue of interest.
Kinetics
Gadolinium presence in the brain is a time-dependent phenomenon, which can be described with kinetic parameters. The terms “uptake” and “accumulation” both describe an increasing Gd-tissue concentration over time, be it an active and specific process or a nonspecific progressive effect. “Washout,” “elimination,” or “excretion” are used equally for the constant removal of Gd from tissue over time. “Retention” describes the persistence of Gd for a longer time than would be predicted from the acute time course of Gd excretion. The terms “storage” and “deposition” should be used if the Gd remains in the tissue for a very long time, with respect to the life-span of the animal, or irreversibly or permanently.
Timing Between the Last Injection and Sampling
An important parameter of all studies when interpreting data is the time interval between the GBCA injection(s) and the sampling of the tissue before its analysis, also called “Gd-free period.” Data obtained from studies with numerous different time intervals, from several days24 to 1 year,30,33 have been reported. If not properly addressed, this can lead to contradictory or misleading conclusions and hence to difficulties in reaching a consensus within the community about the time course of the excretion from brain tissue.
The time frame of such time intervals can consider different aspects. The excretion half-lives of GBCAs in plasma is 20 minutes in rats and 90 minutes in humans41 and the elimination from brain tissue is significantly slower. In one rat study, when evaluated at early time points, close to the last injection, significant elimination for all GBCAs was observed between days 3 and 24.22 Supporting the importance of long-term follow-up and time-point selection, in other studies with longer time intervals between injection and sampling, slow continuous and nearly complete elimination of the M-GBCAs was observed during the first 4 months, whereas the L-GBCA were retained and no longer excreted after 5 to 6 months.30,33 We propose to use “long-term” to reflect an interval of at least 5 months in rodent species.
Speciation of Gd
Initially, the Gd tissue concentrations were determined by ICP-MS measurements. This technique provides the total Gd concentration, but does not provide any information about the chemical form of the element. Speciation, according to the definition by the International Union of Pure and Applied Chemistry (IUPAC), is the distribution of an element among defined chemical species in a system.42 Several studies have demonstrated that Gd can be present in the brain in at least 3 distinctive forms22,27,33: soluble small molecules, including the intact chelate GBCA, soluble macromolecules, and to a large extent in an insoluble fraction. The process called transmetalation refers to the transfer of the Gd ion to another endogenous ligand, by the replacement of another endogenous metal ion such as Fe, Cu, Zn, and so on.43 This means that the Gd is removed from the ligand of the GBCA, which is also called dissociation, dechelation, or release of Gd and results in new Gd-containing molecules. The term “deposits” describes insoluble particulate Gd clusters visible at cellular or subcellular levels by appropriate techniques such as electron microscopy. Several different Gd species can be present simultaneously in the brain. Strategies to investigate the speciation of Gd will be discussed in more detail in a specific section (see bioanalytical methods section).
METHODOLOGICAL ASPECTS AND RECOMMENDATIONS FOR PRECLINICAL STUDIES
Animal Models and Their Translational Relevance
Indeed, preclinical studies play a pivotal role in biomedical research and have provided crucial benefits to human health care. In the current topic, preclinical studies are essential to assess the potential risk associated with repeated administration of GBCAs and to better understand the mechanism of brain T1 signal hyperintensity and the long-term fate of the Gd retained in brain tissue.
Compared with clinical trials, the main advantages of preclinical models are their prospective nature and homogeneity: subjects share the same controlled genetic background, living environment, and study parameters. Thus, many factors potentially generating bias are well controlled or can be avoided. Studies may include one or several matched control groups. The number of subjects is not limited by a potentially poor recruitment rate as observed in clinical trials or availability of postmortem tissues. Furthermore, sample collection and access to tissue is straight forward, allowing simultaneous investigation of numerous in vivo and ex vivo parameters.
The objective of an appropriate animal model is to obtain a predictive model of human outcomes. Of course, interspecies differences are unavoidable. They include body surface area, biological cycles, brain anatomy, and metabolic disposition of xenobiotics, to mention the most relevant. One example is the species-related difference in hepatobiliary elimination of gadobenate, which is approximately 50% in rats, whereas it is only 3% to 5% in humans.44
Health authorities require, for preclinical studies, that toxicological testing strictly follows guidelines, such as the guideline M3 (R2), issued by the International Conference on Harmonization. These studies must be performed in 2 mammalian species, 1 rodent and 1 nonrodent. Usually, rats are selected as the rodent species, and dogs, or possibly nonhuman primates, are the species of choice for the nonrodent toxicology studies. Although preclinical research is not required to follow Good Laboratory Practices regulations or International Conference on Harmonization guidelines, both mice and rats species are widely used in pharmacological and toxicological research, including neurobehavioral tests. Rats are the most used species in preclinical studies on the current topic and have several advantages:
a) Data from NSF studies on the presence of Gd in tissues in rats have been acquired in the past and were found to have many similarities with the clinical situations.12
b) Rat models are considered translational with respect to the study of neurological deficits (akinesia, tremor, postural deficits, and dyskinesia).45,46
c) Rodents are easier to manipulate, much less expensive, and more readily available than nonrodents species, such as dogs, pigs, or nonhuman primates. They allow sampling of brain, dissection, and in-depth analysis of various brain structures at the completion of the study, as well as histopathological investigations. However, due to their size (especially for mice), it can be more difficult to access small brain structures.
d) Rodents have a short gestation period and a short life-span, enabling investigations of long-term consequences of GBCA exposure. However, the differences in the scaling factors of kinetic processes between rat and human (pharmacokinetics, life-span) may make translation of the results difficult.
e) The sequence of key events in brain maturation is largely consistent between humans and rodents.47
f) Nonhuman primates are, of course, the species of choice for neurobehavioral studies, but numerous obstacles, including ethical issues, availability and cost, limit their use. Animal protection laws require the use of animals of the lowest development level whenever possible, which precludes the use of nonhuman primates for most studies.
Another advantage to using rodents is that rats are an excellent and highly translational model, notably for MRI. It is worth noting that the T1 hyperintensity reported in patients repeatedly treated with L-GBCAs was also found in rats after repeated injection of L-GBCAs in the corresponding anatomical structure (deep cerebellar nuclei). The only difference compared with clinical observations was that, in rats, the lateral nucleus (corresponding to the human DN) could not be distinguished from the other deep cerebellar nuclei that also showed a T1 hyperintensity (Fig. 2).
FIGURE 2.
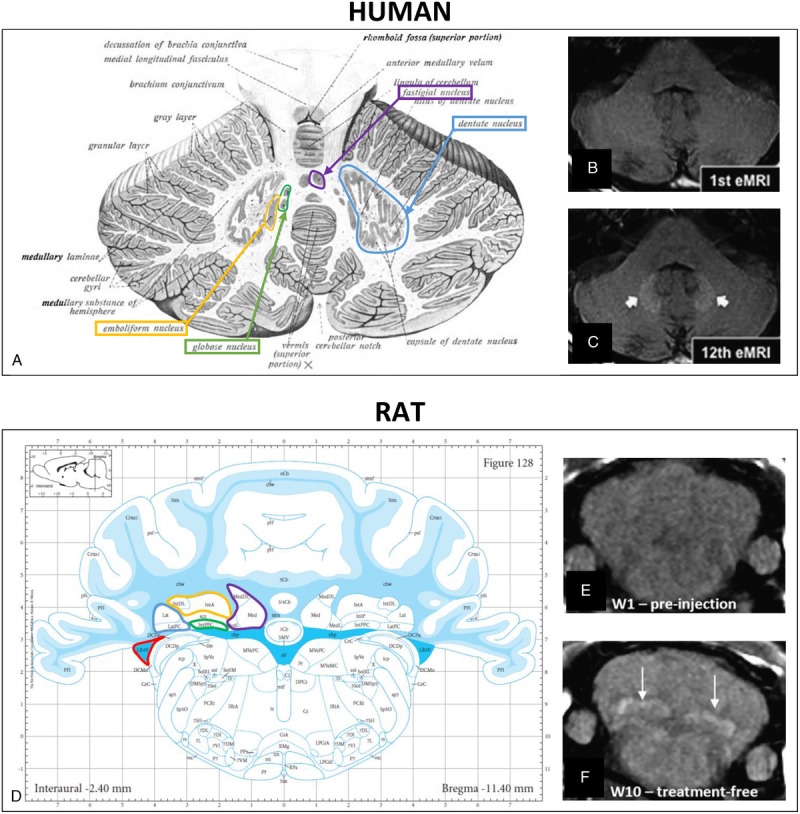
T1 hyperintensity before and after repeated L-GBCA injections in the DN in human (B and C, Errante et al48) and in all deep cerebellar nuclei in rat (E and F, Robert et al16). Schematic representation of individual deep cerebellar nuclei in human (A, Sobotta49) and rat (D, Paxinos and Watson50; Copyright Elsevier Inc, with permission): blue, DN (human) or lateral nucleus (rat); orange, emboliform nucleus (human) or anterior interposed nucleus (rat); green, globose nucleus (human) or posterior interposed nucleus (rat); and purple, fastigial nucleus (human) or medial nucleus (rat). Note that the lateral recess of the fourth ventricle (red) is located very close to the DCN and is sometimes misleadingly allocated to the DCN.
Hemodialysis patients receiving L-GBCAs have greater DN signal increases on unenhanced T1-weighted images than age/sex-matched patients.51 A strictly similar effect was reported in renally impaired rats repeatedly treated with the L-GBCA gadodiamide,21,32 thus suggesting the translational value of the preclinical model to address issues related to a large population exposed to GBCAs.
Another example of a good translation between preclinical and clinical data refers to the distribution of GBCAs into the brain interstitium. Hyperintense CSF in the subarachnoid space has been reported on fluid-attenuated inversion recovery (FLAIR) imaging in patients who had contrast-enhanced MRI.52,53 Recently, it was shown in healthy rats that GBCAs can penetrate from blood into the CSF independently of their molecular structure.15,20
Gadolinium distribution among cerebral and cerebellar structures is also similar in rodents, minipigs, and humans, and generally corresponds to structures also containing higher iron concentrations.32,54 However, Gd concentrations found in postmortem tissues of patients are sometimes much higher compared with Gd concentrations in animal models, even after repeated injections of high GBCA doses and after short wash-out in animal models.10,16,22,55 This discrepancy has not yet been explained.
Finally, despite some well-known limitations, rodents seem to be an appropriate species to investigate effects on GBCA exposure. Studying populations potentially at-risk in rodents such as renally impaired rats or juvenile rats is useful and results can generally be translated to the human species.
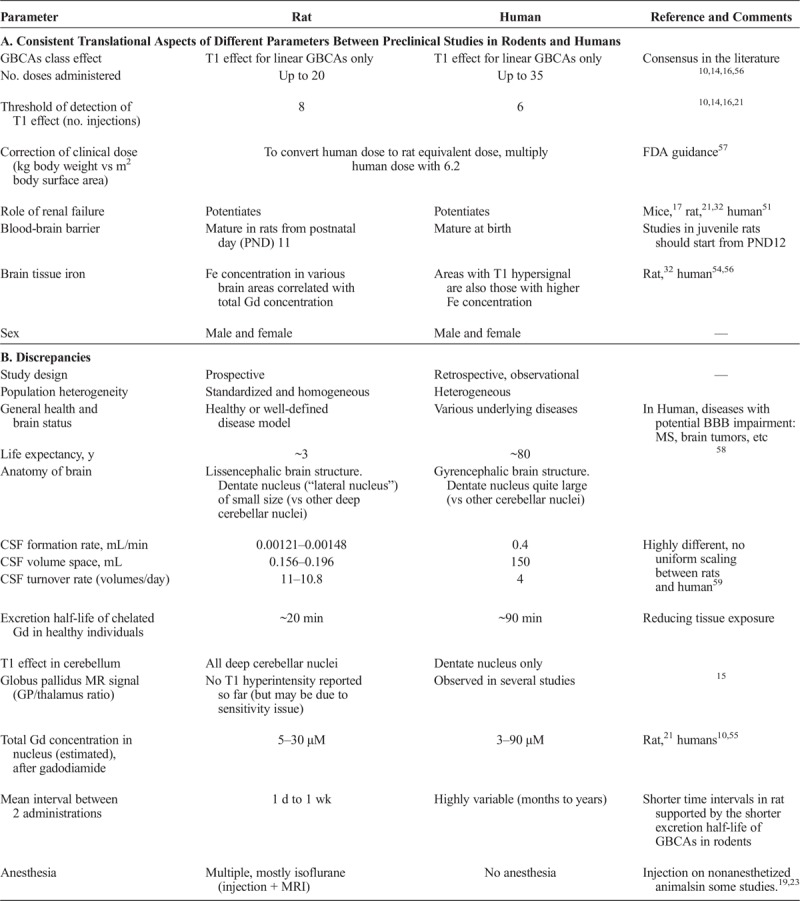
The pros and cons of preclinical studies are summarized in Table 6.
TABLE 6.
Consistencies (A) and Discrepencies (B) Supporting Preclinical Studies in Rodents
Group Size—Statistics
To obtain reliable and reproducible results, the animal studies and also the analytical techniques used must comply with some fundamental requirements. All studies have to deal with scatter in their data, which is due to the biological variability, insufficiencies in the technical performance of the study, and the inaccuracy of analytical methods.60 The scientific goal determines the study design including the degree these uncertainties need to be controlled. Studies that are conducted in an early research phases as, for example, Gd presence in the brain, usually have an exploratory character and try to establish new insights and knowledge. At this level, a precise description of the results including all limitations is usually more adequate than a sophisticated statistical analysis. This approach also holds true as regards histopathological studies (including electron microscopy). A larger degree of uncertainty is acceptable for such exploratory studies, and it may require several of them to create hypotheses that can then be the basis for confirmatory studies. Nonetheless, it is important to identify all important sources of variability during the planning of the study and to implement suitable measures or controls to compensate these variabilities. Because experimental animal studies are prospective, controls are much easier to implement than in retrospective, observational human studies. The quality of the results depends on the quality of the protocol, which includes the quality of the analytical results, the data evaluation, and the appropriate statistical methods. The basis for estimating the necessary number of animals and control groups includes an understanding of the variability of the expected data (distribution, standard deviation) and the expected difference between the groups (effect size). From a statistical point of view, an experiment should be planned in a way that probability α for a type I error (accepting the null hypothesis although it is not true, that is, saying there is no effect although there is one) is 5% or less and probability β of a type II error (rejecting the null hypothesis although it is true, that is, saying there is an effect although there is none) is 20% or less. This results in a statistical power of the test, 1-β, of 80% or more, which is generally regarded as acceptable for animal experiments investigating drug efficacy.61
A study where the expected results with a Gaussian distribution have a low standard deviation and the differences between the groups are large with respect to the standard deviation (eg, the Gd concentration in brain tissue measured by ICP-MS, a well-validated, precise, and accurate method) requires fewer animals per group than a study with a higher variability of the results and where the differences between the groups are small (eg, MRI study to determine the change in the signal intensity ratio between the deep cerebellar nuclei and the brain stem, which are often only a few percent). For behavioral studies, where the potential influence of the Gd presence in the brain shall be assessed and which is also expected to be small, if existing at all, a large number of animals must also be employed to achieve the necessary test power. To prove the absence of such effects may actually be impossible in an animal study with a reasonable effort. It must be taken into consideration that animal welfare and the respective protection laws prohibit animal studies unless the goal cannot be reached by other means, and such studies reduce the number of animals to an absolute minimum and are scientifically indispensable, reasonable, and justified from an ethical point of view.62
Blinding/Randomization and Control Group Selection
The choice of appropriate control group(s) is crucial and is predetermined by the purpose of the study. In the control group, all subjects must be manipulated in a strictly similar manner (sex, age, food, living environment, same manipulation including blank injection [saline] and sample processing, exposure to anesthetics) to obtain exact reference conditions. For determination of the total Gd concentration or for speciation studies, a control group is necessary to identify potential contaminations or artifacts during sample processing. However, for detection of a T1 signal hyperintensity, for histological analysis, dosing of endogenous molecules, or for behavioral tests, a saline control group is mandatory to obtain reliable results.
Performing the study in a blinded way is important, to avoid attention or observation bias in behavioral tests. However, blinding is not always desirable if the risk of cross-contamination exists between groups: in a completely blinded experiment, animals from different groups would be housed in the same cages, which causes possible cross-contamination and leads to a bias in the measurement of tissue Gd concentration and Gd species (see also bioanalysis chapter).
Animals should be randomized for the group allocation to prevent bias from stress of the animals, linked to their order of passage, or habituation of the experimenter to a measurement along the day, or in terms of circadian bias, for instance in neurobehavioral studies. Regarding MRI studies (qualitative and quantitative evaluations), animals should be randomized for both the test-group and the imaging time point.
Sometimes, in the case of observational and qualitative parameters of a behavioral examination, it is recommended to include an additional untreated control group, unblinded. For instance, the Functional Observational Battery/Modified-Irwin Test implies a qualitative scoring of inherent behavior of the rodents (excitation, response to stimulus…), and an unblinded healthy control group is of great help to constitute a basal reference of normal behavior.
In addition, for specific pathological models, a healthy control group is usually recommended (based on the study purpose).
It is taken for granted that, to reduce the number of animals for ethical reasons, it may be wise to investigate an important number of parameters and groups in a same study, provided it does not lead to interparameter interferences. For example, Gd-speciation studies may be performed on deep cerebellar nuclei (DCN) from 1 hemisphere and histology investigations on the contralateral DCN.
Dosing Scheme
T1 hypersignal induction was observed after repeated administrations of GBCAs. The number and frequency of the administrations as well as the dosage is highly variable from one study to another. The repetition of injections of the clinical dose, adapted to the body surface area according to the FDA recommendations57 (human dose in mmol/kg × 6.2 in rats, for example), is sometimes simplified, to achieve the same cumulative dose in a fewer numbers of injections. For instance, 1 single dose of 2.4 mmol/kg of gadodiamide leads to a similar T1 hyperintensity in the rat DCN as compared with 4 daily injections of 0.6 mmol/kg over 4 days.16 However, to reproduce the clinical situation as closely as possible, repeated administrations of the maximum dose for humans (6.2 × 0.3 mmol/kg = 1.9 mmol/kg) should preferentially be used. If the study goal benefits from higher or lower doses (eg, in toxicological studies), this should be justified. The time between the administrations is highly variable in patients, and this influences the presence of that fraction of Gd that is able to be eliminated from the brain over time. The fraction of Gd permanently stored in tissues will accumulate over time, irrespective of the time interval between the injections. Therefore, it depends on the study goal to select which timing is appropriate, and this should be documented in the report. In general, 1 day between 2 injections is sufficient in healthy rats, based on the renal excretion half-life of 20 minutes in this species. Finally, also the GBCA cumulative dose depends on the aim of the study. A cumulative dose comparable to the clinical situation may be relevant to investigate the T1 effect or mechanisms of distribution and elimination. To investigate potential neurotoxicological effects for the first time, it seems appropriate to administer relatively high cumulative doses in a preliminary study (to obtain a proof of concept) and then to study lower and more clinically relevant dose ranges. With specific dosing schemes, the physicochemical properties and the injected volume should be considered.
Time Points of Measurements
The whole topic of Gd presence in the brain goes back to the observation of hyperintensities in T1 weighted MRI after repeated administration of some GBCAs.1 The investigated patients in all clinical studies received multiple GBCA administrations and MRIs with very different intermittent time intervals. Due to the retrospective character of the studies, the time intervals were dependent on the treatment and follow-up of the respective patient and were not at all standardized. The study of potential effects of repeated dosing of GBCA in animals does not only require a dosing scheme that represents the clinical situation but also an appropriate schedule for the sampling of data after administration.
A major issue to address within this topic is based on the kinetics of the elimination of Gd from brain tissue. This requires data sampling at time points after the last administration, which covers most parts of the elimination process. The number and spacing of tissue samplings must be adequate to identify the underlying kinetic process, which can be multiphasic, due to the fact that different compartments within the brain can be involved as well as several different Gd-species that can be excreted with very different rates.22 To calculate pharmacokinetic parameters, a sufficient number of sampling time points should be taken to evaluate the elimination rate. To demonstrate that, the excretion process can be very slow or is even not taking place such studies can last for 1 or 2 years, but may also require starting the sampling after a few days after administration to cover the faster excretion of soluble Gd-species (Fig. 3). Semiquantitative results can be obtained with as little as 2 sufficiently spaced data points.
FIGURE 3.
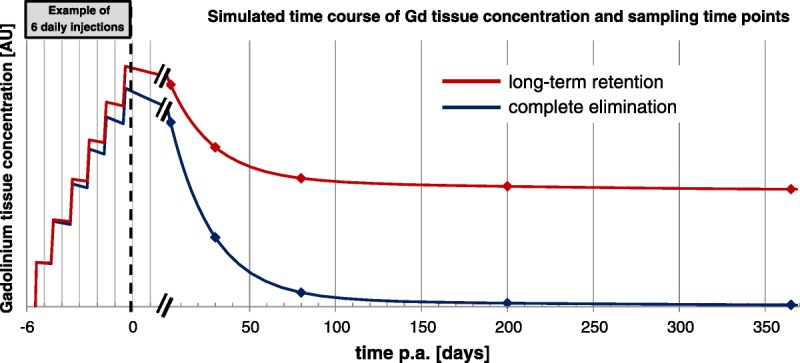
Schematic representation of elimination profiles in a long-term study. At the time of final administration, a sufficient number of sampling time points should be taken to evaluate the elimination rate.
Although ideal, it is not possible to study all aspects of Gd presence in brain tissue in such kinetic studies, because of the excessively large number of animals needed. Studies explicitly addressing specific single time points should follow certain rules to make them comparable to each other and to gather data at time points, which allows meaningful combination of the results of separate studies. To categorize the studies, a short time interval would be the period up to 4 weeks after the last administration when a large fraction of soluble Gd species is eliminated,18,22,33 and long-term studies would cover a period from at least 5 months and longer (1–2 years) to investigate the fate and possible effects of Gd species, which are poorly eliminated from the brain, if at all.30,63 The interpretation of the results of such studies must always include the specific time point and make reference to the overall elimination process if known.
Magnetic Resonance Imaging
Initial observations reported signal hyperintensities in T1-weighted MRI examinations in patients.1 As a translational imaging technique, MRI has been used to reproduce this observation in rodents.14–16,21,24,27,32,33 Brain structures known to enhance after multiple injections (DN and globus pallidus) in humans correspond to a structure in rats, which is called lateral nucleus, a very small structure less distinguishable from the other cerebellar nuclei, with which it forms the deep cerebellar nuclei (DCN in both species, Fig. 2). In rodents, all the nuclei referred as DCN are hyperintense (not only the lateral nucleus) on T1-weighted sequences after L-GBCA administrations (Fig. 2F). Investigators should systematically refer to the Rat Brain Atlas50 to assign the respective brain structures on MRI scans (Fig. 2).
Signal Detection and Sensitivity
DCN hyperintensities are visible in rodent preclinical models with T1-weighted Spin Echo or Gradient Echo sequence at magnetic fields from 1.5 T to 4.7 T,14–16,21,24,27,32,33 whereas in clinical studies, T1 hyperintensity was characterized at 1.5 T and 3 T. For rat brain imaging, spatial resolution must be high enough to clearly distinguish DCN, which are quite small in rats (3 × 1 × 1 mm3, Paxinos and Watson50). Therefore, the relatively low resolution of clinical MRI scanners is a limiting factor in small animal research. Submillimeter voxels (eg, 156 × 156 × 800 μm3,14,16 300 × 300 × 800 μm3,15 164 × 164 × 700 μm3 21) are necessary to limit partial volume effects, which would mask the T1 hyperintensity of the small DCN, and to allow accurate positioning of regions of interest (ROI). The pulse sequences used have to be optimized for small animals.
Longitudinal relaxivities of GBCAs (r1 in mM−1·s−1) are in the range of 3–4 mM−1·s−1 at 1.5 T.64 The typical concentration found in the DCN in the first month after repeated administration of gadodiamide is approximately 5–30 nmol/g (~5–30 μM assuming that 1g of tissue is close to 1 mL),21,24,32 which is in the range of the lower limit of detection of MRI.65,66
The measured Gd concentration is close to the detection limit for GBCAs in MRI and therefore the observed hyperintensity is probably also due to other Gd species. Some Gd species in the brain are expected to have an increased r1 due to interactions with endogenous macromolecules (not yet characterized, see “Tissue Gd and its speciation” section). This effect of relaxivity is most prominent at 1.0 to 1.5 T and decreases very quickly with increasing magnetic field, according to the nuclear magnetic relaxation dispersion profile.27 This suggests that MRI at field strengths, approximately 1.5 T, is particularly sensitive to the presence of macromolecular Gd species that originate from less stable L-GBCAs. In addition, if the presence of these macromolecular Gd species within the DCN is the source of T1 hyperintensities, it may be less visible at higher field strength.
Signal Quantification
The signal hyperintensities of DCN can be evaluated qualitatively and quantitatively on T1-weighted images. Qualitative visual assessment is very sensitive because it is not influenced by background noise. A 3-point scoring scale of DCN relative to adjacent cerebellar tissue has been proposed to compare groups: 0 for no detectable T1 hyperintensity, 1 for doubtful T1 hyperintensity, and 2 for definite T1 hyperintensity. This approach is able to differentiate between GBCAs or animals with or without kidney impairment.14,16,21,32
Unlike the CT Hounsfield units, MRI signal intensity is not a quantitative parameter and depends on several technical parameters like MR sequence, coil type (sensitivity and load), and the T1-weighted measurement technique used. As a consequence, the signal in enhancing structures has to be normalized to a well-defined reference tissue to enable a comparison not only of different studies but also of different subjects within a study. This approach is used in clinical and preclinical studies and is called semiquantitative.14–16,21,24,27,32,33 The tissue of reference should be carefully selected because all cerebellar tissues contain some Gd. In human studies, the pons is usually used. In rats, the pons is a small structure in the brain stem and usually not found in the same image plane as the DCN. Therefore, the brain stem, as the tissue with the lowest Gd content reported, may be most suitable.21,33
Several studies have used quantitative R1 measurement (in s−1) with dedicated MR sequence and postprocessing.16,21,35 As in clinical studies, FLAIR sequences could be considered to investigate fluids as the CSF; and T2/T2* sequences to investigate Gd and metals effects, in the hypothesis of transmetalation mechanism.
However, the reproducibility and accuracy of these quantitative methods are under debate, because the MRI methods used are usually not validated for this purpose. To avoid bias in MRI scan evaluation blinding and randomization are mandatory.
BIOANALYTICAL METHODS
Cross-Contamination
Because Gd is present in brain tissues only at very low levels and because the analytical techniques are extremely sensitive, limitation of cross-contamination is crucial, especially for laboratories which also work with highly concentrated contrast agent solutions at the same time. Precautions such as keeping animal groups separate (to avoid cross-contamination from urine), special care during sample harvesting, and the use of separate rooms for sample workup as well as inclusion of a control group (eg, a saline group) should help to limit Gd cross-contamination and to interpret data (notion of background level of Gd). See chapter on control groups for details.
Tissue Gd and Its Speciation
Because of its high acute toxicity, Gd is necessarily injected under a chelated form and many investigations have been conducted to determine the chemical form(s) of Gd present in the brain.
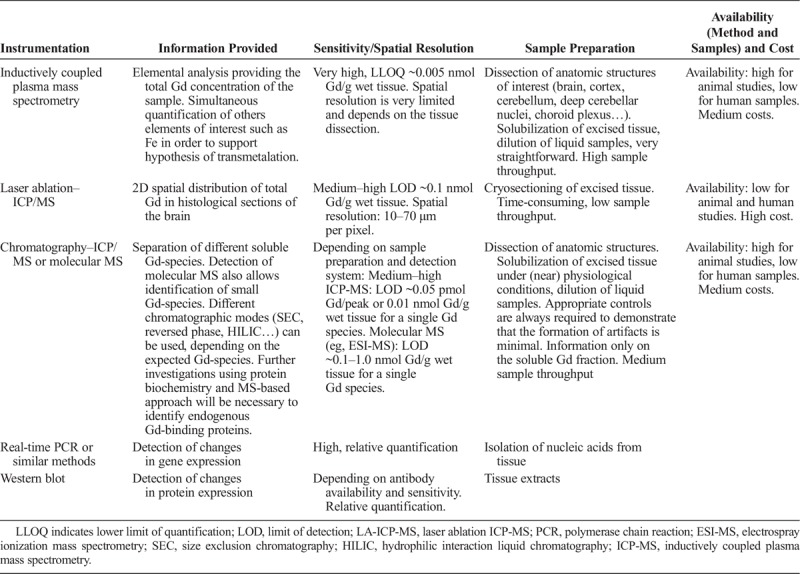
Gd speciation can be assessed in liquid biological matrices or biological extracts by the coupling of a separation technique such as chromatography with ICP-MS detection (high sensitivity for the element Gd) or ESI/MS (provides molecular information of the analyte); see Tables 7 and 8 for a general overview of the techniques most frequently used.
TABLE 7.
General Characteristics of Techniques Most Used for Speciation of Gadolinium: Nonquantitative Methods
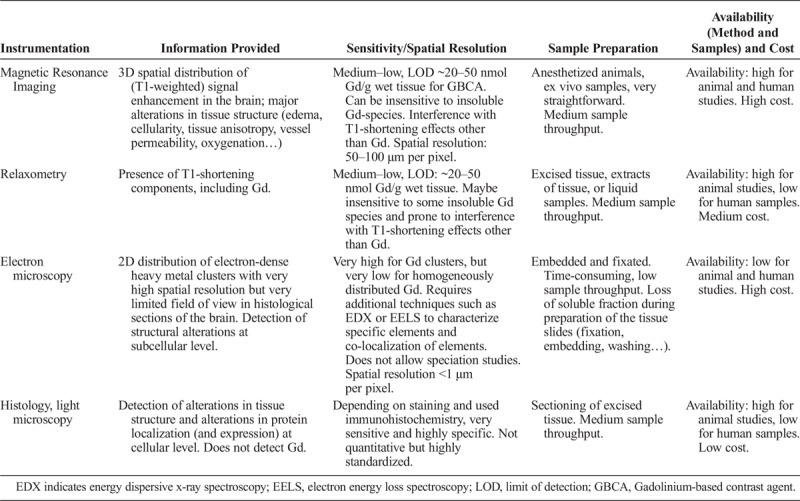
TABLE 8.
General Characteristics of Techniques Most Used for Speciation of Gadolinium: Quantitative Methods
Most speciation analyses require the analytes in soluble form. Mild tissue extraction conditions, which retain the physiological conditions, should be used to guarantee the stability of the different Gd species during the sample preparation. Appropriate controls are always required to demonstrate that the formation of artifacts is minimal, especially if more harsh extraction conditions are used (i.e., use of organic solvent). Extraction and analysis of blank matrix (tissue) spiked with a known amount of GBCAs close to the level measured in the treated animals should always be included in such studies.
Recovery of total Gd or the respective Gd species is also an important parameter to consider and to determine. Using ICP-MS detection, which provides the total Gd concentration, independently of its species (after tissue mineralization), and considering its zero background in organisms, Gd recovery can be obtained directly from the analyzed samples. In case of low extraction efficiency, information on Gd species from the extract will not cover all the Gd present in the tissue.
Several chromatographic techniques have been used so far for Gd speciation in the soluble fraction of extracted brain tissue.22,24,27,33
SEC (size exclusion chromatography, also known as gel permeation chromatography or GPC) based on separation of macromolecules according to their molecular weight allows the detection of Gd bound to macromolecules. SEC coupled to ICP-MS does not provide information about the chemical nature of the Gd-carrying macromolecules. It also does not allow to differentiate whether the intact GBCA or the transmetalated Gd3+ ion is bound to the macromolecule. Appropriate control experiments or additional experiments are required to support or disprove one or the other hypothesis. To separate highly hydrophilic GBCAs or potential small Gd-carrying metabolites (eg, Gd-citrate), HILIC (hydrophilic interaction liquid chromatography), a technique based on hydrophilic partitioning and electrostatic interaction, facilitates the separation of these highly polar or ionic analytes and at the same time allows their identification by ESI-MS or retention time. Other chromatographic techniques such as Hypercarb® are also suitable for these analytes on reversed phase-like systems.
Spatial Distribution of the Gd in Tissue
Determination of the spatial distribution of Gd in tissue sections can provide useful information on its accumulation in specific areas of interest (such as deep cerebellar nuclei, granular layer of cerebellar cortex, choroid plexus) as well as at cellular level, depending on the spatial resolution of the techniques (10–70 μm for LA-ICP-MS, 1 μm or less with synchrotron and electron microscopy). Depending on the sample preparation (sections of frozen tissue or formalin-fixed, paraffin-embedded [FFPE] tissue), and on the detection method used, either the total Gd (LA-ICP-MS) or only a fraction of the Gd (insoluble Gd, clusters of Gd in most other cases) will be detected. Although these techniques allows the detection of colocalized other elements, such as Ca, P, or other metals, they only provide elemental information for Gd and do not allow speciation.
Techniques with very high spatial resolution such as Transmission Electron Microscopy and Energy Dispersive X-ray spectrometry (TEM-EDX) are useful for understanding the distribution pathways of Gd in the brain. Thus, with the demonstration of the presence of Gd in the wall of brain microvessels, GBCAs may not have passed the intact BBB but instead penetrated the brain tissue via the CSF through the choroid plexus and subsequently be distributed into the healthy CNS tissue via the glymphatic system.67
To summarize, Gd can be present in the brain, not only in areas associated with T1 hyperintensity in MRI, such as deep cerebellar nuclei, but also in additional brain regions such as the granular layer of the cerebellar cortex after injections of GBCAs. More studies are necessary to identify the different Gd-species that can be present in the brain. Full coverage by a single technique is not possible, and it will require a combination of different strategies, from tissue extracts to imaging on tissue section such as proposed in a general review.68 Limitations of each protocol, due to either the sample preparation (incomplete extraction or loss of soluble fraction during the preparation of the tissue sections) or the detection mode (elemental or molecular information) should be taken into account in the discussion of the results.
With L-GBCA, some Gd is detected as soluble Gd bound to at least 1 class of macromolecules. The nature of the macromolecule(s) is currently unknown. More investigations including protein biochemistry and mass spectrometry to identify endogenous Gd-binding macromolecules are still required to answer this question. It can be anticipated that elucidation of the nature of these molecules will guide research on putative neurotoxic consequences of Gd presence in brain tissue. It may also allow to better understand the cause of the long-term T1 effect, suspected to be related to the reduced rotational mobility of a Gd-associated macromolecular species.27
Lastly, the use of imaging techniques with high resolution will be a major help to elucidate the distribution pathways of Gd in the brain.
Histological Evaluation of Brain Tissue
Histological evaluation of the brain in rodent models and human postmortem tissue primarily addresses biological alterations identified by other methods, for example, hyperintense regions in MRI67 or Gd presence in specific brain regions.23 To obtain tissue sections with high morphological preservation, rat brains should be carefully collected to minimize structural artifacts after exsanguination, buffer-perfusion, and fixation or postfixation by immersion.69 Postfixation appears adequate during general toxicity studies, but perfusion fixation provides an optimal tissue preservation for neurotoxicity studies.70 Neutral buffered 10% formalin followed by paraffin embedding is most efficient for routine analysis. However, cryosectioned material is preferable for some stains (eg, immunochemistry, silver degeneration). Guidelines for organ sampling and trimming in rodents toxicity studies have been published.71
General staining methods such as hematoxylin and eosin stain (HES) can serve as a first overall evaluation of the tissue to detect gross alterations. However, HES is known to have limited sensitivity in detecting possibly subtle changes associated with potential Gd/GBCA-induced neurotoxicity.72 Therefore, specific stains or immunohistochemistry are helpful to detect specific markers. Inflammation is associated with microglia (ionized calcium binding adaptor molecule 1, Iba1), activated microglia (CD68/ED-1), and astrocytes (glial fibrillary acidic protein, GFAP, a sensitive biomarker that labels most reactive astrocytes that respond to CNS injuries)73 (Fig. 4). Selection of the stains is best left at the discretion of the pathologist. A well-described qualitative histological evaluation is usually sufficient but becomes most effective when combined with digital image analysis and quantification,74 for example, quantification of the astrocyte marker GFAP to evaluate reactive astrocytosis.72,75
FIGURE 4.
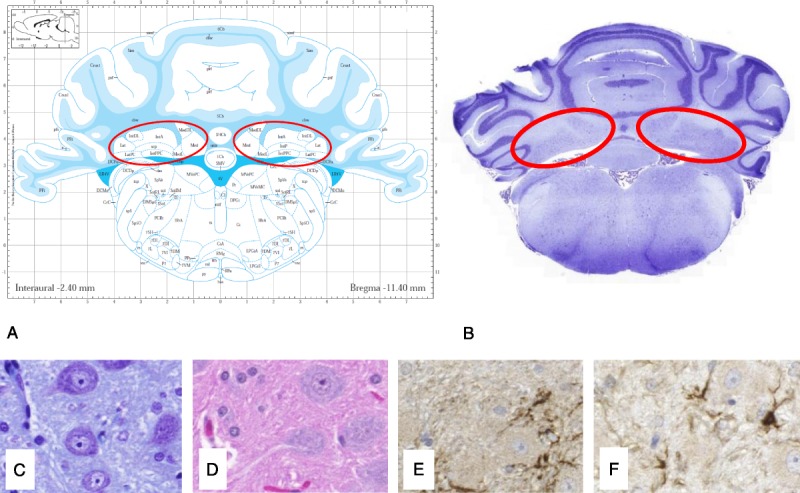
Histological examination of parallel slices (4–6 μm, formalin-fixed paraffin-embedded, FFPE) of a rat brain in the region of the deep cerebellar nuclei (DCN, in red) using different staining procedures: HES (B and C), Nissl Stain with cresyl violet (D), immunohistochemistry for astrocytes with glial fibrillary acidic protein, GFAP (E), and microglia cells with ionized calcium-binding adaptor molecule 1, Iba1 (F) (From Lohrke et al23). The full slice (B) is compared with the correct position in a rat atlas (A, Paxinos and Watson,50 Copyrights Elsevier Inc, with permission).
It is very important that the analyzed brain regions, independent of the method used (histological staining, laser ablation or MRI), are aligned and compared with standard anatomical data sets or literature to precisely confirm their localization50,76 (Figs. 2 and 4).
Pathologist blinding should be avoided23,72 when there is no a priori defined spectrum of lesions, a situation that applies to administration of GBCAs. In blinded studies, only changes considered to be clearly outside of a reference range can be recorded, an approach that would reduce the sensitivity of the pathological study.77
Neurobehavioral Preclinical Models
Obviously, it is crucial to investigate the neurobehavioral safety of repeated administrations of GBCAs. One advantage of preclinical models is that, unlike for many patients referred for neuroradiological procedures, they are devoid of background neurological or cognitive diseases that may interfere with the identification of abnormal signs.
Thus, harmonization and well-controlled studies are essential prerequisites for the investigation of predictive animal models in many fields of neurological or cognitive diseases. These studies provide deeper insight into the complex pathological processes involved, and help to circumvent artifacts due to comorbidity. However, any translational approach including, but not limited to, modeling Gd presence in certain brain nuclei, requires dedicated neurobehavioral screening systems to provide reliable readouts and to fill the gap between bench and bedside.78
Overall, hypothesis-free or hypothesis-driven experiments are 2 possible approaches for the design of neurobehavioral studies.79 The importance of a rational strategy in the design, composition, and evaluation of behavioral test batteries needs to be emphasized and will represent to a large extent the “state-of-the-art” in classic phenotyping.80
For conducting the experimental neurobehavioral screening, the following recommendations for a comprehensive classical phenotyping approach, derived from general considerations and examples in the literature,79 should be considered:
1) Every firm conclusion based on certain differences in a specific behavioral performance must be substantiated by the proof that the experimental animal is not only healthy, but also is equipped with the corresponding sensory and motoric abilities.
2) A basic screening for physiological abnormalities should be included, even if the goal is primarily behavioral testing.
3) The screening of general health, neurological status, basic physiological parameters, as well as behavioral assessment must be conducted repeatedly, because several changes may become overt at later stages of age or of disease progression in mice and rats.
4) A behavioral phenotyping approach must be comprehensive and should not only be hypothesis-driven, but instead should be composed of a complete test battery to detect behavioral differences even in domains that are out of the scope of the hypothesis.
5) At least 2 different tasks that test similar behavioral abilities but vary in their presuming non–response-relevant requirements should be incorporated, because these requirements may differ with regard to perception, motor abilities, motivation, or stress.
6) Testing procedures should be ethologically based, that is, the right tasks have to be designed for the right species.
7) When relevant, breeding conditions (number of pups per litter, etc) must be standardized and maternal behavior screened. This needs to include handling, especially postnatal manipulation, as well as standardized or controlled environmental enrichment. In the same line, (test-) biographies of the animals must be considered as potentially interfering with the expression of a particular phenotype or its onset.
8) Social behavior and social housing as well as its implications (social rank, aggression, isolation stress, etc) must be considered, wherever applicable.
9) Apart from validation of a particular test, positive and negative controls as well as controls across different strains of animals should be included, if possible, to improve comparability with other laboratories and to validate the specific task applied.
10) Standardized operating protocols should be used or developed to increase validity and reliability.
An example for a setup of a comprehensive, hypothesis-free screening approach is given in Figure 5.
FIGURE 5.
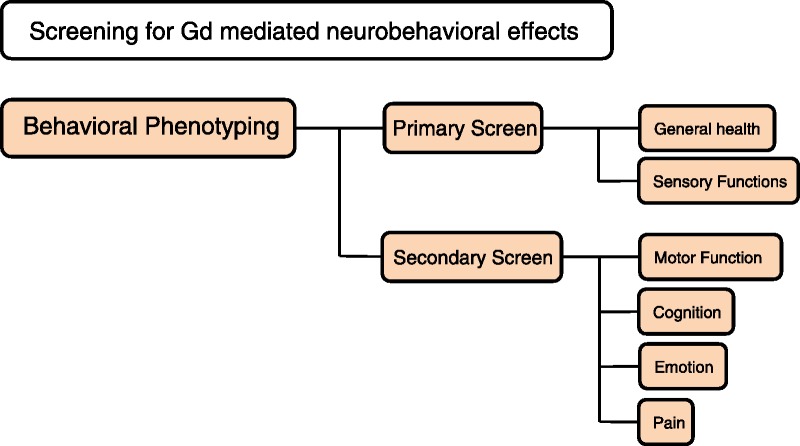
Example for a setup of a comprehensive, hypothesis-free screening of neurobehavioral status.
Blinding of the experimenter (who should ideally always be the same, at least for the same test) is crucial in neurobehavioral investigations.81 Randomization is mandatory and the various treatments should be allocated so that all test groups are housed in the same cage.81 Randomization of the order of passage of the animals to new cages is also recommended, to erase an effect based on odors or circadian rhythms.
It is crucial to perform a wide range of tests to cover the large number of neurological functions that residual Gd can potentially affect (Table 9). The modified Irwin or SHIRPA (SmithKline Beecham Harwell, Imperial College and Royal London Hospital Phenotype Assessment) tests are useful primary tests to detect gross abnormalities. Further neurobehavioral studies should distinguish at least 4 behavioral paradigms motor function, cognition, emotion, and pain with specific tests.
TABLE 9.
Examples of Behavioral Tests Often Used in Neurotoxicity Evaluations
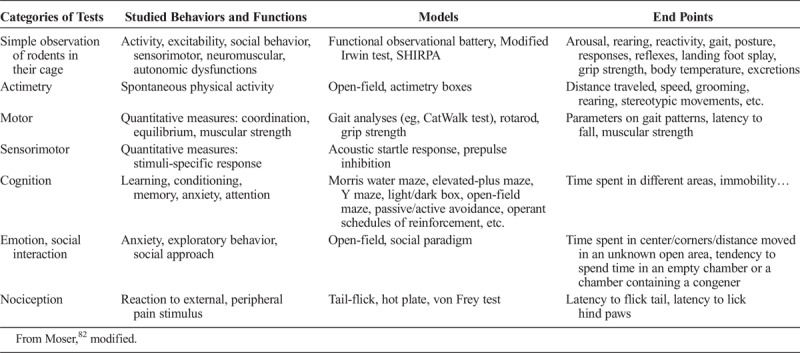
The functional tests used for neurotoxicity testing take advantage of different behavioral repertoires. These tests allow repeated evaluation of a single animal over time to determine the onset, progression, duration, and putative reversibility of a neurotoxic injury.82 However, some tests, such as the open-field test, can hardly be repeated too often and at short intervals without compromising their readout, if they lead to a habituation phenomenon. It is crucial to take into account the ethological and physiological specificities of the species studied. One obvious example is the high olfactory spectrum of rodents. Especially when the behavior measured occurs spontaneously, a great deal of attention is mandatory to ensure constant experimental conditions (time of day, room temperature, noise level, lighting, apparatus cleanliness, odors, etc) to achieve reliability.83 Maybe more than in other fields of pharmacology and toxicology, training of operators is crucial for obtaining reproducible and reliable results.
Open-field and elevated-plus maze tests are regarded as a necessary but not sufficient preliminary approach.84 Variability in experimental protocol setup and design makes it difficult to compare the results of behavioral test between studies.85 Furthermore, interference with the environment (including the experimenter) is a major issue for this model, and must be carefully taken into account. Tests can be performed with white light or red (inactinic) light, the latter mimicking the dark phase of the circadian cycle and providing more comfort to rodents. Like others, this parameter should be clearly specified, and the test should always be performed under the same conditions and in the same period of the day.
Data Interpretation and Reporting
Data interpretation is the cornerstone of the scientific method. For example, as regards the interpretation of neurobehavioral data obtained in rodents exposed to GBCAs, an anthropomorphic approach should be avoided and interpretation should be based on an in-depth ethological knowledge for the species considered, as commonly performed in the field.
Data reporting is also crucial. A knowledgeable reader can only understand and assess the relevance of published results if sufficient information has been made available on why and how presented findings have been achieved. Following certain scientific standards in performing the experimental work and in preparing the manuscript is therefore essential. This need has been identified in the scientific community and an increasing number of guidelines on proper conduct and reporting of scientific work have been published over the last 2 decades. A good overview has been collected and published by the “EQUATOR” network (http://www.equator-network.org/). One of the first and continuously updated reporting guidelines was the CONSORT statement (Consolidated Standards of Reporting Trials).86,87 Based on these guidelines for reporting clinical trials, the ARRIVE guidelines for reporting animal research have been prepared and published in consultation with scientists, statisticians, journal editors, and research funders.88
In essence, the ARRIVE guidelines provide a checklist for authors and peer reviewers of items to be included in a scientific report allowing the skilled reader to reach a useful conclusion about the efficacy of drugs or interventions being compared. In particular, what needs to be reported should include the specific hypothesis being tested, a detailed description of methods, and a comprehensive discussion of limitations of the work, biological and clinical relevance, translatability to human biology and clinics, and relation to other relevant studies. The detailed method description for animal experiments shall encompass the number of experimental and control groups, a description of the effort to minimize subjective bias, information about the experimental unit (eg, single animal or group), and randomization of group allocation, precise details of all procedures carried out (how [eg, drug formulation/dose, site/route of administration, anesthesia and analgesia, surgical procedure, method of euthanasia], when, where, why a procedure has been done), animals that have been included (species, strain, sex, developmental stage, body weight), number of animals, and how this was decided as well as details of the statistical methods used for each analysis. Especially the need for reporting a detailed description of all procedures carried out and the details of the statistical methods used (and why they have been selected) obviously applies to any scientific report, not only to animal experiments.
Over the last decade, an issue of limited reproducibility of biomedical research studies published has been identified by a number of authors.89–92 The major issues preventing reproducibility identified by this group are data dredging (ie, squeezing data sets until a “significant” result is found), omitting null results, performing underpowered studies, technical errors, underspecified methods, and weak experimental design. They could be easily avoidable by following reporting recommendations like the ARRIVE guidelines. Thus, the ARRIVE guidelines could serve as the basis for quality control by peers reviewing a preclinical manuscript and a reference guide for investigators, of course including those focusing on Gd presence in the brain and its consequences.
A minimal standard for conducting and reporting is not only recommended for original scientific work but also for the preparation of systematic reviews or meta-analysis of previously presented data. It is obvious that a shortage in selecting original publications for a review has the potential to introduce a significant bias into the author’s conclusion and thus on the overall quality of the review publication. To provide some guidance, a group of scientists, clinicians, and medical writers met in 2005 to initiate the development of preferred reporting items for systematic reviews and meta-analyses, eventually published in 2009 as the PRISMA statement.93 This statement offers excellent guidance for review preparation and should be widely acknowledged in the community to improve the general value of reports.
CONCLUSIONS
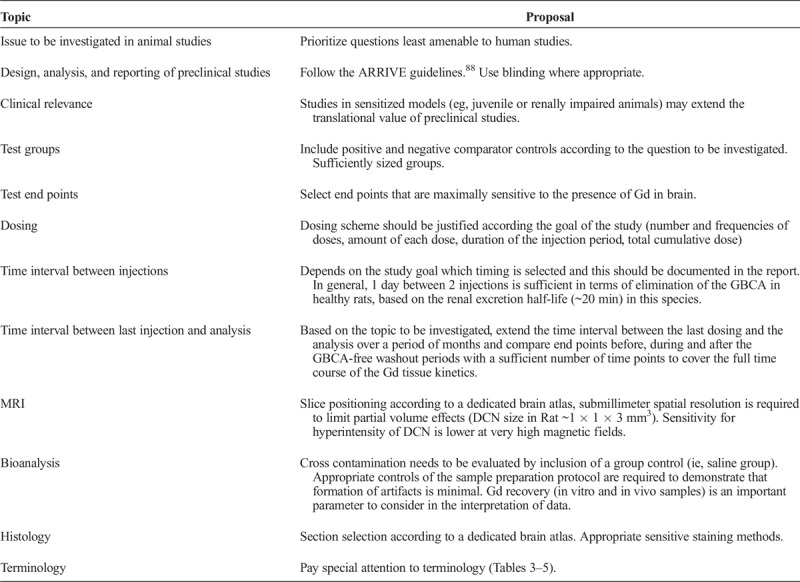
We have attempted to suggest several points for consideration for preclinical researchers involved in the pharmacotoxicology and bioanalysis of Gd presence in CNS tissues. Some are common sense and good scientific practice, others are the result of our experience. Table 10 summarizes points to consider, based on FDA recommendations13 and our own experience. Considerable progress has been made in the past 3 years as regards the understanding of Gd presence in brain (and other) tissue. Preclinical research has been pivotal in these advances. It can be anticipated that elucidation of the remaining questions will benefit from both industry and academic research.
TABLE 10.
Recommendations for Accurate Preclinical Study Design Addressing Gd Presence in the Brain
Footnotes
All authors have contributed equally to the manuscript.
REFERENCES
- 1.Kanda T, Ishii K, Kawaguchi H, et al. High signal intensity in the dentate nucleus and globus pallidus on unenhanced T1-weighted MR images: relationship with increasing cumulative dose of a gadolinium-based contrast material. Radiology. 2014;270:834–841. [DOI] [PubMed] [Google Scholar]
- 2.Runge VM. Critical questions regarding gadolinium deposition in the brain and body after injections of the gadolinium-based contrast agents, safety, and clinical recommendations in consideration of the EMA's pharmacovigilance and risk assessment committee recommendation for suspension of the marketing authorizations for 4 linear agents. Invest Radiol. 2017;52:317–323. [DOI] [PubMed] [Google Scholar]
- 3.Radbruch A, Roberts DR, Clement O, et al. Chelated or dechelated gadolinium deposition. Lancet Neurol. 2017;16:955. [DOI] [PubMed] [Google Scholar]
- 4.EMA. EMA’s final opinion confirms restrictions on use of linear gadolinium agents in body scans. November 11, 2017. Available at: http://www.ema.europa.eu/docs/en_GB/document_library/Referrals_document/gadolinium_contrast_agents_31/European_Commission_final_decision/WC500240575.pdf.
- 5.PMDA. Report on the Investigation Results, November 11, 2017. Available at: http://www.pmda.go.jp/files/000221379.pdf.
- 6.PMDA. Revision of Precautions, Gadodiamide hydrate Meglumine gadopentetate. November 28, 2017. Available at: http://www.pmda.go.jp/files/000221377.pdf 2017.
- 7.PMDA. Revision of Precautions, Gadoxetate sodium, Gadoteridol, Meglumine gadoterate, Gadobutrol. November 28, 2017. Available at: http://www.pmda.go.jp/files/000221376.pdf.
- 8.FDA. Gadolinium-based Contrast Agents (GBCAs): Drug Safety Communication - Retained in Body; New Class Warnings. Available at: https://www.fda.gov/Safety/MedWatch/SafetyInformation/SafetyAlertsforHumanMedicalProducts/ucm589580.htm.
- 9.Dekkers IA, Roos R, van der Molen AJ. Gadolinium retention after administration of contrast agents based on linear chelators and the recommendations of the European Medicines Agency. Eur Radiol. 2018;28:1579–5184. [DOI] [PubMed] [Google Scholar]
- 10.McDonald RJ, McDonald JS, Kallmes DF, et al. Intracranial gadolinium deposition after contrast-enhanced MR imaging. Radiology. 2015;275:772–782. [DOI] [PubMed] [Google Scholar]
- 11.Roberts DR, Welsh CA, LeBel DP, 2nd, et al. Distribution map of gadolinium deposition within the cerebellum following GBCA administration. Neurology. 2017;88:1206–1208. [DOI] [PMC free article] [PubMed] [Google Scholar]
- 12.Idée JM, Fretellier N, Robic C, et al. The role of gadolinium chelates in the mechanism of nephrogenic systemic fibrosis: a critical update. Crit Rev Toxicol. 2014;44:895–913. [DOI] [PubMed] [Google Scholar]
- 13.FDA. Medical Imaging Drugs Advisory Committee, September 08, 2018, Retention Following Gadolinium Based Contrast Agents MRIs: Brain and Other Organs. Available at: https://www.fda.gov/downloads/AdvisoryCommittees/CommitteesMeetingMaterials/Drugs/MedicalImagingDrugsAdvisoryCommittee/UCM577014.pdf.
- 14.Robert P, Lehericy S, Grand S, et al. T1-weighted hypersignal in the deep cerebellar nuclei after repeated administrations of gadolinium-based contrast agents in healthy rats: difference between linear and macrocyclic agents. Invest Radiol. 2015;50:473–480. [DOI] [PMC free article] [PubMed] [Google Scholar]
- 15.Jost G, Lenhard DC, Sieber MA, et al. Signal increase on unenhanced T1-weighted images in the rat brain after repeated, extended doses of gadolinium-based contrast agents: comparison of linear and macrocyclic agents. Invest Radiol. 2016;51:83–89. [DOI] [PMC free article] [PubMed] [Google Scholar]
- 16.Robert P, Violas X, Grand S, et al. Linear gadolinium-based contrast agents are associated with brain gadolinium retention in healthy rats. Invest Radiol. 2016;51:73–82. [DOI] [PMC free article] [PubMed] [Google Scholar]
- 17.Kartamihardja AA, Nakajima T, Kameo S, et al. Impact of impaired renal function on gadolinium retention after administration of gadolinium-based contrast agents in a mouse model. Invest Radiol. 2016;51:655–660. [DOI] [PubMed] [Google Scholar]
- 18.Kartamihardja AA, Nakajima T, Kameo S, et al. Distribution and clearance of retained gadolinium in the brain: differences between linear and macrocyclic gadolinium based contrast agents in a mouse model. Br J Radiol. 2016;89:20160509. [DOI] [PMC free article] [PubMed] [Google Scholar]
- 19.Smith AP, Marino M, Roberts J, et al. Clearance of gadolinium from the brain with no pathologic effect after repeated administration of gadodiamide in healthy rats: an analytical and histologic study. Radiology. 2017;282:743–751. [DOI] [PubMed] [Google Scholar]
- 20.Jost G, Frenzel T, Lohrke J, et al. Penetration and distribution of gadolinium-based contrast agents into the cerebrospinal fluid in healthy rats: a potential pathway of entry into the brain tissue. Eur Radiol. 2017;27:2877–2885. [DOI] [PMC free article] [PubMed] [Google Scholar]
- 21.Rasschaert M, Idée JM, Robert P, et al. Moderate renal failure accentuates T1 signal enhancement in the deep cerebellar nuclei of gadodiamide-treated rats. Invest Radiol. 2017;52:255–264. [DOI] [PMC free article] [PubMed] [Google Scholar]
- 22.Frenzel T, Apte C, Jost G, et al. Quantification and assessment of the chemical form of residual gadolinium in the brain after repeated administration of gadolinium-based contrast agents: comparative study in rats. Invest Radiol. 2017;52:396–404. [DOI] [PMC free article] [PubMed] [Google Scholar]
- 23.Lohrke J, Frisk AL, Frenzel T, et al. Histology and gadolinium distribution in the rodent brain after the administration of cumulative high doses of linear and macrocyclic gadolinium-based contrast agents. Invest Radiol. 2017;52:324–333. [DOI] [PMC free article] [PubMed] [Google Scholar]
- 24.McDonald RJ, McDonald JS, Dai D, et al. Comparison of gadolinium concentrations within multiple rat organs after intravenous administration of linear versus macrocyclic gadolinium chelates. Radiology. 2017;285:536–545. [DOI] [PubMed] [Google Scholar]
- 25.Bussi S, Coppo A, Botteron C, et al. Differences in gadolinium retention after repeated injections of macrocyclic MR contrast agents to rats. J Magn Reson Imaging. 2018;47:746–752. [DOI] [PMC free article] [PubMed] [Google Scholar]
- 26.Erdene K, Nakajima T, Kameo S, et al. Organ retention of gadolinium in mother and pup mice: effect of pregnancy and type of gadolinium-based contrast agents. Jpn J Radiol. 2017;35:568–573. [DOI] [PubMed] [Google Scholar]
- 27.Gianolio E, Bardini P, Arena F, et al. Gadolinium retention in the rat brain: assessment of the amounts of insoluble gadolinium-containing species and intact gadolinium complexes after repeated administration of gadolinium-based contrast agents. Radiology. 2017;285:839–849. [DOI] [PubMed] [Google Scholar]
- 28.Khairinisa MA, Takatsuru Y, Amano I, et al. The effect of perinatal gadolinium-based contrast agents on adult mice behavior. Invest Radiol. 2018;53:110–118. [DOI] [PubMed] [Google Scholar]
- 29.Di Gregorio E, Ferrauto G, Furlan C, et al. The issue of gadolinium retained in tissues: insights on the role of metal complex stability by comparing metal uptake in murine tissues upon the concomitant administration of lanthanum- and gadolinium-diethylentriamminopentaacetate. Invest Radiol. 2018;53:167–172. [DOI] [PubMed] [Google Scholar]
- 30.Frenzel T, Jost G, Lohrke J, et al. Long-term study of residual Gd in brain after repeated injection of Gd based contrast agents in rats. Invest Radiol. 2017;52:768. [DOI] [PMC free article] [PubMed] [Google Scholar]
- 31.Boyken J, Frenzel T, Lohrke J, et al. Gadolinium accumulation in the deep cerebellar nuclei and globus pallidus after exposure to linear but not macrocyclic gadolinium-based contrast agents in a retrospective pig study with high similarity to clinical conditions. Invest Radiol. 2018;53:278–285. [DOI] [PMC free article] [PubMed] [Google Scholar]
- 32.Rasschaert M, Emerit A, Fretellier N, et al. Gadolinium retention, brain T1 hyperintensity and endogenous metals—a comparative study of macrocyclic versus linear gadolinium chelates in renally sentized rats. Invest Radiol. 2018;53:328–337. [DOI] [PMC free article] [PubMed] [Google Scholar]
- 33.Robert P, Fingerhut S, Factor C, et al. One year Retention of Gadolinium in the Brain: Comparison of Gadodiamide and Gadoterate Meglumine in a Rodent Model, Radiology, In Press, 2018. [DOI] [PubMed] [Google Scholar]
- 34.Port M, Idée JM, Medina C, et al. Efficiency, thermodynamic and kinetic stability of marketed gadolinium chelates and their possible clinical consequences: a critical review. Biometals. 2008;21:469–490. [DOI] [PubMed] [Google Scholar]
- 35.Rasschaert M, Schroeder JA, Medjoubi K, et al. In Depth Characterization of Rat Cerebellar Gadolinium Deposition, by X-RAY Fluorescence, TEM-EELS and Nanosims. Barcelona: ESMRMB; 2017. [Google Scholar]
- 36.Duru OK, Vargas RB, Kermah D, et al. High prevalence of stage 3 chronic kidney disease in older adults despite normal serum creatinine. J Gen Intern Med. 2009;24:86–92. [DOI] [PMC free article] [PubMed] [Google Scholar]
- 37.Stevens LA, Viswanathan G, Weiner DE. Chronic kidney disease and end-stage renal disease in the elderly population: current prevalence, future projections, and clinical significance. Adv Chronic Kidney Dis. 2010;17:293–301. [DOI] [PMC free article] [PubMed] [Google Scholar]
- 38.Iliff JJ, Lee H, Yu M, et al. Brain-wide pathway for waste clearance captured by contrast-enhanced MRI. J Clin Invest. 2013;123:1299–1309. [DOI] [PMC free article] [PubMed] [Google Scholar]
- 39.Hirano S, Suzuki KT. Exposure, metabolism, and toxicity of rare earths and related compounds. Environ Health Perspect. 1996;104(suppl 1):85–95. [DOI] [PMC free article] [PubMed] [Google Scholar]
- 40.Lancelot E. Revisiting the pharmacokinetic profiles of gadolinium-based contrast agents: differences in long-term biodistribution and excretion. Invest Radiol. 2016;51:691–700. [DOI] [PubMed] [Google Scholar]
- 41.Aime S, Caravan P. Biodistribution of gadolinium-based contrast agents, including gadolinium deposition. J Magn Reson Imaging. 2009;30:1259–1267. [DOI] [PMC free article] [PubMed] [Google Scholar]
- 42.IUPAC. Compendium of Chemical Terminology. 2nd ed. (the “Gold Book”). Oxford, United Kingdom: Blackwell Scientific Publications; 1997. [Google Scholar]
- 43.Tweedle MF, Hagan JJ, Kumar K, et al. Reaction of gadolinium chelates with endogenously available ions. Magn Reson Imaging. 1991;9:409–415. [DOI] [PubMed] [Google Scholar]
- 44.Lorusso V, Arbughi T, Tirone P, et al. Pharmacokinetics and tissue distribution in animals of gadobenate ion, the magnetic resonance imaging contrast enhancing component of gadobenate dimeglumine 0.5 M solution for injection (MultiHance). J Comput Assist Tomogr. 1999;23(suppl 1):S181–S194. [DOI] [PubMed] [Google Scholar]
- 45.Cenci MA, Whishaw IQ, Schallert T. Animal models of neurological deficits: how relevant is the rat? Nat Rev Neurosci. 2002;3:574–579. [DOI] [PubMed] [Google Scholar]
- 46.Shah A, Garzon-Muvdi T, Mahajan R, et al. Animal models of neurological disease. Adv Exp Med Biol. 2010;671:23–40. [DOI] [PubMed] [Google Scholar]
- 47.Semple BD, Blomgren K, Gimlin K, et al. Brain development in rodents and humans: identifying benchmarks of maturation and vulnerability to injury across species. Prog Neurobiol. 2013;106–107:1–16. [DOI] [PMC free article] [PubMed] [Google Scholar]
- 48.Errante Y, Cirimele V, Mallio CA, et al. Progressive increase of T1 signal intensity of the dentate nucleus on unenhanced magnetic resonance images is associated with cumulative doses of intravenously administered gadodiamide in patients with normal renal function, suggesting dechelation. Invest Radiol. 2014;49:685–690. [DOI] [PubMed] [Google Scholar]
- 49.Sobotta J. Sobotta's Textbook and Atlas of Human Anatomy. Philadelphia, PA: WB Saunders; 1909. [Google Scholar]
- 50.Paxinos G, Watson C. The Rat Brain in Stereotaxic Coordinates. 6th edition. London, England: Elsevier Academic Press; 2007.
- 51.Cao Y, Zhang Y, Shih G, et al. Effect of renal function on gadolinium-related signal increases on unenhanced T1-weighted brain magnetic resonance imaging. Invest Radiol. 2016;51:677–682. [DOI] [PubMed] [Google Scholar]
- 52.Köhrmann M, Struffert T, Frenzel T, et al. The hyperintense acute reperfusion marker on fluid-attenuated inversion recovery magnetic resonance imaging is caused by gadolinium in the cerebrospinal fluid. Stroke. 2012;43:259–261. [DOI] [PubMed] [Google Scholar]
- 53.Morris JM, Miller GM. Increased signal in the subarachnoid space on fluid-attenuated inversion recovery imaging associated with the clearance dynamics of gadolinium chelate: a potential diagnostic pitfall. AJNR Am J Neuroradiol. 2007;28:1964–1967. [DOI] [PMC free article] [PubMed] [Google Scholar]
- 54.Hallgren B, Sourander P. The effect of age on the non-haemin iron in the human brain. J Neurochem. 1958;3:41–51. [DOI] [PubMed] [Google Scholar]
- 55.Kanda T, Fukusato T, Matsuda M, et al. Gadolinium-based contrast agent accumulates in the brain even in subjects without severe renal dysfunction: evaluation of autopsy brain specimens with inductively coupled plasma mass spectroscopy. Radiology. 2015;276:228–232. [DOI] [PubMed] [Google Scholar]
- 56.Zhang Y, Cao Y, Shih GL, et al. Extent of signal hyperintensity on unenhanced T1-weighted brain MR images after more than 35 administrations of linear gadolinium-based contrast agents. Radiology. 2017;282:516–525. [DOI] [PubMed] [Google Scholar]
- 57.FDA. Guidance for Industry: Estimating the Maximum Safe Starting Dose in Initial Clinical Trials for Therapeutics in Adult Healthy Volunteers. US Department of Health and Human Services Food and Drug Administration Center for Drug Evaluation and Research (CDER). 2005. Available at: https://www.fda.gov/downloads/drugs/guidances/ucm078932.pdf. Accessed February 5, 2018. [Google Scholar]
- 58.Sengupta P. The laboratory rat: relating its age with human's. Int J Prev Med. 2013;4:624–630. [PMC free article] [PubMed] [Google Scholar]
- 59.Johanson CE, Duncan JA, 3rd, Klinge PM, et al. Multiplicity of cerebrospinal fluid functions: new challenges in health and disease. Cerebrospinal Fluid Res. 2008;5:10. [DOI] [PMC free article] [PubMed] [Google Scholar]
- 60.Lorenz R. Grundbegriffe der Biometrie [Basics of Biometry]. Stuttgart: Gustav Fischer; 1996. [Google Scholar]
- 61.Cohen J, ed. Statistical Power Analysis for the Behavioral Sciences. 2nd ed Hillsdale, MI: Erlbaum Associates; 1988. [Google Scholar]
- 62. Germany. Animal Protection Law 2014.
- 63.Pietsch H, Lengsfeld P, Jost G, et al. Long-term retention of gadolinium in the skin of rodents following the administration of gadolinium-based contrast agents. Eur Radiol. 2009;19:1417–1424. [DOI] [PubMed] [Google Scholar]
- 64.Rohrer M, Bauer H, Mintorovitch J, et al. Comparison of magnetic properties of MRI contrast media solutions at different magnetic field strengths. Invest Radiol. 2005;40:715–724. [DOI] [PubMed] [Google Scholar]
- 65.Alvares RDA, Szulc DA, Cheng HM. A scale to measure MRI contrast agent sensitivity. Sci Rep. 2017;7:15493. [DOI] [PMC free article] [PubMed] [Google Scholar]
- 66.Hanaoka K, Lubag AJ, Castillo-Muzquiz A, et al. The detection limit of a Gd3+ −based T1 agent is substantially reduced when targeted to a protein microdomain. Magn Reson Imaging. 2008;26:608–617. [DOI] [PMC free article] [PubMed] [Google Scholar]
- 67.Taoka T, Naganawa S. Gadolinium-based contrast media, cerebrospinal fluid and the glymphatic system: possible mechanisms for the deposition of gadolinium in the brain. Magn Reson Med Sci. 2018;17:111–119. [DOI] [PMC free article] [PubMed] [Google Scholar]
- 68.Lobinski R, Moulin C, Ortega R. Imaging and speciation of trace elements in biological environment. Biochimie. 2006;88:1591–1604. [DOI] [PubMed] [Google Scholar]
- 69.Jordan WH, Young JK, Hyten MJ, et al. Preparation and analysis of the central nervous system. Toxicol Pathol. 2011;39:58–65. [DOI] [PubMed] [Google Scholar]
- 70.Bolon B, Garman RH, Pardo ID, et al. STP position paper: recommended practices for sampling and processing the nervous system (brain, spinal cord, nerve, and eye) during nonclinical general toxicity studies. Toxicol Pathol. 2013;41:1028–1048. [DOI] [PubMed] [Google Scholar]
- 71.Morawietz G, Ruehl-Fehlert C, Kittel B, et al. Revised guides for organ sampling and trimming in rats and mice—Part 3. A joint publication of the RITA and NACAD groups. Exp Toxicol Pathol. 2004;55:433–449. [DOI] [PubMed] [Google Scholar]
- 72.Schlemm L, Radbruch H, Brandt AU, et al. Histopathologic assessment of neurotoxicity after repeated administration of gadodiamide in healthy rats. Radiology. 2017;282:925–926. [DOI] [PubMed] [Google Scholar]
- 73.Sofroniew MV, Vinters HV. Astrocytes: biology and pathology. Acta Neuropathol. 2010;119:7–35. [DOI] [PMC free article] [PubMed] [Google Scholar]
- 74.von Horsten S, Helfritz A, Kuhlmann S, et al. Stereological quantification of carboxyfluorescein-labeled rat lung metastasis: a new method for the assessment of natural killer cell activity and tumor adhesion in vivo and in situ. J Immunol Methods. 2000;239:25–34. [DOI] [PubMed] [Google Scholar]
- 75.Ostergaard PJ, Jensen MB. Histological quantification of astrocytosis after cerebral infarction: a systematic review. Int J Neurosci. 2013;123:439–443. [DOI] [PMC free article] [PubMed] [Google Scholar]
- 76.Schwarz AJ, Danckaert A, Reese T, et al. A stereotaxic MRI template set for the rat brain with tissue class distribution maps and co-registered anatomical atlas: application to pharmacological MRI. Neuroimage. 2006;32:538–550. [DOI] [PubMed] [Google Scholar]
- 77.Neef N, Nikula KJ, Francke-Carroll S, et al. Regulatory forum opinion piece: blind reading of histopathology slides in general toxicology studies. Toxicol Pathol. 2012;40:697–699. [DOI] [PubMed] [Google Scholar]
- 78.Plank A, Von Horsten S, Canneva F. Combining classical comprehensive with ethological based, high-throughput automated behavioral phenotyping for rodent models of stroke. In: Dirnagl U, ed. Rodent Models of Stroke. New York, NY: Humana Press; 2016:243–261. [Google Scholar]
- 79.Urbach YK, Bode FJ, Nguyen HP, et al. Neurobehavioral tests in rat models of degenerative brain diseases. Methods Mol Biol. 2010;597:333–356. [DOI] [PubMed] [Google Scholar]
- 80.Sukoff Rizzo SJ, Crawley JN. Behavioral phenotyping assays for genetic mouse models of neurodevelopmental, neurodegenerative, and psychiatric disorders. Annu Rev Anim Biosci. 2017;5:371–389. [DOI] [PubMed] [Google Scholar]
- 81.Hanell A, Marklund N. Structured evaluation of rodent behavioral tests used in drug discovery research. Front Behav Neurosci. 2014;8:252. [DOI] [PMC free article] [PubMed] [Google Scholar]
- 82.Moser VC. Functional assays for neurotoxicity testing. Toxicol Pathol. 2011;39:36–45. [DOI] [PubMed] [Google Scholar]
- 83.Porsolt RD, Lemaire M, Durmuller N, et al. New perspectives in CNS safety pharmacology. Fundam Clin Pharmacol. 2002;16:197–207. [DOI] [PubMed] [Google Scholar]
- 84.Spruijt BM, Peters SM, de Heer RC, et al. Reproducibility and relevance of future behavioral sciences should benefit from a cross fertilization of past recommendations and today's technology: “Back to the future”. J Neurosci Methods. 2014;234:2–12. [DOI] [PubMed] [Google Scholar]
- 85.Seibenhener ML, Wooten MC. Use of the open field maze to measure locomotor and anxiety-like behavior in mice. J Vis Exp. 2015:e52434. [DOI] [PMC free article] [PubMed] [Google Scholar]
- 86.Schulz KF. The quest for unbiased research: randomized clinical trials and the CONSORT reporting guidelines. Ann Neurol. 1997;41:569–573. [DOI] [PubMed] [Google Scholar]
- 87.Schulz KF, Altman DG, Moher D. CONSORT Group. CONSORT 2010 statement: updated guidelines for reporting parallel group randomised trials. BMC Med. 2010;8:18. [DOI] [PMC free article] [PubMed] [Google Scholar]
- 88.Kilkenny C, Browne W, Cuthill IC, et al. Animal research: reporting in vivo experiments: the ARRIVE guidelines. Br J Pharmacol. 2010;160:1577–1579. [DOI] [PMC free article] [PubMed] [Google Scholar]
- 89.Prinz F, Schlange T, Asadullah K. Believe it or not: how much can we rely on published data on potential drug targets? Nat Rev Drug Discov. 2011;10:712. [DOI] [PubMed] [Google Scholar]
- 90.Van Noorden R. Science publishing: the trouble with retractions. Nature. 2011;478:26–8. [DOI] [PubMed] [Google Scholar]
- 91.Macleod MR, Michie S, Roberts I, et al. Biomedical research: increasing value, reducing waste. Lancet. 2014;383:101–104. [DOI] [PubMed] [Google Scholar]
- 92.Bishop D. Reproducibility and Reliability of Biomedical Research: Improving Research Practise. The Academy of Medical Sciences, Symposium Report; 2015. [Google Scholar]
- 93.Moher D, Liberati A, Tetzlaff J, et al. Preferred reporting items for systematic reviews and meta-analyses: the PRISMA statement. PLoS Med. 2009;6:e1000097. [DOI] [PMC free article] [PubMed] [Google Scholar]


