Abstract
Purpose
The aim of this study was to investigate, based on in-depth multimodal imaging, the presence of Gd deposits, their ultrastructure, location, and co-location with endogenous elements, in the cerebellum, after repeated administrations of gadolinium-based contrast agents (GBCAs).
Methods
Rats sensitized by subtotal nephrectomy received 20 daily intravenous injections of 0.6 mmol Gd/kg for 5 weeks of commercial forms of either gadoterate, gadobenate or gadodiamide, or saline (n = 2/group). The study was randomized and blinded. Magnetic resonance imaging examination was performed weekly. One month after the last injection, electron microscopy analysis of the deep cerebellar nuclei, the granular layer of cerebellar cortex, and the choroid plexus was performed. Elemental analysis of deposits was carried out by electron energy loss spectroscopy. Secondary ion mass spectroscopy was used for complementary chemical mapping.
Results
A T1 hypersignal was evidenced in the deep cerebellar nuclei of rats treated with linear GBCAs, and Gd deposits were identified in all the studied cerebellar structures with gadobenate and gadodiamide (except in the granular layer in gadobenate-treated rats). No such effect was found with the macrocyclic GBCA gadoterate. Most of the Gd deposits revealed a characteristic spheroid “sea urchin-like” morphology, rich in phosphorus, and were localized in the basal lamina of microvessels, in the perivascular Virchow-Robin space, and in the interstitium. Gd was also identified in the glial cells, associated with lipofuscin pigments, for these same groups.
Conclusions
Transmission electron microscopy analysis of cerebellums of renally impaired rats repeatedly injected with gadobenate and gadodiamide revealed the presence of Gd. Spheroid Gd depositions consisting of a filamentous meshwork were observed in the wall of microvessels, in perivascular Virchow-Robin space, and in the interstitium. Gd was also found in choroid plexus and was associated with pigments (likely lipofuscin) in glial cells. This is consistent with the involvement of the glymphatic distribution pathway for GBCAs. No insoluble Gd deposits were detected in rats injected with the macrocyclic GBCA gadoterate and controls.
Key Words: deep cerebellar nuclei, cerebellar cortex, choroid plexus, glymphatic pathway, electron microscopy, secondary ion mass spectroscopy, gadolinium presence, gadodiamide, gadobenate, gadoterate
Gadolinium (Gd) accumulation in brain structures after repeated injections of gadolinium-based contrast agents (GBCAs) has been widely investigated. It is well established, from nonclinical and clinical studies, that Gd accumulates after repeated exposure to linear Gd chelates,1,2 in brain regions rich in iron,3,4 and in different coexisting forms (ie, chelated Gd, dissociated and soluble Gd bound to unidentified macromolecules, and insoluble Gd).5–7 It is also known that Gd washout exists but is not complete.7–9 Electron microscopy (EM), associated with spectroscopic techniques, is a highly sensitive and specific tool for localizing and characterizing exogenous metals in biologic structures.10 McDonald et al11 identified Gd deposits in the dentate nucleus of postmortem patients who received 4 to 29 injections of gadodiamide, reportedly in the endothelial wall of blood vessels and in the interstitium as well. Recently, the same team found insoluble Gd deposits within the nucleus of neuronal cells from the dentate nucleus of 2 gadodiamide-treated patients.12 In rats, insoluble Gd deposits were observed in the wall of blood vessels in the region of the lateral (dentate) cerebellar nuclei after repeated administrations of gadodiamide (2 months after the last injection).13 Another study also found insoluble Gd deposits also in the interstitium after administrations of gadodiamide, gadobenate, and gadobutrol, but not gadoteridol, using the same administration protocol.14
To provide detailed information complementing these observations, we investigated Gd cerebellar tissue presence in a comparative study (saline/macrocyclic GBCA gadoterate/linear GBCAs gadobenate and gadodiamide), in rats that received 20 repeated injections, and sensitized by moderate renal impairment to be translational to a common clinical condition15 and to increase the sensitivity of the model.4,16 In addition to the deep cerebellar nuclei (DCN), the granular layer of the cerebellar cortex and choroid plexus of the fourth ventricle were studied because these specific structures are also prone to store Gd, according to laser ablation–inductively coupled plasma–mass spectrometry data,13 and, to our knowledge, have never been investigated by EM so far.
The aims of this study were to investigate in depth, by multimodal imaging techniques, the possible presence, ultrastructural morphology, precise localization, shape, and co-location with endogenous elements of Gd deposits in various areas of interest in the rat cerebellum, after repeated administration of GBCAs, and to build a hypothesis for the distribution and behavior of these molecules in the central nervous system.
MATERIALS AND METHODS
All animal experiments were conducted in compliance with the European Union Directives 2010/63/EU on the protection of animals used for scientific purposes.
Study Design
This is an ancillary study of a previously published investigation.4 Female Sprague-Dawley rats (SPF/OFA rats; Charles River, L'Arbresle, France), 5/6th subtotally nephrectomized 2 weeks earlier, received 20 intravenous injections of 0.6 mmol Gd/kg (1.2 mL/kg) of the commercial forms of gadoterate (macrocyclic and ionic GBCA, Dotarem; Guerbet, Villepinte, France), gadobenate (linear and ionic GBCA, Multihance; Bracco Imaging, Milan, Italy), gadodiamide (linear and nonionic GBCA, Omniscan; GE Healthcare, Chalfont St Giles, United Kingdom), or 1.2 mL/kg of 0.9% saline solution (CDM Lavoisier, Paris, France) under isoflurane (IsoFlo; Axience, Pantin, France) anesthesia. The intravenous injections were performed in the tail once a day, 4 days a week for 5 weeks. The 0.6 mmol Gd/kg dose corresponds to the clinical dose (0.1 mmol Gd/kg) adjusted for the body surface area of the rat species, according to Food and Drug Administration guidelines.17 An injection-free period of one month was applied after the last injection. Two rats per group were randomly extracted from a larger cohort (8 rats/group) for dedicated transmission electron microscopy (TEM)/electron energy loss spectroscopy (EELS) examinations. Regarding the other animals, total Gd measurement was performed in brain structures.4 Then, the animals were anesthetized using 5% isoflurane and exsanguinated, with a 4% formalin solution for perfusion. The cerebellum was subsequently harvested, and placed in Karnovsky medium (2% paraformaldehyde, 2.5% glutaraldehyde, 0.1 M cacodylate buffer). Group assignment was randomized, and the whole study was carried out blindly.
Magnetic Resonance Imaging Examination
Magnetic resonance imaging (MRI) was performed at completion of the study (ie, one month after the last injection) in anesthetized animals (isoflurane), using a dedicated phased-array quadrature head coil in a gradient/shims insert B-GA 12S HP (660 mT/m intensity and 4570 T/m/s maximum slew rate) on a 4.7 T preclinical magnet (Biospec 47/40; Bruker). The MRI examination consisted of a T1-weighted 2D FLASH (repetition time/echo time, 50/1.78 milliseconds; 48 averages; in-plane resolution, 164 × 164 μm2; slice thickness, 700 μm; acquisition time, 6 mn 36 seconds), targeted only on the cerebellum (11 slices). The examination was performed by a single investigator in blinded conditions.
Transmission Electron Microscopy
First, the fixed cerebellums were cut into the 2 hemispheres, and 1.5-mm thick slices were cut out of the specimens. Square pieces (~2 mm3) were removed from the choroid plexus, the DCN, and the granular layer of the cerebellar cortex. Two specimens of each cerebellum area were used for embedding. All samples were post-fixed with osmium tetroxide for 2 hours. After dehydration, the samples were infiltrated with EPON resin via an automated tissue processor (LYNX; Leica Reichert, Wetzlar, Germany). The processed material was transferred into EPON resin (EMBed812; Electron Microscopy Sciences, Hatfield, PA), which was polymerized at 60°C for 2 days. The EPON resin blocks were cut in semithin (0.75 μm) sections with an ultramicrotome, and double-stained with toluidine blue and basic fuchsine for orientation. Areas of interest were identified with the help of the light microscope. Ultrathin sections (80 nm) of the marked structures were prepared. Finally, the sections were stained with uranyl acetate and lead citrate.
Energy-Filtered Transmission Electron Microscopy and Electron Energy Loss Spectroscopy
Transmission electron microscopy (zero-loss mode) observations were performed on 80-nm conventionally stained ultrathin sections. Parallel EELS in spot- or TEM-modes (Zeiss LEO 912AB Oberkochen, Germany; iTEM software package OSIS, Muenster, Germany) was used to analyze suspicious electron-dense deposits for the presence of Gd, or, occasionally, other elements (N, O, Ca). Gadolinium produces a characteristic loss of electron energy at the M4,5 edge at 1185 eV. The spatial distribution of the elements was mapped by energy-filtered transmission electron microscopy applying the 3 windows method, using inelastically scattered electrons with element-specific energy loss (electron spectroscopic imaging) as described elsewhere.18
Blinded Semiquantification of Gd-Deposits Among the Groups
Subsequent to the blinded qualitative analysis, a blinded semiquantitative analysis was performed to investigate all the samples, which were 24 in total (3 locations in 2 animals of each of the 4 groups). Randomly chosen cells (neurons and glial cells) (n = 10) and blood vessels (n = 10) were analyzed for each rat and each area of interest (ie, choroid plexus, DCN, and granular layer of the cerebellar cortex). This number was chosen to ensure that the whole number of analyzed cells, and vessels came from 1 section to prevent a bias in quantification due the use of serial sections. With that approach in 23 of 24 sections, we reached the number of cells and vessels that should be analyzed semiquantitatively.
Furthermore, the entire interstitium of the analyzed field was evaluated. For the evaluation of the blood vessels, the entire basal lamina was investigated. In an overview (TEM magnification was 1250), the number of blood vessels determined the total number of investigation fields (grid meshes).
High-Spatial Resolution Secondary Ion Mass Spectroscopy (NanoSIMS)
After TEM/EELS study, to characterize the presence of phosphorous, iron, and sulfur in the deposits and pigment aggregates, one grid with DCN area in the gadodiamide group was further studied by NanoSIMS. High spatial resolution SIMS imaging was carried out on the same area of interest observed by TEM, using a NanoSIMS-50 Ion microprobe (CAMECA, Gennevilliers, France) operating in scanning mode.19
A tightly focused Cs+ primary ion beam was directed at the sample surface to trigger the secondary ion emission. With the primary beam stepping over the surface of the sample, images of the selected ion species were generated. In the present work, 5 secondary ion species (12C−, 12C14N−, 32S−, 31PO2−, and 56FeO−) were monitored in parallel. After careful Cs+ ion implantation to achieve steady-state ion emission, acquisition was carried out using multiframe mode. The primary beam intensity was in the order of 0.3 pA, and the field of view was around 10 μm with an image size of 256 × 256 pixels, and a dwell time of 0.5 milliseconds per pixel, from 100 to 300 frames. Image processing was performed using ImageJ software.20 First, multiframe images were properly aligned using the TomoJ plugin with 12C14N− images as reference before a summed image was obtained for each ion species.21 The 12C14N− image then served as a reference for correlation with the high-resolution TEM image of the same region using the TurboReg plugin.22
RESULTS
Magnetic Resonance Imaging
After repeated injections followed by an injection-free period of one month period, a T1 hypersignal was observed in the DCN only in all rats treated with gadobenate and with gadodiamide, but not in the DCN of gadoterate- and saline-treated rats (Fig. 1).
FIGURE 1.
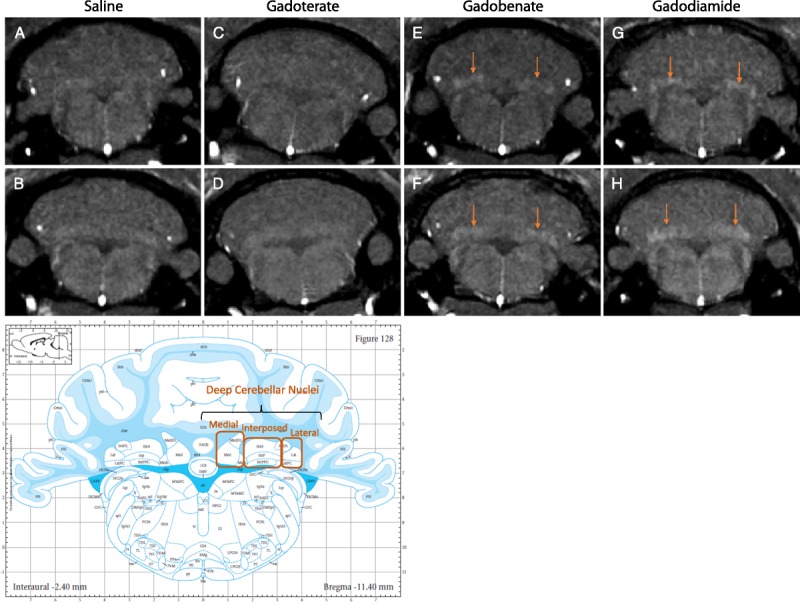
T1-weighted MRI (4.7 T) examination of the animals analyzed by TEM, after an injection-free, washout period of one month, in the plane containing DCN, and associated atlas (copyright Elsevier Inc, with permission).23 A T1 hypersignal was visible in the DCN of rats from the gadobenate (E–F) and gadodiamide groups (G–H) (arrows), but not in the saline (A–B) and gadoterate (C–D) groups.
Electron Microscopy and NanoSIMS Examinations
Electron energy loss spectroscopy–characterized, Gd-positive electron-dense deposits were observed intramembraneously in the basal lamina of blood microvessels, in the DCN of all rats that received gadobenate and gadodiamide, and in the granular layer of the cerebellar cortex of gadodiamide-treated rats (Fig. 2). No Gd deposits were found in the endothelial cells, regardless of the treatment or the structure examined. These Gd-positive deposits had a characteristic spheroid shape and morphology resembling a spiny “sea urchin,” approximately 300 nm in diameter with 2-nm wide spines, forming a meshwork-like structure. Insertion or formation of those deposits frequently produced a local deformation and hump-like thickening of the basal lamina. Singularly, Gd deposits were observed in the vessel wall in a space between 2 basal laminas consistent with the perivascular Virchow-Robin space (Fig. 3).24 Similar Gd deposits were observed in the interstitium of the DCN in all rats that received gadobenate and gadodiamide (Fig. 4). Detailed EELS analysis of Gd sea urchins spheroids revealed heterogeneous presence of Gd (Fig. 5). Copresence of Ca, N, and O was also occasionally detected in the deposits (data not shown). Such typical Gd-positive deposits were never observed in the samples from the gadoterate and saline groups.
FIGURE 2.
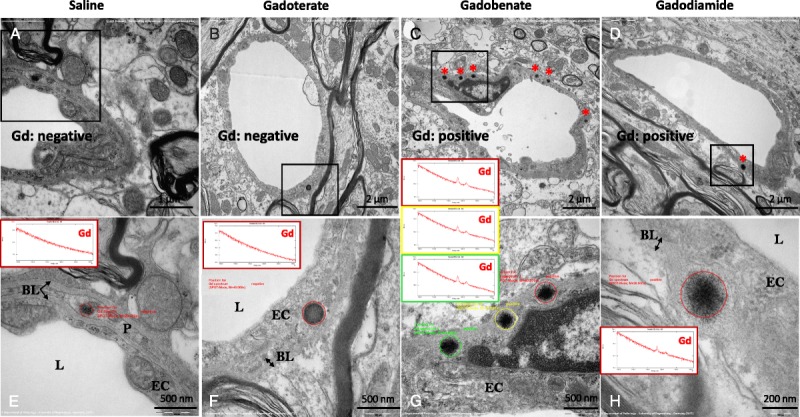
Gd-containing deposits in sea urchin–shaped spheroidal inclusions (asterisks) observed intramembraneously in the basal lamina of vessels in the DCN of rats that received gadobenate (panels C and G) and gadodiamide (panels D and H). In the gadoterate (panels B and F) and saline (panels A and E) groups, the electron-dense structures sporadically observed in the vessel wall never displayed the characteristic sea urchin shape, were not located in the basal lamina, and were always negative for Gd when analyzed by EELS. BL indicates basal lamina; EC, endothelial cell; L, Lumen of the microvessel; P, pericyte.
FIGURE 3.
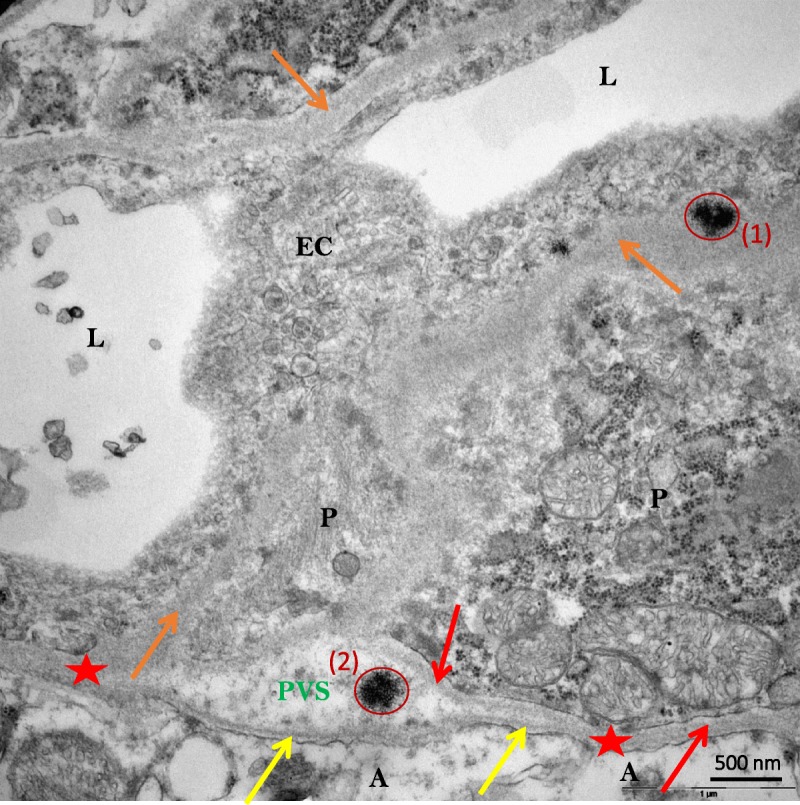
Sea urchin–like, spheroid-shaped Gd deposits (red circles) localized in the basal lamina (1) and in the perivascular (also known as Virchow-Robin) space (2) (DCN of a gadodiamide-treated rat). A indicates Astrocyte end-feet; BL, basal lamina (yellow arrows = BL of glia limitans; orange arrows = unified basal lamina of endothelial cell and pericyte adluminal side; red arrow = basal lamina of one pericyte abluminal side; red stars= BL coalescence of glia limitans and pericyte or of endothelial cell); EC, endothelial cell; L, lumen of vessel; P, pericyte; PVS, perivascular (also known as Virchow-Robin) space.
FIGURE 4.
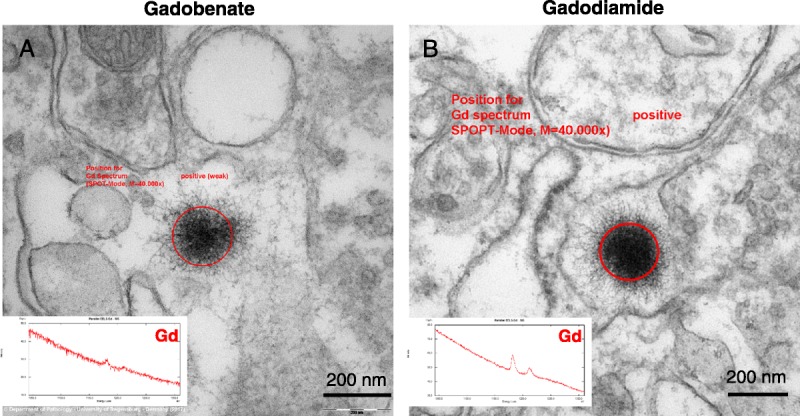
Typical sea urchin–like, spheroid-shaped deposits observed in the interstitium of the DCN of rats treated with gadobenate (A) and gadodiamide (B). In the gadoterate and saline groups, no deposits were found in the interstitium (data not shown).
FIGURE 5.
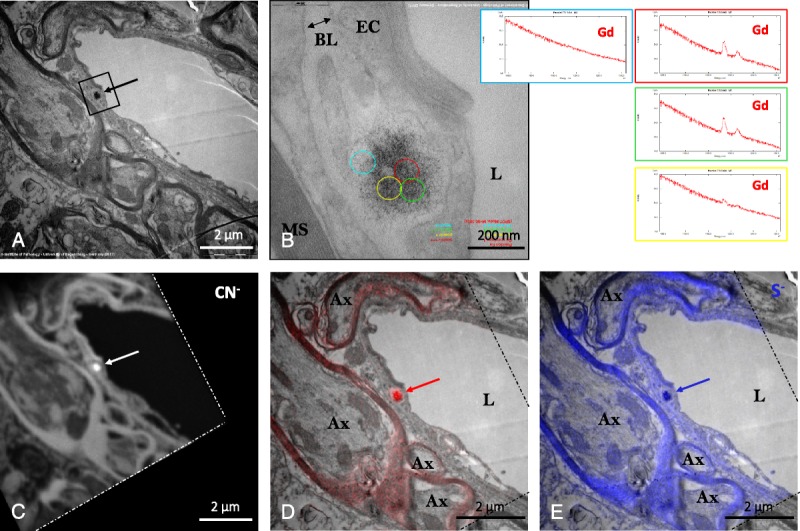
A, Typical sea urchin–like, spheroid-shaped deposits (arrow) in the DCN of a gadodiamide-treated rat. B, Higher magnification of this deposit showed its precise location in the basal lamina confluence of a microvessel, and EELS suggested heterogeneous Gd distribution (as shown in the adjacent spectra). C, 12C14N− (carbon-nitrogen group) image of the analyzed area (delimited by dashes, NanoSIMS chemical mapping), showing high 12C14N− content in the Gd deposit (arrow); D, overlay of P (red, NanoSIMS) and TEM (gray) images, showing that this characteristic Gd deposit was rich in phosphorus (arrow); E, overlay of sulfur (blue, NanoSIMS) and TEM (gray) images showing that this Gd deposit was also rich in sulfur. Ax indicates axon; BL, basal lamina; EC, endothelial cell; L, lumen of the vessel; MS, axon myelin sheaths.
NanoSIMS analysis revealed the presence of a high content of phosphorous in the sea urchin deposits (as well as in the myelin sheaths, rich in phospholipids), together with the presence of sulfur in scarce amounts (Fig. 5). Conversely, no iron copresence was evidenced in the Gd deposits.
Gadolinium was also identified in membrane-bound electron-dense pigment aggregates, located in the glial cells of the DCN, for the 2 linear GBCAs groups (Fig. 6). Only a few of these analyzed pleomorphic intracellular inclusions were positive for Gd. These positive signals consisted of small electron-dense dots, which were inhomogeneously distributed.
FIGURE 6.
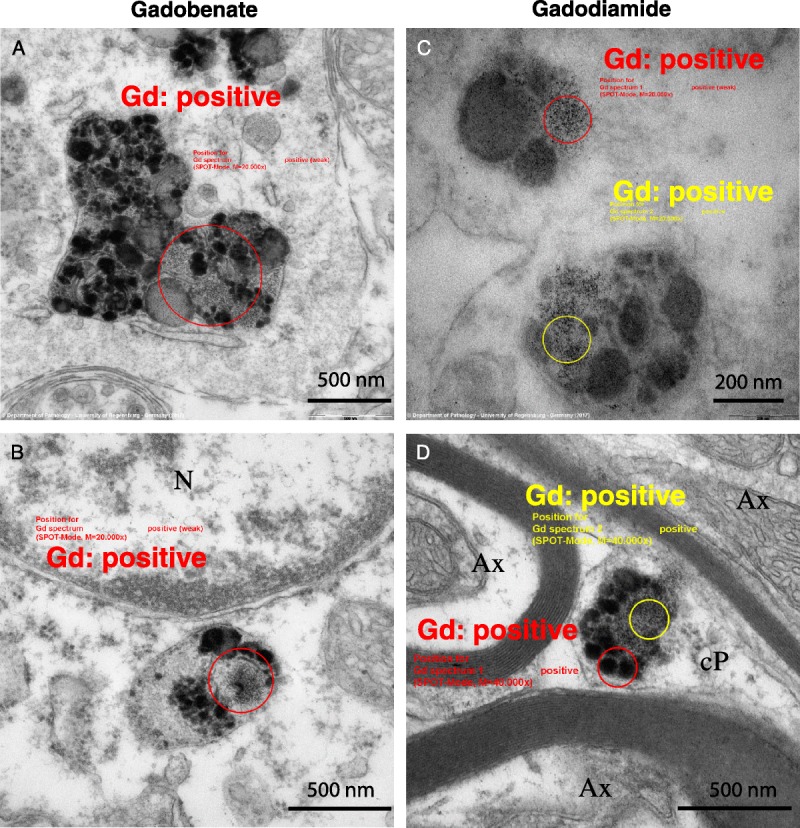
Ultrastructure and EELS analysis results of Gd associated with intracellular membrane-bound pigment inclusions, in the DCN of rats that received gadobenate (A and B) and gadodiamide (C and D). Gd was never detected by EELS in pigment inclusions in rats from the gadoterate and saline groups (data not shown). Ax indicates axon; cP, cell protrusion; N, nucleus.
NanoSIMS analysis revealed that, whatever the Gd content, they were, in proportion, more rich in sulfur that its environment, which is a characteristic of lipofuscin, compatible with their ultrastructural aspect (amorphous electron-dense material and lipid droplets). Phosphorous was also sometimes identified in some of the aforementioned aggregates, with quite a good correlation with the location of Gd (Fig. 7).
FIGURE 7.
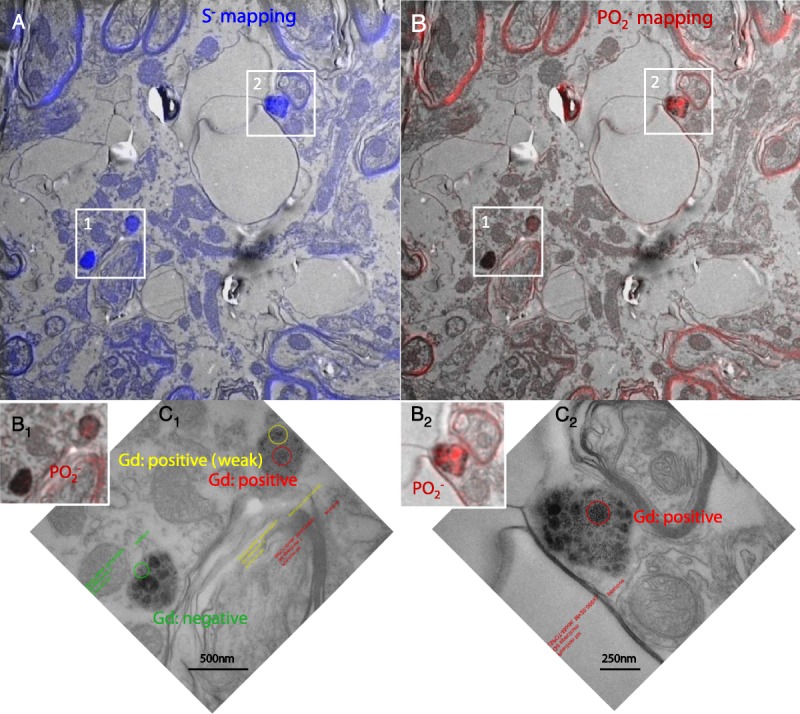
Correlative imaging by TEM and NanoSIMS of Gd-positive pigments (areas 1 and 2) examinated by EELS (C1 and C2: higher magnification of areas 1 and 2, respectively), in the DCN of a rat from the gadodiamide group. These pigments were found, by NanoSIMS, to be rich in sulfur (A), consistent with the hypothesis that they are lipofuscin pigments. Presence of P was observed in some parts of the pigments (B1, B2), coinciding with Gd-positive areas observed by EELS (C1, C2, respectively).
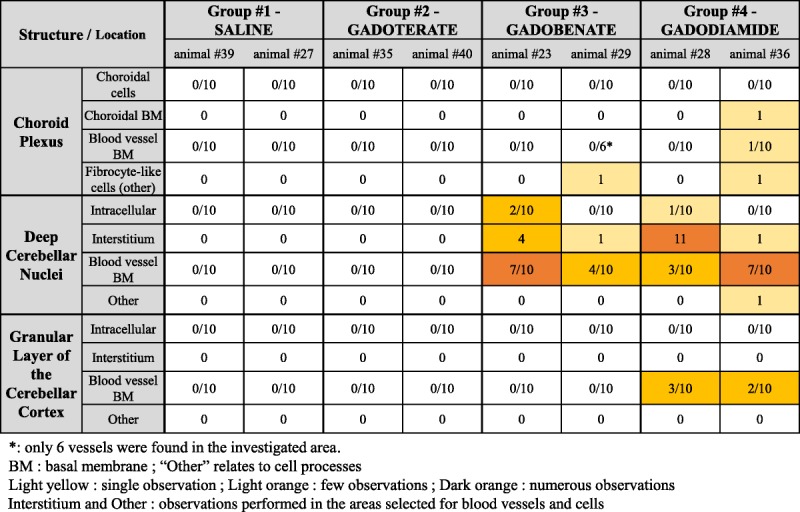
In the choroid plexus, Gd deposits were identified in fibrocyte-like cells, in the interstitium located perivascularly between the basal lamina of a venule, and in the epithelial basal lamina of a choroid plexus, in 2 rats from the gadobenate group and in 1 rat from the gadodiamide group. In these fibrocyte-like cells, Gd was found to be associated with membrane-bound pigments (likely lipofuscin) (Fig. 8, A and B). Furthermore, in the gadodiamide treated group, a Gd-positive structure was found in the basal lamina of a blood vessel (Fig. 8, E and F); and in 1 case, EELS analysis identified Gd associated with a dark, roundish inclusion, which was located in a fold of the basal lamina of the choroidal epithelium (Fig. 8, C and D). No Gd deposits were identified inside the choroid plexus epithelial cells. A summary of all Gd-related findings in the examined cerebellar areas are presented in Table 1.
FIGURE 8.
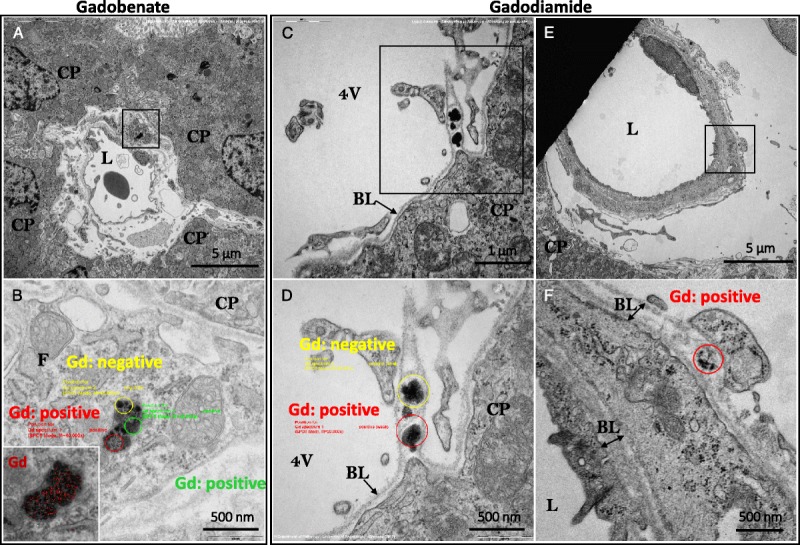
Examples of Gd-positive inclusions detected in the choroid plexus area. A, Topology of a perivascular fragment of a circulating fibrocyte-like cell bearing a lipofuscin-like pigment inclusion; note its localization in the interstitial space between the blood vessel and the epithelial choroidal cells (gadobenate group). C, Overview displaying pleomorphic non–membrane-bound electron-dense inclusions found in a basal lamina fold of the choroidal epithelium (gadodiamide group). E, Location of a partial spheroid, sea urchin–like structure found in the basal lamina of a pericyte (gadodiamide group). B, D, and F, Higher magnification of the inclusion (in panels A, C, and E, respectively) displaying the areas selected for EELS analysis. Insert in B, electron-dense lipofuscin inclusion with electron spectroscopic imaging–mapped Gd distribution (red). Insert in B, Gd mapping by electron spectroscopic imaging on the membrane-bound lysosomal lipofuscin inclusion (higher magnification). BL indicates basal lamina; CP, choroid plexus epithelial cell; F, circulating fibrocyte-like cell; L, lumen of the venule; 4 V, fourth ventricle.
TABLE 1.
Semiquantification: Incidence of Gd-Positive Findings
Semiquantification
No Gd was observed in the gadoterate cerebellar samples, or in the control samples. Conversely, Gd deposits were observed in the gadobenate and gadodiamide groups, in the different areas observed (Table 1). The term “other” relates to cell processes, which did not formally allow cell identification in the DCN (as in Fig. 6D).
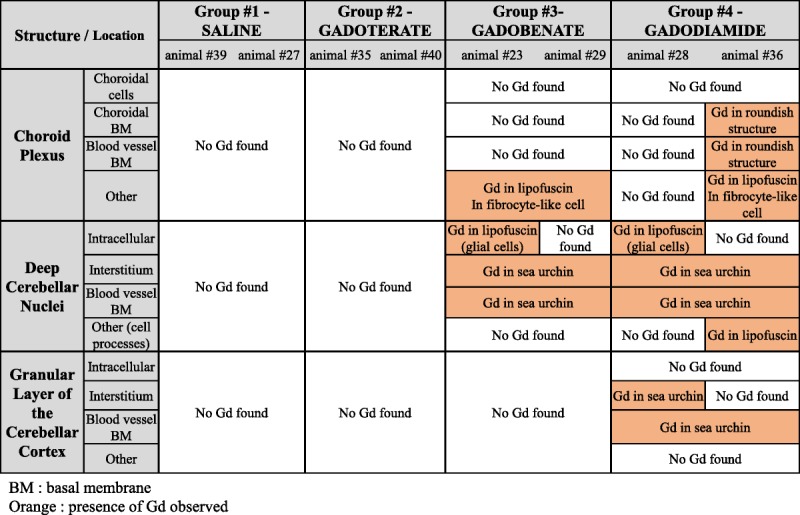
The summary of all of the observations, during qualitative and semiquantitative analyses (Gd presence and location), is presented in Table 2.
TABLE 2.
Summary of the Gd Related Findings Observed During the Study
DISCUSSION
This study was carried out on rats with moderately impaired renal function, corresponding to a sensitized population frequently exposed to contrast-enhanced MRI examinations.15,16 It was an exploratory and hypothesis-generating study.25 Our investigation reveals the presence of insoluble Gd species under distinct profiles in the cerebellum of rats. The preparation for the EM examination would likely washout soluble entities from the samples.26 This strongly suggests that all the Gd species observed with this technique are in the insoluble form, corresponding to the precipitated part not recovered by the methods used in biospeciation studies.5,6
Most of the Gd deposits revealed, at high-power magnification, a spheroid shape resembling a sea urchin, with a mesh-like fine filamentous substructure. Similar globular deposits (without dissecting their internal ultrastructure) have been already described in other clinical11,12 and nonclinical13,14 studies. These Gd deposits were identified in the basal lamina of cerebellar microvessels, in the perivascular Virchow-Robin space, for the first time to our knowledge, and in the interstitium as well. Unlike what was suggested by other studies,13,14 these Gd deposits were never observed into endothelial cells. Unlike a postmortem clinical study in gadodiamide-treated subjects,12 no Gd deposits were observed in the nucleus of neuronal cells in our conditions. No insoluble Gd species was observed in the cerebellar tissues of rats treated with the macrocyclic GBCA gadoterate, possibly because this chelate does not dissociate in vivo, due to its higher thermodynamic and kinetic stabilities.27 The electron-dense structures that were sporadically observed and presented as negative examples for saline and gadoterate-treated rats (Fig. 2, E and F) did not display this typical sea urchin shape, were not located into the same substructures (basal lamina or interstitium), and, above all, were negative when tested by the EELS technique. No Gd deposits were observed in the granular layer of rats that received gadobenate. This may be consistent with the lower Gd concentrations found in the cerebellar cortex of rats treated with this GBCA, compared with the DCN or to the same areas in the gadodiamide group.16
We used the NanoSIMS technique to perform a chemical mapping of the elements of interest. This technique is based on the impact of a primary ion beam (in our case, Cs+) focused on the surface of the cerebellar sample, which results in the generation of particles ejected from the sample surface. Of the emitted particles, some end up as secondary ions. These secondary ions are subsequently collected and directed to a mass spectrometer. Parallel detection simultaneously counts the ions corresponding to preselected masses from the same microvolume sampled by the probe. This results in a chemical mapping of the area of interest.28
The NanoSIMS technique revealed that the spheroidal sea urchin Gd deposits were rich in phosphorous, consistent with the hypothesis of a Gd storage in the form of insoluble GdPO4. It is likely that these insoluble Gd species are not responsible for T1 signal enhancement.5 However, because these Gd deposits appear to be a mesh-like, porous structure, the water accessibility also to the interior of the deposit may exist. Even if this is a GdPO4-like structure, the possibility of some T1 relaxivity effect cannot be totally ruled out. Neither TEM/EELS nor NanoSIMS techniques revealed the presence of Fe associated with the Gd deposits. Conversely, other elements (N, O, and Ca) were detected, and high 12C14N− (carbon-nitrogen) content was evidenced by NanoSIMS. The sea urchin–shaped structures seemed heterogeneous as regards the presence of Gd in their meshwork, suggesting that Gd is associated with a filamentous structure unknown yet. Morphologically similar mesh-like Gd-positive formations in this case associated with collagen fibers were observed in the dermis of rats treated with gadodiamide.29
Interestingly, gradual formation of similar sea urchin resembling structures has been described after exposure of lanthanides oxides (including Gd2O3) to phagolysosomal-simulated fluid.30 Elemental characterization of these deposits by energy dispersive x-ray revealed the copresence of phosphorus. The lanthanide salts were assumed to be a hexagonal rhabdophane polymorph of the lanthanide orthophosphates.30
Intracellular Gd was also found in linear GBCAs groups in glial cells (identified as astrocytes), associated with membrane-bound pigment inclusions. These pigment aggregates were characterized as lipofuscin because of their typical ultrastructural features (homogeneous lipid vacuoles surrounded by, or adjacent to, a coarse or fine electron-dense matrix)31 and the high local amount of sulfur.32 In the brain of old rats, the range of dimensions of lipofuscin pigments is generally 0.5 to 3 μm.31,33 Moreover, they cannot be confused with neuromelanin because the latter is found only in catecholaminergic neurons34 and never reported in rat cerebellum, to our knowledge. Indeed, fluorescence microscopy would allow to firmly confirm this conclusion. We believe that this is the first time this association between Gd and a pigment (likely lipofuscin) is evidenced. Lipofuscin is an undegradable, autofluorescent, ubiquitous pigment polymer. It is a byproduct of the macroautophagy pathway where autophagic vacuoles engulf intracellular components to later fuse with lysosomes to degrade their constituents.35 Lipofuscin consists of an aggregate of oxidized proteins (30%–70%), lipids (20%–50%), bound sugar residues (from the fifth decade of life in humans), and acidic residues of hydrolysis.35,36 Its number increases with aging, and it is principally located in the neurons and glial cells of those areas involved in motor functions. Lipofuscin deposition has been reported in the neurons of the human dentate nucleus.36 Lipofuscin aggregates are known to be rich in transition metals, such as Zn, Cu, Mn, Ca, and especially Fe.37 In our conditions, however, the presence of Fe was not evidenced by the NanoSIMS technique. It is admitted that lipofuscin is cytotoxic because of its ability to incorporate redox-active transition metals, its ability to catalyze the Fenton reaction, and thus its ability to generate the formation of free radicals. In addition, lipofuscin can inhibit the degradation of oxidized proteins by competitively binding to the proteasome.35,36 Qualitatively, no difference was observed as regards to the number of lipofuscin pigments among the groups (data not shown). Reasons for the gadolinium association with intracellular lipofuscin pigments remain unclear. Local and systemic neurotoxicity remains to be investigated in depth at the ultracellular level.
Regarding Gd associated with lipofuscin, co-location was sometimes observed with phosphorus as well, but it seems difficult to draw firm conclusions at this stage.
Our findings are consistent with the current hypothesis that all GBCAs access healthy brain tissues and are cleared through the glymphatic pathway.9,38–43 Indeed, Gd deposits were found around choroidal venules (Fig. 8), where cerebrospinal fluid (CSF) is produced; between a microvessel basal lamina and the glia limitans, in the so-called Virchow-Robin space; in microvessels basal lamina; in the interstitium; and in glial cells. Therefore, with the exception of postcapillary perivenous space, Gd deposits were found at every stage of the glymphatic pathway. Before reaching the level of the capillaries, the CSF circulates along penetrating arterioles in the Virchow-Robin (or perivascular) space. This structure disappears at deeper levels and the basal laminas collapse.24 We speculate that insoluble Gd deposits found in microvessels basal lamina could have been retained at this level, after circulating in the CSF along para-arterial channels. Another explanation would be that Gd circulating in the microvessel crossed the endothelium, and was retained in the basal lamina, possibly by interacting with the cerebrovascular matrisome constituents.44
Some Gd must then have reached the interstitial fluid by convection, as proposed in the glymphatic system hypothesis.38–40 Numerous Gd deposits were found in the interstitium. Finally, some Gd could enter glial cells, and possibly cleared as cellular waste material.36,45
The study was performed on the sensitized population of moderately renally impaired rats. One limitation may be that extrapolating the results to a healthy population is hazardous. In a previous study, it was shown that, in similar conditions, the Gd distribution profile was not qualitatively affected by renal impairment.16 Total Gd concentrations in cerebrum and cerebellum were, however, increased in the case of renal failure.16 Therefore, we assume that the distribution mechanism is similar in both conditions. In healthy rats, approximately 50% of the linear GBCA gadobenate is taken up by the hepatocytes, unlike gadodiamide and gadoterate that are exclusively excreted by the kidneys.46 Therefore, in renally impaired rats, this phenomenon may underestimate the tissue Gd concentration for gadobenate. Another limitation of the study is that the techniques used here cannot determine the precise forms of Gd trapped in the brain tissues, even if it is very likely that the sample processing would have washed out all the soluble species of Gd.26 Therefore, this study would address only the insoluble form of dissociated Gd. The size of the study group with 2 animals per group may seem small. However, this semiquantification of Gd deposits on the ultrastructural level represents a proof of concept approach,25 which allows a proper comparison of deposits after use of different GBCAs. Basically, 24 specimens were analyzed and quantified: for each animal, 3 cerebellar locations associated with the presence of Gd by laser ablation–inductively coupled plasma–mass spectrometry in rats13 or by MRI in rats16 and in patients with renal failure.47 To reach a clear interpretation, we selected the number of 10 cells and 10 blood vessels per cerebellar location to ensure that this number could be found in a single section. In doing so, we made sure that specimens were compared in a single level, to prevent a bias due to serial sectioning. Our semiquantitative analysis fully confirmed the findings of the qualitative study and enabled the possibility to compare the presence of Gd deposits for 3 different GBCAs.
In conclusion, after repeated injections of linear Gd chelates, gadodiamide showed the most Gd-positive electron-dense deposits, followed by gadobenate. Most Gd-positive deposits were found in DCN, followed by choroid plexus and the granular cell layer of the cerebellar cortex. Gd deposits were found in different structures of cerebellar tissues: basal lamina of microvessels, Virchow-Robin (perivascular) space, interstitium, and in glial cells associated with lysosomal lipofuscin pigments. Most Gd deposits displayed a characteristic spheroidal sea urchin shape and consisted of a filamentous meshwork with inhomogeneous Gd distribution. These observations and the suggested glymphatic clearance pathway via the perivascular Virchow-Robin space need further studies for clinical relevance assessment.
No insoluble Gd deposits were observed in the cerebellums of rats treated with the macrocyclic GBCA gadoterate or saline.
ACKNOWLEDGMENTS
The authors thank Prof Toshiaki Taoka (Nagoya University Hospital, Japan) for helpful discussions, and Dr Cédric Messaoudi and Amandine Verguet (Institut Curie, Orsay, France) for their help in the definition of regions of interest for the NanoSIMS analyses.
Footnotes
Conflicts of interest and sources of funding: M.R., A.E., N.F., J.M.I., and C.C. were Guerbet Employee at the time of the study. University of Regensburg received funding from Guerbet within a common research project. This study was funded by Guerbet.
REFERENCES
- 1.Runge VM. Safety of the gadolinium-based contrast agents for magnetic resonance imaging, focusing in part on their accumulation in the brain and especially the dentate nucleus. Invest Radiol. 2016;51:273–279. [DOI] [PubMed] [Google Scholar]
- 2.Kanda T, Nakai Y, Oba H, et al. Gadolinium deposition in the brain. Magn Reson Imaging. 2016;34:1346–1350. [DOI] [PubMed] [Google Scholar]
- 3.Zhang Y, Cao Y, Shih GL, et al. Extent of signal hyperintensity on unenhanced T1-weighted brain MR images after more than 35 administrations of linear gadolinium-based contrast agents. Radiology. 2017;282:516–525. [DOI] [PubMed] [Google Scholar]
- 4.Rasschaert M, Emerit A, Fretellier N, et al. Gadolinium retention, brain T1 hyperintensity, and endogenous metals: a comparative study of macrocyclic versus linear gadolinium chelates in renally sensitized rats. Invest Radiol. 2018;53:328–337. [DOI] [PMC free article] [PubMed] [Google Scholar]
- 5.Gianolio E, Bardini P, Arena F, et al. Gadolinium retention in the rat brain: assessment of the amounts of insoluble gadolinium-containing species and intact gadolinium complexes after repeated administration of gadolinium-based contrast agents. Radiology. 2017;285:839–849. [DOI] [PubMed] [Google Scholar]
- 6.Frenzel T, Apte C, Jost G, et al. Quantification and assessment of the chemical form of residual gadolinium in the brain after repeated administration of gadolinium-based contrast agents: comparative study in rats. Invest Radiol. 2017;52:396–404. [DOI] [PMC free article] [PubMed] [Google Scholar]
- 7.Robert P, Fingerhut S, Factor C, et al. One year retention of gadolinium in the brain: comparison of gadodiamide and gadoterate meglumine in a rodent model. Radiology. 2018. In press. [DOI] [PubMed] [Google Scholar]
- 8.Smith AP, Marino M, Roberts J, et al. Clearance of gadolinium from the brain with no pathologic effect after repeated administration of gadodiamide in healthy rats: An analytical and histologic study. Radiology. 2017;282:743–751. [DOI] [PubMed] [Google Scholar]
- 9.Kanda T, Nakai Y, Hagiwara A, et al. Distribution and chemical forms of gadolinium in the brain: a review. Br J Radiol. 2017;90:20170115. [DOI] [PMC free article] [PubMed] [Google Scholar]
- 10.Egerton RF. New techniques in electron energy-loss spectroscopy and energy-filtered imaging. Micron. 2003;34:127–139. [DOI] [PubMed] [Google Scholar]
- 11.McDonald RJ, McDonald JS, Kallmes DF, et al. Intracranial gadolinium deposition after contrast-enhanced MR imaging. Radiology. 2015;275:772–782. [DOI] [PubMed] [Google Scholar]
- 12.McDonald RJ, McDonald JS, Kallmes DF, et al. Gadolinium deposition in human brain tissues after contrast-enhanced MR imaging in adult patients without intracranial abnormalities. Radiology. 2017;285:546–554. [DOI] [PubMed] [Google Scholar]
- 13.Lohrke J, Frisk AL, Frenzel T, et al. Histology and gadolinium distribution in the rodent brain after the administration of cumulative high doses of linear and macrocyclic gadolinium-based contrast agents. Invest Radiol. 2017;52:324–333. [DOI] [PMC free article] [PubMed] [Google Scholar]
- 14.McDonald RJ, McDonald JS, Dai D, et al. Comparison of gadolinium concentrations within multiple rat organs after intravenous administration of linear versus macrocyclic gadolinium chelates. Radiology. 2017;285:536–545. [DOI] [PubMed] [Google Scholar]
- 15.Stevens LA, Viswanathan G, Weiner DE. Chronic kidney disease and end-stage renal disease in the elderly population: current prevalence, future projections, and clinical significance. Adv Chronic Kidney Dis. 2010;17:293–301. [DOI] [PMC free article] [PubMed] [Google Scholar]
- 16.Rasschaert M, Idée JM, Robert P, et al. Moderate renal failure accentuates T1 signal enhancement in the deep cerebellar nuclei of gadodiamide-treated rats. Invest Radiol. 2017;52:255–264. [DOI] [PMC free article] [PubMed] [Google Scholar]
- 17.Food and Drug Administration. US Department of Health and Human Services. Center for Drug Evaluation and Research. Guidance for Industry. Estimating the maximum safe starting dose in initial clinical trials for therapeutics in adult healthy volunteers. 2005. Available at: http://www.fda.gov/downloads/Drugs/.../Guidances/UCM078932.pdf. Accessed April 2, 2018.
- 18.Schroeder JA, Weingart C, Coras B, et al. Ultrastructural evidence of dermal gadolinium deposits in a patient with nephrogenic systemic fibrosis and end-stage renal disease. Clin J Am Soc Nephrol. 2008;3:968–975. [DOI] [PMC free article] [PubMed] [Google Scholar]
- 19.Guerquin-Kern JL, Wu TD, Quintana C, et al. Progress in analytical imaging of the cell by dynamic secondary ion mass spectrometry (SIMS microscopy). Biochim Biophys Acta. 2005;1724:228–238. [DOI] [PubMed] [Google Scholar]
- 20.Schneider CA, Rasband WS, Eliceiri KW. NIH Image to ImageJ: 25 years of image analysis. Nat Methods. 2012;9:671–675. [DOI] [PMC free article] [PubMed] [Google Scholar]
- 21.Messaoudi C, Boudier T, Sanchez Sorzano CO, et al. TomoJ: tomography software for three-dimensional reconstruction in transmission electron microscopy. BMC Bioinformatics. 2007;8:288. [DOI] [PMC free article] [PubMed] [Google Scholar]
- 22.Thévenaz P, Ruttimann UE, Unser M. A pyramid approach to subpixel registration based on intensity. IEEE Trans Image Process. 1998;7:27–41. [DOI] [PubMed] [Google Scholar]
- 23.Paxinos G, Watson C. The Rat Brain in Stereotaxic Coordinates. 6th ed London, England: Elsevier-Academic Press; 2007. [Google Scholar]
- 24.Bacyinski A, Xu M, Wang W, et al. The paravascular pathway for brain waste clearance: current understanding, significance and controversy. Front Neuroanat. 2017;11:101. [DOI] [PMC free article] [PubMed] [Google Scholar]
- 25.Robert P, Frenzel T, Factor C, et al. Methodological aspects for preclinical evaluation of gadolinium presence in brain tissue: critical appraisal and suggestions for harmonization-A joint initiative. Invest Radiol. 2018;53:499–517. [DOI] [PMC free article] [PubMed] [Google Scholar]
- 26.Thakral C, Abraham JL. Gadolinium-induced nephrogenic systemic fibrosis is associated with insoluble Gd deposits in tissues: in vivo transmetallation confirmed by microanalysis. J Cutan Pathol. 2009;36:1244–1254. [DOI] [PubMed] [Google Scholar]
- 27.Idée JM, Port M, Robic C, et al. Role of thermodynamic and kinetic parameters in gadolinium chelate stability. J Magn Reson Imaging. 2009;30:1249–1258. [DOI] [PubMed] [Google Scholar]
- 28.Da Cunha MM, Trepout S, Messaoudi C, et al. Overview of chemical imaging methods to address biological questions. Micron. 2016;84:23–36. [DOI] [PubMed] [Google Scholar]
- 29.Haylor J, Schroeder J, Wagner B, et al. Skin gadolinium following use of MR contrast agents in a rat model of nephrogenic systemic fibrosis. Radiology. 2012;263:107–116. [DOI] [PubMed] [Google Scholar]
- 30.Li R, Ji Z, Chang CH, et al. Surface interactions with compartmentalized cellular phosphates explain rare earth oxide nanoparticle hazard and provide opportunities for safer design. ACS Nano. 2014;8:1771–1783. [DOI] [PMC free article] [PubMed] [Google Scholar]
- 31.Gilissen EP, Staneva-Dobrovski L. Distinct types of lipofuscin pigment in the hippocampus and cerebellum of aged cheirogaleid primates. Anat Rec (Hoboken). 2013;296:1895–1906. [DOI] [PubMed] [Google Scholar]
- 32.Quintana C, Wu TD, Delatour B, et al. Morphological and chemical studies of pathological human and mice brain at the subcellular level: correlation between light, electron, and nanosims microscopies. Microsc Res Tech. 2007;70:281–295. [DOI] [PubMed] [Google Scholar]
- 33.Heinsen H. Lipofuscin in the cerebellar cortex of albino rats: an electron microscopic study. Anat Embryol (Berl). 1979;155:333–345. [DOI] [PubMed] [Google Scholar]
- 34.Fedorow H, Tribl F, Halliday G, et al. Neuromelanin in human dopamine neurons: comparison with peripheral melanins and relevance to Parkinson's disease. Prog Neurobiol. 2005;75:109–124. [DOI] [PubMed] [Google Scholar]
- 35.Höhn A, Grune T. Lipofuscin: formation, effects and role of macroautophagy. Redox Biol. 2013;1:140–144. [DOI] [PMC free article] [PubMed] [Google Scholar]
- 36.Gilissen EP, Leroy K, Yilmaz Z, et al. A neuronal aging pattern unique to humans and common chimpanzees. Brain Struct Funct. 2016;221:647–664. [DOI] [PubMed] [Google Scholar]
- 37.Jung T, Bader N, Grune T. Lipofuscin: formation, distribution, and metabolic consequences. Ann N Y Acad Sci. 2007;1119:97–111. [DOI] [PubMed] [Google Scholar]
- 38.Jessen NA, Munk AS, Lundgaard I, et al. The glymphatic system. A beginner’s guide. Neurochem Res. 2015;40:2583–2599. [DOI] [PMC free article] [PubMed] [Google Scholar]
- 39.Iliff JJ, Lee H, Yu M, et al. Brain-wide pathway for waste clearance captured by contrast-enhanced MRI. J Clin Invest. 2013;123:1299–1309. [DOI] [PMC free article] [PubMed] [Google Scholar]
- 40.Eide PK, Ringstad G. MRI with intrathecal MRI gadolinium contrast medium administration: a possible method to assess glymphatic function in human brain. Acta Radiol Open. 2015;4:2058460115609635. [DOI] [PMC free article] [PubMed] [Google Scholar]
- 41.Jost G, Frenzel T, Lohrke J, et al. Penetration and distribution of gadolinium-based contrast agents into the cerebrospinal fluid in healthy rats: a potential pathway of entry into the brain tissue. Eur Radiol. 2017;27:2877–2885. [DOI] [PMC free article] [PubMed] [Google Scholar]
- 42.Lee H, Mortensen K, Sanggaard S, et al. Quantitative Gd-DOTA uptake from cerebrospinal fluid into rat brain using 3D VFA-SPGR at 9.4 T. Magn Reson Med. 2018;79:1568–1578. [DOI] [PMC free article] [PubMed] [Google Scholar]
- 43.Taoka T, Jost G, Frenzel T, et al. Impact of the glymphatic system on the kinetic and distribution of gadodiamide in the rat brain: observations by dynamic MRI and effect of circadian rhythm on tissue gadolinium concentrations. Invest Radiol. 2018. [Epub ahead of print]. [DOI] [PubMed] [Google Scholar]
- 44.Joutel A, Haddad I, Ratelade J, et al. Perturbations of the cerebrovascular matrisome: A convergent mechanism in small vessel disease of the brain? J Cereb Blood Flow Metab. 2016;36:143–157. [DOI] [PMC free article] [PubMed] [Google Scholar]
- 45.Porta EA. Pigments in aging: an overview. Ann N Y Acad Sci. 2002;959:57–65. [DOI] [PubMed] [Google Scholar]
- 46.Lorusso V, Arbughi T, Tirone P, et al. Pharmacokinetics and tissue distribution in animals of gadobenate ion, the magnetic resonance imaging contrast enhancing component of gadobenate dimeglumine 0.5 M solution for injection (MultiHance). J Comput Assist Tomogr. 1999;23(Suppl 1):S181–S194. [DOI] [PubMed] [Google Scholar]
- 47.Cao Y, Zhang Y, Shih G, et al. Effect of renal function on gadolinium-related signal increases on unenhanced T1-weighted brain magnetic resonance imaging. Invest Radiol. 2016;51:677–682. [DOI] [PubMed] [Google Scholar]


